PI(3,5)P2 biosynthesis regulates oligodendrocyte differentiation by intrinsic and extrinsic mechanisms
- University of Michigan School of Medicine, United States
- University of South Carolina, United States
- INSPE-Institute for Experimental Neurology, San Raffaele Scientific Institute, Italy
- David Geffen School of Medicine at UCLA, United States
- University of Pennsylvania School of Medicine, United States
- University of Rochester Medical Center, United States
Figures
Figure 1 with 2 supplements

Conditional ablation of Fig4 in neurons or OLs leads to CNS hypomyelination.
(A-D) Coronal sections of juvenile (P21-30) mouse forebrain stained with FluoroMyelin Green. (A) Fig4 control mice (harboring at least one Fig4 WT allele), (B) Fig4 germline null mice (Fig4-/-), (C) Fig4-/flox,SynCre mice and (D) Fig4-flox,Olig2Cre mice. Thinning of the corpus callosum and internal capsule (white arrowheads) is observed in Fig4-/-, Fig4-/flox,SynCre, and Fig4-flox,Olig2Cre mice. (A’-D’) Higher magnification images of the corpus callosum. Scale bar (A-D), 1 mm and (A’-D’), 400 µm. (E) Representative Western blots of P21 brain membranes prepared from Fig4+/+ (WT), Fig4-/-, Fig4-/flox,SynCre and Fig4-/flox,Olig2Cre mice probed with antibodies specific for the myelin proteins MAG, CNPase, PLP, and MBP. To control for protein loading, membranes were probed for the neuronal marker class III β-tubulin (βIII Tub). (F-I) Quantification of Western blot signals for MAG, MBP, CNPase, and PLP in Fig4+/+ (black bars), Fig4-/- (purple bars), Fig4-/flox,SynCre (light blue bars), and Fig4-flox,Olig2Cre (red bars) brain membranes. Quantification of myelin protein signals is normalized to βIII Tub. Relative protein intensities compared to WT brain are shown as mean value ± SEM. For each of the four genotypes, three independent membrane preparations were carried out. One-way ANOVA with multiple comparisons, Dunnett posthoc test; **p<0.01, ***p<0.001 and ****p<0.0001. An independent strategy for OL-specific Fig4 deletion results in a similar phenotype as shown in Figure 1—figure supplement 1. Histochemical staining of brain, spinal cord and dorsal root ganglion tissue sections of Fig4 conditional knock-out mice, as well as Kaplan-Meier plots for Fig4-/flox,SynCre and Fig4-flox,Olig2Cre mice are shown in Figure 1—figure supplement 2.
Figure 1—figure supplement 1
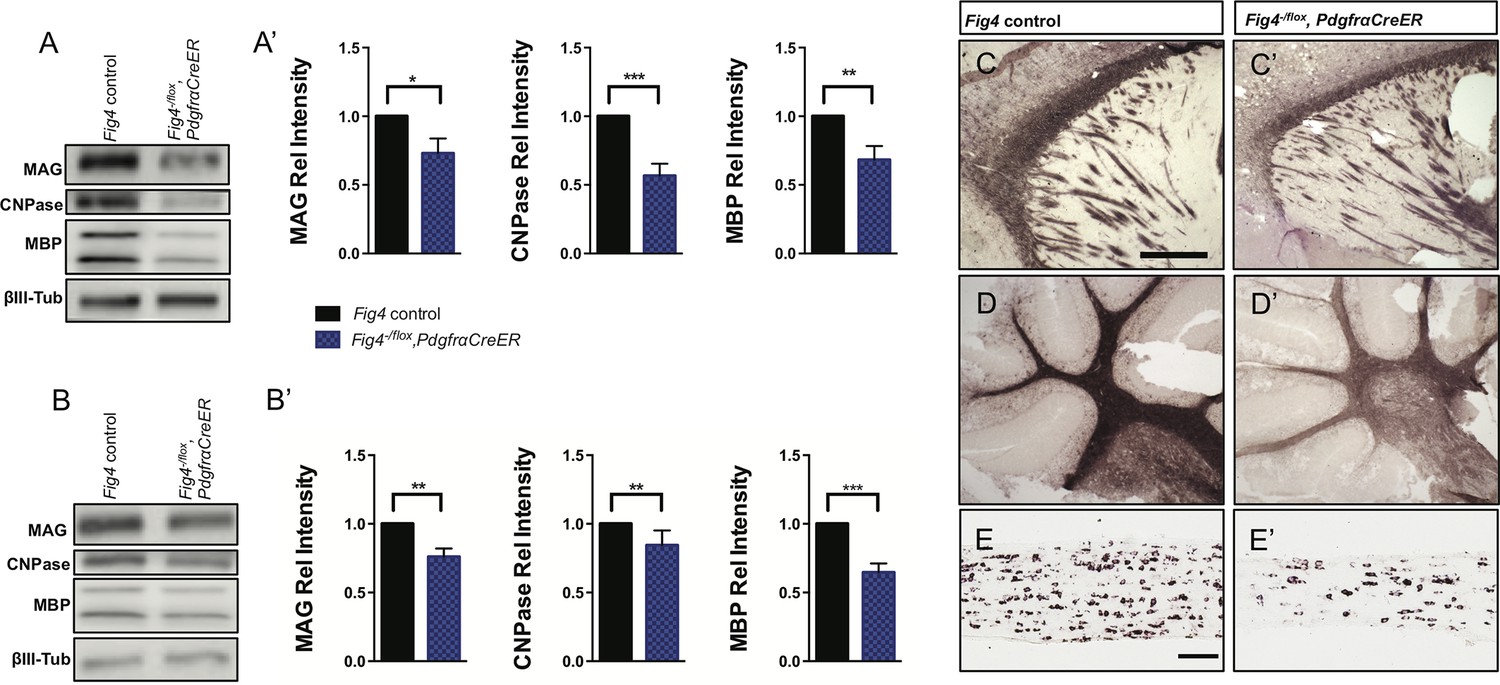
CNS hypomyelination in Fig4-/flox,PdgfrαCreER mice.
Representative Western blots of (A) P21 forebrain and (B) P21 hindbrain (cerebellum/brainstem) lysates prepared from Fig4 control littermate mice (Fig4+/flox,PdgfrαCre-ER) and Fig4-/flox,PdgfrαCreER mutant mice, probed with antibodies specific for the myelin proteins MAG, CNPase and MBP. To control for protein loading, blots were probed for the neuronal marker class III β-tubulin (βIII Tub). (A’ and B’) Quantification of Western blot signals for MAG, CNPase and MBP in (A’) forebrain and (B’) cerebellum/brainstem lysates. Relative protein intensities compared to control tissue are shown as mean value ± SEM. Six pairs of control littermate and Fig4-/flox,PdgfrαCreER mice were analyzed and quantified. Unpaired Student’s t-test, *p=0.0323 (A', MAG), ***p=0.0006 (A', CNPase), **p=0.0096 (A’, MBP), **p=0.027 (B', MAG), **p=0.038 (B’, CNPase), ***p=0.0004 (B’, MBP). (C and C’) Sagittal sections of P21 forebrain of control littermate (Fig4+/flox,PdgfrαCreER) and Fig4-/flox,PdgfrαCreER mutant mice probed for Mbp mRNA expression. (D and D’) Sagittal sections of P21 cerebellum of control littermate (Fig4+/flox,PdgfrαCreER) and Fig4-/flox,PdgfrαCreER mutant mice probed for Mbp mRNA expression. (E and E’) Longitudinal optic nerve sections of P21 littermate control and Fig4-/flox,PdgfraCreER mice probed for Plp1 mRNA expression. Scale bar (C-D’), 500 μm and (E and E’), 200 μm.
Figure 1—figure supplement 2
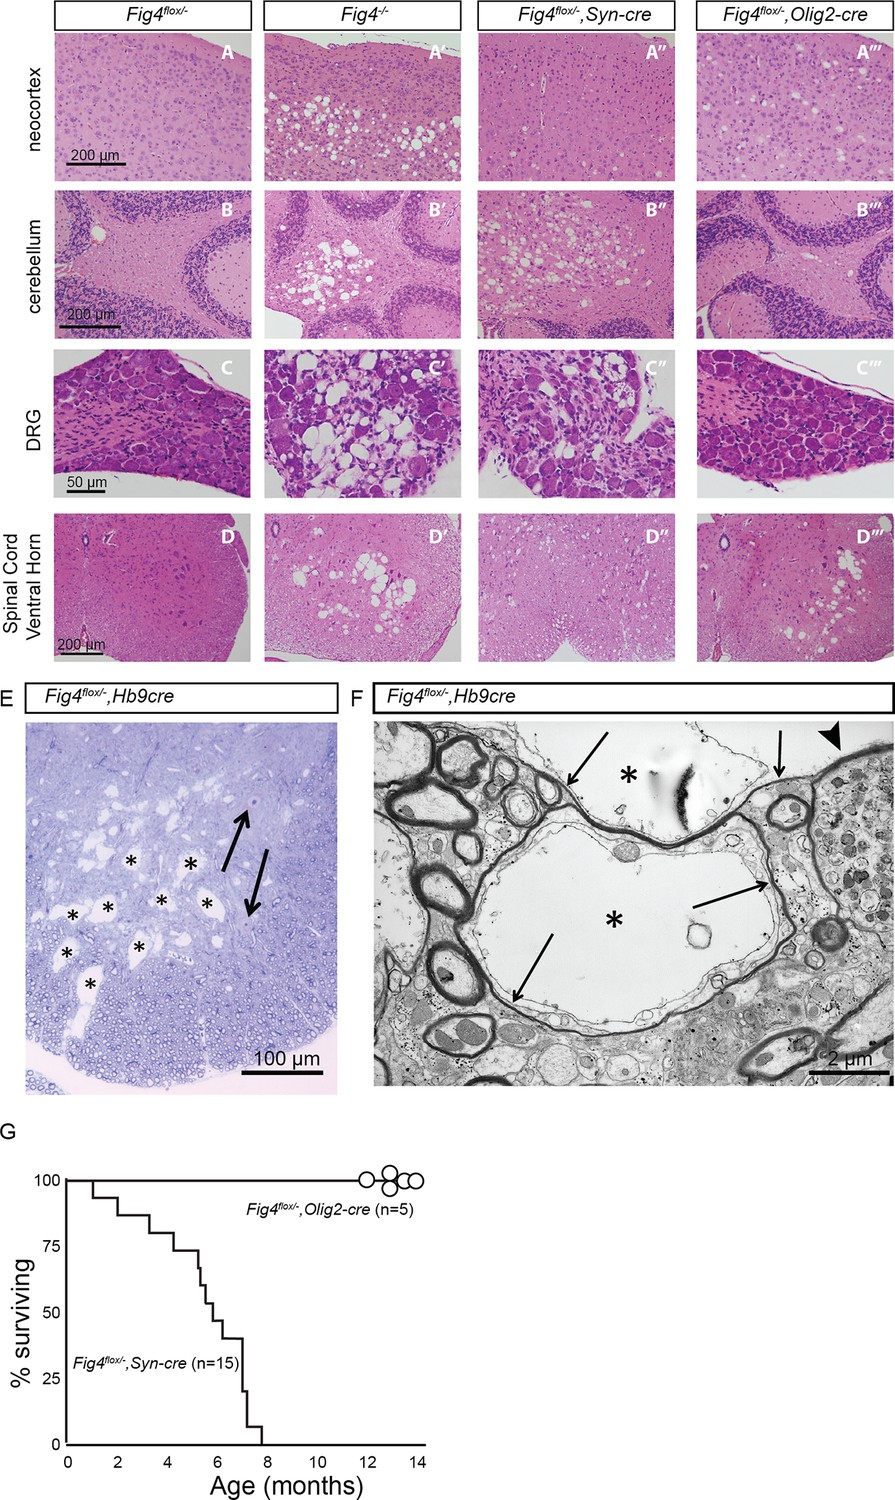
Loss of Fig4 in the OL-lineage or neurons differentially affects spongiform degeneration and lifespan.
(A-D’’’) Hematoxylin/eosin stained tissue sections of P30 mouse neocortex, cerebellum, dorsal root ganglion (DRG) and spinal cord ventral horn. Tissue sections of mice with the following genotypes are shown: (A, B, C, D) control mice (Fig4flox/-), (A’, B’, C’, D’) Fig4 germline null mice (Fig4-/-), (A”, B”, C”, D”)Fig4-/flox,SynCre conditional mutants and (A’’’, B’’’, C’’’, D’’’) Fig4-/flox,Olig2Cre conditional mutants. Most notable are the large vacuolar (sponge-like) structures in different regions of the Fig4-/- nervous system, including (A’) deep layers of the neocortex, (B’) deep cerebellar nuclei, (C’) DRGs and (D’) ventral horn of the spinal cord. (A”-D”) A milder but similar phenotype is observed in Fig4-/flox,SynCre mice. (A’’’) In the Fig4-/flox,Olig2Cre neocortex small vacuoles are observed in all layers of the neocortex. (B’’’ and C’’’) In Fig4-/flox,Olig2Cre mice deep cerebellar nuclei and DRGs look largely normal. (D’’’) The large vacuoles in the spinal cord ventral horn of Fig4-/flox,Olig2Cre mice likely represent motoneurons, as the Olig2 promoter is known to drive cre expression in motoneurons and the OL-linage. (E) The Hb9-cre driver line was used for conditional deletion of Fig4 specifically in motoneurons. Toluidine blue stained section of Fig4-/flox,Hb9Cre ventral horn shows multiple large vacuolar structures within the gray and white matter of the spinal cord. Examples of vacuolar structures are labeled with asterisks. Apparently normal motoneuron profiles are indicated by arrows. (F) Electron micrograph of Fig4-/flox,Hb9Cre ventral horn with large vacuolar structures labeled by asterisks. Vacuolar structures are mostly devoid of electron-dense material and found in axons surrounded by thin myelin sheaths (arrows). Vacuoles cause peripheral displacement of axoplasm and mitochondria. The arrowhead points to a dystrophic axon with accumulation of numerous smaller vesicles. (G) Viability of Fig4 conditional mutants. Kaplan-Meier plot shows an average life-span of 6 months for Fig4-/flox,SynCre mice (n = 15), while Fig4-/flox,Olig2Cre mice (n = 5) are viable for 12–14 months (the oldest mice currently in our colony).
Figure 2

Conditional ablation of Fig4 in neurons or in OLs leads to severe dysmyelination of the optic nerve.
(A-A’’) Sagittal sections of juvenile (P21) mouse retina embedded in epoxy resin and stained with toluidine blue. (A) Fig4 control mice, harboring at least one Fig4 WT allele, (A’) Fig4-/flox,SynCre mice and (A’’) Fig4-/flox,Olig2Cre mice. Scale bar, 100 µm. (B-B’’) Representative TEM images of optic nerve cross sections of P21 (B) Fig4 control, (B’) Fig4-/flox,SynCre and (B’’) Fig4-/flox,Olig2Cre mice. (C-C’’) Representative TEM images of optic nerve cross sections of adult (P60-75) mice. (C) Fig4 control, (C’) Fig4-/flox,SynCre and (C’’) Fig4-/flox,Olig2Cre mice. Black arrows in C’ indicate the presence of dystrophic axons. Scale bar (B-C’’) = 1 μm. (D) Quantification of percentage of myelinated fibers in the optic nerve at P21 and P60-75. At P21, Fig4 controls (n = 3 mice, 3 nerves); Fig4-/flox,SynCre (n = 2 mice, 3 nerves) and Fig4-/flox,Olig2Cre (n = 3 mice, 3 nerves). (E) Quantification of myelinated fiber g-ratios in the optic nerve at P21, n = 3 animals, 3 nerves for all groups. (F) Quantification of myelinated fibers in the optic nerve at P60-P75. Fig4 control (n = 4 mice, 4 nerves), Fig4-/flox,SynCre (n = 4 mice, 4 nerves); Fig4-/flox,Olig2Cre (n = 3 mice, 4 nerves). Results are shown as mean value ± SEM, one-way ANOVA with multiple comparisons, Tukey posthoc test; n.s. p>0.05, *p=0.0211, **p=0.0055, ****p<0.0001.
Figure 3
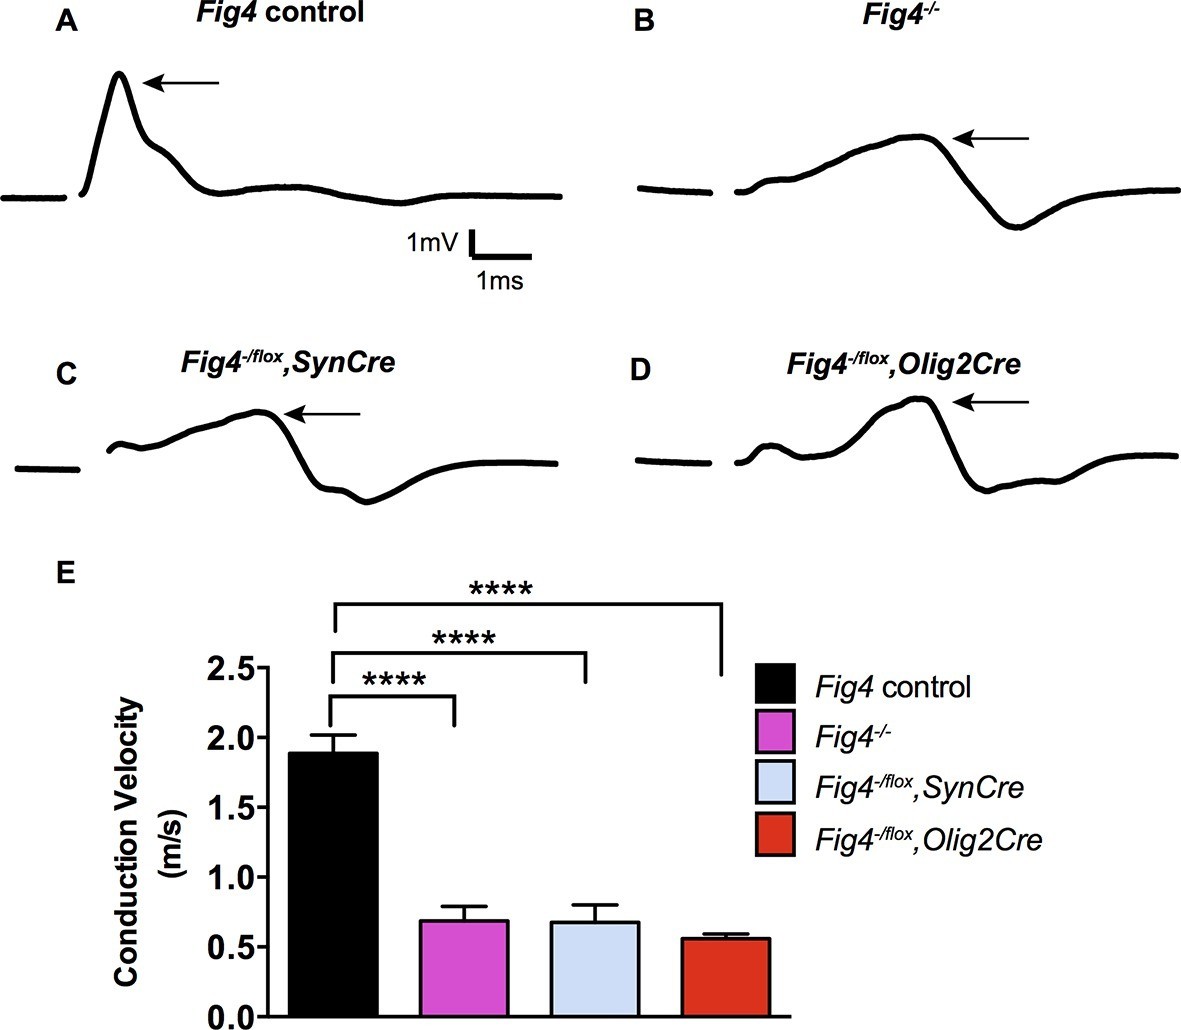
Conditional ablation of Fig4 in neurons or OLs leads to impaired conduction of electrical impulses in the optic nerve.
Compound action potential (CAP) recordings from acutely isolated optic nerves of P21 mice. (A) Representative CAP traces recorded from Fig4 control mice, harboring at least one Fig4 WT allele (n = 14 nerves), (B) Fig4-/- mice (n = 5 nerves), (C) Fig4-/flox,SynCre mice (n = 11 nerves) and (D) Fig4-/flox,Olig2Cre mice (n = 9 nerves). For each graph, the arrow indicates the largest amplitude peak, as identified by Gaussian fit. (E) Quantification of average conduction velocity of largest amplitude peaks identified in A-D. Results are shown as mean value ± SEM, one-way ANOVA with multiple comparisons, Dunnett posthoc, ****p<0.0001.
Figure 4
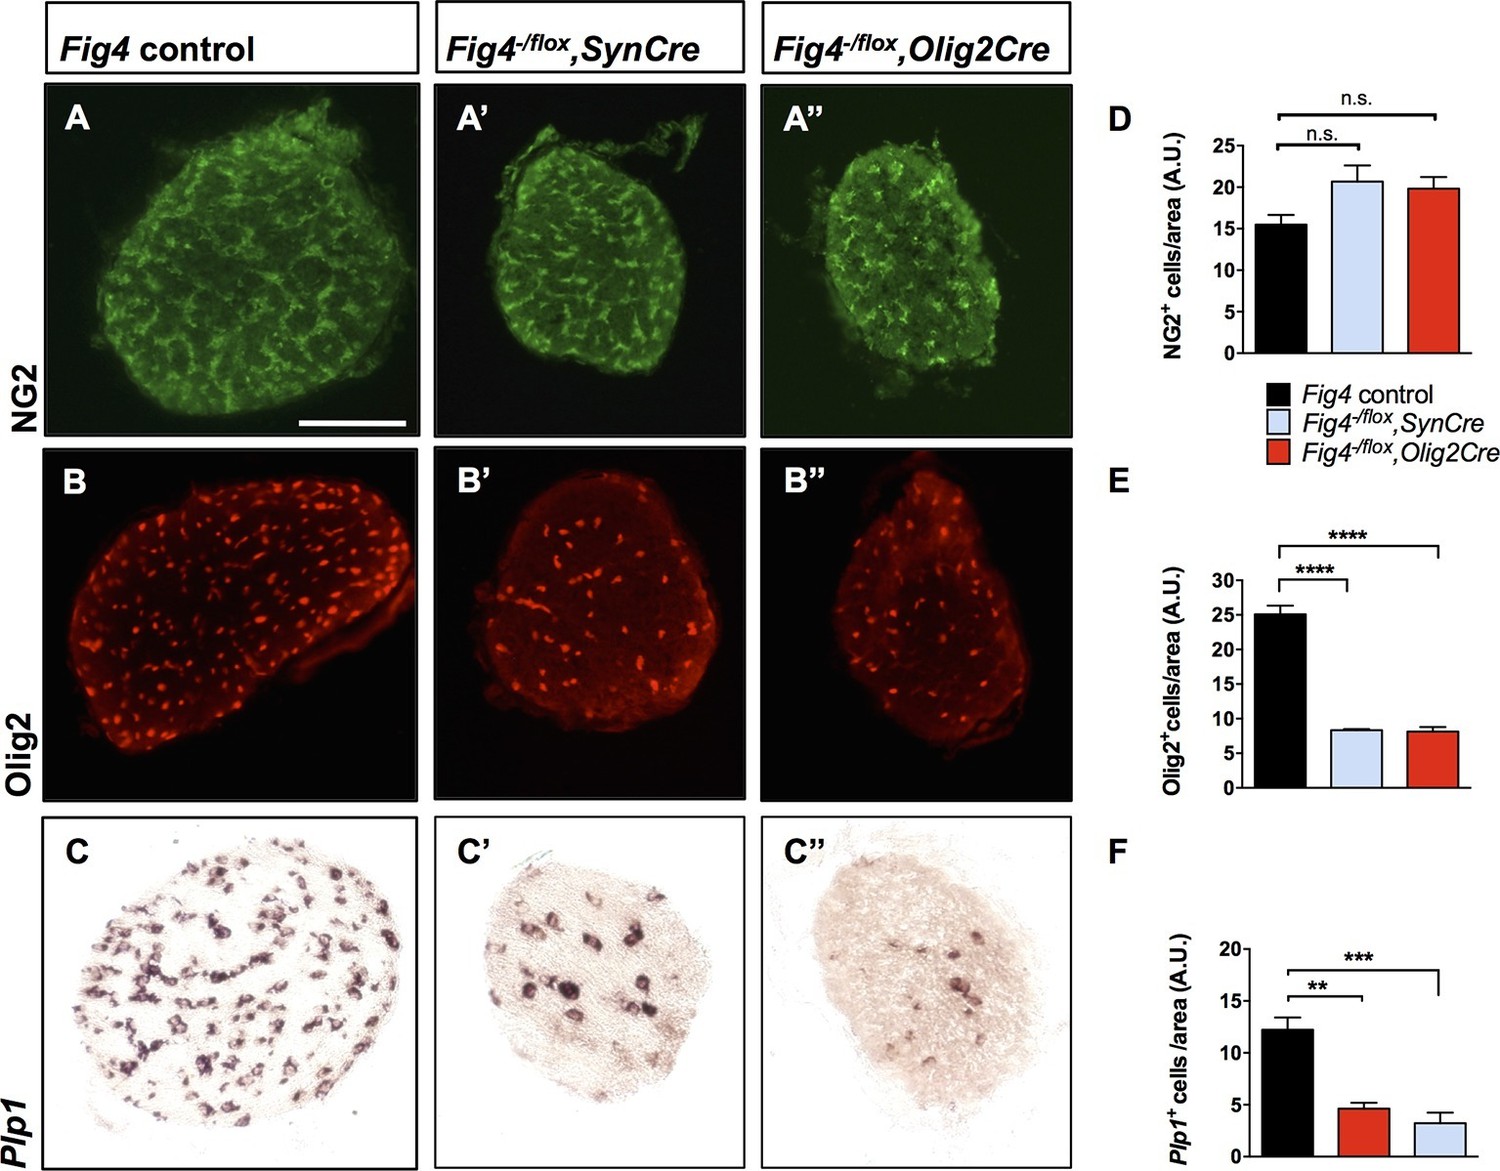
Conditional ablation of Fig4 in neurons or OLs results in a decrease of mature OLs.
(A, B, C) Optic nerve cross sections from P21 Fig4 control mice, harboring at least one Fig4 WT allele, (A’, B’, C’) Fig4-/flox,SynCre mice and (A’’, B’’, C’’) Fig4-/flox,Olig2Cre mice were stained with anti-NG2, anti-Olig2 or probed for Plp1 mRNA expression. Scale bar = 100 µm. (D-F) Quantification of labeled cells in optic nerve cross sections normalized to area in arbitrary units (A.U.). (D) The density of NG2+ cells in Fig4 control (n = 4 mice), Fig4-/flox,SynCre (n = 3 mice) and Fig4-/flox,Olig2Cre (n = 3 mice) optic nerves is not significantly (n.s.) different. (E) Quantification of the density of Olig2+ cells in Fig4 control (n = 6 mice), Fig4-/flox,SynCre (n = 3 mice) and Fig4-/flox,Olig2Cre (n = 4 mice) optic nerves. (F) Quantification of the density of Plp1+ cells in Fig4 control (n = 8 mice), Fig4-/flox,SynCre (n = 4 mice) and Fig4-/flox,Olig2Cre (n = 4 mice) optic nerves. Results are shown as mean value ± SEM, one-way ANOVA with multiple comparisons, Dunnett’s posthoc test. **p=0.001, ***p=0.0002 and ****p<0.0001.
Figure 5 with 2 supplements
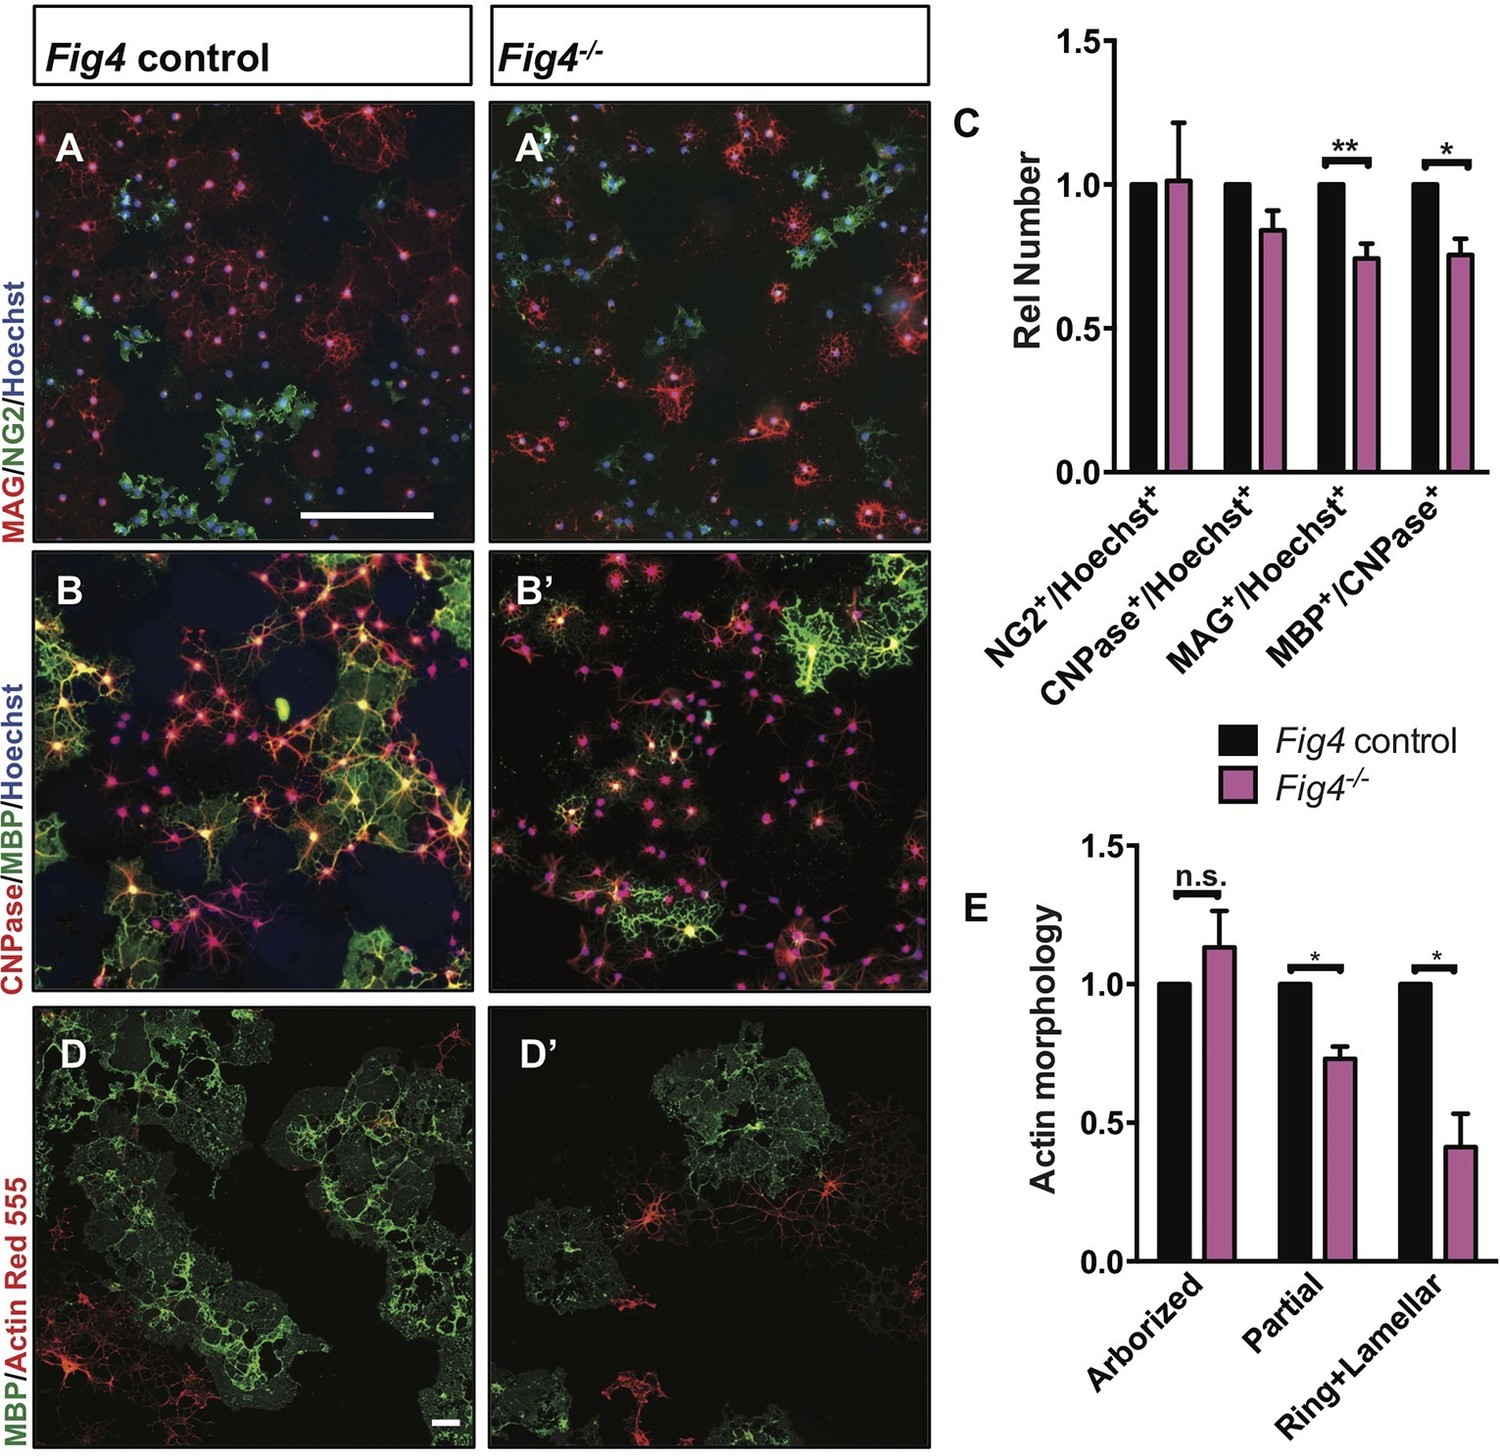
Fig4-deficient OLs show impaired differentiation and membrane expansion in vitro.
Representative images of Fig4 control (Fig4+/+ or Fig4+/-) and Fig4-/- primary OLs after 4 days in differentiation medium, fixed and stained for the OL-lineage markers (A and A’) NG2 and MAG; (B and B’) CNPase and MBP. Scale bar in A-B’, 200 µm. (C) Quantification of NG2, CNPase, MAG, and MBP/CNPase labeled cells in Fig4 control (n = 3) and Fig4-/-(n = 3) cultures normalized to Hoechst 33342 dye labeled cells. The ratio of immunolabeled cells over Hoechst+ cells in Fig4 control cultures was set at 1. Results are shown as mean value ± SEM, multiple t-test analysis with Holm-Sidak method. **p=0.0075 (MAG), *p=0.012 (MBP). (D and D’) Confocal images of MBP+ and Actin Red 555+ OLs in Fig4 control and Fig4-/- cultures. Nuclei were labeled with TO-PRO-3, scale bar = 20 µm. (E) Quantification of the fraction of “arborized” (actin rich, no MBP), “partial” (partial actin disassembly, onset of MBP expansion), and “ring + lamellar” (full MBP expansion, actin disassembly) in Fig4 control cultures (n = 4) and Fig4-/- (n = 4) cultures. Results are shown as mean value ± SEM, multiple t-test analysis with Holm-Sidak method. *p=0.0008 (“partial”), *p=0.009 (“ring + lamellar”). The effects of Fig4 deletion on OPC proliferation and OL survival are shown in Figure 5—figure supplement 1. Quantitative Western blot analysis of myelin proteins in primary OL lysates is shown in Figure 5—figure supplement 2.
Figure 5—figure supplement 1
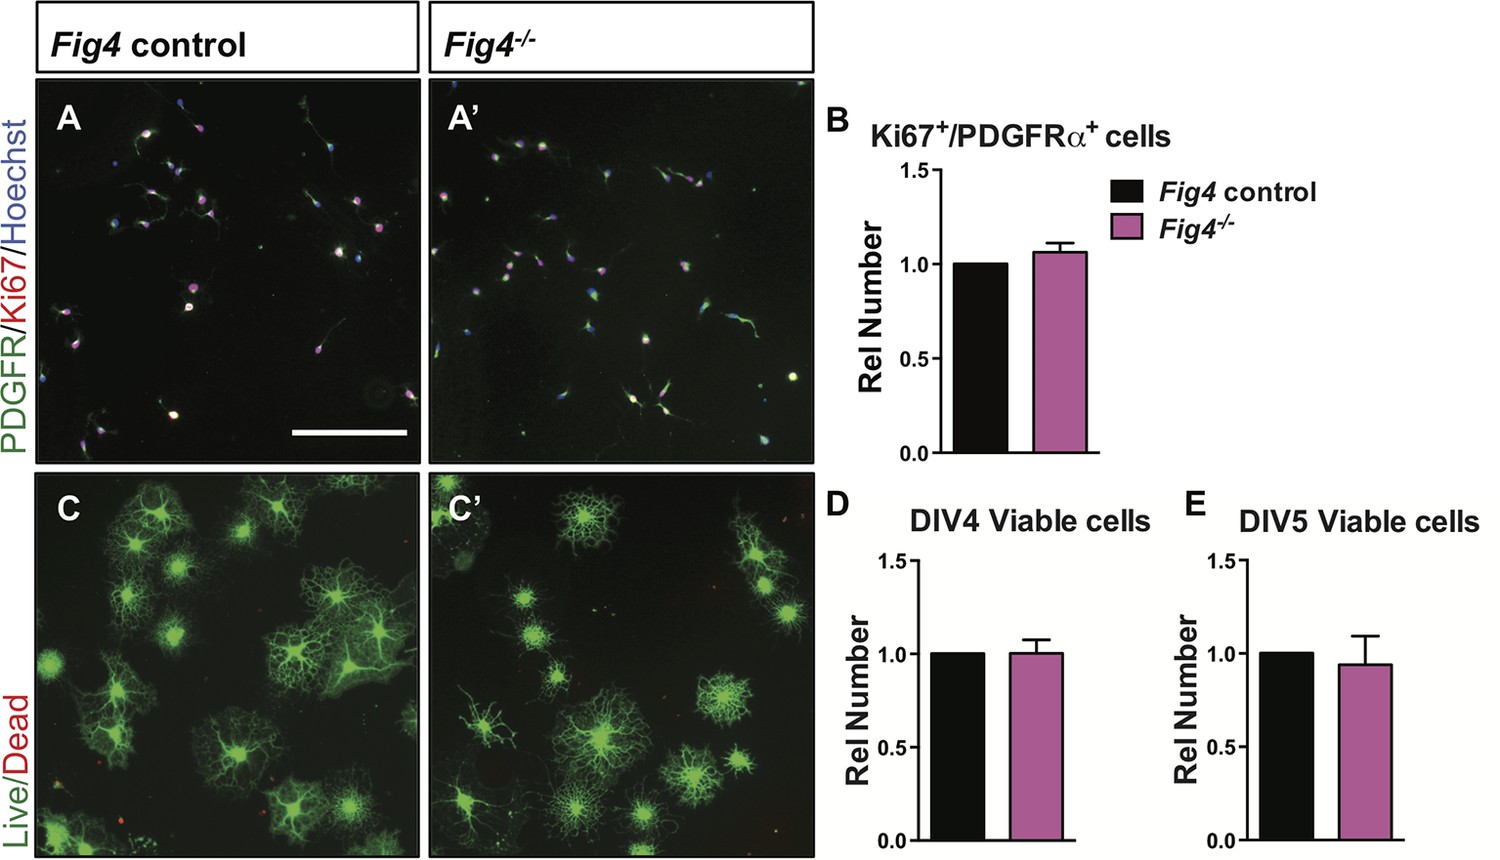
Loss of Fig4-/- in primary OLs does not affect cell proliferation or cell death.
(A-A’) Representative images of control (Fig4+/+ or Fig4+/-) and Fig4-/- OPCs cultured for 2 days under proliferative conditions, fixed and stained with anti-PDGFRα (green) and Ki67 (red). Hoechst 33342 dye was included for nuclear staining of all cells. Scale bar = 200 µm. (B) Quantification of PDGFRα and Ki67 double-labeled cells. The number of double stained cells in Fig4 control cultures was set at 1 and is comparable to Fig4-/- cultures (n = 4 experiments per genotype). Results are shown as mean value ± SEM, unpaired Student’s t-test. (C-C’) Representative images of OLs after 4 days in T3 containing differentiation medium. Cultures were fixed and stained with calcein-AM (green, living cells) and ethidium homodimer (red, dead cells). Scale bar = 200 µm. Quantification of live cells after 4 days (D) and 5 days (E) in differentiation medium revealed no differences among the two genotypes. Fig4control cultures (n = 4) and Fig4-/- cultures (n = 4). Results are shown as mean value ± SEM, unpaired Students t-test.
Figure 5—figure supplement 2
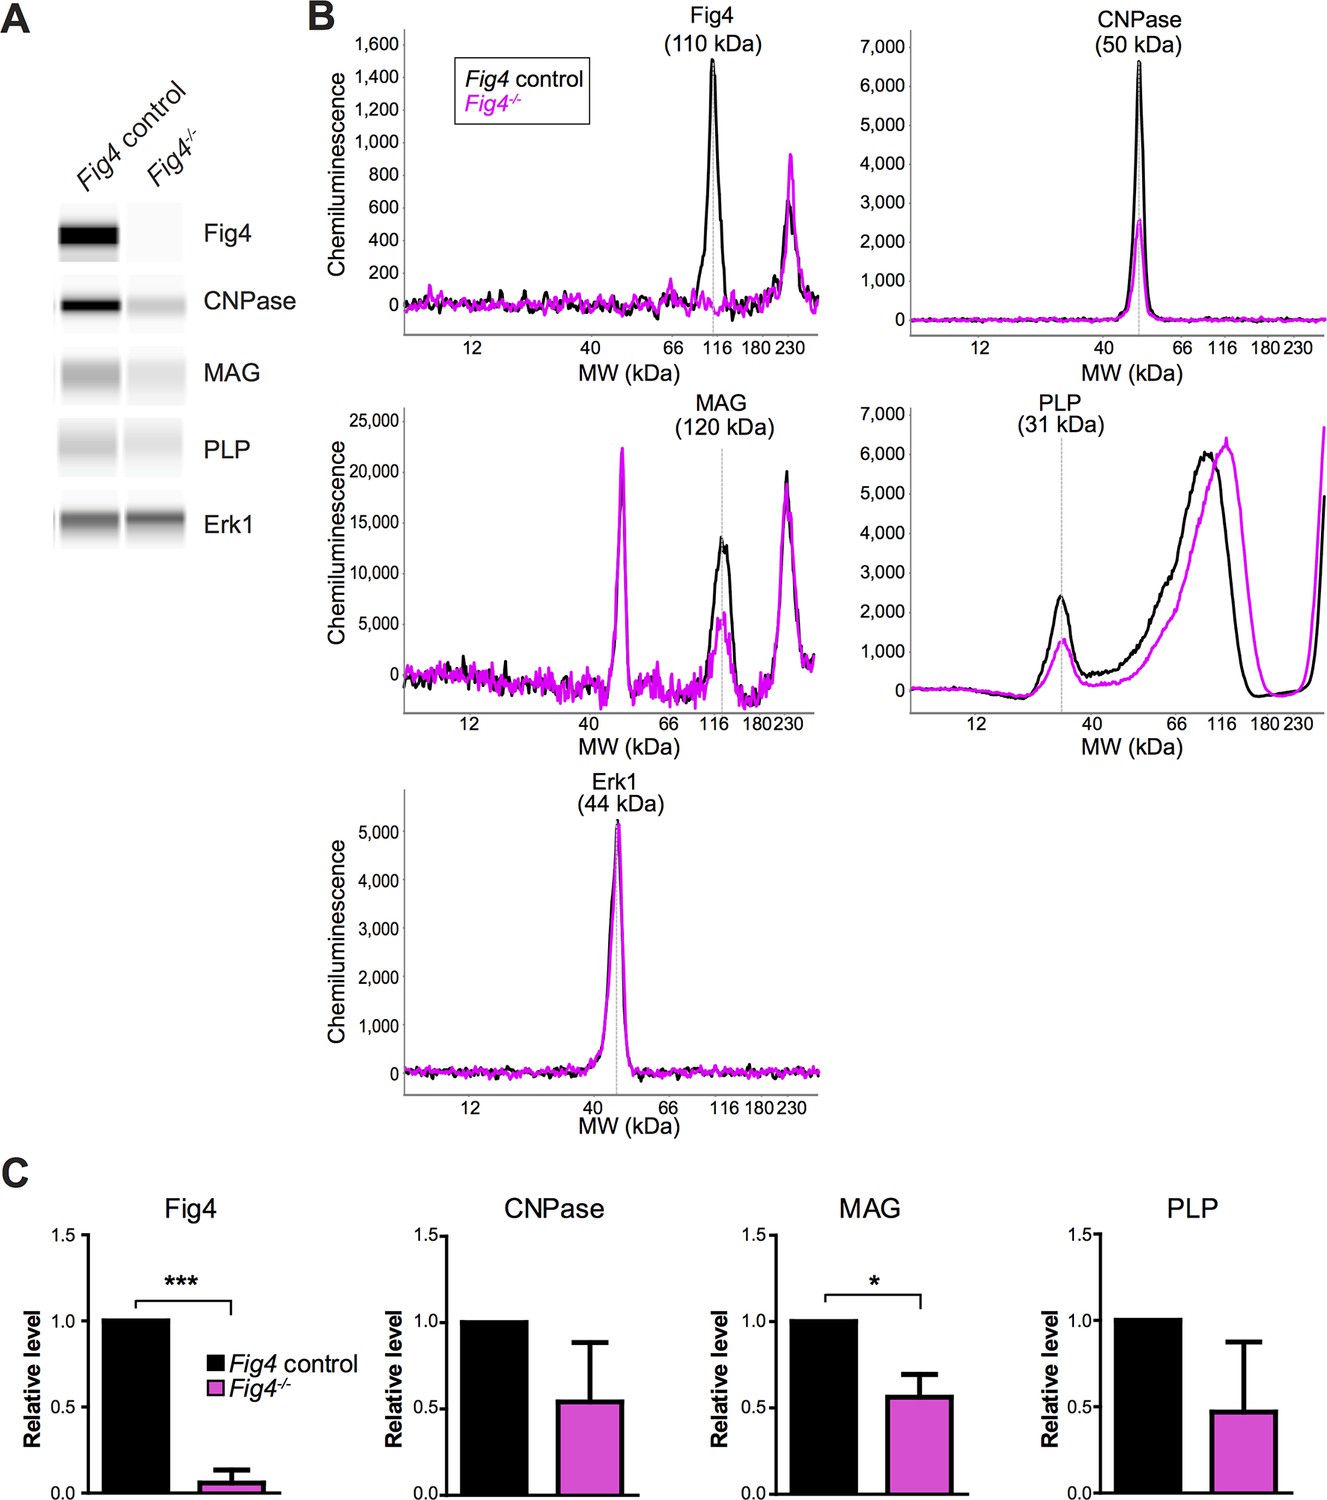
Capillary Western analysis of primary OL lysates.
(A) Representative capillary immunoassay data of Fig4 control and Fig4-/- OPC/OLs are shown in Simple Western lane view. (B) Representative chemiluminescence signal intensity graphs and protein molecular weight of individual proteins. Fig4 control and Fig4-/- OPC/OLs lysates are shown as black and pink lines respectively. Specific peaks corresponding to each protein target are marked. (C) Quantification of protein of Erk1-normalized peak area of each protein target. Three independent experiments were used for quantification. Results are shown as mean value ± SD. *p<0.05; ***p<0.005.
Figure 6 with 1 supplement
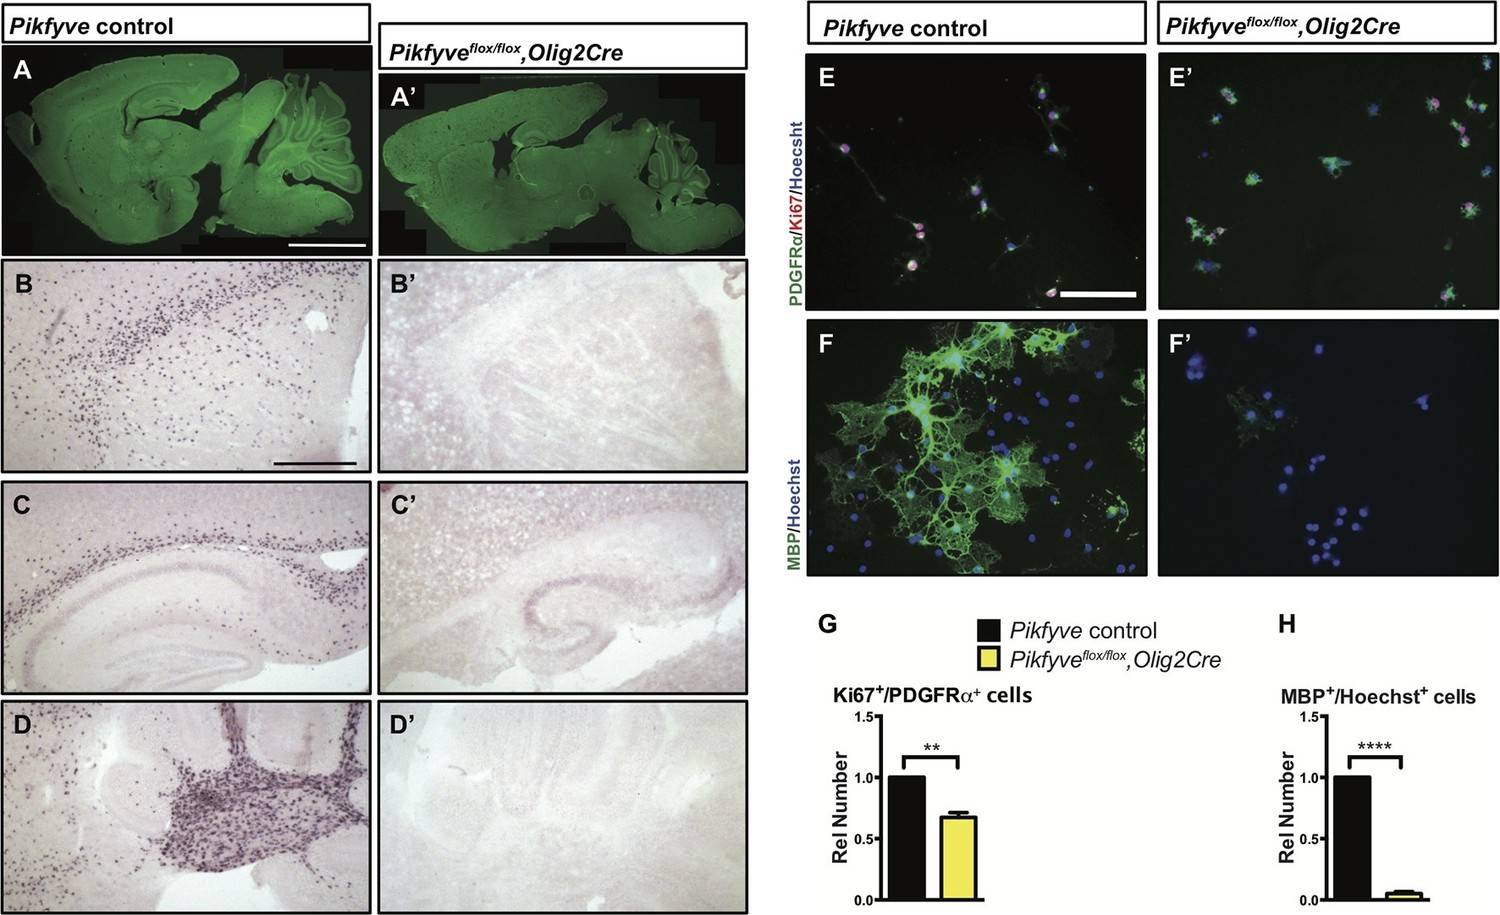
Conditional deletion of Pikfyve in OLs results in profound CNS hypomyelination.
(A-D’) Sagittal sections of P13 mouse brains. (A) Pikfyve control (Pikfyveflox/+ or Pikfyveflox/flox; n = 3) mice and (A’) Pikfyve conditional null (Pikfyveflox/flox,Olig2Cre; n = 3) mice stained with FluoroMyelin Green. In Pikfyveflox/flox,Olig2Cre, no myelin staining was observed, Scale bar, 1 mm. (B-D’) in situ hybridization for Plp1 shows virtual absence of mature OLs in P13 Pikfyveflox/flox,Olig2Cre brain tissue, including (B and B’) internal capsule and corpus callosum, (C’ and C’) hippocampus and corpus callosum and (D and D’) cerebellar white matter. Scale bar (B-D’) = 500 µm. (E-H) Cultures of primary OPCs/OLs isolated from Pikfyve control and Pikfyveflox/flox,Olig2cre mouse pups. (E, E’) At DIV2, cells were fixed and stained with anti-PDGFRα, anti-Ki67and Hoechst 33342 dye. (F, F’) After 3 days in differentiation medium, supplemented with T3, cells were fixed and stained with anti-MBP and Hoechst 33342. (G) Quantification of proliferating OPCs revealed a Pikfyve-dependent reduction in Ki67+/PDGFRα+ double-labeled cells (n = 3 experiments per genotype). (H) Quantification of MBP+ OLs normalized to Hoechst+ cells shows a highly significant decrease in the number of MBP+ OLs in Pikfyveflox/flox,Olig2cre cultures (n = 3 experiments per genotype). Unpaired Student’s t-test; mean value ± SEM. **p=0.011 and ****p<0.0001. Toluidine blue labeling of epoxy resin embedded optics nerves of Pikfyve control and Pikfyveflox/flox,Olig2cre conditional mutant mice is shown in Figure 6—figure supplement 1.
Figure 6—figure supplement 1
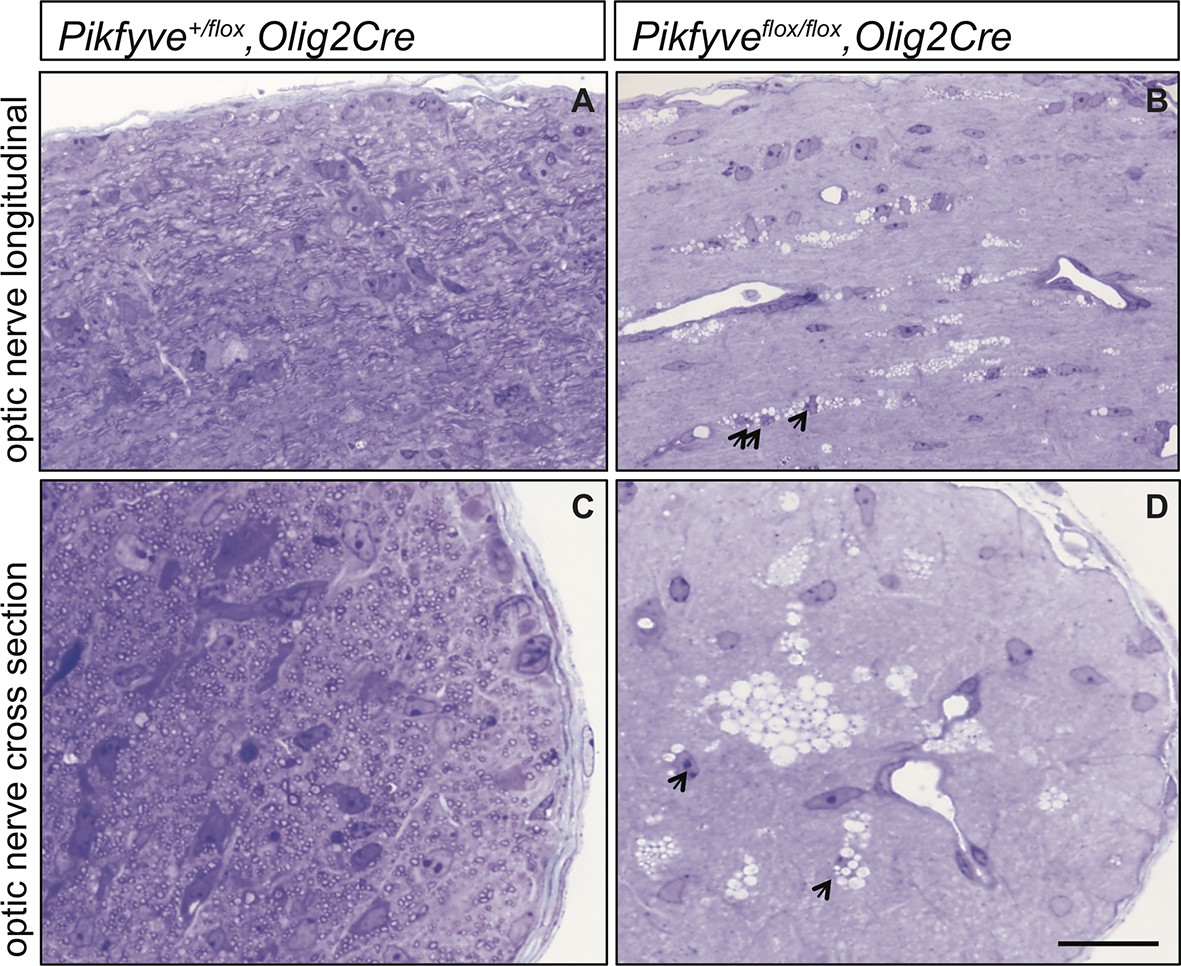
Optic nerve axons are not myelinated in Pikfyveflox/flox,Olig2Cre mice.
Semi-thin sections of P14 optic nerves in (A, B) longitudinal and (C, D) cross sectional view stained with toluidine blue. In control optic nerve (Pikfyveflox/+,Olig2Cre) many myelinated fibers are observed (n =3 pups). In Pikfyveflox/flox,Olig2Cre conditional mutants (n = 3 pups), there is a striking absence of myelinated axons in the optic nerve. Arrows in photomicrographs B and D point to presumptive oligodendrocytes laden with large vacuoles. Scale bar = 15 μm.
Figure 7 with 1 supplement
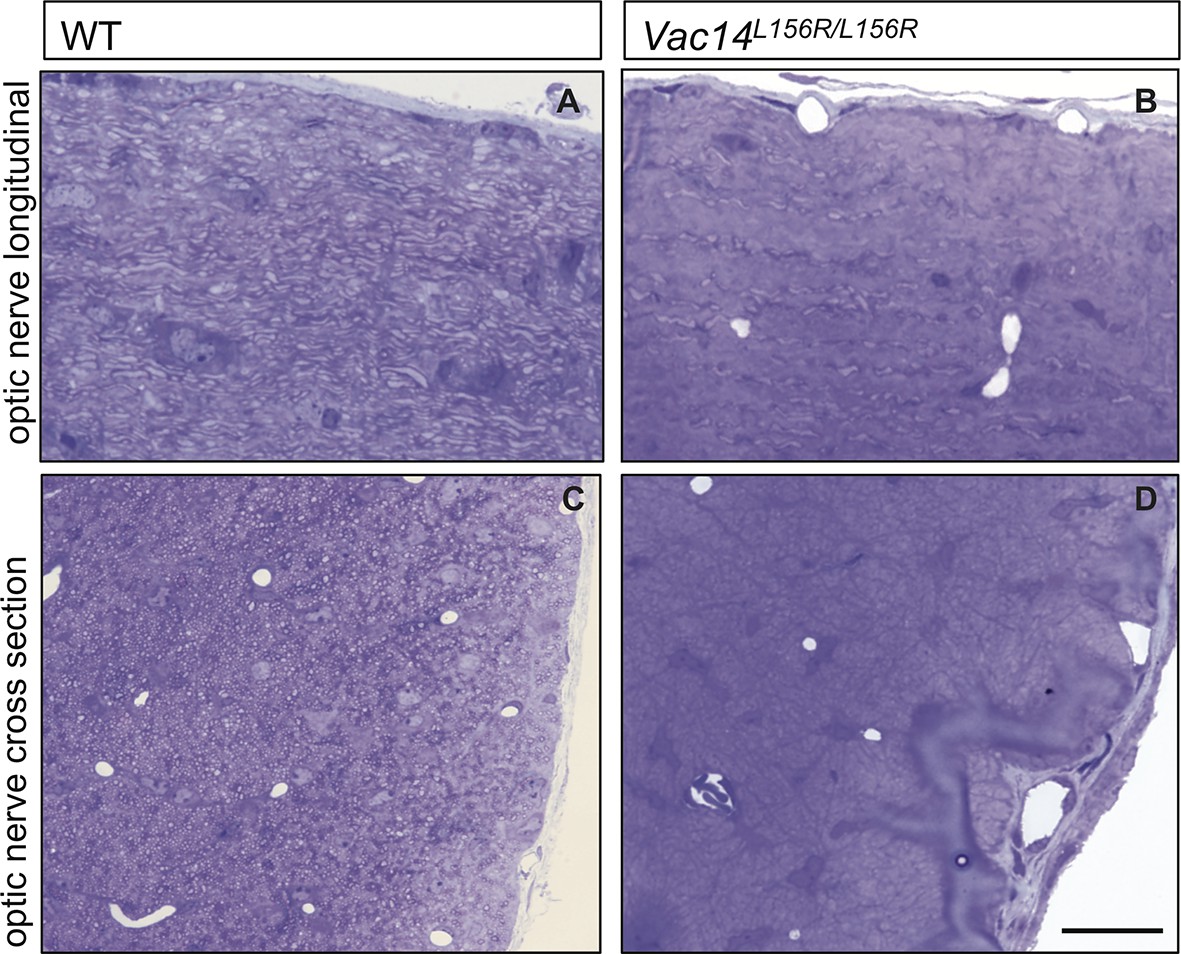
Homozygosity for VAC14L156R leads to CNS hypomyelination and impaired conduction of compound action potentials.
(A) Schematic of the PIKfyve/Vac14/Fig4 enzyme complex and its phosphoinositide products PI(3)P and PI(3,5)P2. The red asterisk in VAC14 indicates the L156R point mutation that perturbs the interaction with PIKfyve, but not with Fig4. (B) Western blot analysis of brain membranes prepared from adult (P90-120) WT and VAC14L156R/VAC14L156R littermate mice revealed a reduction in the myelin markers MAG, CNPase, and MBP. Anti-class III β-tubulin (βIII-Tub), a neuronal marker, is shown as a loading control. (C-E) Quantification of protein bands detected by Western blotting, shows a significant decrease in MAG, CNPase, and MBP in VAC14 mutant brain tissue (n = 3 independent blots per genotype). Unpaired Student’s t-test; mean value ± SEM. ***p<0.001, **p=0.0015 and *p=0.0238. (F and G) Representative CAP traces recorded from acutely isolated optic nerves of WT and VAC14L156T homozygous mice. (H) Quantification of average conduction velocity (CV) of largest amplitude peaks identified in F and G. Results are shown as mean value ± SEM, unpaired Student’s t-test, **p=0.0063. WT n = 6 nerves, 3 mice and for Vac14L156R mutants n = 6 nerves, 3 mice. Toluidine blue staining of epoxy resin embedded optic nerve sections from VAC14L156R/VAC14L156R mice is shown in Figure 7—figure supplement 1.
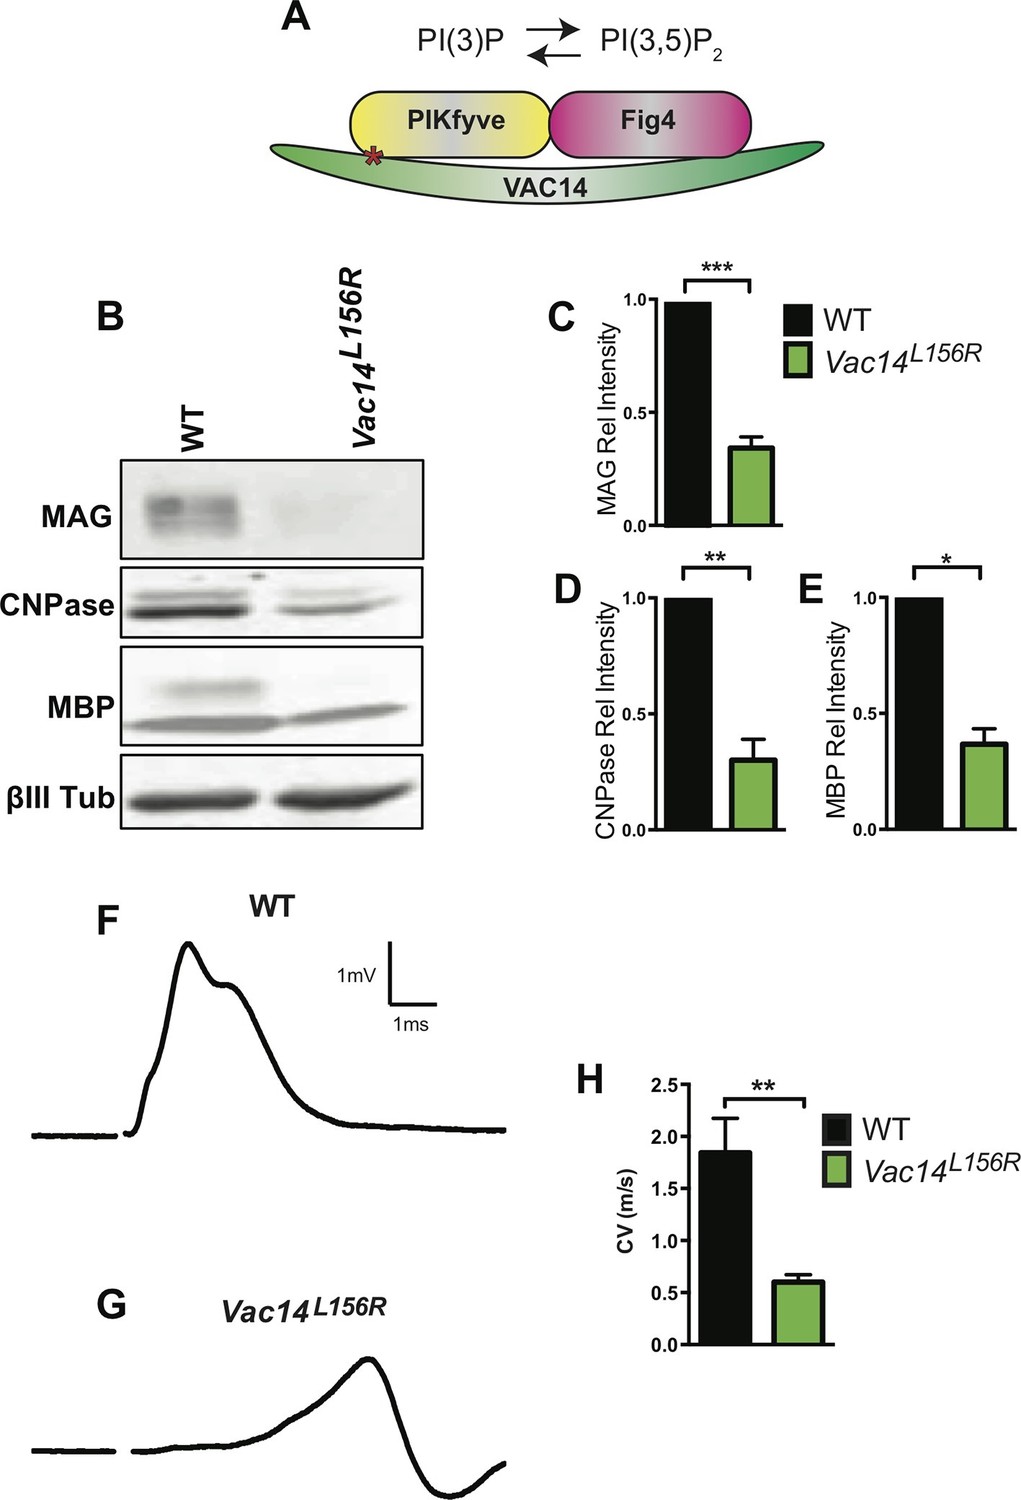
Figure 7—figure supplement 1
Severe optic nerve hypomyelination in VAC14L156R/L156R mice.
Semi-thin sections of P21 optic nerves in (A, B) longitudinal and (C, D) cross sectional view stained with toluidine blue. In wildtype (WT) optic nerve sections many myelinated fibers are observed (n = 3 pups). In marked contrast, very few axons are myelinated in the VAC14L156R/L156R optic nerves (n = 2). Scale bar = 15 μm.
Figure 8 with 4 supplements
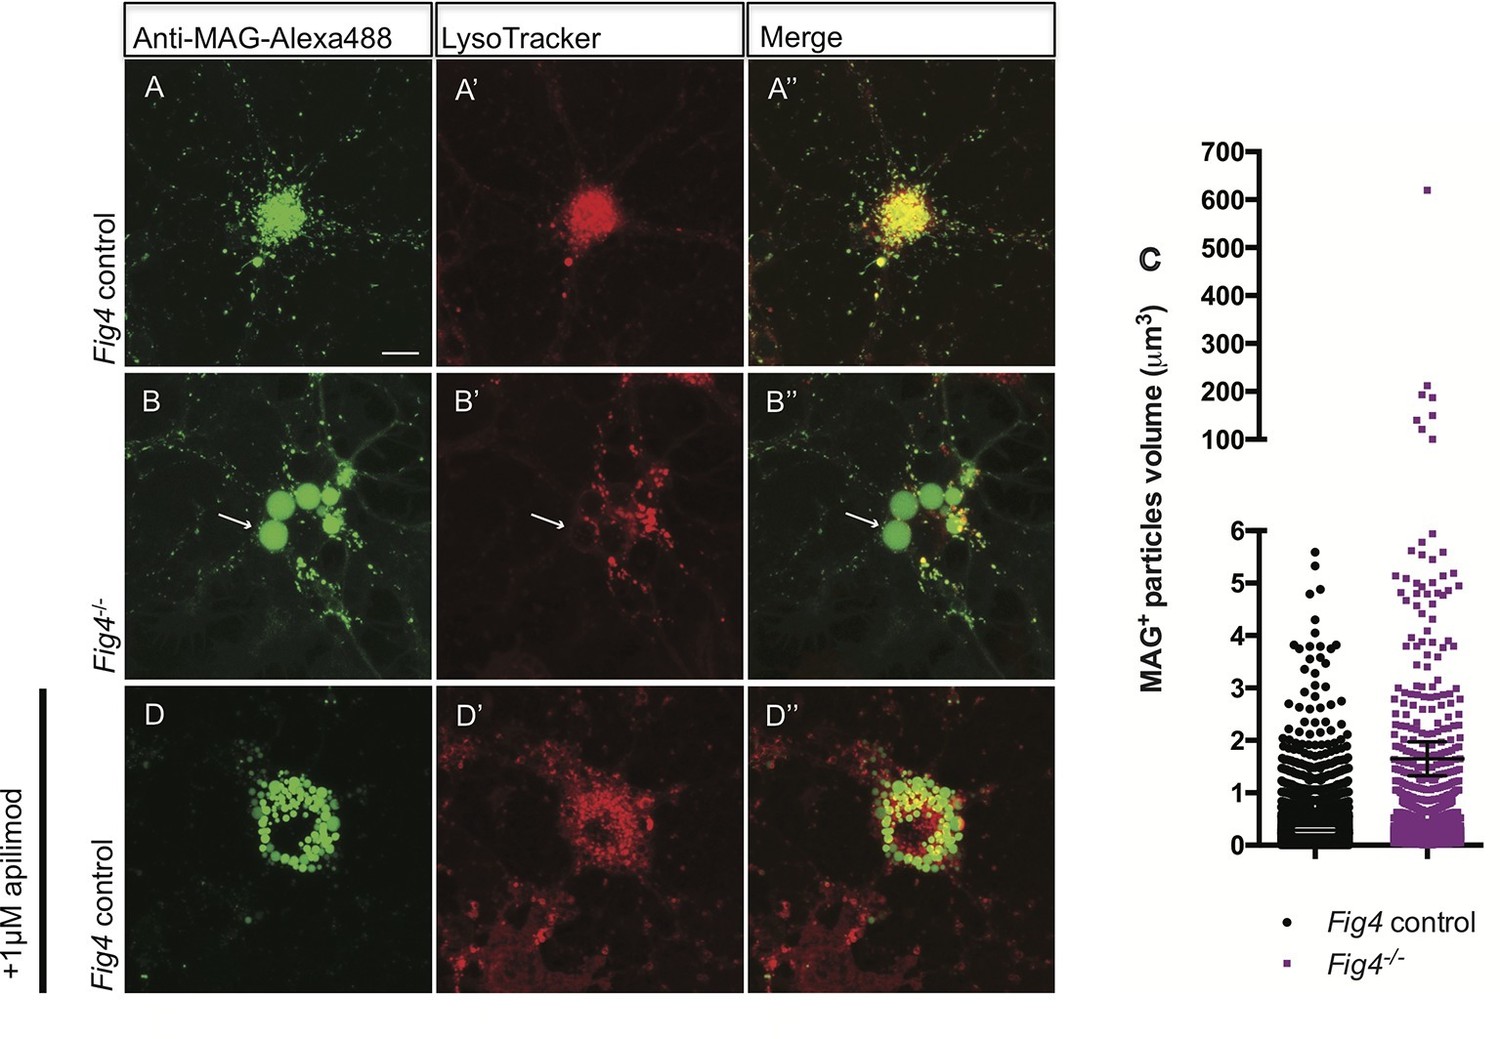
In Fig4-/- OLs, MAG accumulates in large perinuclear vacuoles.
Confocal images of live OLs acutely labeled with bath applied anti-MAG-Alexa488 (green) and LysoTracker Deep Red. (A-A’’) Fig4 control (Fig4+/+ or Fig4+/-) OLs incubated with anti-MAG-Alexa488 and LysoTracker, single channel and merged images are shown. (B-B”) Fig4-/- OLs incubated with anti-MAG-Alexa488 and Lysotracker shows accumulation of MAG in large perinuclear vacuoles (arrows), single channel and merged images are shown. Of note, large perinucler MAG+ vacuoles do not stain with LysoTracker. (C) Scatter plot depicting the volume of anti-MAG-Alexa488+ particles in live Fig4 control and Fig4-/- OLs. Each dot represents an individual vesicle (n = 4 experiments, 9 cells per genotype). Mean volumes ± SEM are shown. (D-D”) Wildtype OLs were incubated with anti-MAG-Alexa488 and LysoTracker and then acutely treated with the PIKfyve inhibitor apilimod. MAG accumulates in large perinuclear vacuoles, the majority of which does not stain with LysoTracker (n = 4 for Fig4 controls and n = 4 for Fig4-/-cultures). For apilimod treatment, n = 3 independent cultures. Maximum projection confocal z-stack images are shown, scale bar = 10 μm. Further characterization of enlarged perinuclear vacuoles in Fig4-/- OL cultures, specificity control for the anti-MAG-Alexa488 antibody and distinct trafficking routes of MAG and MOG are shown in Figure 8—figure supplement 1–3 and 4.
Figure 8—figure supplement 1

Fig4-/- OLs show enlarged perinuclear vacuoles that stain positive for LAMP1.
Confocal images of (A-A”) Fig4 control (Fig4+/+ or Fig4+/-) and (B-B”) Fig4-/-OPCs cultured for two days in the presence of PDGF, fixed and double-stained with anti-LAMP1 and anti-PDGFRα antibodies. TO-PRO-3 dye was added to stain nuclei. Few OPCs (<20%) in Fig4-/- cultures showed enlarged LAMP1+ vesicles (white arrows). (C-D’’) Confocal images of (C-C”) Fig4 control and (D-D”) Fig4-/- OLs after 4 days in T3 containing differentiation medium. Cultures were fixed and double-stained with anti-LAMP1 and anti-MAG antibodies. TO-PRO-3 dye was added to stain nuclei. In Fig4-/- cultures, the majority of OLs (>65%) showed multiple large perinuclear vacuoles that were double-positive for LAMP1and MAG (white arrows). Observations were made in 4 independent experiments per culture condition. Scale bar, A-D” = 10 μm.
Figure 8—figure supplement 2
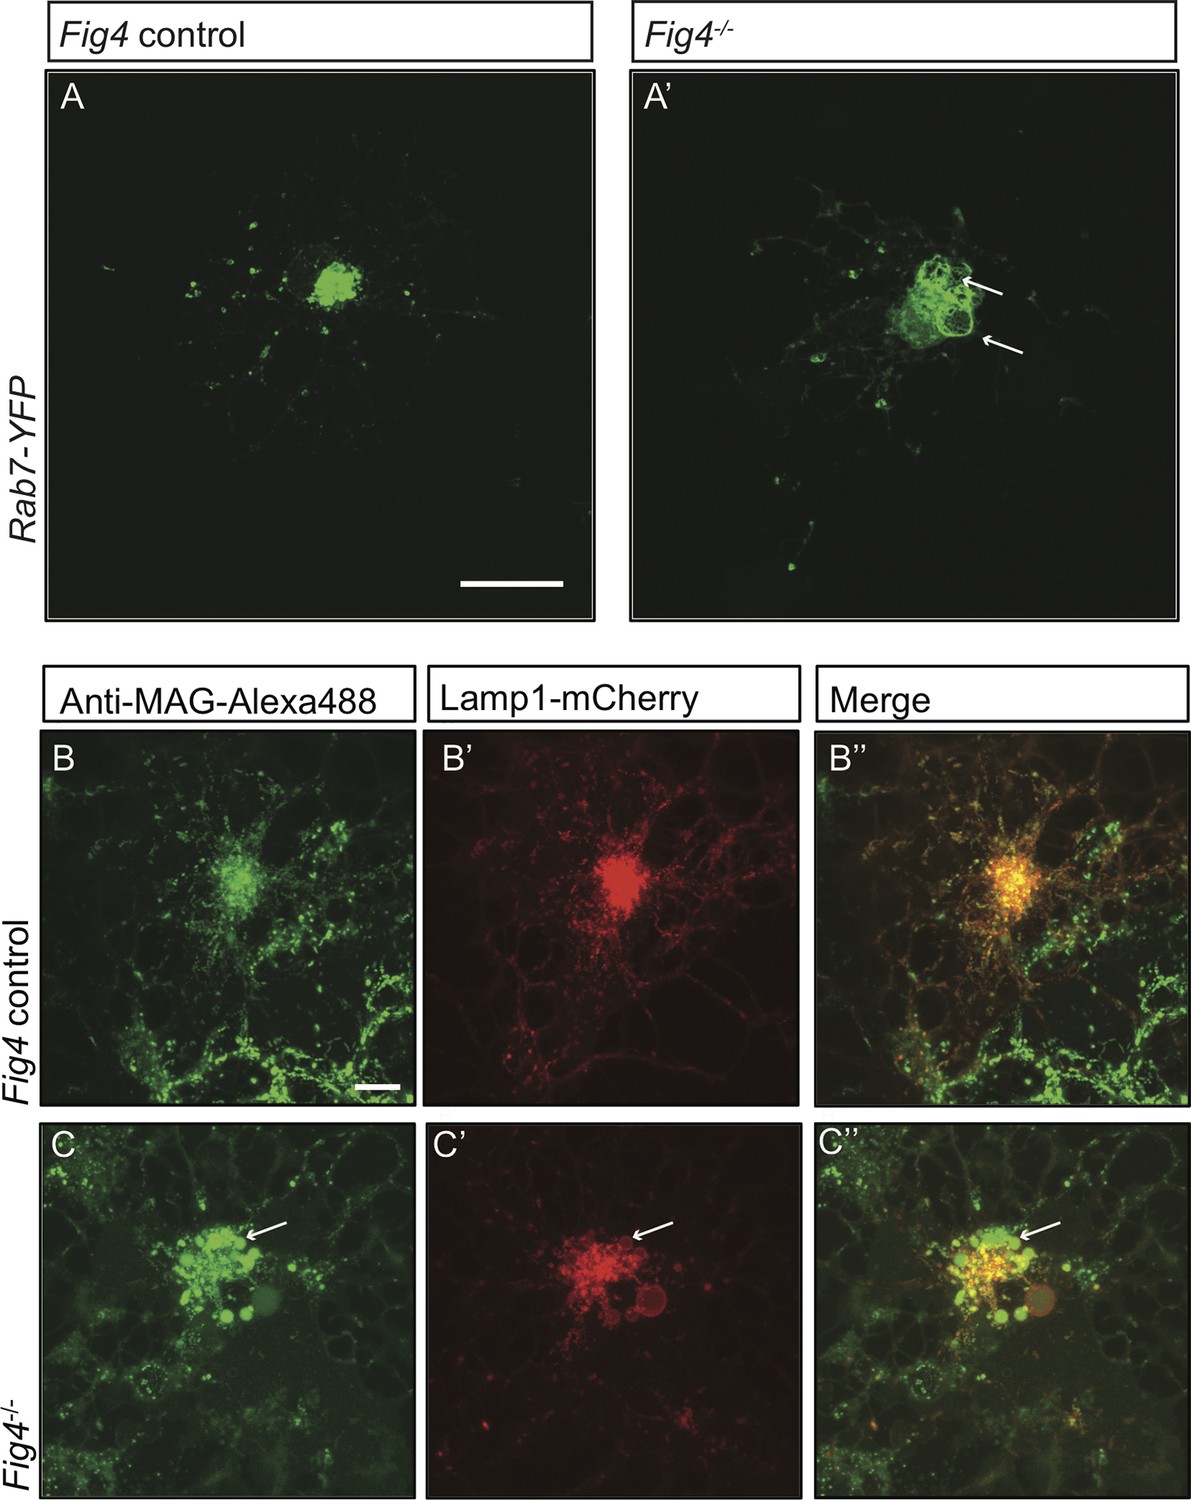
In Fig4-/- OLs, PM derived MAG is transported to enlarged vesicles in the LE/Lys compartment.
Representative confocal images of (A) Fig4 control OLs and (A’) Fig4-/- OLs transfected with a Rab7-YFP expression construct. Large perinuclear Rab7-YFP+ vesicular structures are observed in Fig4-/- OLs (arrows). Scale bar = 20 μm. Confocal images of (B-B”) Fig4 control (Fig4+/+ or Fig4+/-) and (C-C”) Fig4-/- OL cultures transfected with a LAMP1-mCherry expression construct and incubated in bath applied anti-MAG-Alexa488 antibody. (B”) In Fig4 control cultures MAG is localized to LAMP1+ vesicles with a diameter of less than 1 µm. (C”) In Fig4-/-cultures, MAG labeling is frequently observed in enlarged perinuclear and LAMP1+ vesicles (arrows). Scale bar = 20 μm.
Figure 8—figure supplement 3
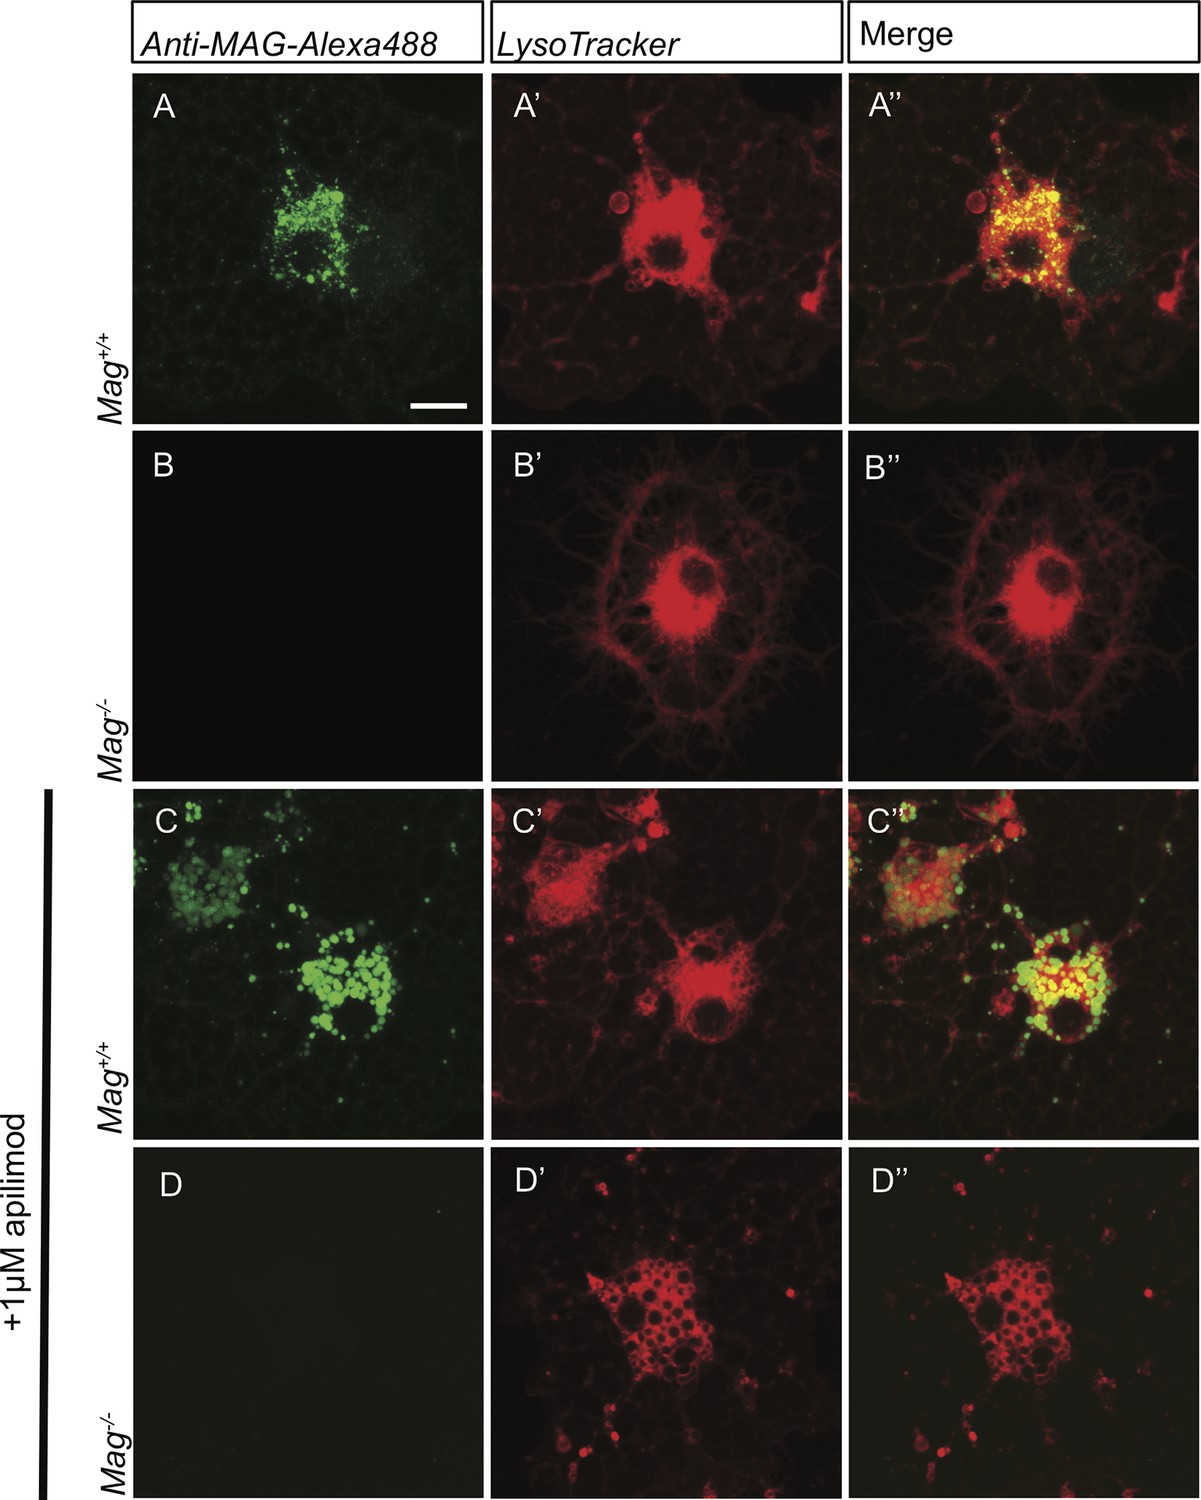
Specificity control for anti-MAG-Alexa488 antibody.
Live-cell imaging of primary OLs prepared from Mag+/+ and Mag-/-pups following bath application of anti-MAG-Alexa488 (green) and LysoTracker Deep Red. Representative confocal Z-stack images are shown. (A-A”) Anti-MAG-488 labeling of intracellular vesicles is robust in Mag+/+ OLs. (B-B”) No signal is detected in parallel processed Mag-/- OLs. Independent of MAG genotype, prominent LysoTracker staining is observed. (C-D’’) To rule out the possibility that large vacuoles are non-specifically labeled by anti-MAG-Alexa488, Mag+/+ and Mag-/-OL cultures were treated with the PIKfyve kinase inhibitor apilimod. Apilimod leads to accumulation of enlarged perinuclear vacuoles in Mag+/+and Mag-/-cultures. (C-C’’) In Mag+/+ cultures, vacuoles are strongly labeled with anti-MAG-Alexa488. (D-D’’) In Mag-/- cultures, no labeling with anti-MAG-Alexa488 was observed. Scale bar in A-D” = 7.5 µm.
Figure 8—figure supplement 4
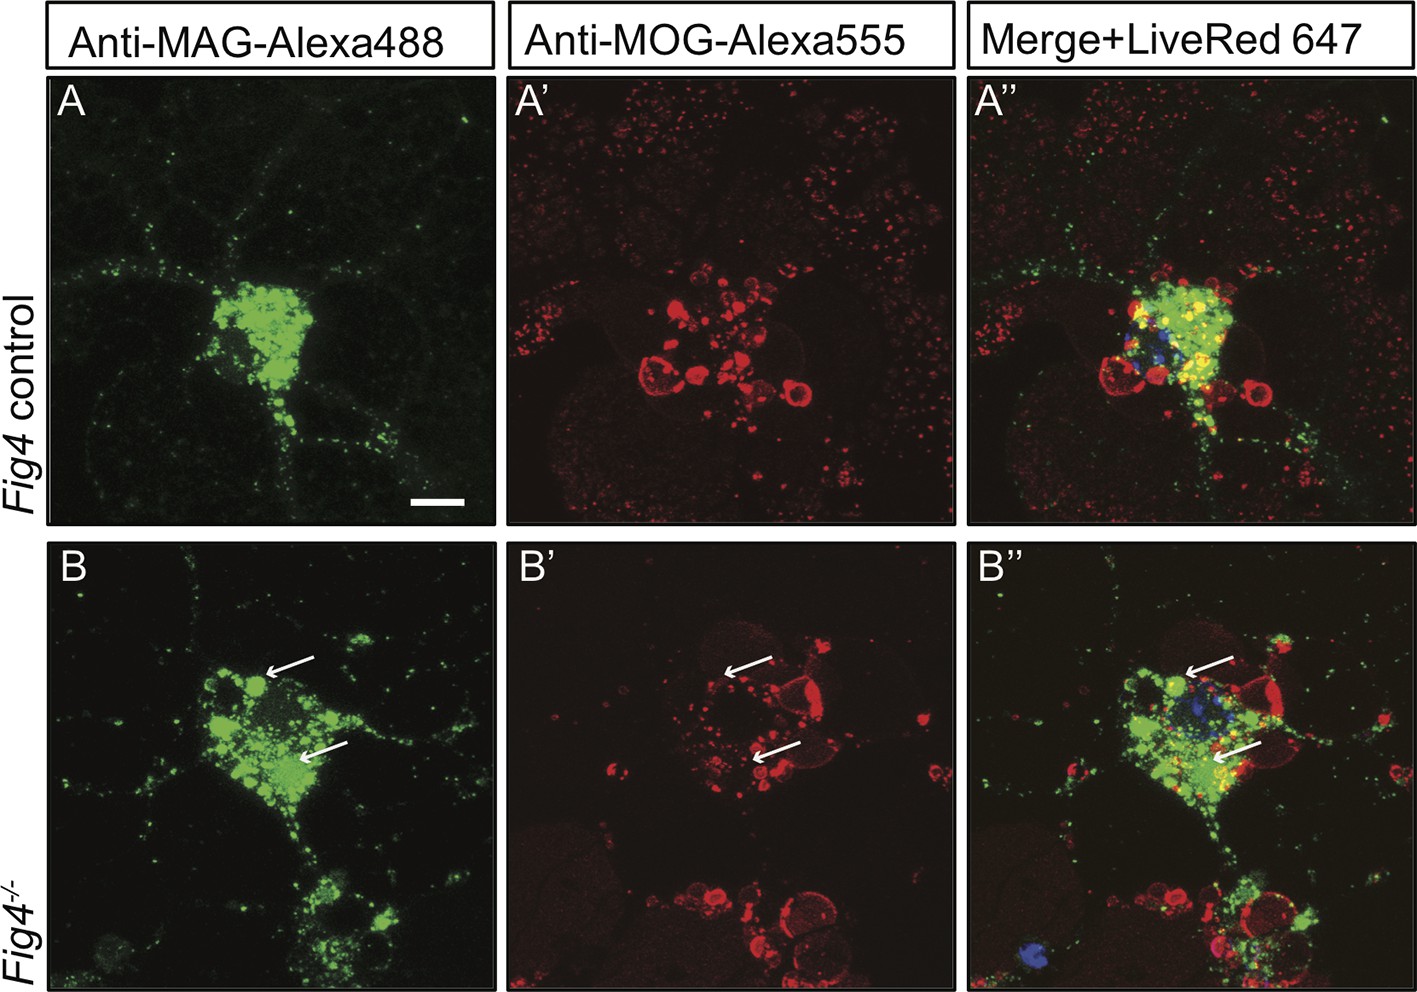
Live imaging of primary OLs reveals distinct trafficking routes for PM-derived MAG and MOG.
Confocal images of (A-A”) Fig4 control and (B-B”) Fig4-/- OLs simultaneously incubated with anti-MAG-Alexa488 and anti-MOG-Alexa555 antibodies. Independent of Fig4 genotype, there is little overlap among MAG+ (green) and MOG+ (red) structures. In Fig4-/- OLs, enlarged MAG+ vesicular structures (arrows) are MOG-. Scale bar A-B’ = 7.5 µm.
Figure 9
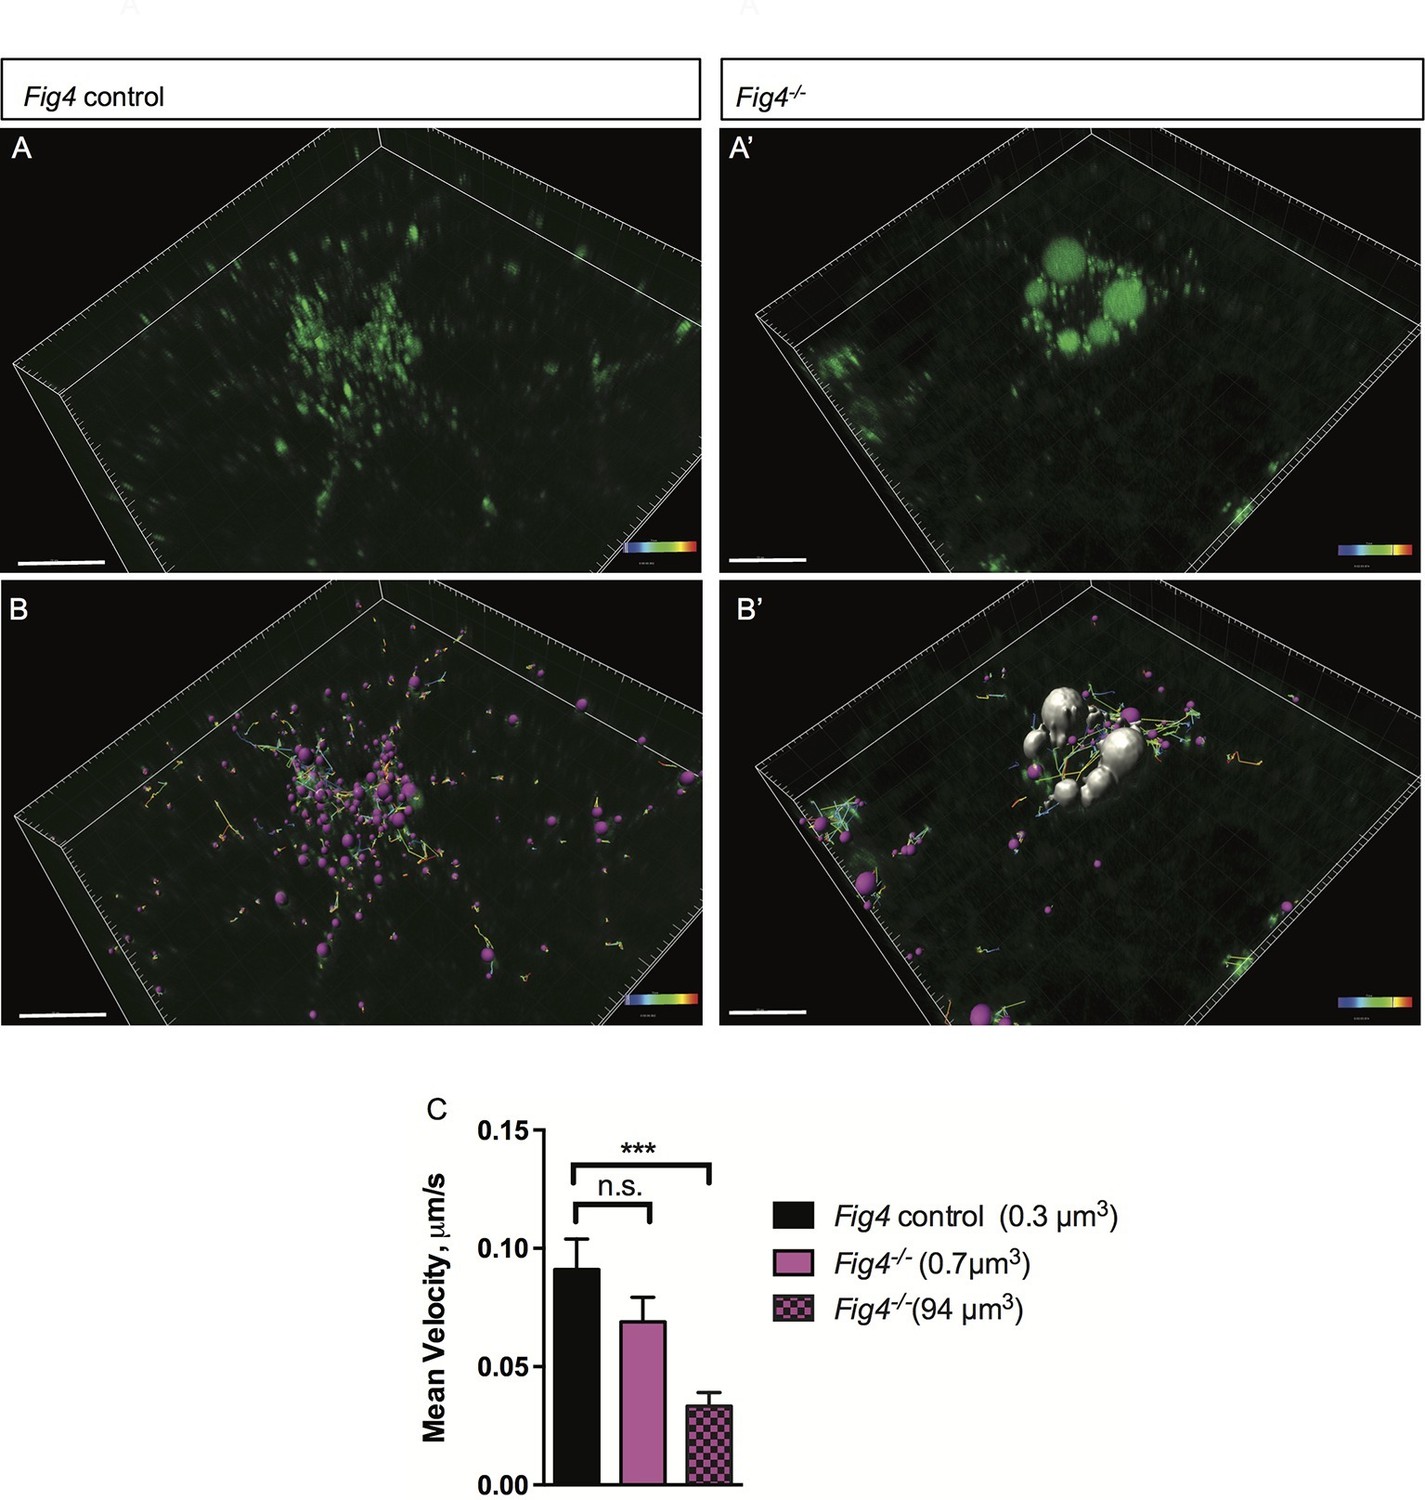
In Fig4-/- OLs, vesicular trafficking through the LE/Lys compartment is defective.
Representative confocal images of live, anti-MAG-Alex488 labeled (A) Fig4 control OLs and (A’) Fig4-/- OLs. Time-lapse imaging was used to track movement of MAG+ vesicles. (B) Using Imaris software, MAG+ vesicles were labeled with pink spheres and vesicular movement was tracked (yellow lines) in Fig4 control cultures. (B’) Imaris software was used to track movement of large vesicles (white color) and small vesicles (purple color) in Fig4-/- OLs: tracks of individual vesicles are shown. (C) Quantification of mean velocity of MAG+ vesicles in Fig4 control OLs and Fig4-/- OLs. In Fig4-/- OLs, movement of small vesicles (0.7 µm3) and large vesicles (94 µm3) was assessed separately. The velocity is shown as mean value ± SEM. N = 4 independent experiments and a total of 9 cells per genotype were analyzed. One-way ANOVA with Dunnett posthoc, ***p= 0.001. (n.s. = not significant).
Figure 10 with 1 supplement
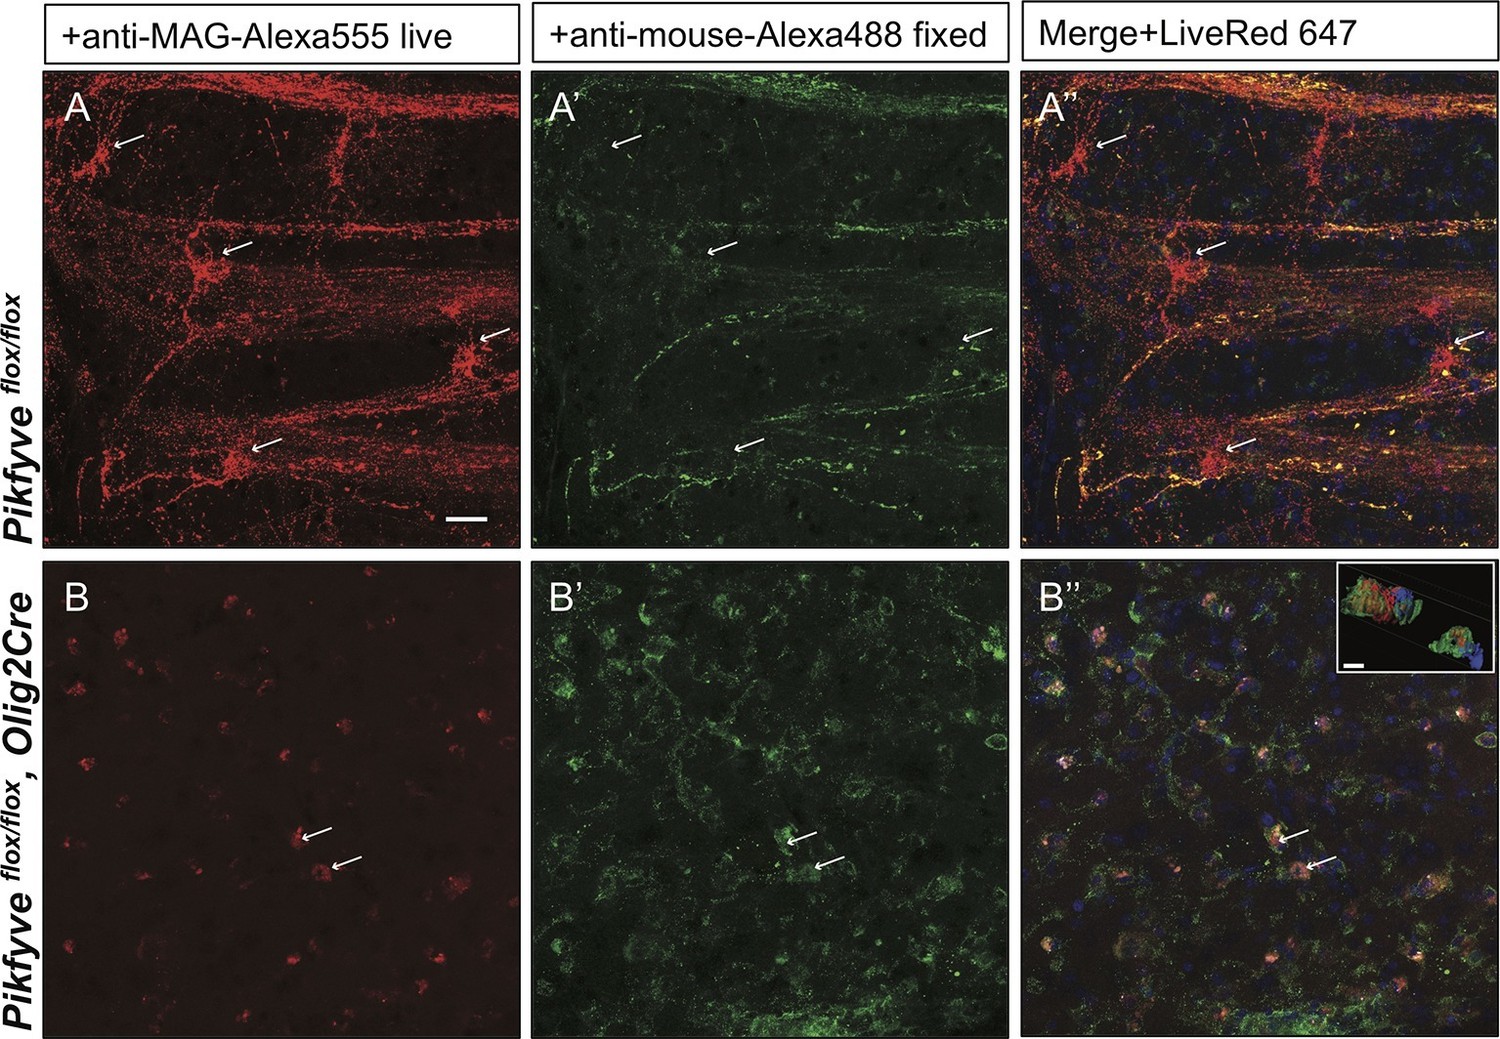
Impaired trafficking of MAG in Pikfyveflox/flox,Olig2Cre brain slices.
Confocal images of acute brain slices in oxygenated ACSF treated with bath-applied anti-MAG-Alexa555 antibody, fixed and stained with anti-mouse-Alexa488 secondary antibody to distinguish between endocytosed MAG (red) and PM localized MAG (green). (A) OLs in the striatum of Pikfyve control mice (P13) show punctate MAG labeling in the cell soma (arrows) and along processes that form internodes. Only few MAG+ structures are also stained with anti-mouse-Alexa488, and thus, localized on the PM. (B-B”) Limited perinuclear MAG labeling is observed in the Pikfyveflox/flox,Olig2Cre striatum. Many MAG+ structures are labeled red and green, and thus localized to the PM, however intracellular MAG is observed in some cells. Scale bar = 20 µm. Small inset shows a 3D view of the two cells labeled with arrows (B-B”). MAG+ vesicles (red) only partially overlap with PM localized MAG (green). Alexa488+ isosurface transparency is adjusted to 50% to demonstrate intracellular Alexa555+ (red) and LiveNuc 647+ (blue) structures. Scale bar = 10 µm. To directly demonstrate that anti-MAG antibody labeled cells are OLs, parallel experiments were carried out with brain slices of LacZ/EGFP,Olig2Cre reporter mice. Anti-MAG antibody specificity is demonstrated with Mag-/-slices in Figure 10—figure supplement 1.
Figure 10—figure supplement 1
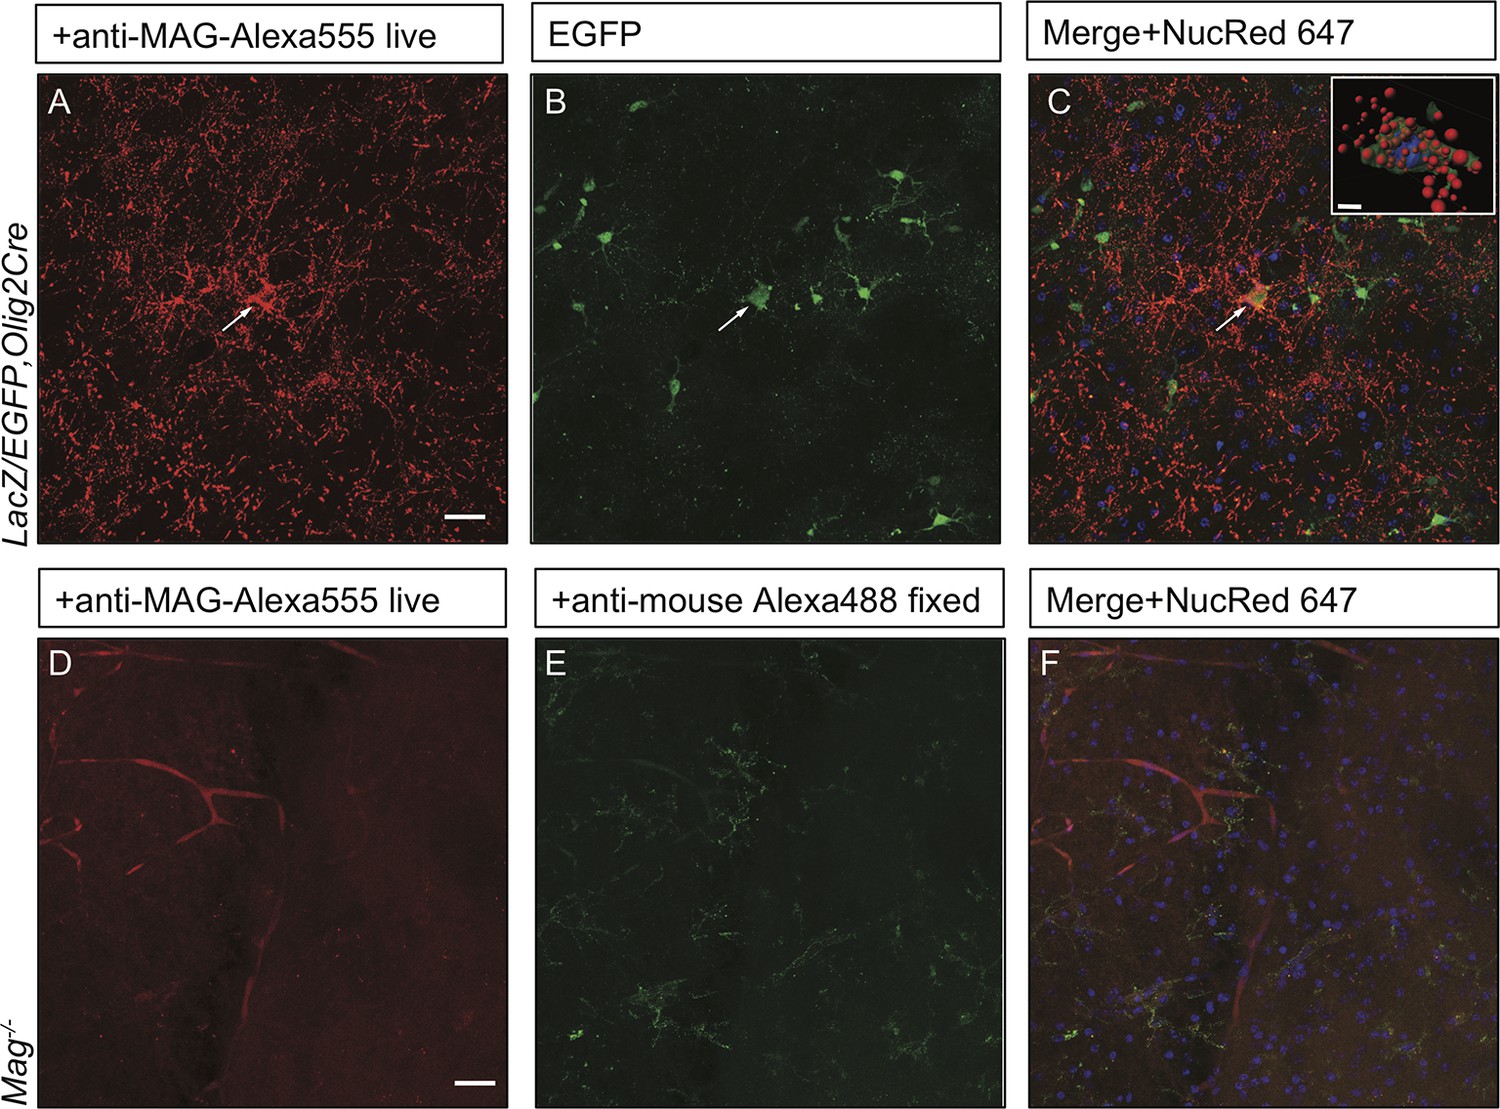
Anti-MAG labeling of EGFP+ OLs and specificity control for anti-MAG antibody in acute brain slices.
(A-C) The LacZ/EGFP,Olig2Cre reporter mouse was used for genetic labeling of cells in the OL lineage. In acute brain slices, punctate anti-MAG-Alexa555 labeling is observed in the soma and processes of EGFP+ OLs in the developing neocortex of P14 mice (arrow). For nuclear staining slices were incubated with NucRed 647. Insert: Isosurface rendering of the MAG+/EGFP+ cell labeled with the arrow. EGFP+ isosurface transparency is increased to 50% to demonstrate intracellular Alexa555+ (red) and LiveNuc 647+ (blue) structures. Scale bar = 10 µm. (D-F) Parallel processed brain slices from Mag-/-pups labeled live with mouse anti-MAG-Alexa555 antibody, fixed and incubated with anti-mouse Alexa488, show no staining above background. Scale bar = 20 µm.
Videos
Video 1
Normal locomotion of juvenile Fig4+/flox,Olig2Cre mice.
A representative video of a control Fig4+/flox,Olig2Cre mouse at P23. N = 10
Video 2
Normal locomotion of juvenile Fig4-/flox,Olig2Cre mice.
A representative video of a Fig4-/flox,Olig2Cre conditional mutant mouse at P23 shows no obvious pathology in locomotion. N = 10
Video 3
Normal locomotion of juvenile Pikfyveflox/+ control mice.
A representative video of a control Pikfyveflox/+ mouse at P13. N = 16
Video 4
Severe tremor in juvenile Pikfyveflox/flox,Olig2Cre mice.
A representative video of a Pikfyveflox/flox,Olig2Cre conditional mutant mouse at P13 reveals a severe tremor phenotype. N = 16
Video 5
Vacuoles in Fig4-/- OLs appear and disappear within hours.
Time-lapse live cell analysis of Fig4-/- primary OPC/OLs imaged with an IncuCyte ZOOM microscope. Phase contrast images were taken every 2 hr over a time interval of 60 hr. The majority of Fig4-/- cells contain large perinuclear vacuoles. Some of these vacuoles appear and disappear within hours (n = 3). Scale bar = 60 µm.
Download links
A two-part list of links to download the article, or parts of the article, in various formats.
Downloads (link to download the article as PDF)
Open citations (links to open the citations from this article in various online reference manager services)
Cite this article (links to download the citations from this article in formats compatible with various reference manager tools)
PI(3,5)P2 biosynthesis regulates oligodendrocyte differentiation by intrinsic and extrinsic mechanisms
eLife 5:e13023.
https://doi.org/10.7554/eLife.13023


