Tissue damage drives co-localization of NF-κB, Smad3, and Nrf2 to direct Rev-erb sensitive wound repair in mouse macrophages
- University of California, San Diego, United States
- Ludwig-Maximilian Universität München, Germany
- Salk Institute for Biological Sciences, United States
Figures
Figure 1 with 1 supplement

Overall impact of Rev-erb DKO on signal-dependent gene expression.
(a) Schematic illustrating the experimental approach used in defining the global transcriptional program in WT and Rev-erb DKO bone marrow derived macrophages (BMDMs). (b) Heatmap showing genes captured by RNA-Seq associated with Rev-erb control after treatment with the indicated ligands compared to the basal state. Genes shown are those more than 1.5-fold differentially expressed in Rev-erb DKO macrophages compared to WT. Data is represented as log2 fold change between the basal state and treatment (untreated for 6 hr was used for comparison to KLA, Pam3, Poly I:C, TGFβ 9 hr, and tissue homogenate 6 hr; untreated for 24 hr was used for comparison to KLA + IFNγ, IL4, TGFβ 29 hr, and tissue homogenate 24 hr). Genes were clustered using k-means clustering (k = 10). For untreated samples, N = 4, for samples treated with Pam3, Poly I:C, KLA or KLA + IFNγ, tissue homogenate, or TGFβ, N = 3, and for samples treated with IL4, N = 2. The data for this heat map is accessible in Figure 1—source data 1. (c) Heatmap showing genes captured by RNA-Seq as differentially expressed 1.5-fold in the Rev-erb DKO macrophage compared to WT as indicated. Data is represented as log2 fold change between DKO and WT. Genes were clustered using k-means clustering (k = 10). For untreated samples, N = 4, for samples treated with Pam3, Poly I:C, KLA or KLA + IFNγ, tissue homogenate, or TGFβ, N = 3, and for samples treated with IL4, N = 2. The data for this heat map is accessible in Figure 1—source data 2. (d) Gene ontology analysis using David (Huang et al., 2009a, 2009b) of genes shown in panel b. (e) Gene ontology analysis using David (Huang et al., 2009a, 2009b) of genes demonstrating de-repressed expression in Rev-erb DKO macrophages by more than 1.5-fold in all of the conditions combined (w/o Tissue homog considers de-repressed genes in columns 1–8 of panel c (N = 2315), while w/ Tissue homog considers de-repressed genes in all columns of panel c (N=2614)).
-
Figure 1—source data 1
Source data for Figure 1b where each value represents the average normalized log2 fold change between the basal state and treatment state per column.
- https://doi.org/10.7554/eLife.13024.003
-
Figure 1—source data 2
Source date for Figure 1c where each value represents the average normalized log2 fold change between the Rev-erb DKO macrophages compared to the WT per column.
- https://doi.org/10.7554/eLife.13024.004
Figure 1—figure supplement 1
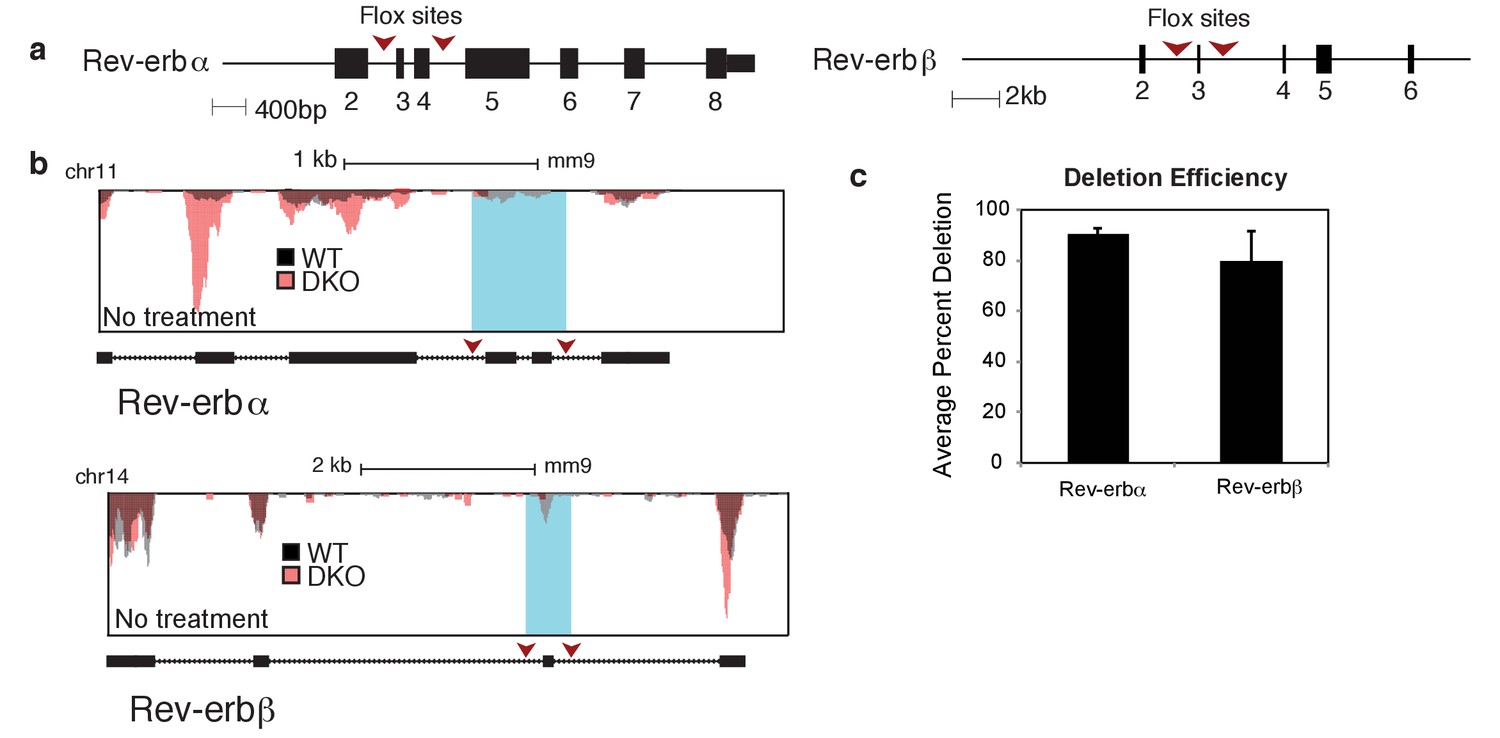
Rev-erb deletion strategy and efficiency.
(a) Diagram showing the Rev-erbα and Rev-erbβ knock-out strategy. Red arrows indicate recombination sites. (b) UCSC genome browser images depicting the exons targeted in Rev-erbα and Rev-erbβ genes in the untreated condition. (c) Quantification of the average percent deletion efficiency and standard error mean of the Rev-erbα and Rev-erbβ targeted exons in the Cre+ versus the Cre- animals. For each condition, the total number of sequenced tags for the targeted exon(s) was quantified for both Cre+ and Cre- animals, and then the percent deletion was calculated and averaged (N = 4 for WT and DKO).
Figure 2 with 1 supplement
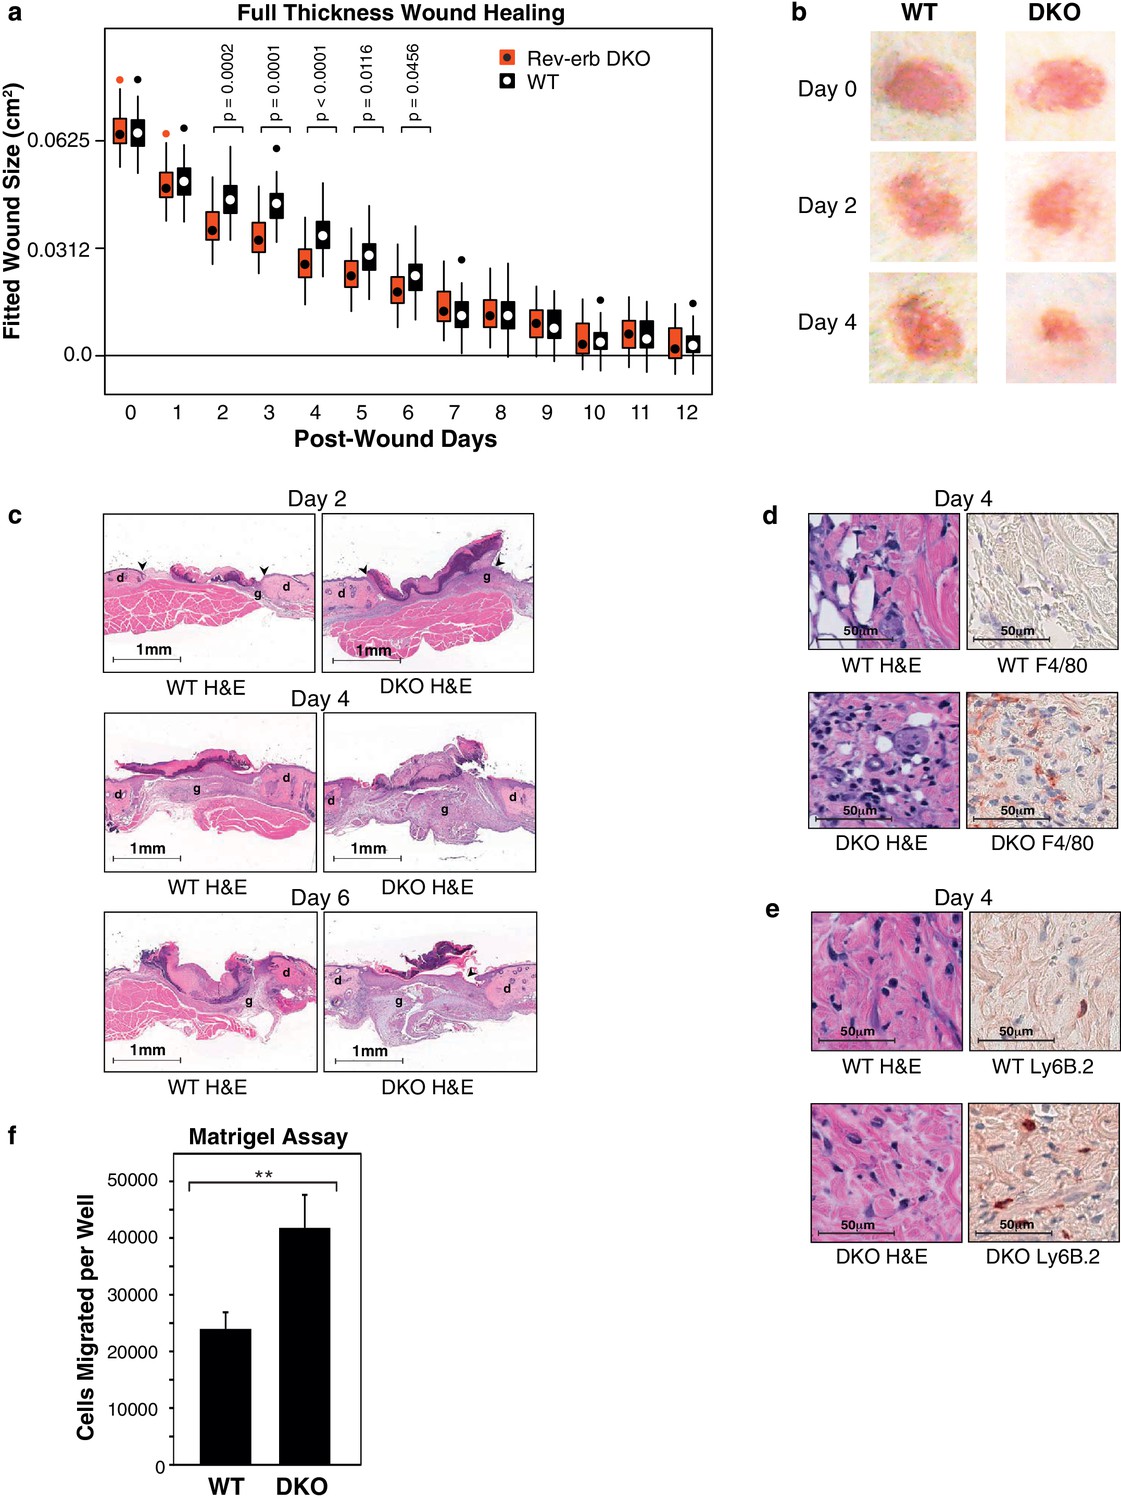
Rev-erb DKO bone marrow transplanted animals display enhanced wound closure in a full thickness wound healing model.
(a) Wound size (cm2) as fitted from a linear mixed effects model. Boxes denote the interquartile range and the median, whiskers denote the minimum and maximum values excluding outliers, and dots outside of the whiskers denote outlier observations. Data are pooled from three independent experiments as described in more detail in the Materials and methods. The p-values shown reflect comparisons with a p-value less than 0.05, as determined by the linear mixed effects model. (b) Macroscopic digital photographs of wound closure in WT and Rev-erb DKO bone marrow transplanted animals. (c) Histological images of wound healing in WT and Rev-erb DKO bone marrow transplanted animals taken at 2.5x magnification after 2, 4, and 6 days. Arrowheads show differential re-epithelialization between WT and Rev-erb DKO bone marrow transplanted animals. Abbreviations: g=granulation tissue, d=dermis. Images representative of two independent animals. (d) Day 4 hematoxylin and eosin (H&E), as well as F4/80 stained histological images taken at 20x magnification. Images representative of two independent animals. (e) Day 4 hematoxylin and eosin (H&E), as well as Ly6B.2 stained histological images taken at 20x magnification. Images representative of two independent animals. (f) Migration of WT and Rev-erb DKO macrophages through matrigel extracellular matrix for 24 hr (**p-value <0.01 two-tailed test, Data represent mean + SD from one of three experiments using 8 wells with cells pooled from 3 independent mice).
Figure 2—figure supplement 1
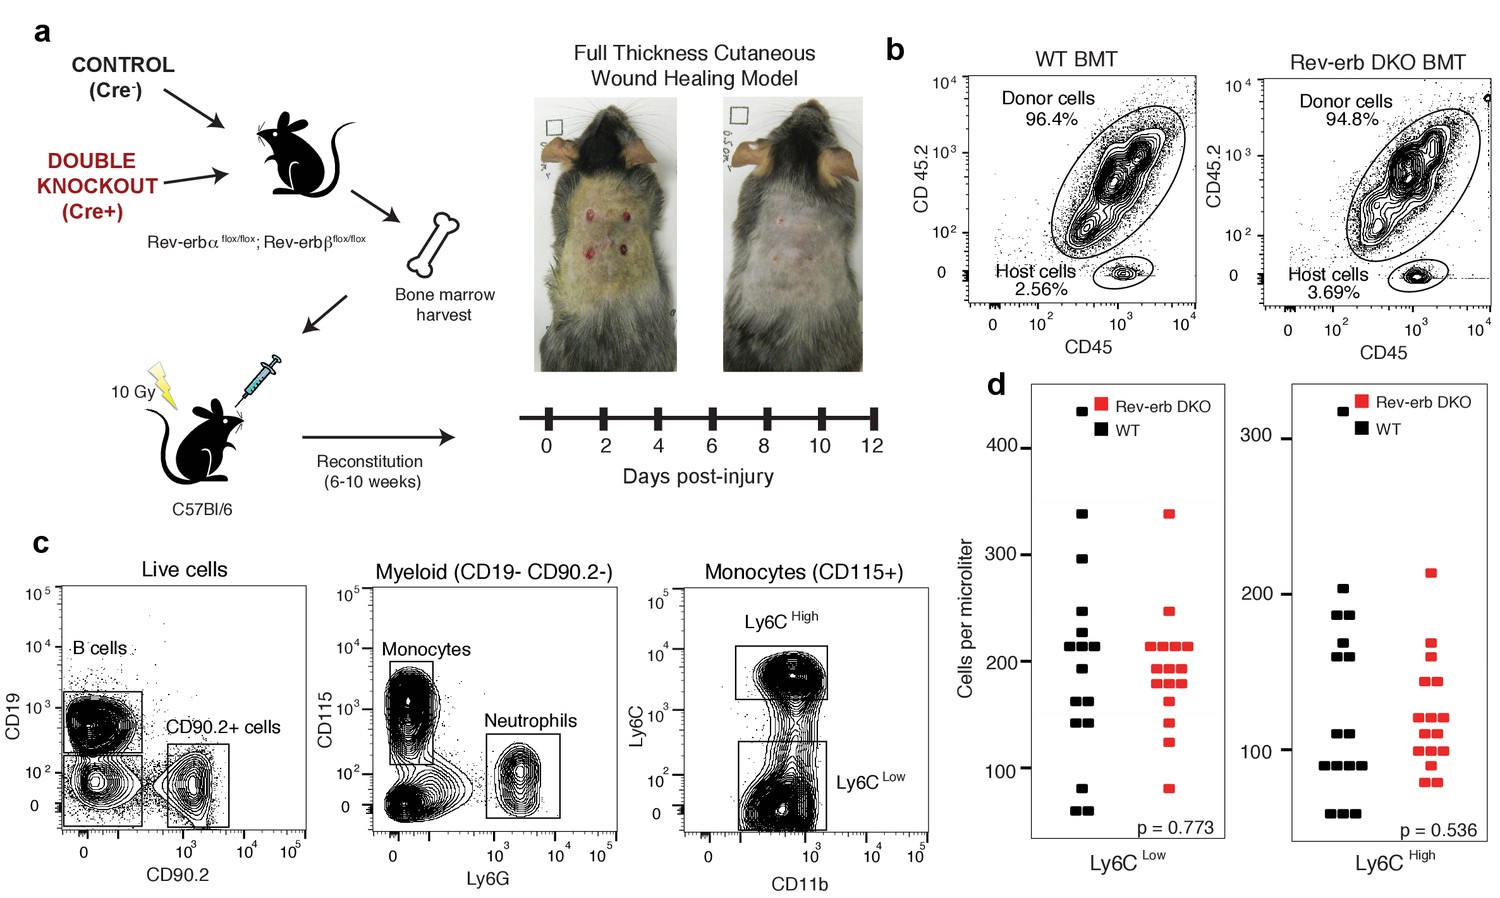
Engraftment efficiency and quantification of circulating blood cells in WT and DKO chimeras.
(a) Bone marrow harvested from Rev-erb DKO animals and control littermates were injected via the retro-orbital route into wild type irradiated congenic (CD45.1) mice. After reconstitution for 6–10 weeks, the wound healing response was followed for 12 days. (b) Bone marrow reconstitution efficiency was determined by flow cytometry of circulating leukocytes. (BMT: bone marrow transplant) (c) Gating strategy to differentiate the various populations of circulating peripheral blood cells. (d) Enumeration of Ly6Clow and Ly6Chigh monocytes from WT and Rev-erb DKO bone marrow transplanted animals (N = 16 bone marrow transplanted mice per genotype).
Figure 3
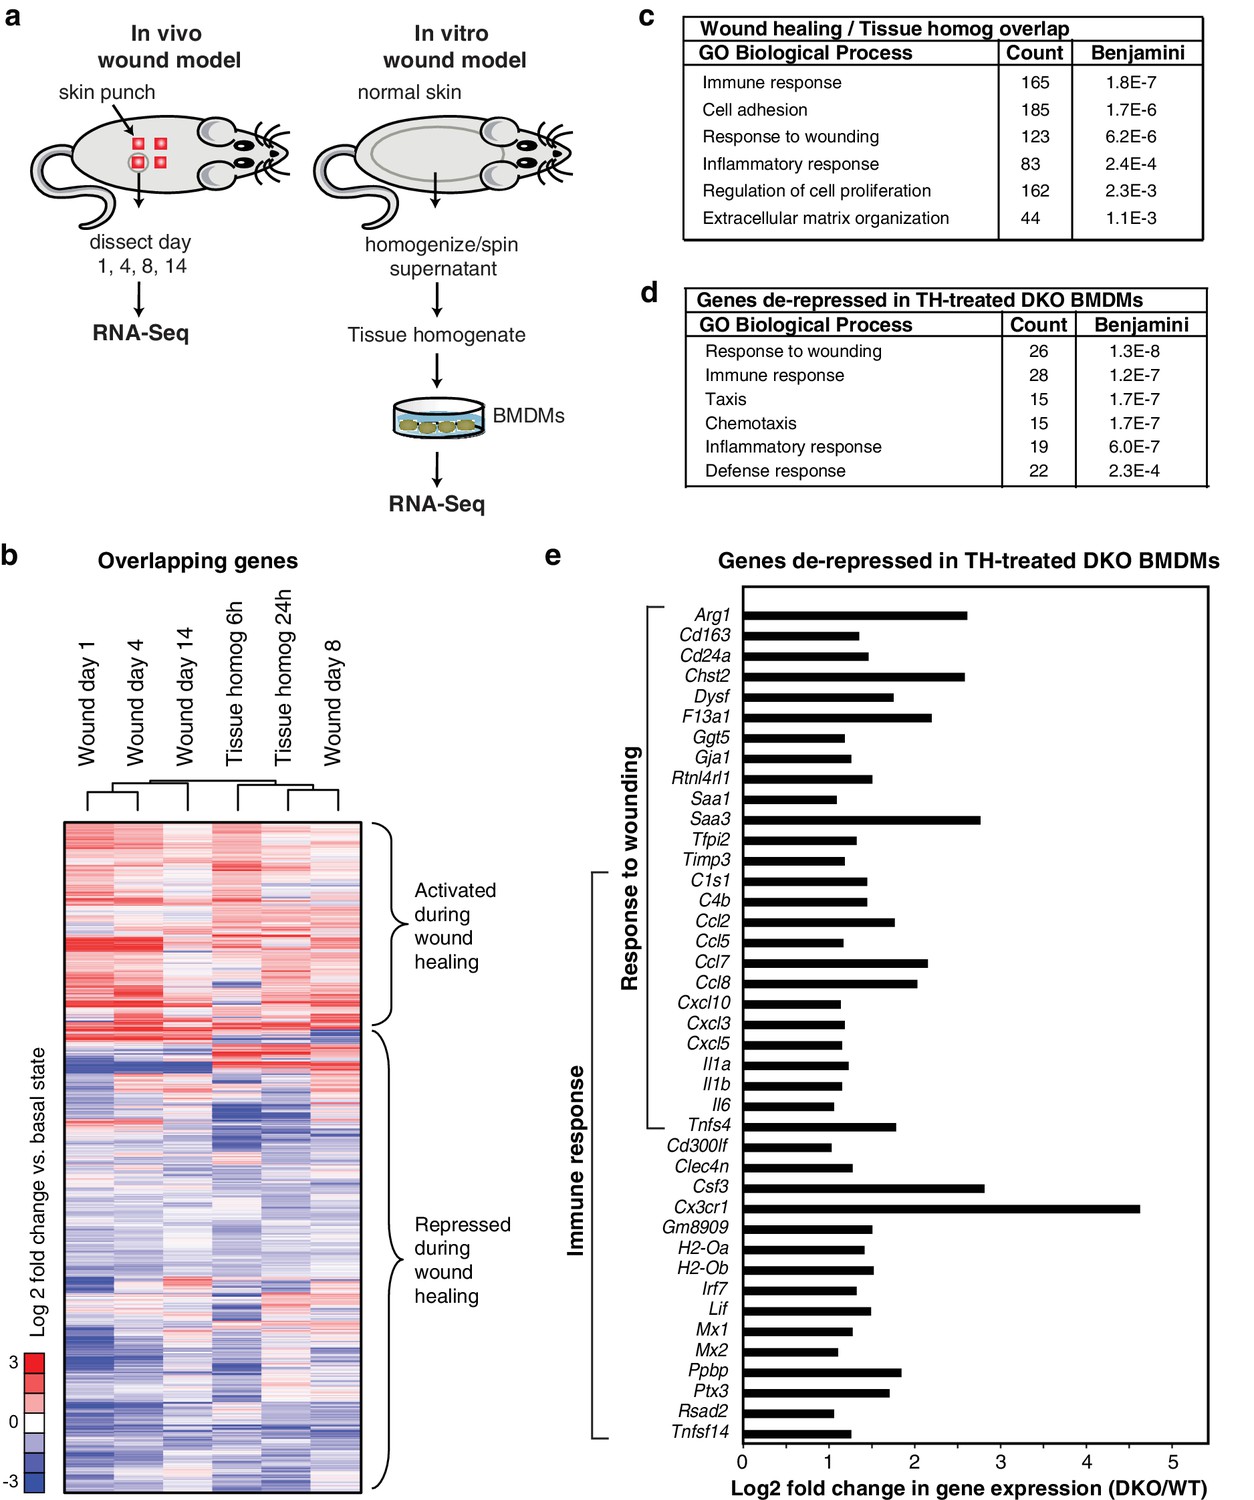
Rev-erb DKO macrophages display increased inflammatory responses to damaged tissue.
(a) Schematic illustrating the experimental approach used comparing the transcriptional profile of in vivo wounds on day 1, 4, 8, or 14 post-wounding with macrophages treated in vitro with tissue homogenate after 6 or 24 hr. (b) Heatmap showing genes differentially expressed both in the in vivo mouse wound and in macrophages after in vitro stimulation with tissue homogenate (Tissue homog). Mouse wound genes from day 1, 4, 8, or 14 post-injury and macrophage tissue homogenate genes at 6 or 24 hr post-stimulation were compared to uninjured in vivo skin or unstimulated controls, respectively. Differentially expressed genes were those induced or repressed more than 1.5-fold compared to baseline. Genes were clustered using k-means clustering (k = 10). For unstimulated macrophages for 6 or 24 hr, N = 2, wound samples from day 1, 8, or 14, N = 2, macrophages stimulated with tissue homogenate for 6 or 24 hr, N = 3, and wound samples from day 0, or 4, N = 4. (c) Summary of gene ontology analysis using DAVID (Huang et al., 2009a, 2009b) of overlapping wound healing and homogenate genes shown in b (N = 5590). Figure 3—source data 1. (d) Summary of gene ontology analysis using DAVID (Huang et al., 2009a, 2009b) of genes de-repressed more than two-fold in Rev-erb DKO macrophages treated with tissue homogenate (TH) in comparison to WT macrophages (maximum de-repression after tissue homogenate treatment for 6 or 24 hr, N = 282). (e) Bar graphs depicting representative genes de-repressed more than two-fold (in log2 scale) in Rev-erb DKO macrophages after tissue injury (maximum de-repression after tissue homogenate treatment for 6 or 24 hr). Genes correspond to those associated with response to wounding and immune response categories in panel d. N as described in 3b.
-
Figure 3—source data 1
Source data for Figure 3b where each value represents the average normalized log2 fold change between the basal state and treatment state per column.
- https://doi.org/10.7554/eLife.13024.009
Figure 4
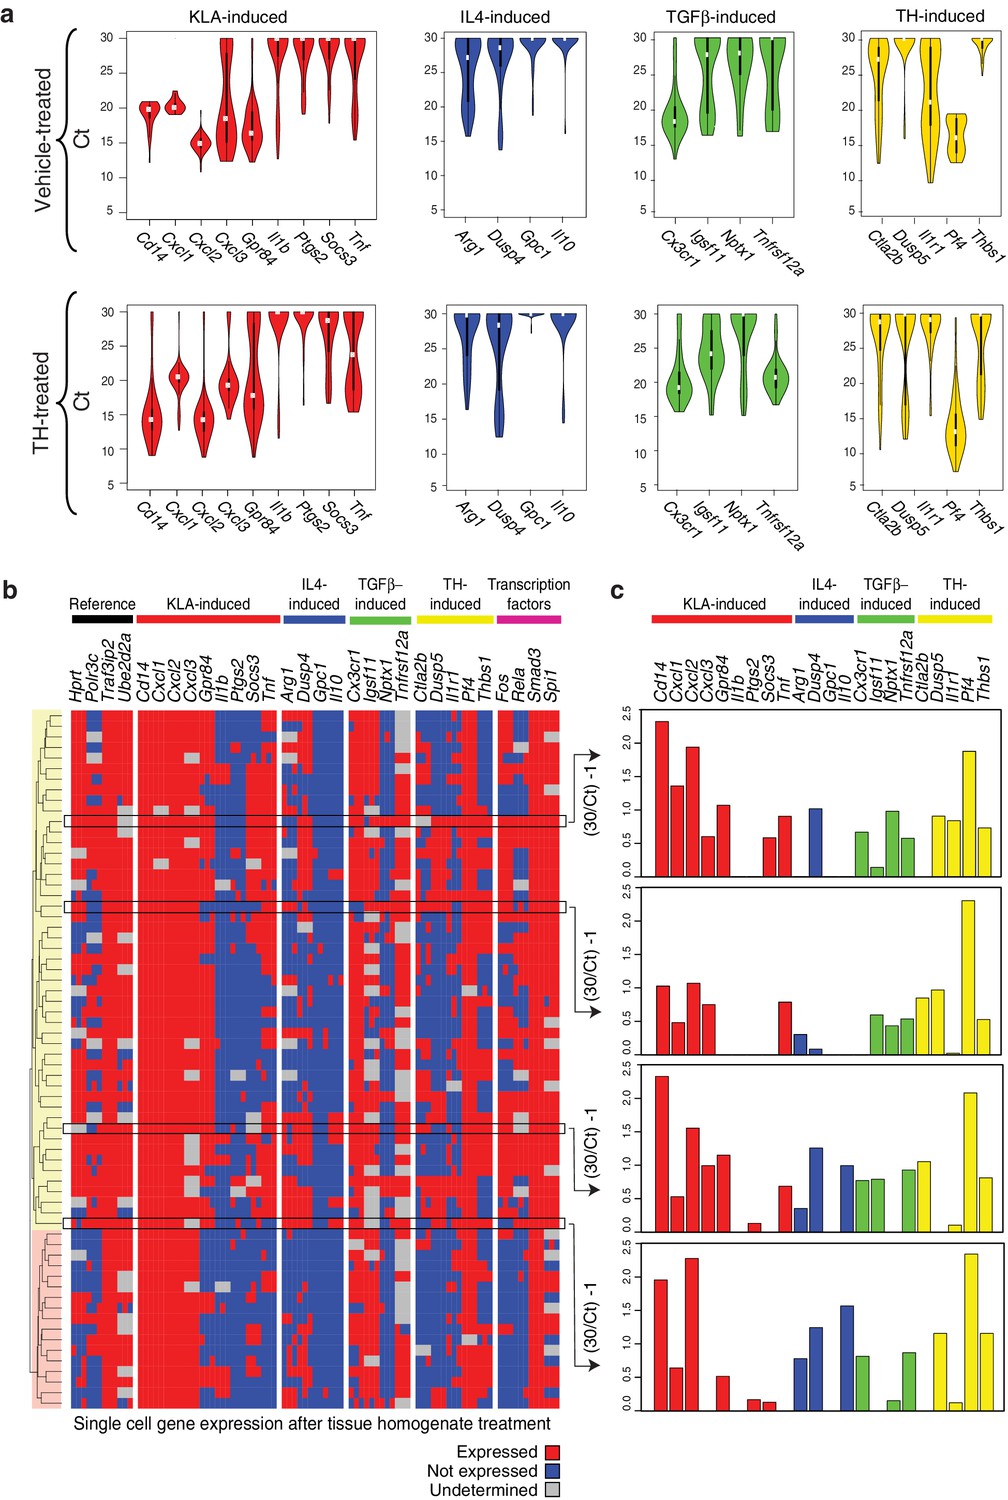
Genes characteristic of alternate polarization states are co-expressed within individual cells.
(a) Violin plots of expression values for genes in the indicated categories as determined by single cell RT-Q-PCR from bone marrow derived macrophages treated for 6 hr with vehicle or tissue homogenate. Y-axis shows RT-Q-PCR CTs. Higher values indicate lower expression (30: gene product could not be detected). Values are averaged over 3 PCR replicates per gene. (b) Hierarchical clustering with Euclidean distance of single bone marrow derived macrophages treated with tissue homogenate based on expression (red) or lack of expression (blue) of the genes indicated at the top. Genes with alternating melting curves were treated as undefined (grey). PCR replicates are shown sequentially (N = 3). (c) RT-Q-PCR expression values for genes indicated above for four representative cells. Y-axis normalized to (30/CT) – 1. Higher values indicate higher expression (0: gene product could not be detected). Values are averaged over 3 PCR replicates per gene.
Figure 5

Complex transcriptional signals re-allocate transcription factors to novel genomic loci.
(a) H3K27ac regions differentially gained upon treatment for 3 or 6 hr with tissue homogenate compared to treatment for 3 or 6 hr with the vehicle control. The heatmap shows a 6 kb window of normalized H3K27ac tag counts of the 2510 or 5005 homogenate gained regions at 3 or 6 hr, respectively, centered on the nucleosome free region (nfr). Input shows genomic background at these regions. N = 1. (b) Motifs enriched in the vicinity of gained H3K27ac sites after treatment with tissue homogenate for 3 or 6 hr using de novo motif enrichment analysis. (c) Comparison of Fos, p65, or Smad3 tag counts at genomic regions that contain Fos, p65, or Smad3 binding after stimulation with KLA, TGFβ, or tissue homogenate. Peaks found to be differentially gained (four-fold more tags) with KLA or TGFβ are colored red, while peaks found to be differentially gained (four-fold more tags) upon tissue homogenate treatment are colored blue. N = 1. (d) Quantification of H3K27ac, Fos, p65, and Smad3 ChIP-Seq tag counts in the 6 hr vehicle or tissue homogenate treated states centered on homogenate gained (using HOMER) Fos, p65, or Smad3 binding events. Dashed lines represent ChIP-Seq signal of the vehicle state and solid lines represent the signal after 6 hr of tissue homogenate stimulation. Blue represents H3K27ac signal, orange represents signal of the respective transcription factor. N = 1.
Figure 6
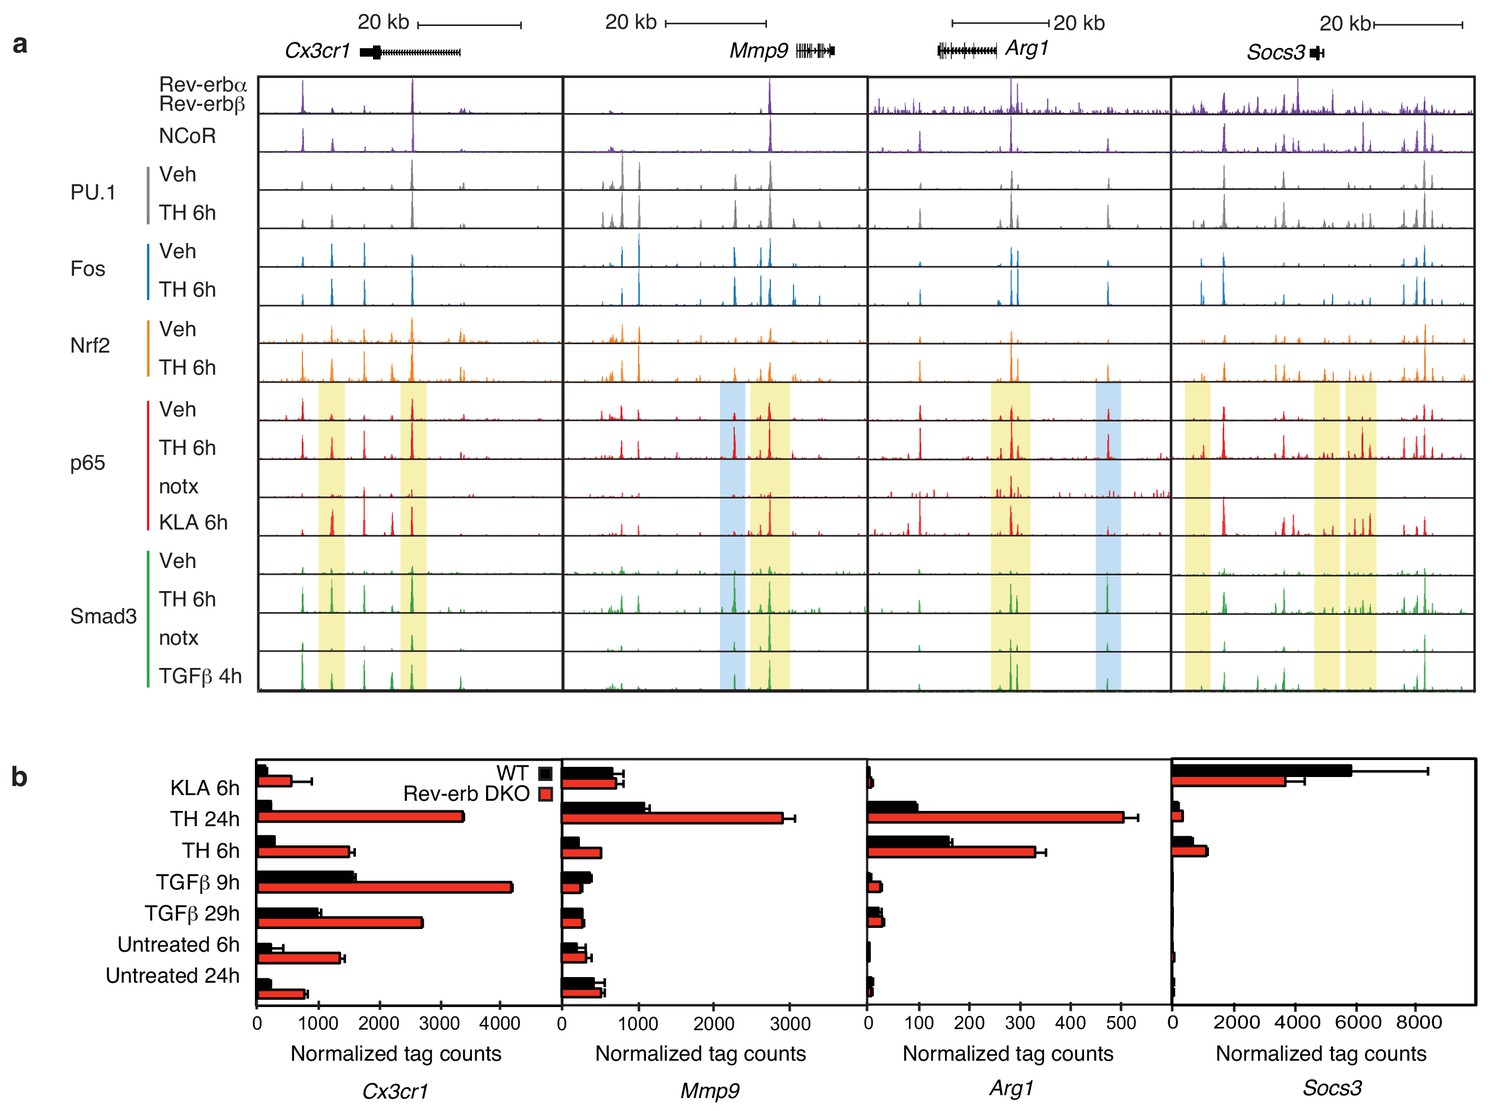
Locus-specific effects of Rev-erbs and signal-dependent transcription factors.
(a) UCSC genome browser images depicting the genomic regions surrounding Rev-erb target genes, Cx3cr1, Mmp9, Arg1, or Socs3. The image shows the co-localization of Rev-erbα/Rev-erbβ, PU.1, Fos, Nrf2, p65, and Smad3 upon homogenate treatment. Yellow denotes gain of signal-dependent transcription factor peaks (p65 or Smad3) and Nrf2 after tissue homogenate stimulation that is not seen after treatment with one single polarizing signal. Blue denotes gain of signal-dependent transcription factor peaks (p65 and Smad3) after tissue homogenate stimulation that is not seen after treatment with either single polarizing signal. (b) Comparison of normalized RNA-Seq tag counts from WT or Rev-erb DKO macrophages stimulated as indicated. Error bars show standard deviation. For unstimulated 6 hr and 24 hr samples, N = 2, samples stimulated with KLA, tissue homogenate for 6 or 24 hr or TGFβ for 9 or 29 hr, N = 3.
Figure 7
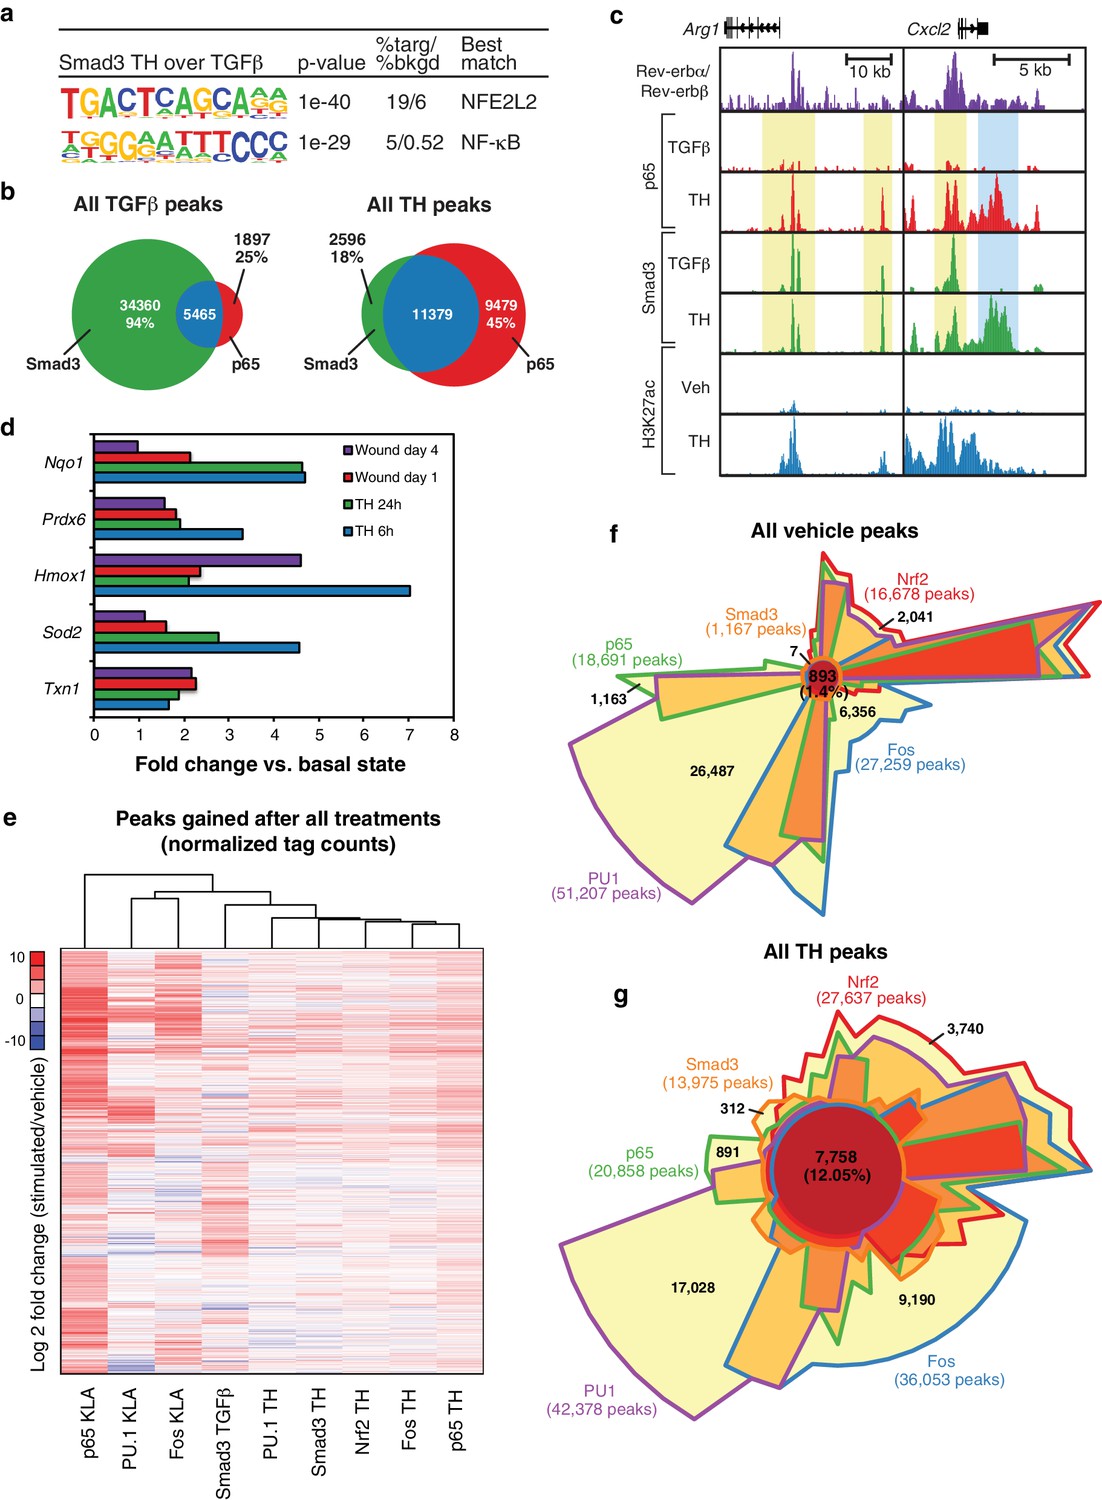
Signal-dependent transcription factors collaborate in response to complex stimuli.
(a) Motifs enriched in the vicinity (200 bp) of Smad3 binding sites that are specific to tissue homogenate (induced four-fold), as compared to Smad3 binding sites that are specific to TGFβ (induced four-fold) using de novo motif enrichment analysis. (b) Venn diagrams depicting overlap of Smad3 and p65 after treatment with TGFβ (left) or tissue homogenate (right). Peaks have a minimal normalized tag count of 16. N = 1. (c) UCSC genome browser images depicting the genomic regions surrounding genes highly induced by tissue homogenate and not by TGFβ. Yellow denotes gain of signal-dependent transcription factor peaks (p65 or Smad3) after tissue homogenate stimulation that is not seen after treatment with one single polarizing signal. Blue denotes gain of signal-dependent transcription factor peaks (p65 and Smad3) after tissue homogenate stimulation that is not seen after treatment with either single polarizing signal. (d) Bar graphs depicting canonical Nrf2 genes induced during stimulation with tissue homogenate (green and blue) or during wound healing (purple and red). N as described in 3b. (e) Heatmap showing the log2 fold change of transcription factor tag counts at all genomic regions (minimum of 64 normalized tag counts in at least one condition per row) that are differentially gained (four-fold more tags) after stimulation as indicated. N = 1. (f) Chow-Ruskey Venn diagram depicting the overlap of all p65, PU.1, Fos, Smad3, and Nrf2 peaks after treatment with vehicle. Peaks have a minimal normalized tag count of 16. N = 1. (f) Same as (g) but depicting the overlap of all peaks after treatment with tissue homogenate. N = 1.
Figure 8
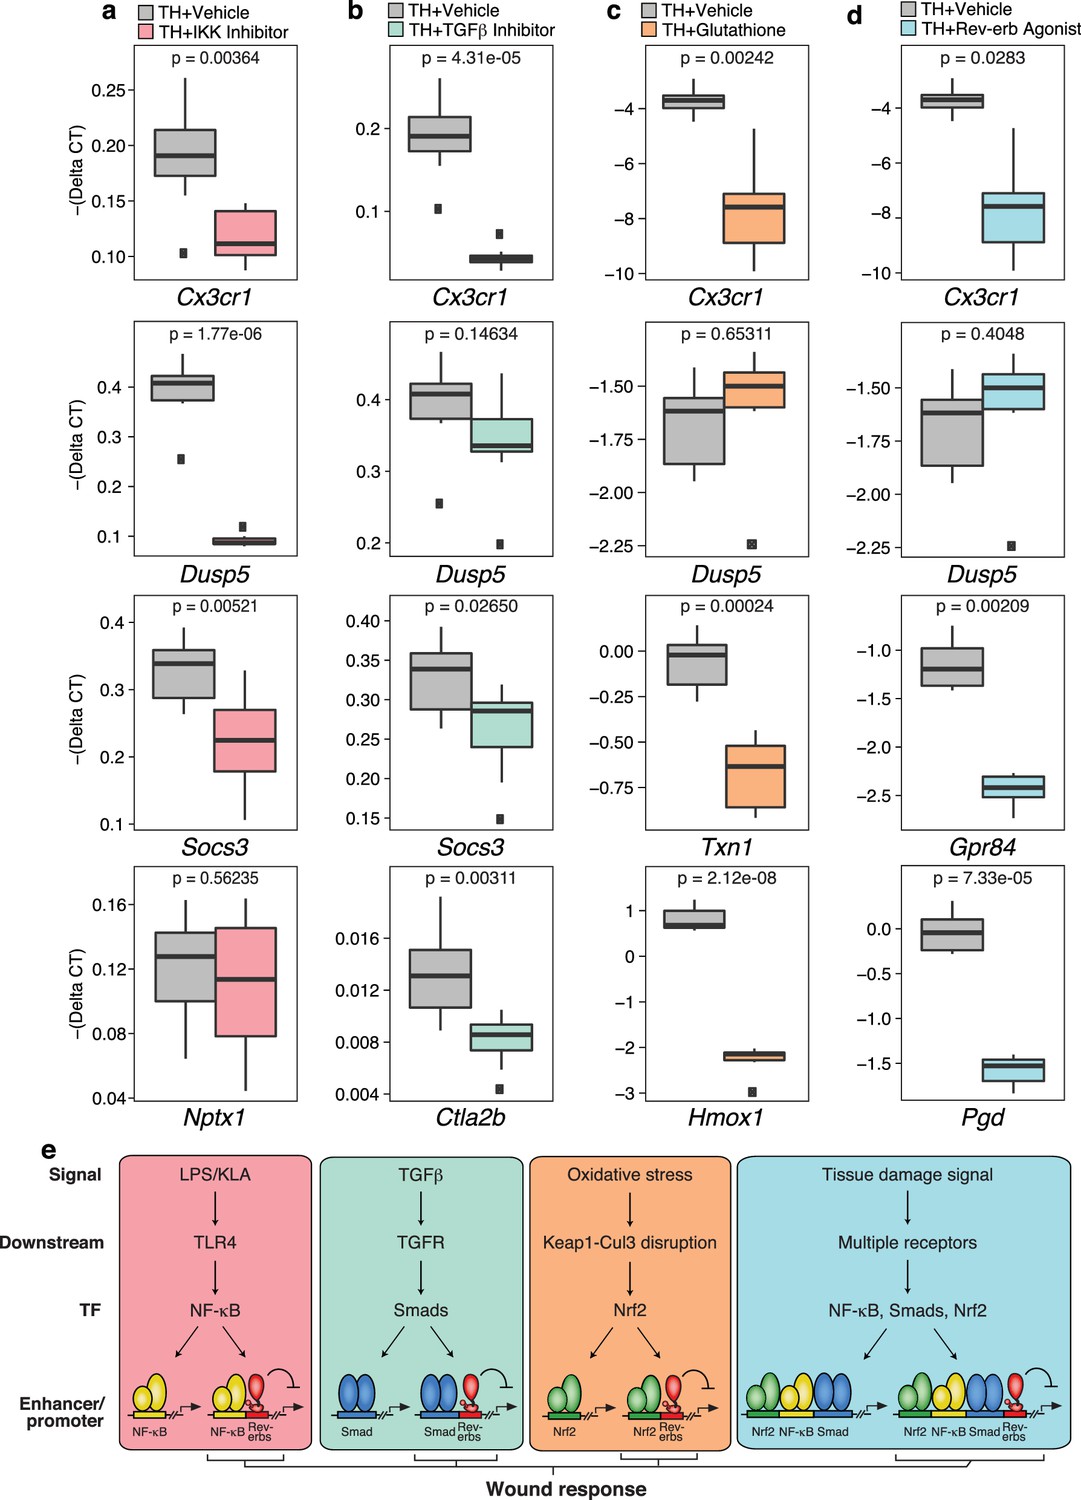
Chemical inhibition of multiple signal-dependent pathways results in decreased response to complex tissue homogenate signal.
(a) Box and whisker plots of expression values for genes as determined by RT-Q-PCR from bone marrow derived macrophages treated with tissue homogenate for 6 hr, and pre-treated for 1 hr with vehicle (gray) or 1 μM IKK inhibitor VII (pink). Y-axis shows RT-Q-PCR -(Delta CT), which is normalized to the housekeeping gene 36B4. Lower values indicate lower expression. N = 8 mice. P-values are shown comparing vehicle versus inhibitor treatment as determined by unpaired t-test. (b) Same as (a) but with pre-treatment for 1 hr with vehicle (gray) or 12.5 μM TGFβ inhibitor SB-43154 (green). N = 8 mice. (c) Same as (a) but samples were co-treated with tissue homogenate and vehicle (gray) or tissue homogenate and 15 mM glutathione (orange) for 6 hr. N = 6 mice. (d) Same as (a) but with pre-treatment for 1 hr with vehicle (gray) or 15 μM Rev-erb agonist SR-9009 (blue). N = 6 mice. (e) Working model showing that signal-specific stimuli (KLA/TGFβ/oxidative stress) activate their respective signal-dependent transcription factors NF-κB, Smads, and Nrf2, which bind to distinct sets of enhancers and promoters. Tissue damage signal activates all three factors simultaneously, which can co-occupy enhancers and promoters to generate a transcriptional response that is different than the sum of TGFβ, KLA, and oxidative stress mediated signaling. A subset of these sites that are co-bound and repressed by Rev-erbs are involved in regulating the macrophage response to wounding.
Download links
A two-part list of links to download the article, or parts of the article, in various formats.
Downloads (link to download the article as PDF)
Open citations (links to open the citations from this article in various online reference manager services)
Cite this article (links to download the citations from this article in formats compatible with various reference manager tools)
Tissue damage drives co-localization of NF-κB, Smad3, and Nrf2 to direct Rev-erb sensitive wound repair in mouse macrophages
eLife 5:e13024.
https://doi.org/10.7554/eLife.13024


