A deleterious Nav1.1 mutation selectively impairs telencephalic inhibitory neurons derived from Dravet Syndrome patients
- Novartis Institutes for BioMedical Research, United States
- Stanford University School of Medicine, United States
- University of California, San Francisco, United States
Figures
Figure 1 with 4 supplements

Impacts of the Nav1.1-p.S1328P mutation on channel expression and function.
(A) The p.S1382P mutation is located in Domain III Transmembrane Segment 4 (DIII-S4) of the human Nav1.1 protein. The corresponding DNA variant (c.3982T>C) was confirmed in patient-derived fibroblasts and induced pluripotent stem cells (iPSCs) by DNA sequencing. (B) hESCs (H9) were first differentiated into a homogeneous neuronal population via NgN2-induction and then transduced with lentiviral vectors to express mCherry-T2A-Nav1.1-F383S or mCherry-T2A-Nav1.1-F383S-S1328P under the control of a Doxycline (Dox) inducible promoter. The F383S variant makes the channels resistant to TTX. The mCherry reporter labels transduced neurons, and mCherry signal intensity correlated with Doxycline concentrations. (B) Comparing total expression between Nav1.1-F383S and Nav1.1-F383S-S1328P across two Dox concentrations by western blotting (WB). 12.5 µg of total membrane protein was loaded per sample lane, and the ubiquitous membrane protein Na/K ATPase was used as a sample loading control. Nav1.1 was not detected in untransduced NgN2 neurons. There is a non-specific high-molecular-weight band in all lanes in the Nav1.1 blot image. (C) Measurements of TTX-resistant INa reaveals impaired functional expression of the Nav1.1-F383S-S1328P mutant. By two-way ANOVA using Nav1.1 variants as factor 1 and Dox concentration as factor 2, F (1, 30) = 5.135 and p = 0.0308 between the peak amplitude of Nav1.1-F383S and Nav1.1-F383S-S1328P. See Table 1 for detailed analyses. (D) Comparing voltage-dependent activation and steady-state inactivation between Nav1.1-F383S and Nav1.1-F383S-S1328P. See Table 2 for curve fitting and statistical analyses. All error bars are standard errors of the mean.
-
Figure 1—source data 1
INa values quantified in Figure 1D, and g/gmax values quantified in Figure 1E.
- https://doi.org/10.7554/eLife.13073.003
Figure 1—figure supplement 1
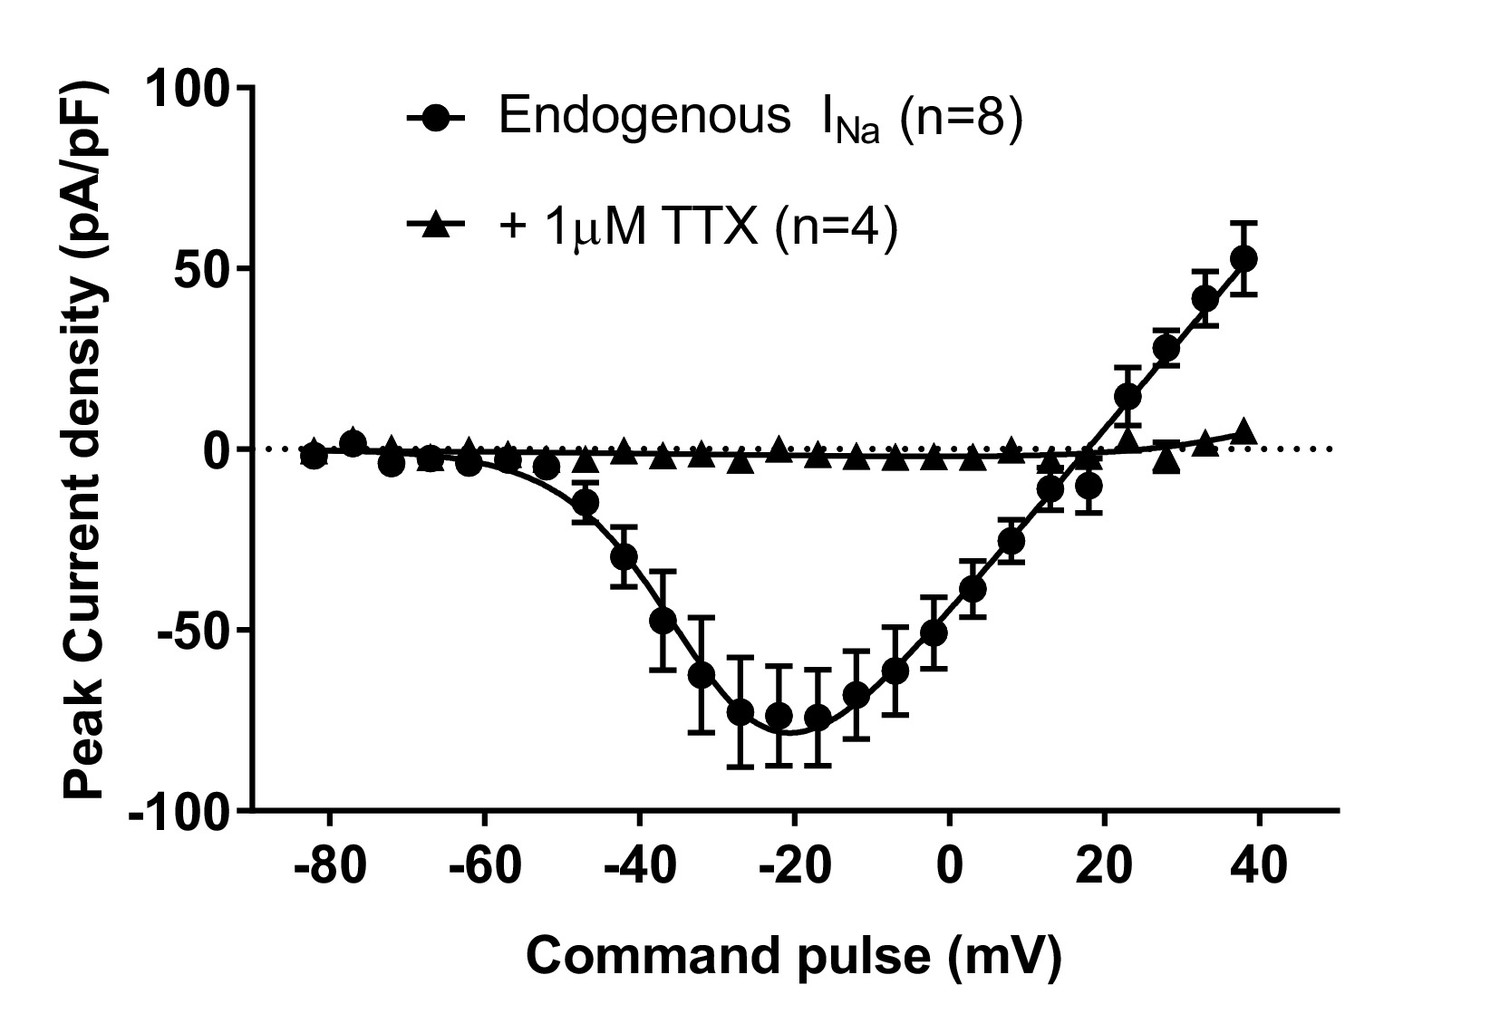
Endogenous voltage-dependent sodium currents (INa) of NgN2-induced human H9 neurons were completely blocked by 1-µM tetrodotoxin (TTX).
https://doi.org/10.7554/eLife.13073.004
Figure 1—figure supplement 2
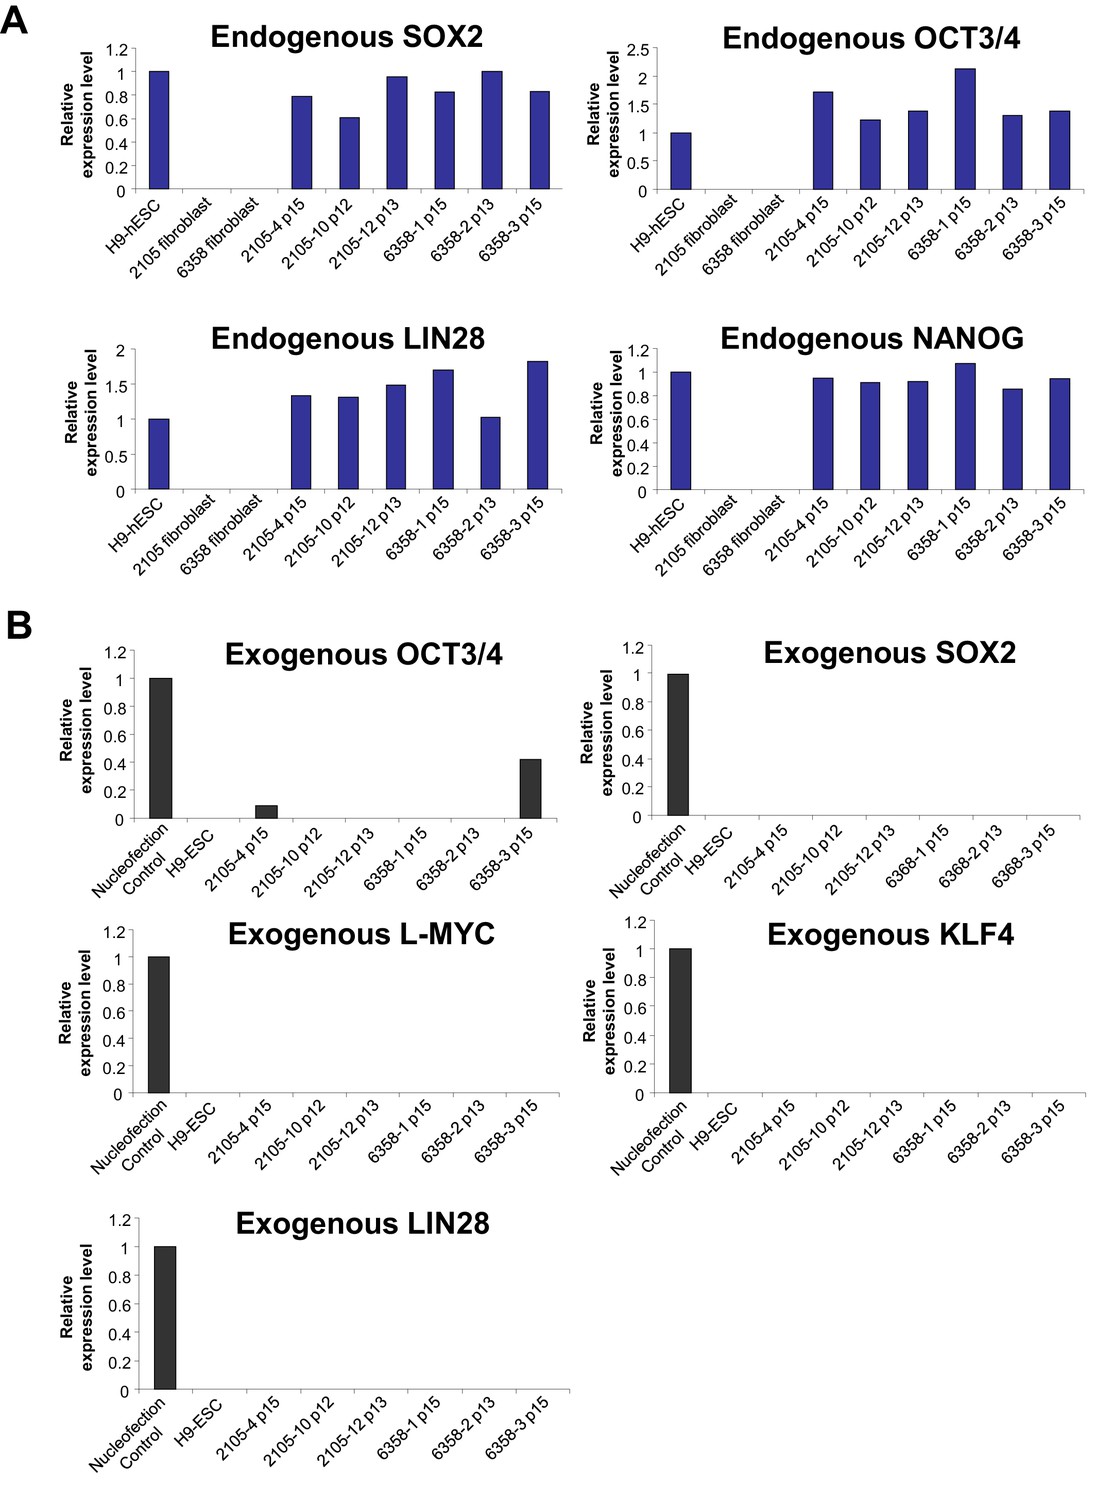
qPCR validation of the expression of endogenous pluripotency genes and silencing of episomal vectors in the Dravet-Syndrome iPSC lines.
(A) The mRNAs levels of endogenous SOX2, OCT3/4, LIN28 and NANOG in the iPSC lines were quantified and normalized relative to hESC line H9. (B) The amount of transcripts of the episomal reprograming vectors were quantified for the iPSC lines between passage number 12 and number 15, using human skin fibroblasts nucleofected with the same vectors as a positive control.
Figure 1—figure supplement 3
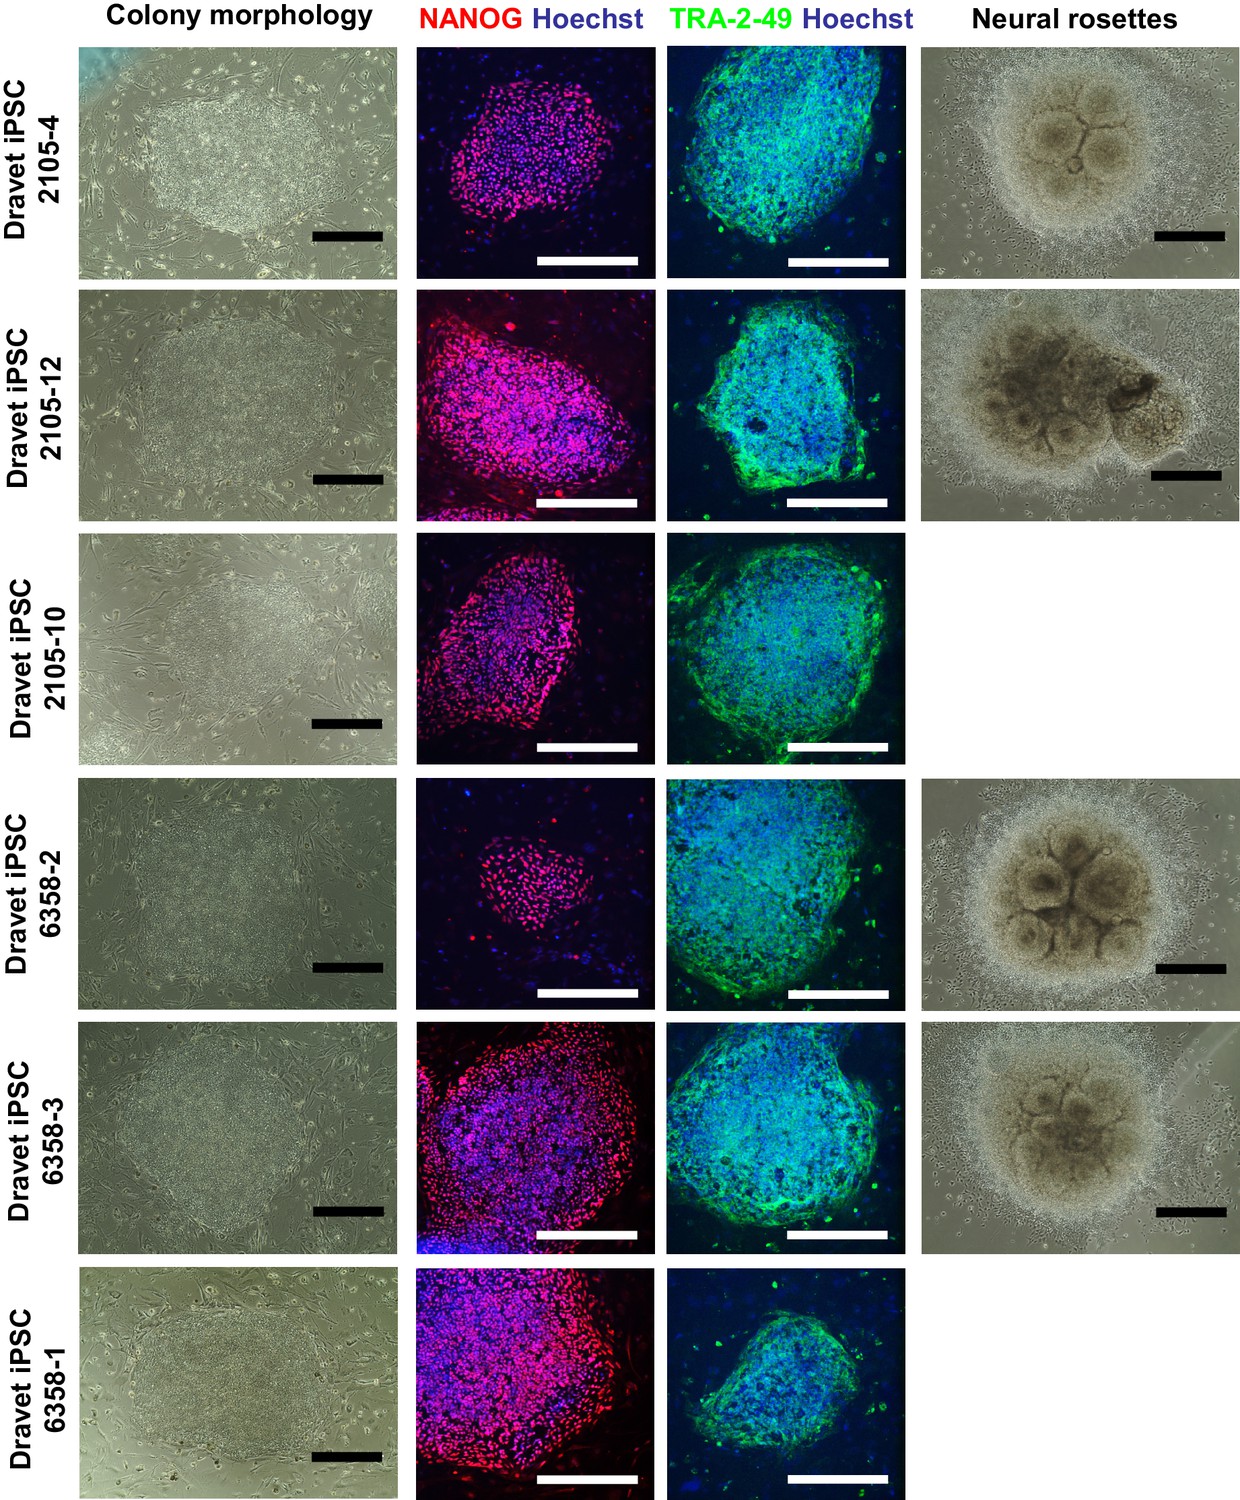
Further characterization of the Dravet-Syndrome iPSC lines.
The iPSC lines were examined for cell morphology, pluripotency markers (immunocytochemistry for NANOG and TRA-2-49), and the capacity to generate neural rosettes in directed neural differentiation. Two iPSC lines, 2105–10 and 6358–3, had poor neural rosette formation. All scale bars, 400 microns.
Figure 1—figure supplement 4
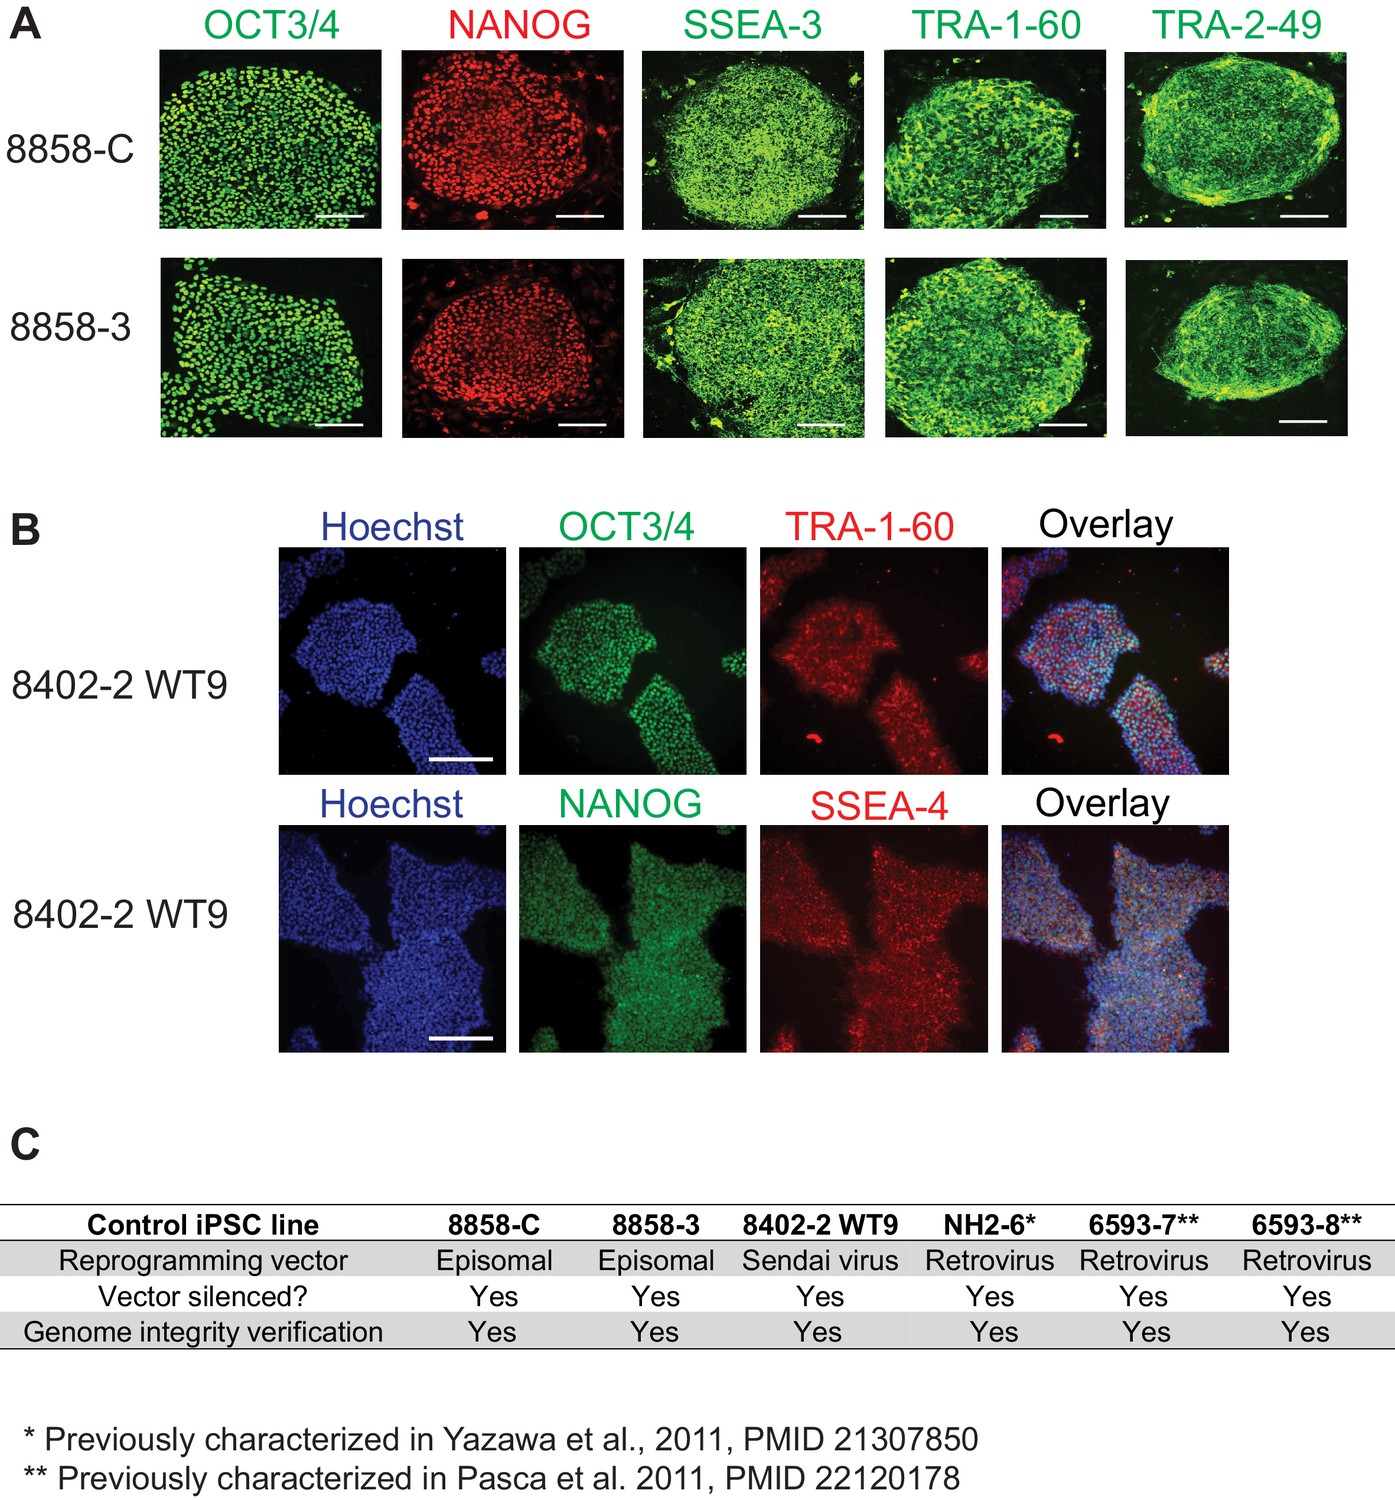
Characterization of control iPSC lines.
(A) Immunocytochemistry for pluripotency markers in control iPSC lines 8858-C and 8858–3. OCT3/4 and NANOG are localized to the cell nucleus; TRA-1-60 and SSEA-3 are localized to the cell surface; TRA-2-49 is localized in the cytoplasm. Scale bars, 200 microns. (B) Immunocytochemistry for pluripotency markers in control iPSC line 8402–2 WT9. Upper row, co-expression of pluripotent stem cell markers OCT3/4 (in green) and TRA-1-60 (in red). Lower row, co-expression of pluripotent stem cell markers NANOG (in green) and SSEA-4 (in red, cell surface localization). Scale bars, 200 microns. (C) Summary of characterizations of all control iPSC lines with regard to the silencing of reprogramming vectors and genome integrity.
Figure 2 with 2 supplements

Directed differentiation of human ESCs/iPSCs into telencephalic excitatory neurons and inhibitory neurons.
(A) Extrinsic factors and used to pattern the differentiation of ESCs/iPSCs into neural stem cells and progenitors of either dorsal telencephalic identity (top scheme) or ventral telencephalic and medial ganglionic eminence (MGE) identity (bottom scheme). (B) On Day 15 of differentiation, neural stem cells and progenitors were mechanically isolated in the form of neural rosettes. The rosettes were pooled per patterning scheme for RNA isolation and subsequently qRT-PCR analysis of the dorsal telencephalic marker PAX6 and ventral telecephalic markers GSH2, DLX2, LHX6 and NKX2.1. The bar graph represents three experiments in the control hESC line H9, with each experiment pairing a ventral patterning scheme with a dorsal patterning scheme. (C) Immunostaining of neural rosettes to examine protein expression of PAX6, NKX2.1, and FOXG1 (a general telencephalic marker) in neural stem cells and progenitors generated from the two patterning schemes, respectively.
Figure 2—figure supplement 1
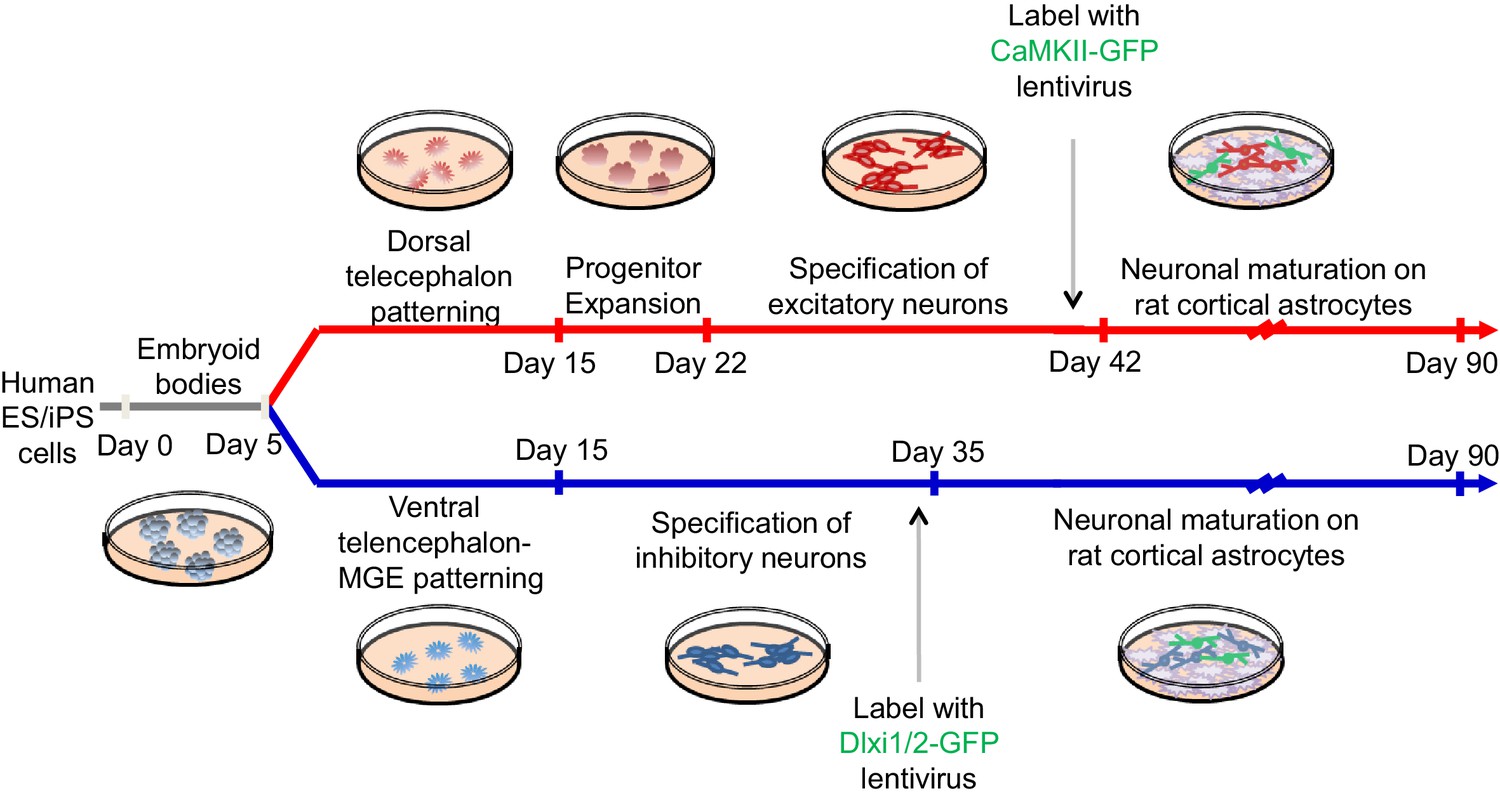
A schematic description of the experimental protocol to differentiate human pluripotent stem cells into telencephalic excitatory neurons and inhibitory neurons in parallel.
https://doi.org/10.7554/eLife.13073.013
Figure 2—figure supplement 2
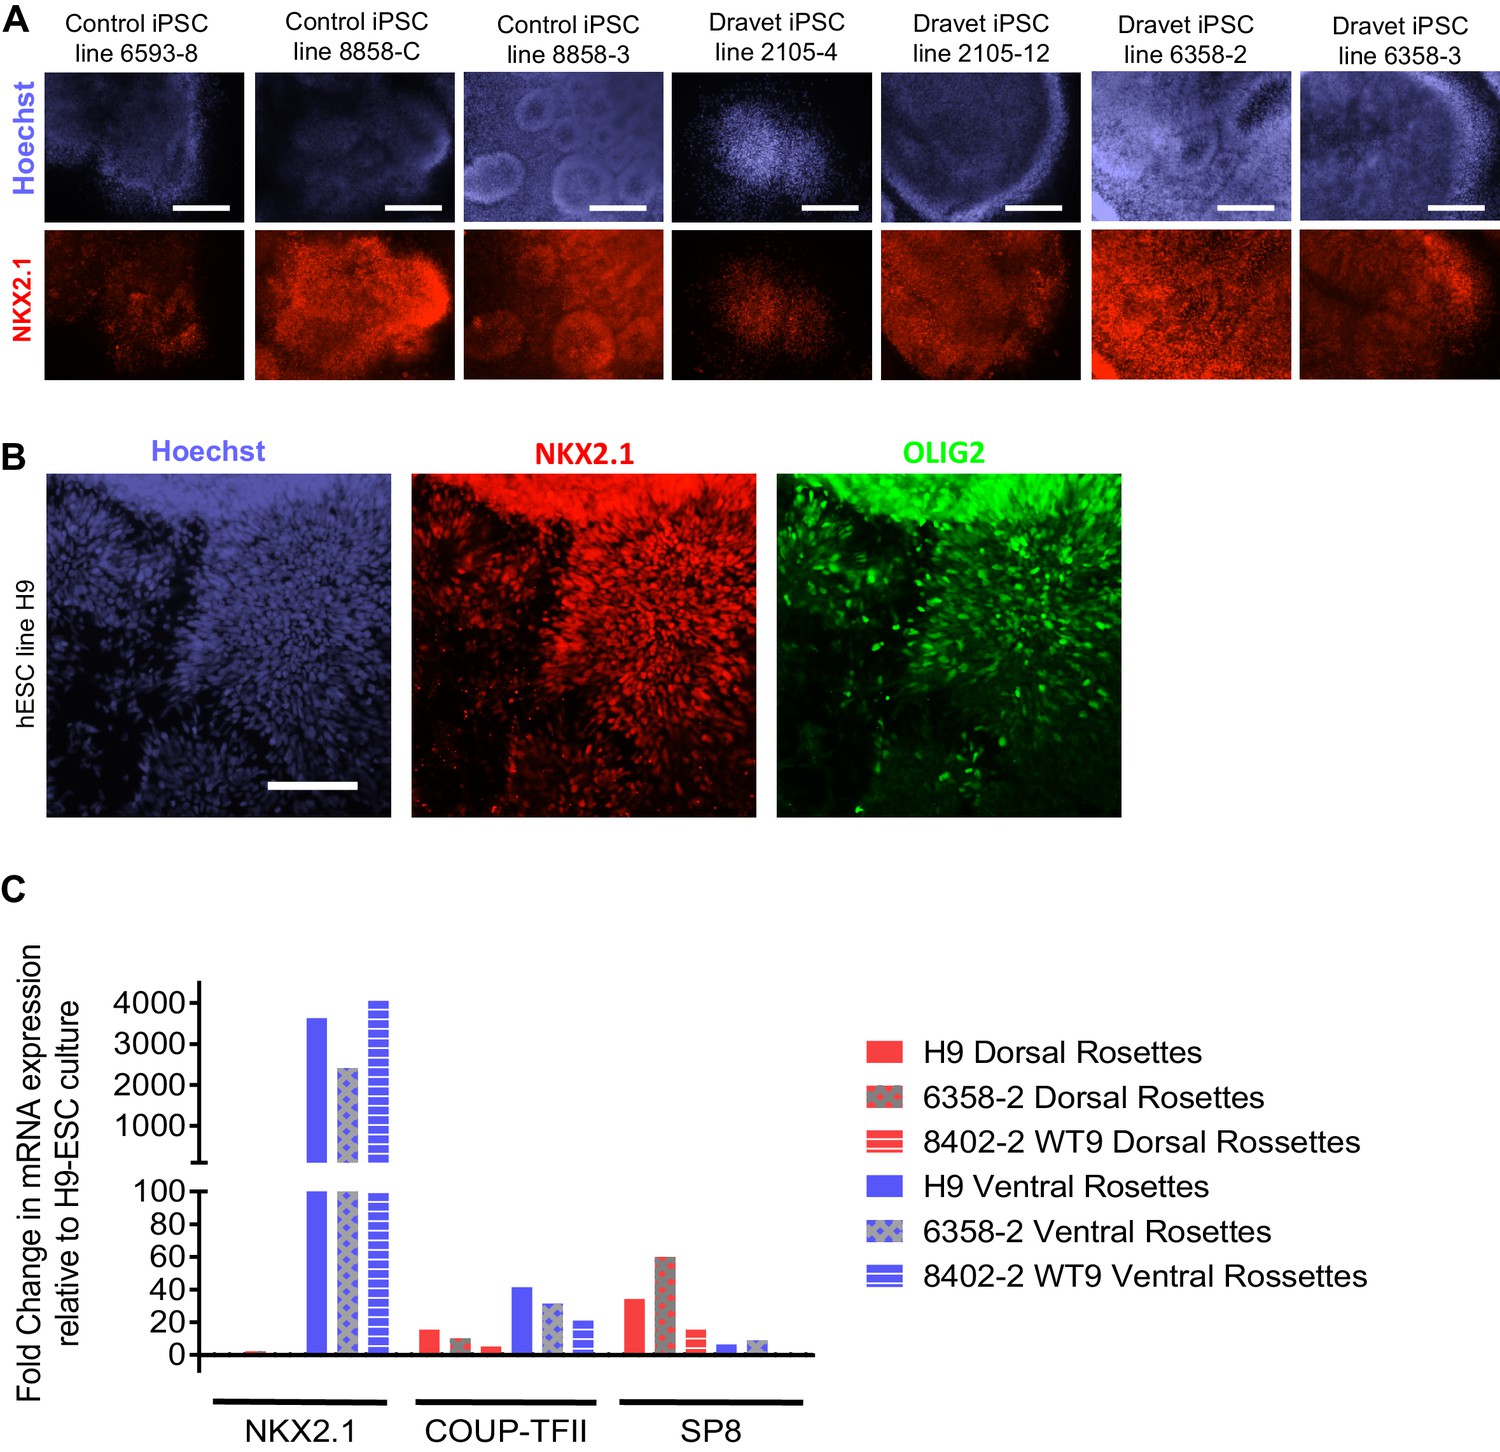
Additional characterization of the ventral telencephalon-MGE induction protocol.
(A) NKX2.1 protein expression was examined by immunocytochemistry in ventral telencephalic neural rosettes derived from a number of control and Dravet iPSC lines. Scale bars, 200 microns. (B) OLIG2 protein expression overlaps with NKX2.1 in ventral telencephalic progenitors derived from the hESC line H9. Scale bar, 100 microns. (C) Comparing NKX2.1, COUP-TFII and SP8 mRNA expression between dorsal and ventral telencephalic neural rosettes derived from control hESC line H9, Dravet iPSC line 6358–2, and Control iPSC line 8402–2 WT9. Data were quantified by the delta-delta Ct method, using GAPDH as the reference gene and undifferentiated H9 ESCs as the baseline control. It is known that SP8 is weakly expressed in progenitors of excitatory neurons in the developing dorsal telencephalon (Ma et al., 2015), which likely corresponds to the detection of SP8 in the dorsal rosette samples in this experiment. The samples represent two neural differentiation experiments (one for H9 and 6358–2 and one for 8402–2) that were independent of those described in Figure 2.
Figure 3 with 4 supplements

Characterization of telencephalic excitatory neurons and inhibitory neurons differentiated from human ESCs/iPSCs.
(A) An example for the immunostaining of the inhibitory neurotransmitter GABA (in green) and general neuronal marker MAP2 (in red) in differentiated inhibitory neurons (top) and excitatory neurons (bottom). The cell line in the images is hESC-H9. Scale bars, 50 microns. (B) Representative images showing a Calretinin+ GAD67+ inhibitory neuron and a Somatostatin+ GABA+ inhibitory neuron. The cell line in the images is hESC-H9. (C) Percentage of Calretinin+ or Somatostatin+ inhibitory neurons from differentiation of hESC-H9 and control iPSC line 8858-C. (D) In inhibitory neuron cultures the expression of lentiviral reporter Dlxi1/2b-GFP overlapped with GABA immunostaining; on the contrary, in excitatory neuron cultures, CaMKII-GFP labeling and GABA immunostaining were mutually exclusive. Scale bars, 20 microns. (E) Around 65% of Dlxi1/2b-GFP+ neurons were stained positive for GABA. Data represent two control iPSC lines 8858-C and 6593–7. (F) By single-cell RT-PCR paired with patch clamp recording, around 70% of Dlxi1/2b-GFP neurons express either GAD65 or GAD67, markers of inhibitory neurons. Data represent all Control (upper pie chart) and Dravet Syndrome (lower pie chart) pluripotent stem cell lines examined in this study. (G) Representative traces showing time-dependent maturation of the action potential firing pattern in inhibitory neurons. The cell line in this example is control iPSC 8858–3. (H) An example for the isolation of Gabazine-sensitive, spontaneous inhibitory synaptic currents (sIPSCs, insets in blue) and NBQX-sensitive, spontaneous excitatory synaptic currents (sEPSCs, insets in red) in cultures of differentiated inhibitory neurons. The detection of sEPSCs reflects the presence of a small fraction of excitatory neurons which likely arise from the low-percentage of PAX6+ progenitors in the ventral telencephalon patterning protocol (Figure 2C). The cell line in this example is Dravet iPSC 6358–3. (I) Visualization of a hESC-H9-derived inhibitory neuron engrafted to the CA3 region of a rat hippocampal slice and co-cultured with the slice for 2 months. The human neuron was labeled with the lentiviral vector pLenti-Syn1-ChR2(H134R)-YFP. Rat neurons were visible by Ankyrin-G immunostaining (in red). Scale bar, 25 microns. (J) Under 470-nm light pulses, Gabazine-sensitive inhibitory postsynaptic currents (IPSCs, top trace) were detected in a rat neuron on a hippocampal slice engrafted with ChR2-YFP-expressing, hESC-H9-derived inhibitory neurons. Each trace represents the average of 20 consecutive trials (light pulses).
Figure 3—figure supplement 1
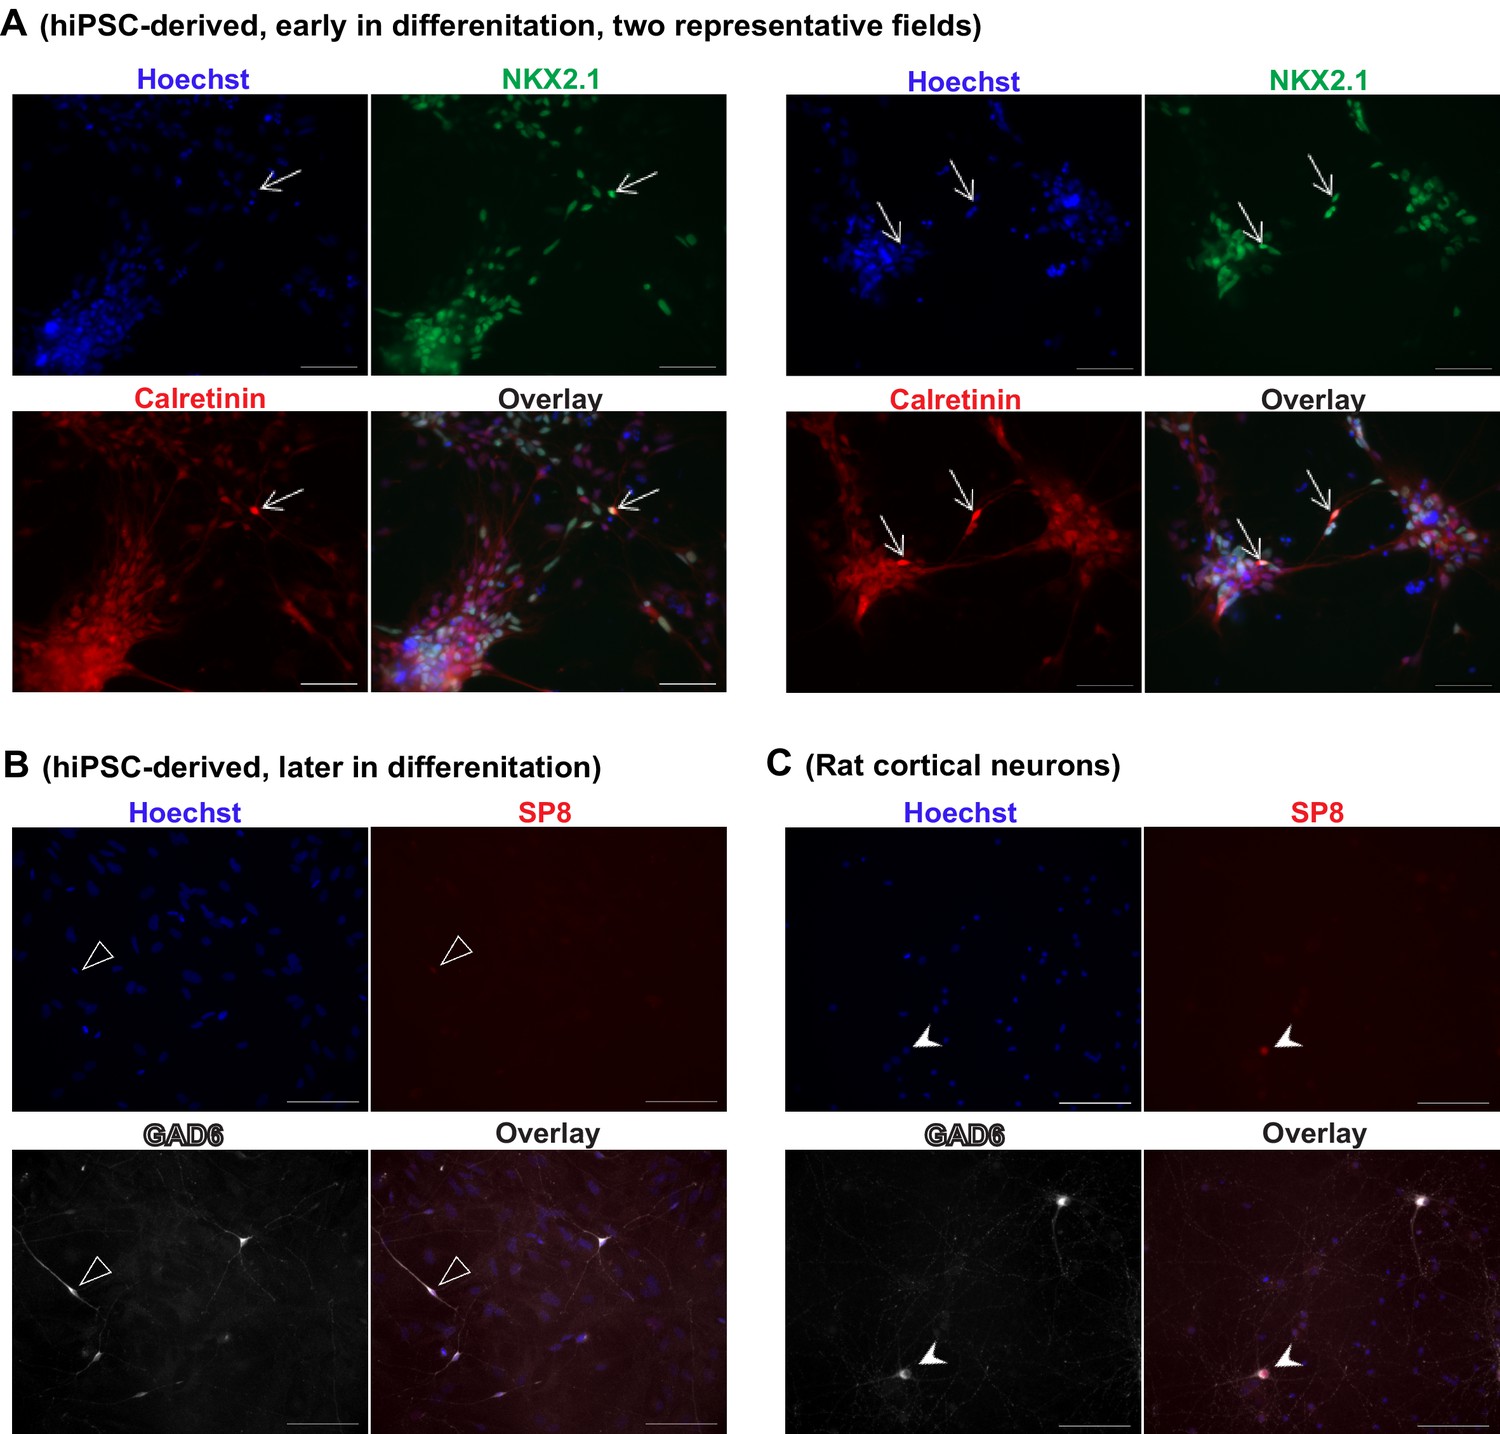
iPSC-derived MGE-like progenitors and neurons co-express Calretinin during differentiation.
(A) Inhibitory neuron cultures derived from control iPSC line 8402–2 WT9 were fixed before plating onto rat astrocytes and stained for NKX2.1 (in green, using Novacastra antibody TTF‐1‐L‐CE), Calretinin (in red, using Swant antibody 7697) and nuclei (Hoechst, in blue). The arrows point to cells with neuronal morphology and co-expressing NKX2.1 and Calretinin. Scale bars, 50 microns. (B) The cells described in (A) were further differentiated in the presence of rat astrocytes and stained for GAD67 (in white, using EMD Millipore antibody AB5406) and SP8 (in red, using Sigma antibody HPA054006). In a total of 199 GAD67+, neuronal-looking cells that we analyzed, 81% (161 out of 199) was negative for SP8 staining, and the remaining 19% (38 out of 199) showed a very weak signal (one example shown in (B), highlighted by open arrow head). Scale bar, 100 microns. (C) As a positive control for SP8 detection, we examined primary cultures of rat cortical neurons (three weeks in vitro) in the same experiment under identical staining and imaging conditions. Robust SP8 staining was seen in a subpopulation of GAD67+ inhibitory neurons (arrow head). Scale bar, 100 microns. Because the mutually exclusive expression of SP8 and NKX2.1 distinguishes between the CGE- and MGE-origin of inhibitory interneurons, this set of supplementary data further support that the human iPSC-derived inhibitory neurons in this study mostly resemble a MGE origin, and that Calretinin expression may arise in MGE-lineage inhibitory neurons within the time scale of the study.
Figure 3—figure supplement 2
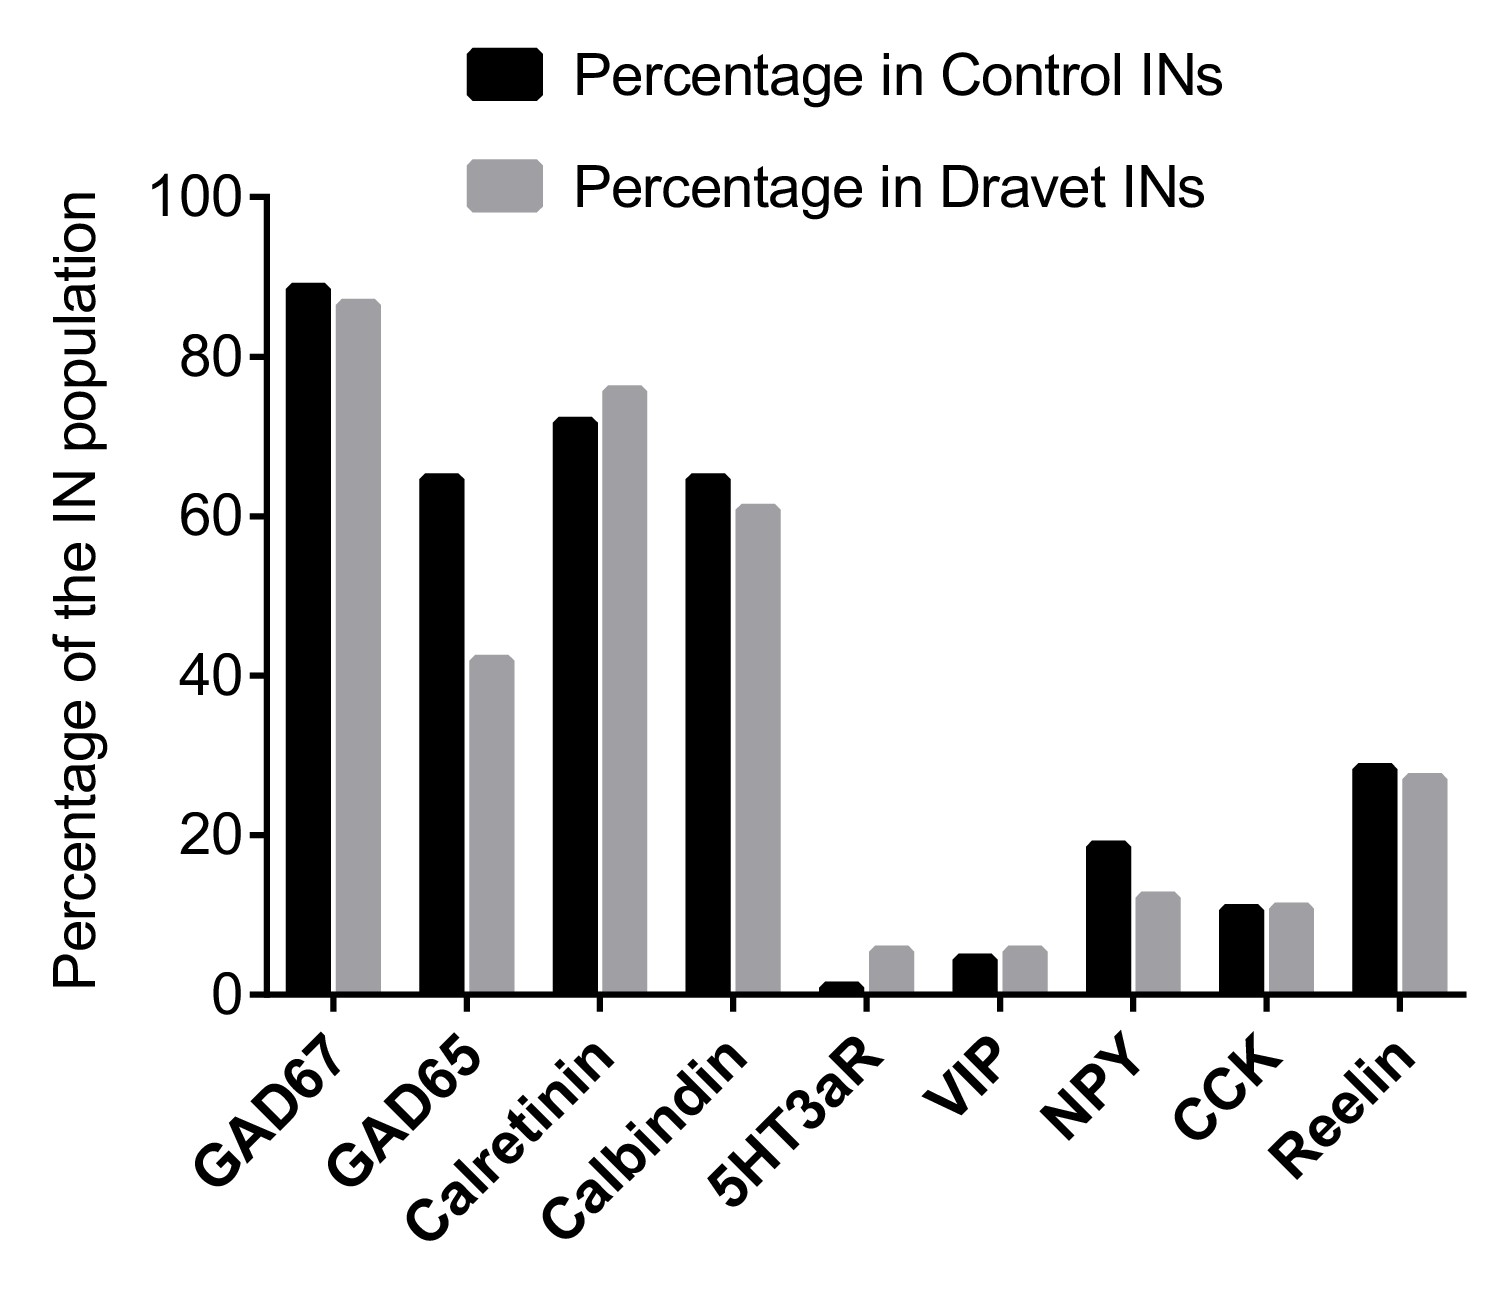
Single-cell RT PCR to examine caudal ganglionic eminence-related interneuron markers.
For inhibitory neurons (INs, defined by expression of either GAD67 or GAD65) that we examined for sodium currents and action potential firing (see Figure 4 and Figure 5), we analyzed an extended panel of genes whose expression are known to be present in CGE-lineage inhibitory interneurons. Among the genes, 5HT3aR is specific to all CGE-derived interneurons; Calretinin, VIP, NPY, CCK, and Reelin are expressed in various fractions of CGE derived interneurons but can also be found in subpopulations of MGE-derived interneurons (Rudy et al., 2011; Lee et al., 2010 ; Vucurovic et al., 2010 ); Calbindin is primarily present in MGE derived interneurons but is also found in a small fraction of CGE-derived interneurons that often co-express NPY (Vucurovic et al., 2010; Fogarty et al., 2007).
Figure 3—figure supplement 3
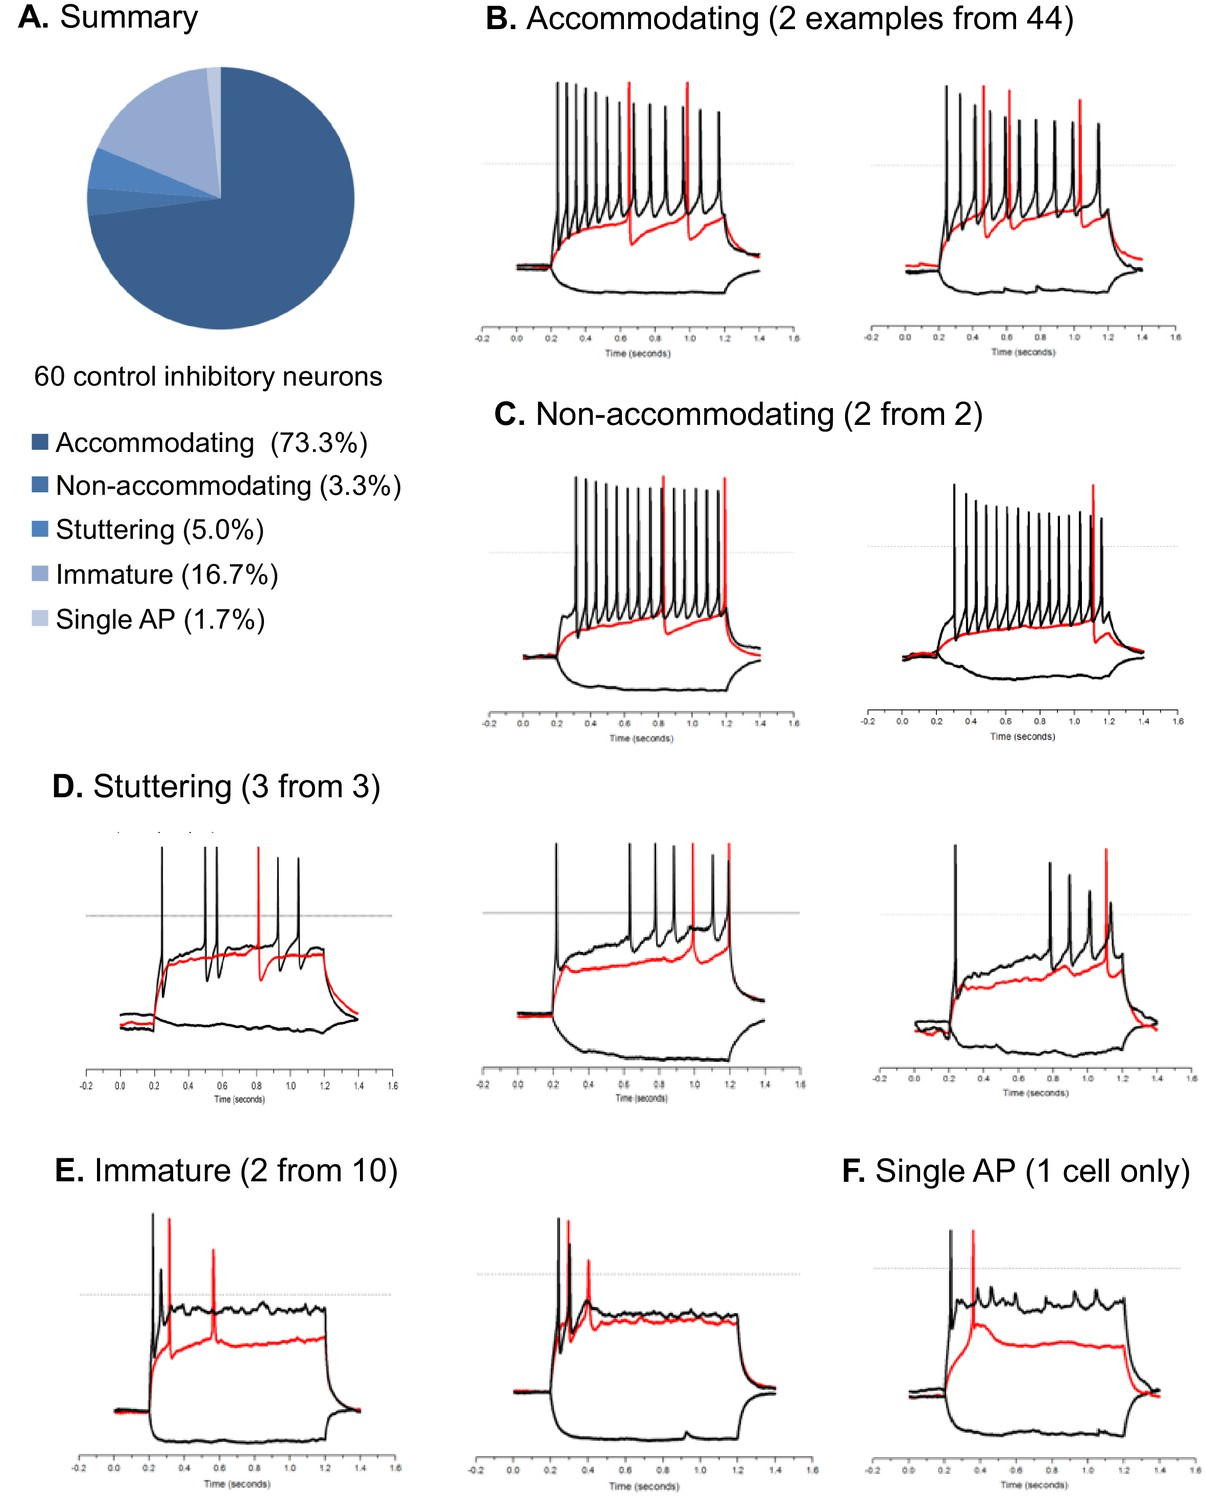
Action potential firing patterns of hESC/iPSC-derived inhibitory neurons.
The pool of inhibitory neurons (n = 60) in this analysis were derived from hESC-H9 and control iPSC lines and co-cultured with rat astrocytes until around Day 90. Illustrated here are current clamp traces at the threshold current injection (i.e. the rheobase, in red) and at a supra-threshold current that is two or three times of the threshold current (in black). We also plotted the response to a−10 pA hyperpolarizing current (downward trace in black). All current injections are 1000-msec long. By their supra-threshold firing patterns, the inhibitory neurons are classified as accommodating, non-accomodating, stuttering, immature, and single-AP. Panel (A) is a pie chart summary of the percentage representation of the five patterns. Panels (B) through (F) are representative neurons for each pattern.
Figure 3—figure supplement 4
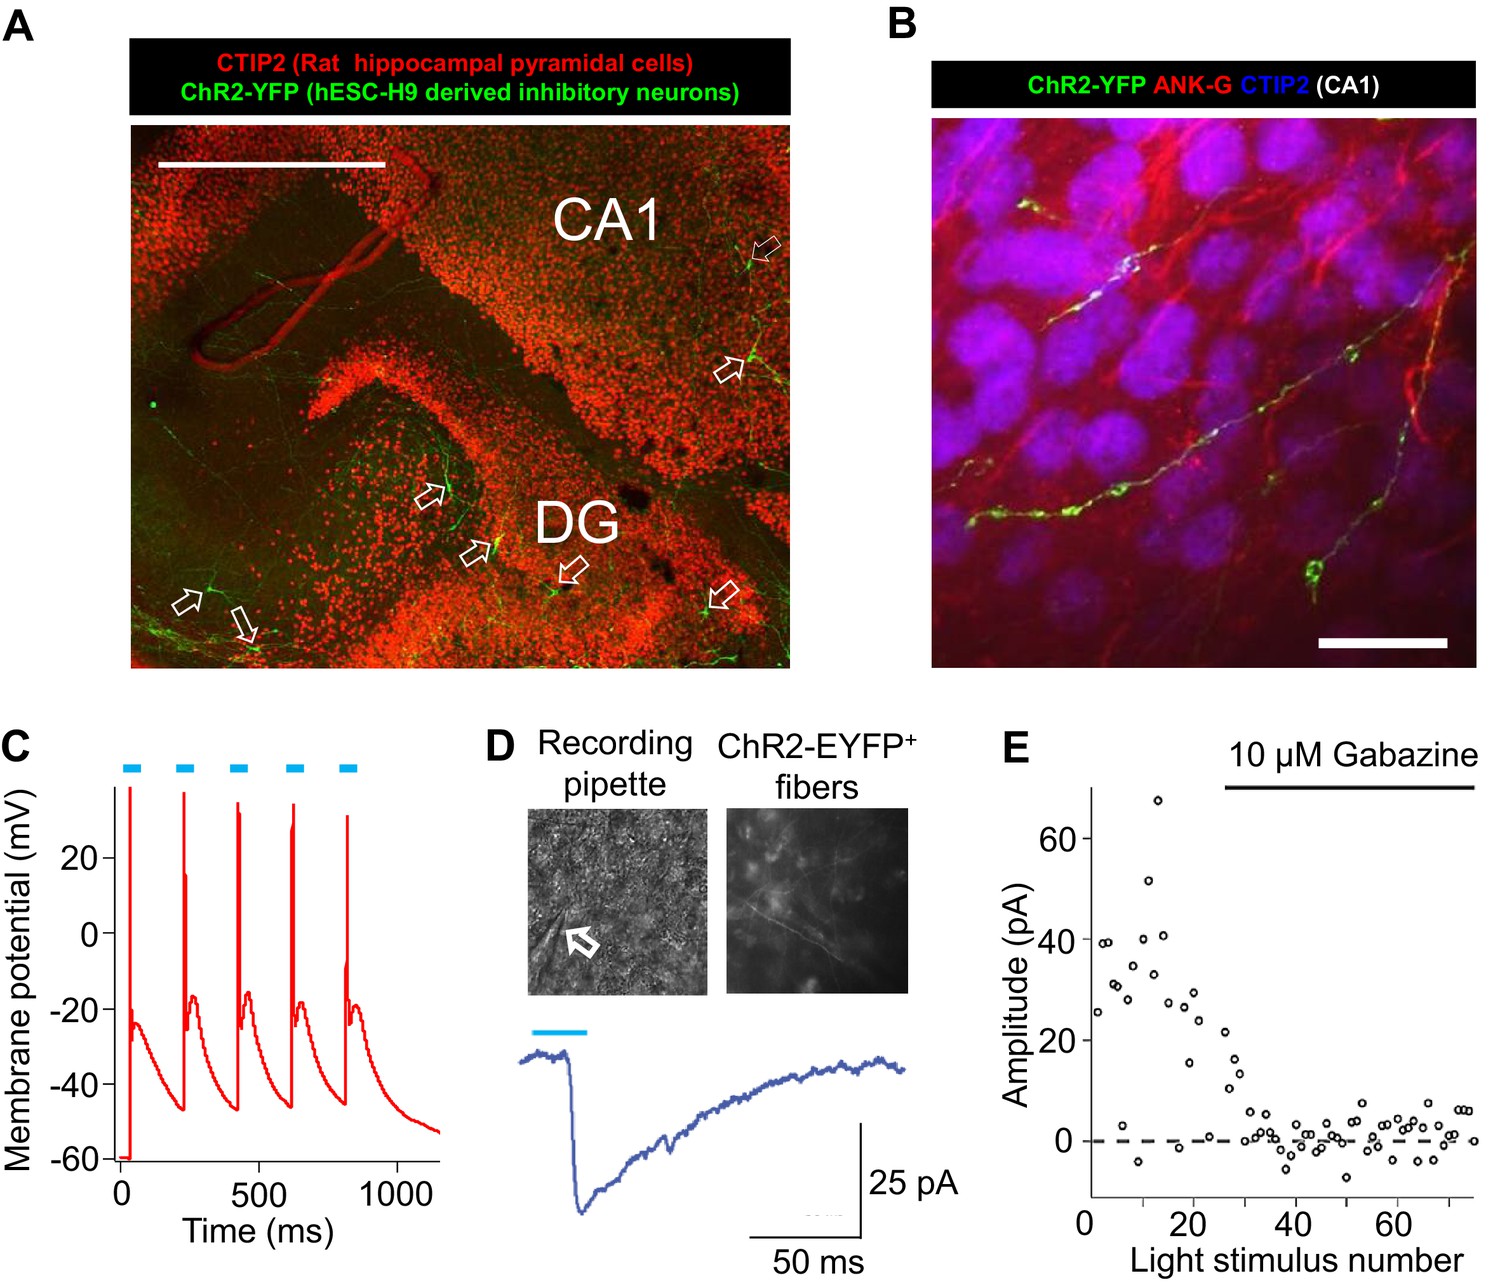
Integration of hESC-H9 derived inhibitory neurons into rat hippocampal organotypic slices.
(A) A low-magnification view of a hippocampal slice stained for CTIP2 (red, labeling excitatory pyramidal cells in the dentate-gyrus and CA1) and EYFP (green, labeling H9-derived and ChR2-EYFP-labeled inhibitory neurons, highlighted by unfilled arrows). Scale bar, 200 microns. (B) Bouton-like terminals of ChR2-EYFP-labeled human inhibitory neurons distributed over a cluster of rat CA1 pyramidal cells. Ankyrin-G (ANK-G, red) staining indicated the axon initial segments of the pyramidal cells. Scale bar, 25 microns. (C) Evoking action potentials by blue light pulses in an engrafted human inhibitory neuron. (D) Patch clamp recording of blue-light evoked inhibitory postsynaptic current (IPSCs) in a rat neuron in the vicinity of ChR2-EYFP-positive processes from an engrafted human inhibitory neuron. The arrow points to the patch clamp pipette. (E) IPSCs in response to repeated blue-light stimulation, without or with the GABAA receptor antagonist Gabazine (10 µM).
Figure 4 with 2 supplements
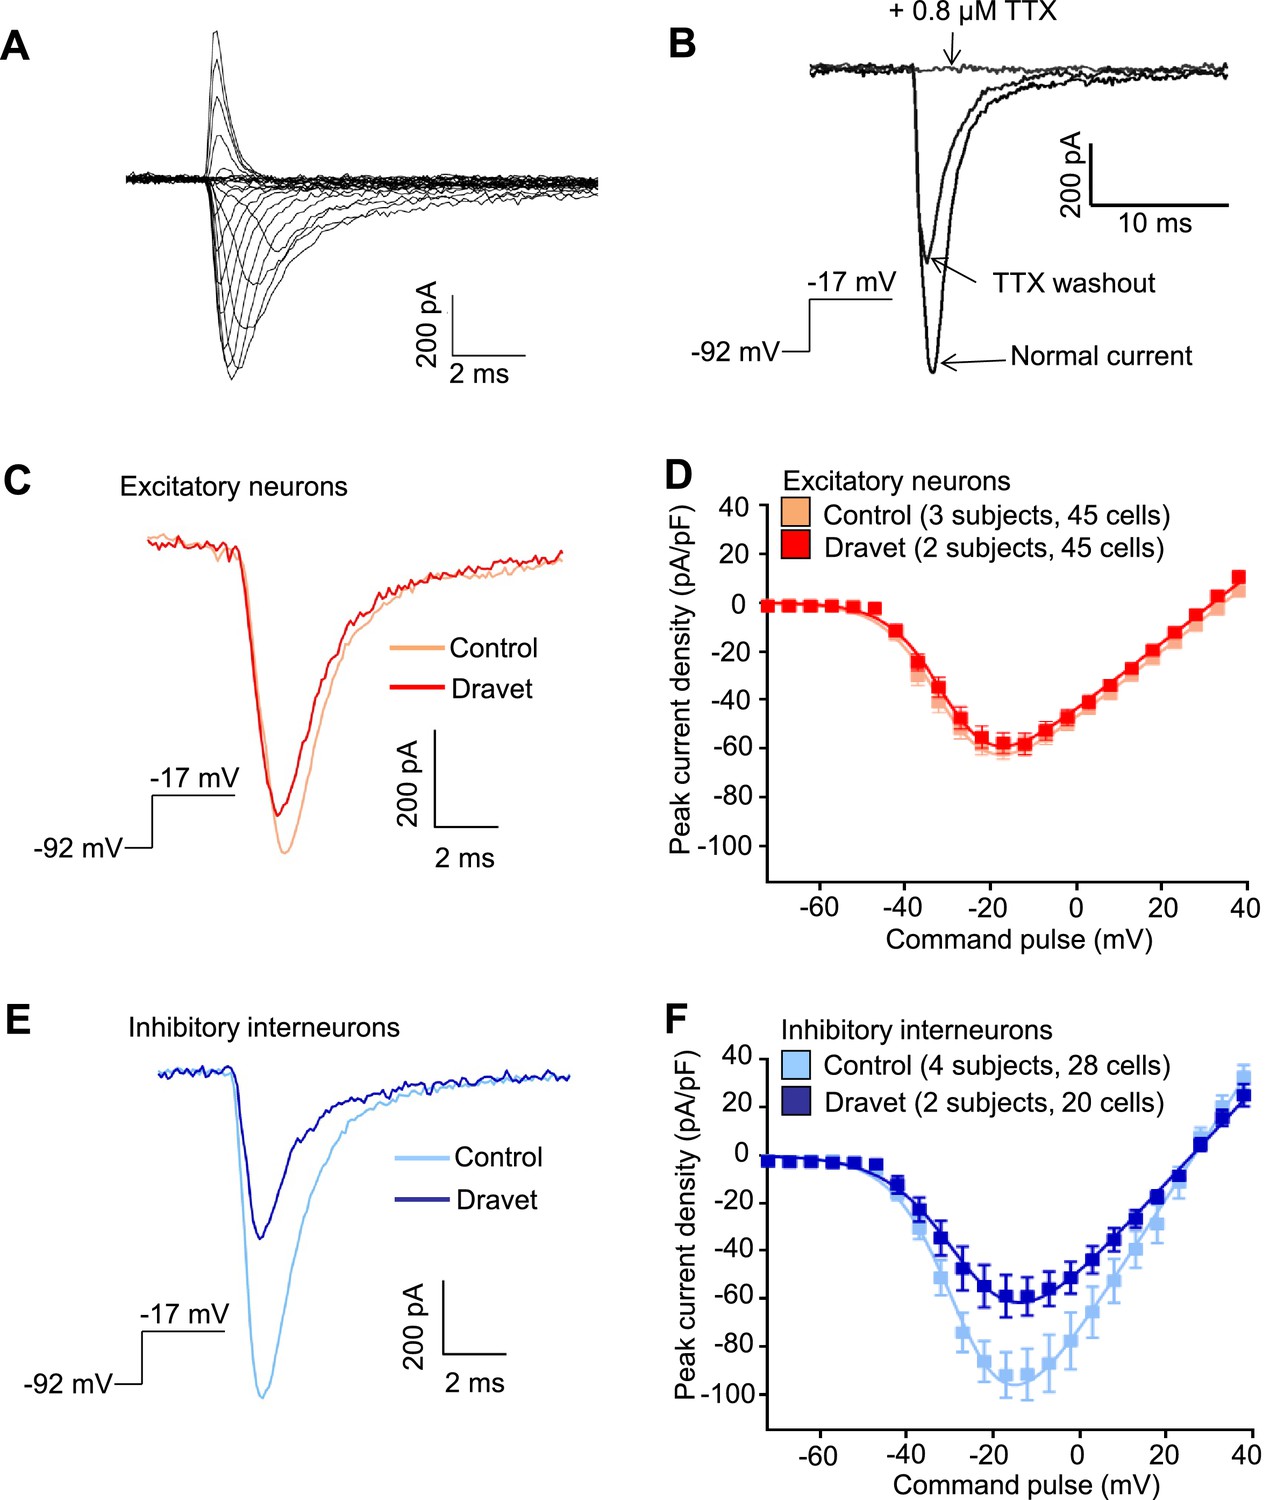
Voltage-dependent Na+ currents (INa) were reduced in telencephalic inhibitory neurons but not excitatory neurons derived from Dravet Syndrome iPSCs.
(A) An example of INa measured in an inhibitory neuron derived from a control iPSC line. The membrane depolarization steps were set between -92 mV and a range of values starting from -72 mV and ending at +38 mV, with 5 mV/step increments. (B) Complete blockade of INa by 0.8 µM TTX. (C and D) INa was indistinguishable between control and Dravet excitatory neurons. The example INa traces in (C) were selected to represent the median values of all control excitatory neurons and all Dravet excitatory neurons, respectively. The current trace from the Dravet neuron was scaled relative to the control neuron according to whole-cell capacitance values. Panel (D) describes the current-voltage (I-V) relationships in control (n = 45 cells, 3 subjects) and Dravet (n = 45 cells, 2 subjects) excitatory neurons. p = 0.8225 by t-test of the maximal INa amplitude. (E and F) INa amplitude was reduced in Dravet inhibitory neurons relative to control inhibitory neurons. The example INa traces in (E) were selected the same way as in (C). Panel (F) describes the I-V relationships of control (n = 28 cells, 4 subjects) and Dravet (n = 20 cells, 2 subjects) inhibitory neurons. p = 0.034 by t-test for the maximal INa amplitude. All error bars are standard errors of the mean. See Table 3 for detailed statistical analysis.
-
Figure 4—source data 1
INa values quantified in Figure 4D and F.
- https://doi.org/10.7554/eLife.13073.021
Figure 4—figure supplement 1
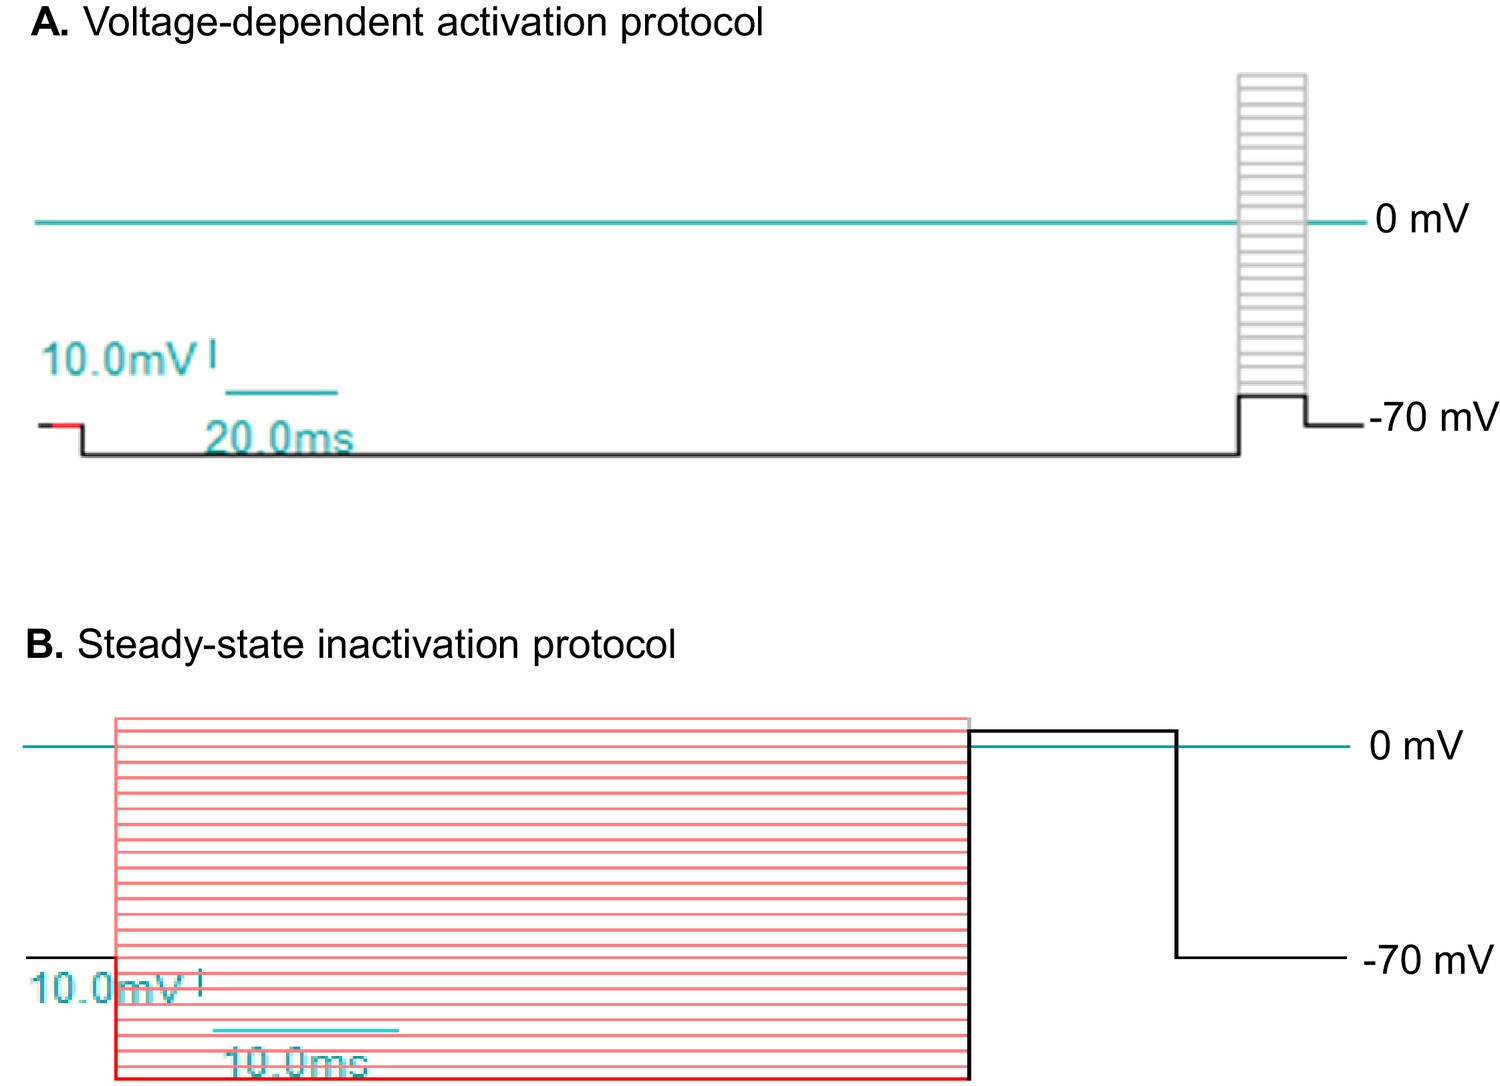
Voltage protocols to study sodium currents (INa) in human ESC/iPSC derived neurons.
(A) The protocol for voltage-dependent activation of INa. The holding potential is at −70 mV. A 200 ms hyperpolarizing pulse to -80 mV resets channel availability close to 100%. The step-wise test potentials span the range from -60 mV to +50 mV, with 5 mV increments. Each test potential is 17 ms. (B) The protocol for steady-state inactivation of INa. The holding potential is at -70 mV. The step-wise conditioning potentials, which last 50 ms and set the steady state, span the range from -110 mV to +10 mV, with 5 mV increments. The constant test potential is at +5 mV. The voltage values here are commands to the patch clamp electrode without corrections for liquid junction potential.
Figure 4—figure supplement 2
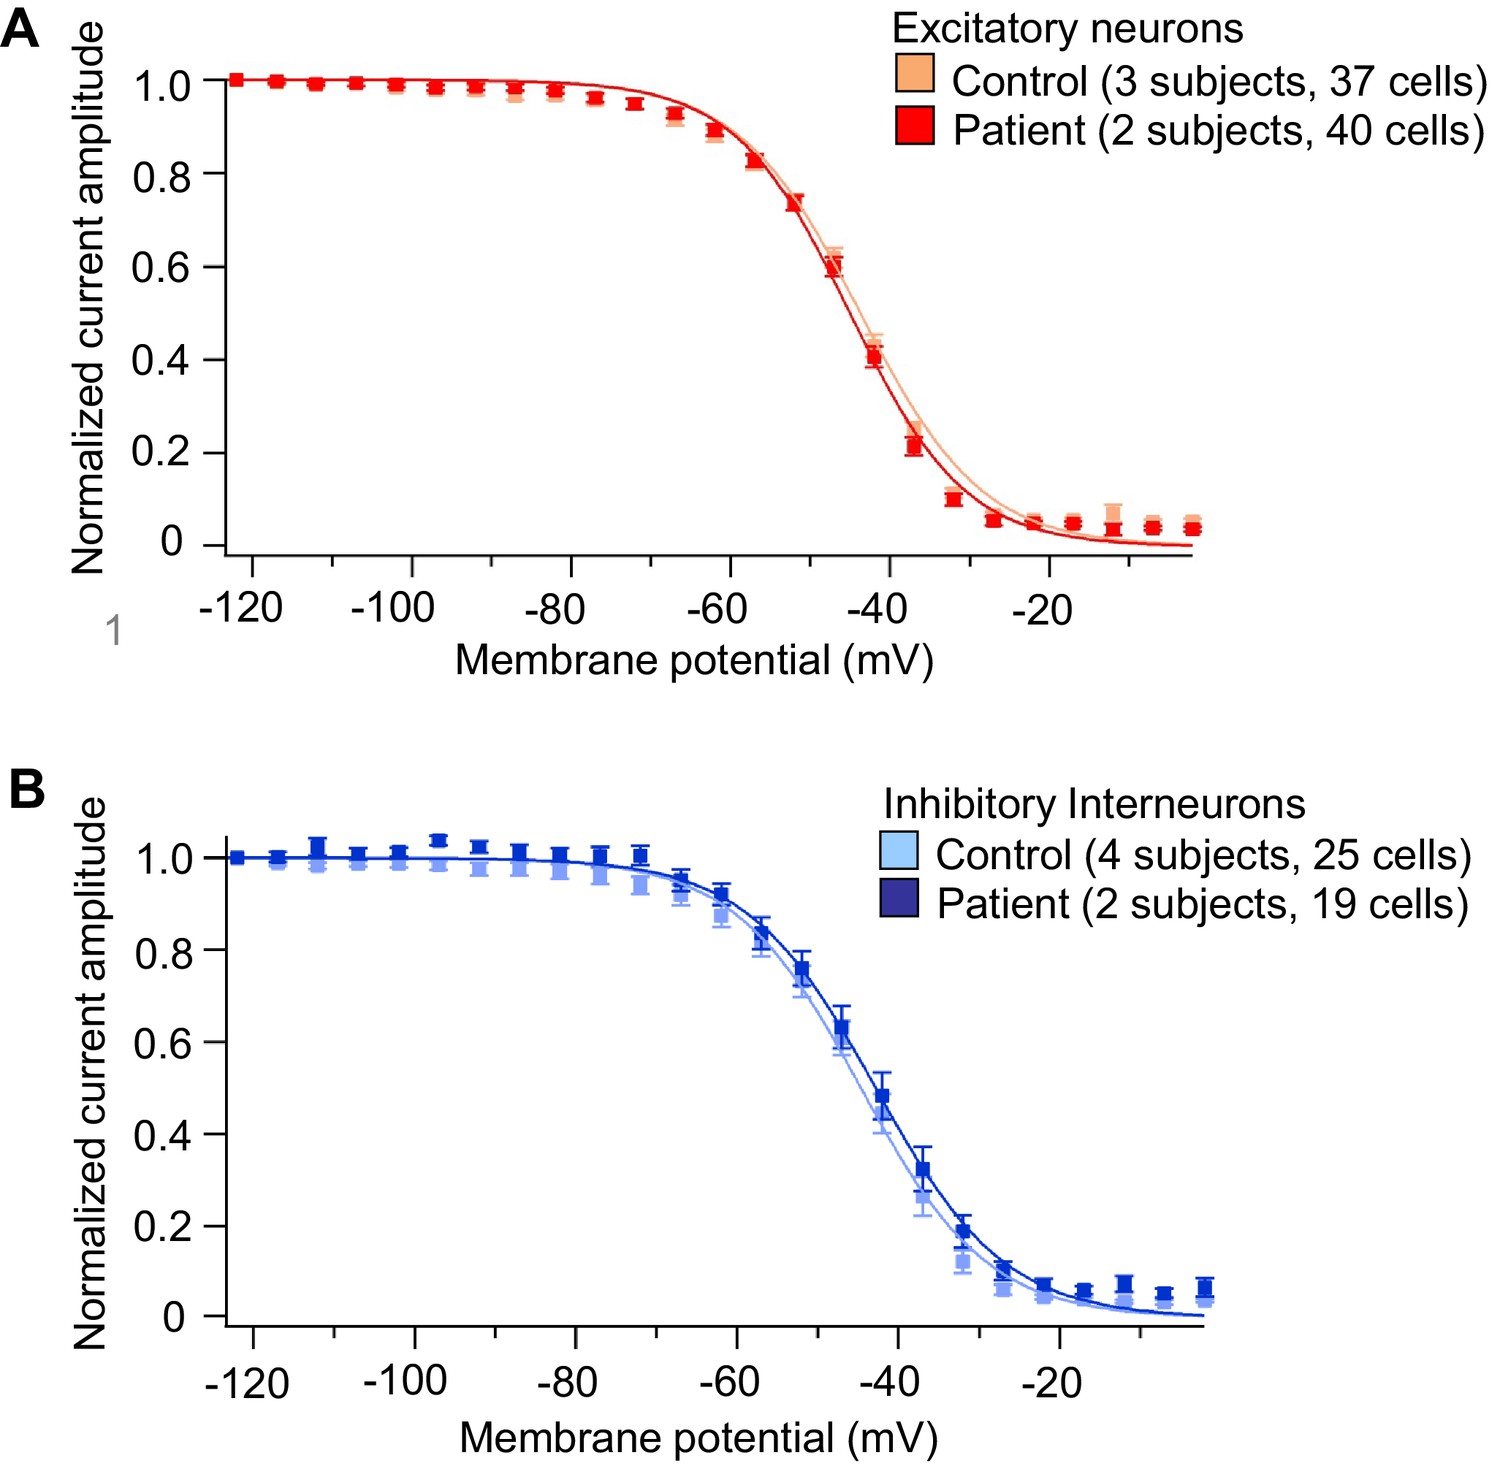
Voltage-dependent INa steady-state inactivation in iPSC-derived neurons was similar between the control subjects and Dravet Syndrome patients.
(A) Voltage-dependent INa inactivation in control and Dravet excitatory neurons. (B) Voltage-dependent INa inactivation in control and Dravet inhibitory neurons. In both (A) and (B), p>0.05 by t-test for the half-inactivation potential (V1/2) between control and Dravet samples. See Table 4 for detailed statistical analysis. All error bars are standard errors of the mean. The curves were generated by curve fitting for the mean values of each experimental group using the equation I=1/(1+exp((V- V1/2')/a')) (see Materials and methods).
-
Figure 4—figure supplement 2—source data 1
Measurement of INa steady-state inactivation in each neuron.
- https://doi.org/10.7554/eLife.13073.024
Figure 5
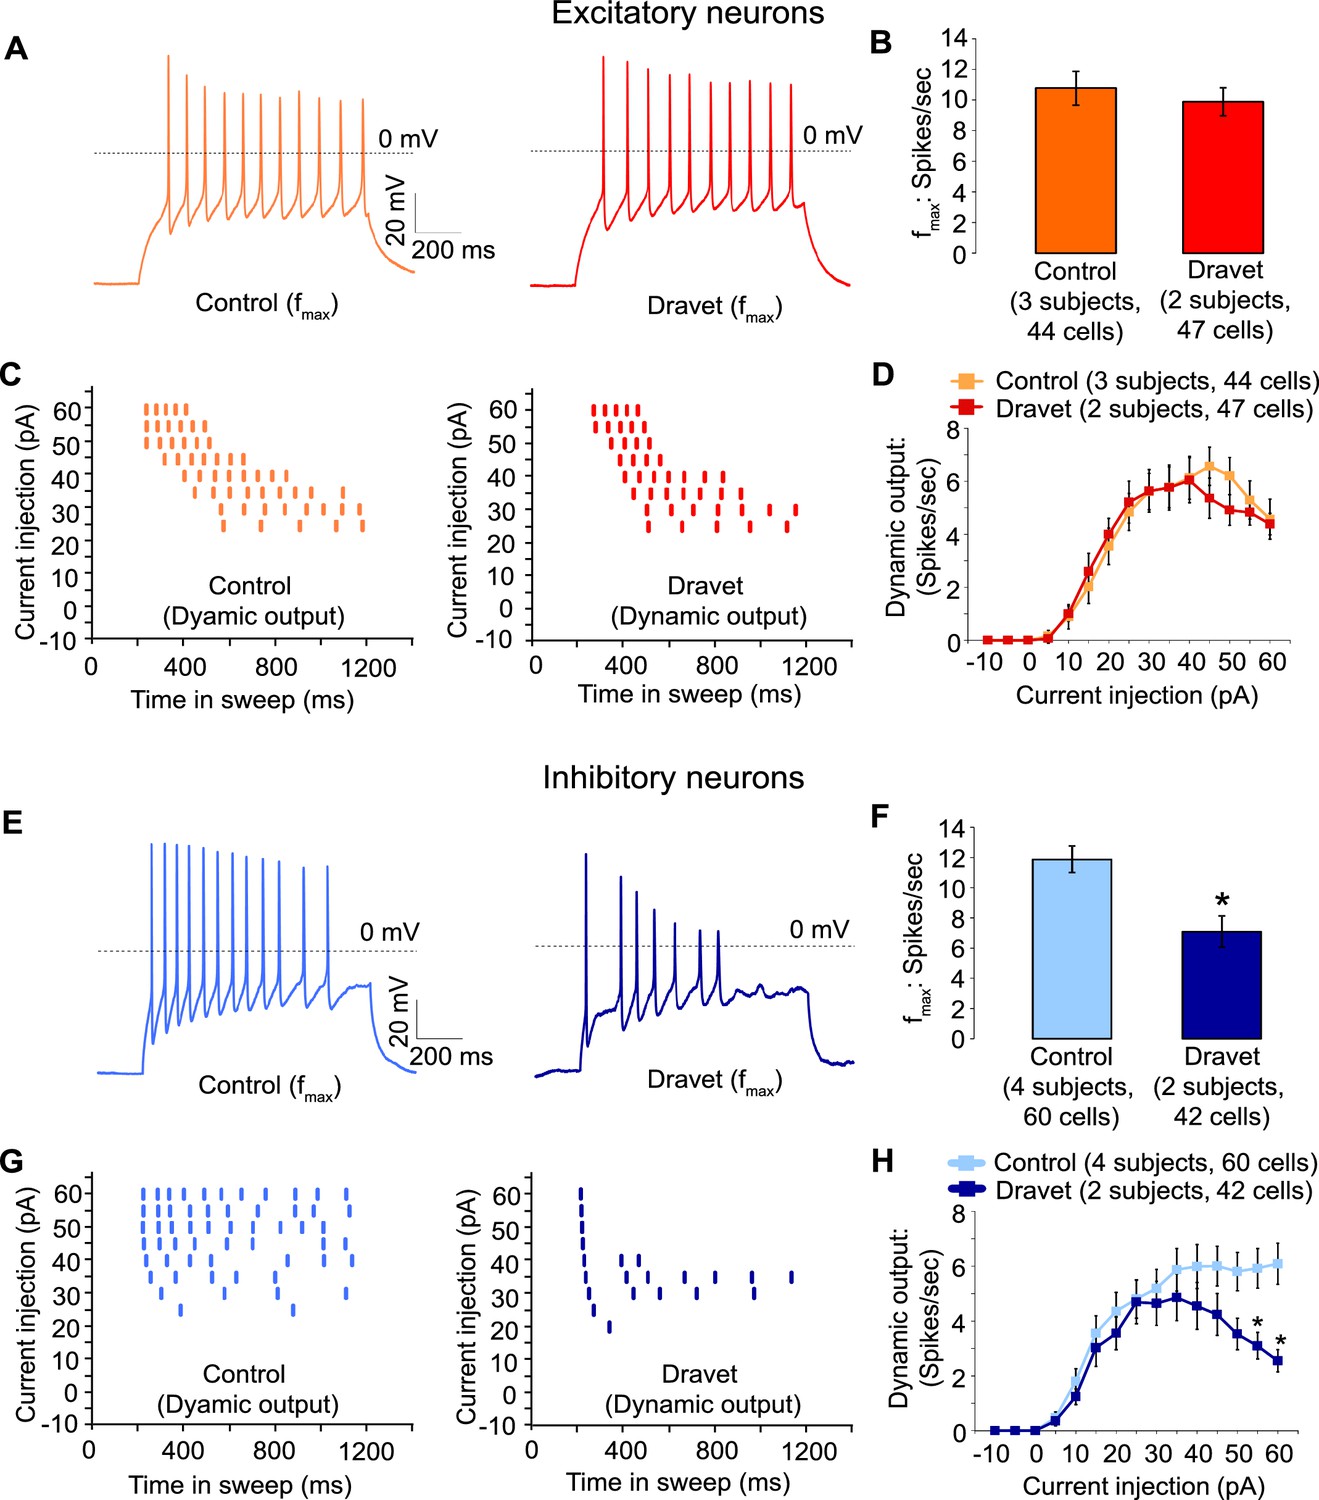
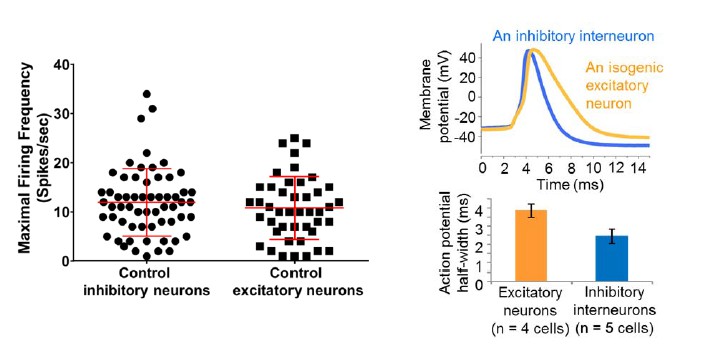
Action potential firing were compromised in inhibitory neurons but not excitatory neurons derived from Dravet Syndrome iPSCs.
(A and B) Evaluating the maximal output of action potential firing (fmax) between Control and Dravet excitatory neurons. The example traces in (A) were selected to represent the median fmax value of all control excitatory neurons (left panel, n = 44 cells, three subjects) or the median fmax of all Dravet excitatory neurons (right panel, n = 47 cells, 2 subjects). In the quantitative comparison (B), p = 0.5115 by t-test. (C and D) Evaluating dynamic output of action potential firing between control and Dravet excitatory neurons. Representative raster plots are shown in (C). Quantitative input-output relationships are presented in (D) as mean ± sem of action potential counts at each current injection level. By two-way ANOVA (factor 1: control versus Dravet neurons; factor 2: current injection levels), F (1, 1335) = 0.2728 and p = 0.6015 between control and Dravet neurons. (E and F) Evaluating the maximal frequency of action potential firing between control (n = 60 cells, four subjects) and Dravet (n = 42 cells, two subjects) inhibitory neurons. The example traces in (E) were selected the same way as in (A). In the quantitative comparison (F, marked with asterisk), p = 0.0006 by t-test. (G and H) Evaluating the input-output dynamics of action potential firing between control and Dravet inhibitory neurons. Representative raster plots are shown in (G), and quantitative data are summarized in (H). By two-way ANOVA, F (1, 1500) = 21.28, p<0.0001 between Dravet and control neurons. Asterisks at the last two current injection levels indicate p<0.05 in post hoc Sidak’s multiple comparisons between Dravet and control neurons. All error bars are standard errors of the mean.
-
Figure 5—source data 1
Action potential numbers quantified in Figure 5B,D,F and H.
- https://doi.org/10.7554/eLife.13073.030
Figure 6 with 2 supplements

Nav1.1 is required for high Na+ current density in inhibitory neurons derived from human pluripotent stem cells.
(A) Differential expression of Nav1.1 mRNA between cultures of telencephalic excitatory neurons and inhibitory neurons. Quantification of Nav1.1 mRNA was based on real-time PCR and normalization to the auxiliary Na channel subunit NaVβ3. For control iPSC line 8858–3, n = 6 culture wells of excitatory neurons, n = 5 culture wells of inhibitory neurons. For the other cell lines, one culture well of excitatory neurons and one culture well of inhibitory neurons were assessed pairwise. (B) Visually identifying Dlxi1/2b-GFP neurons that co-express Nav1.1-shRNAs with a tRFP tracer. Scale bar, 10 microns. Similar tracing was performed for CaMKII-GFP-labeled excitatory neurons co-expressing hNav1.1-shRNAs. (C) Visually identifying Dlxi1/2b-GFP neurons that co-express a doxycycline-inducible Nav1.1 cDNA with a mCherry tracer. Scale bar, 25 microns. (D) Nav1.1- shRNA1 and Nav1.1-shRNA2 reduced Na+ currents (INa) in hESC-H9 derived Dlxi1/2b-GFP+ neurons, but not in CaMKII-GFP+ neurons. Conversely, the Nav1.1 cDNA restored the INa in Dravet Dlxi1/2b-GFP+ neurons (Cell line: 6358–2). F(7, 57) = 5.636, p<0.0001 by ANOVA for the entire dataset. Individual p values from post hoc Sidak’s multiple comparisons are indicated on the graph. (E) Nav1.1-shRNAs suppressed action potential firing capacity in hESC-H9 derived Dlxi1/2b-GFP+ neurons. F (1, 270) = 13.24, p = 0.0003 by two-way ANOVA for the effect of Nav1.1-shRNAs on spike number over the range of current injections. (F) The Nav1.1 cDNA restored action potential firing capacity in Dlxi1/2b-GFP+ neurons derived from Dravet iPSC line 6358–2. F (1, 135) = 26.69, p<0.0001 by two-way ANOVA for the contribution of Nav1.1 cDNA to spike number over the range of current injections. All error bars are standard errors of the mean.
-
Figure 6—source data 1
INa values quantified in Figure 6D, and action potential numbers quantified in Figure 6E and F.
- https://doi.org/10.7554/eLife.13073.032
Figure 6—figure supplement 1
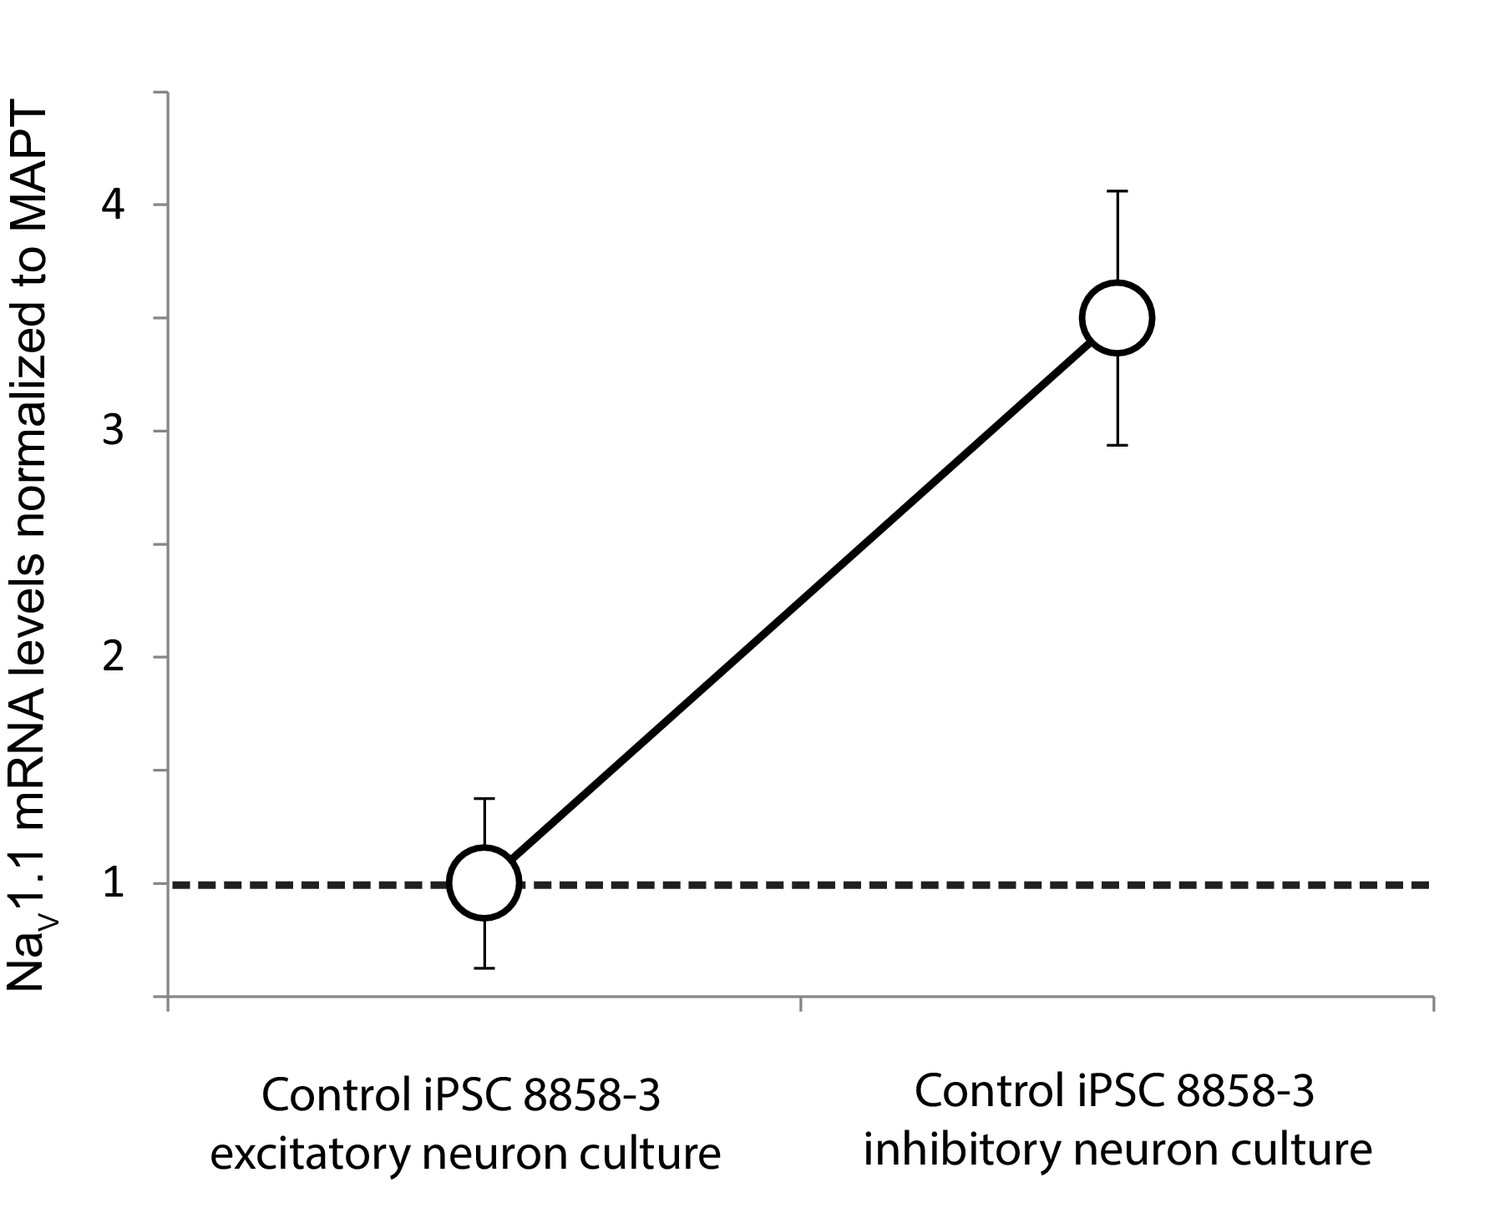
Differential expression of Nav1.1 mRNA between cultures of telencephalic excitatory neurons and inhibitory neurons derived from the control iPSC line 8858–3.
Quantification was based on real-time PCR and normalization to MAPT mRNA. n = 6 culture wells for the excitatory neurons. n = 5 culture wells for the inhibitory neurons. Error bars represent standard error of the mean.
Figure 6—figure supplement 2
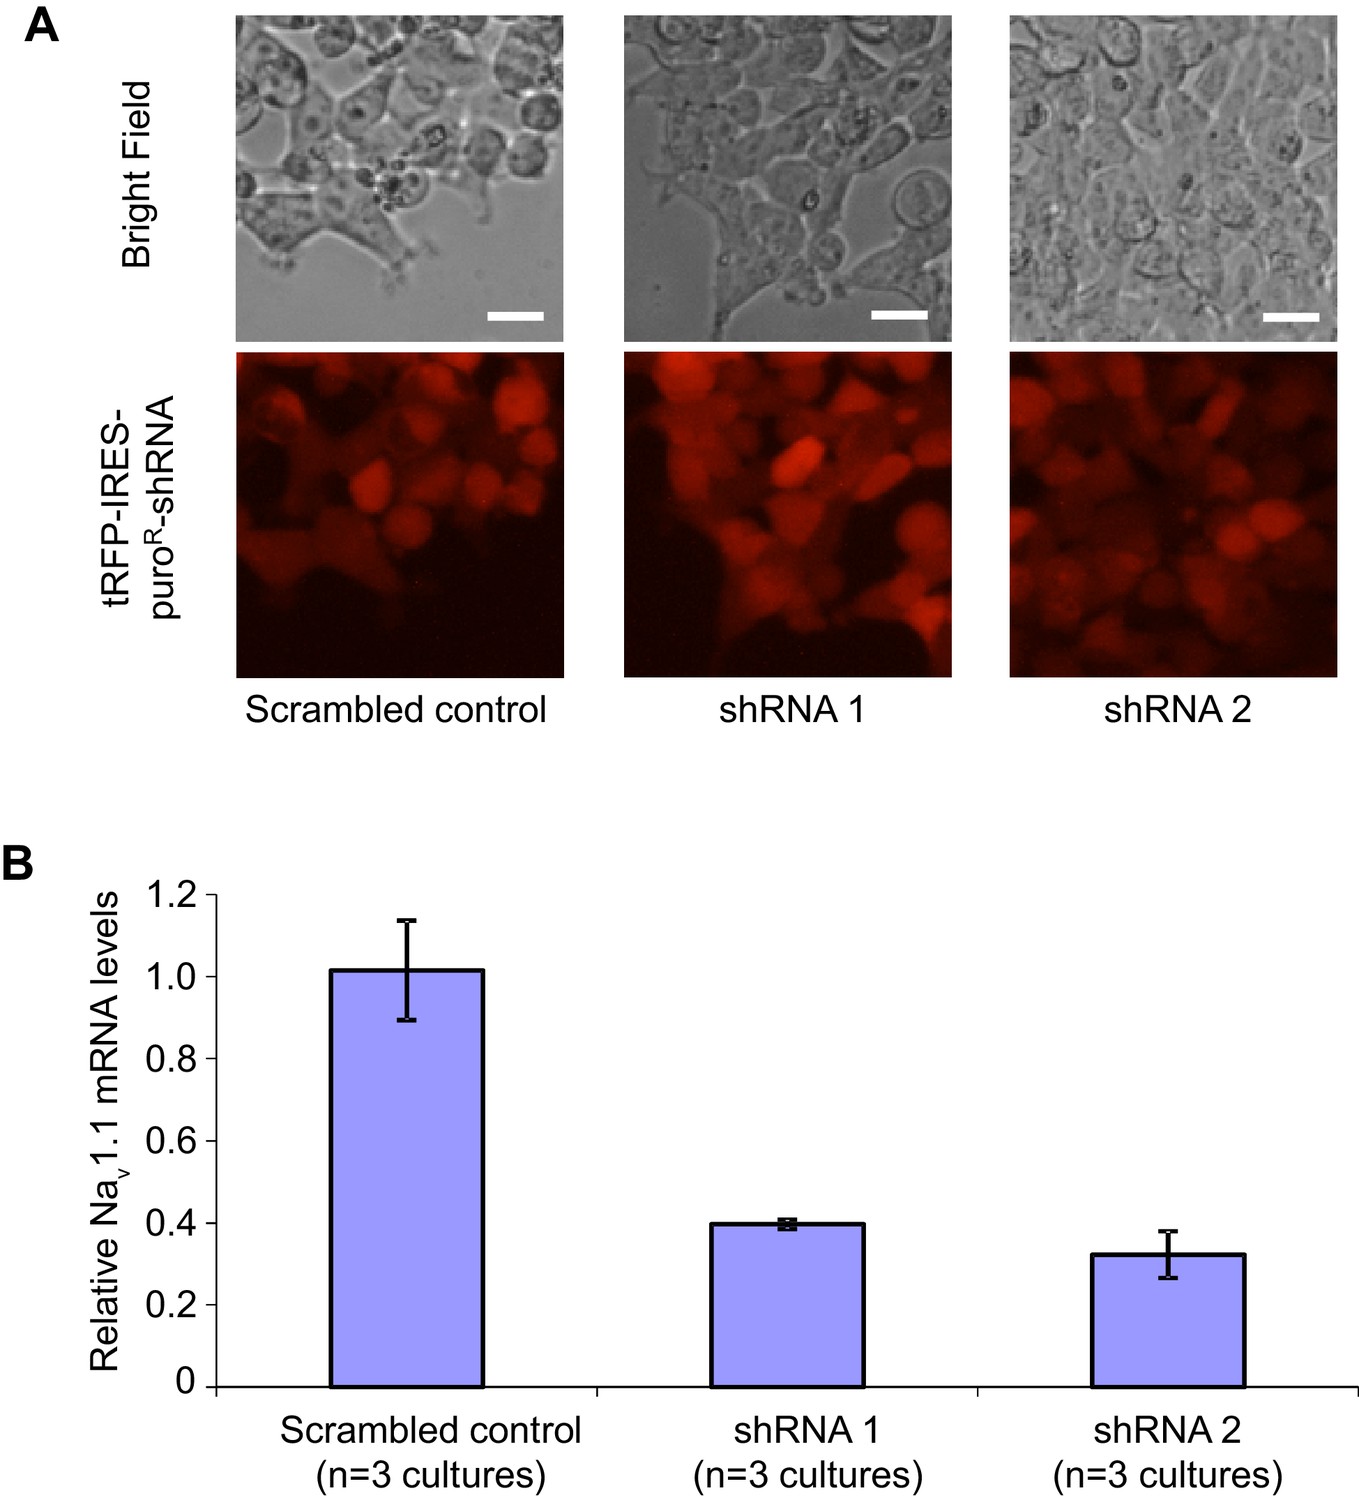
Transduction and RNAi efficiency of two human Nav1.1 lenti-shRNA clones.
(A) Evaluating the transduction efficiency of the lentiviral particles were tested in HEK293T cells based on the expression of the tRFP reporter. Scale bars, 20 microns. (B) The RNAi efficiency of lenti-shRNA1 and lenti-shRNA2 relative to a non-silencing clone was determined by first transducing HEK293T cells with the lentiviral clones and next expressing the human Nav1.1 cDNA via transfection. Nav1.1 mRNAs were quantified with qRT-PCR. By ANOVA and post hoc Sidak’s multiple comparisons, p = 0.003 for the comparison between control and shRNA1; p = 0.002 for the comparison between control and shRNA2.
Author response image 1

Author response image 2
Tables
Table 1
Peak current amplitude of Nav1.1-F383S and Nav1.1-F383S-S1328P expressed in human NgN2 neurons.
| Mean (95% CI) | Nav1.1-F383S | Nav1.1-F383S-S1328P | ||
|---|---|---|---|---|
| 2 µg/ml Dox (10 cells) | 0.1 µg/ml Dox (8 cells) | 2 µg/ml Dox (9 cells) | 0.1 µg/ml Dox (7 cells) | |
| Imax (pA/pF) | 152.4 (114.4, 190.3) | 141.7 (83.04, 200.4) | 109.6 (44.94, 174.2) | 77.03 (17.77, 136.3) |
-
Imax is the maximal inward current detected in a neuron and normalized to the whole cell capacitance. By two-way ANOVA using Nav1.1 variants as factor 1 and Dox concentration as factor 2, F (1, 30) = 5.135 and p = 0.0308 for factor 1.
-
Table 1—source data 1
The peak INa amplitude for each neuron described in Table 1.
- https://doi.org/10.7554/eLife.13073.009
Table 2
Voltage sensitivity of Nav1.1-F383S and Nav1.1-F383S-S1328P expressed in human NgN2 neurons.
| Mean (95% CI) | Nav1.1-F383S | Nav1.1-F383S-S1328P |
|---|---|---|
| Activation V1/2 (mV) | −30.22 (−33.66, −26.78) | −35.35 p1 (−38.75,−31.95) |
| Steady-state inactivation V1/2’ (mV) | −46.23 (−48.05, −44.42) | −61.43 p2 (−62.95, −59.91) |
-
V1/2 and V1/2’ were determined per neuron by curve fitting in GraphPad Prism using the equation g/gmax = 1/(1+exp((V-V1/2)/a)) and g/gmax = 1/(1+exp((V- V1/2’)/a’)). p1 = 0.0324 by t-test for V1/2 values between Nav1.1-F383S and Nav1.1-F383-S1328P. p2 = 1.6 × 10⁻¹² by t-test for V1/2’values between Nav1.1-F383S and Nav1.1-F383-S1328P.
-
Table 2—source data 1
V1/2 and V1/2’ values for each neuron described in Table 2.
- https://doi.org/10.7554/eLife.13073.011
Table 3
Cell-type specific comparisons of INa activation between control and Dravet iPSC-derived neurons.
| Mean (95% CI) | Excitatory neurons | Inhibitory neurons | ||
|---|---|---|---|---|
| Control (3 subjects, 45 cells) | Dravet (2 subjects, 45 cells) | Control (4 subjects, 28 cells) | Dravet (2 subjects, 20 cells) | |
| Imax (pA/pF) | 63.62 (55.01, 72.23) | 62.15 p1 (52.19, 72.11) | 100.5 (74.78, 126.2) | 64.27 p4 (46.07, 82.47) |
| VR (mV) | 37.34 (34.51, 40.16) | 34.23 p2 (31.43, 37.02) | 27.34 (24.32, 30.36) | 28.28 p5 (23.74, 32.83) |
| V1/2 (mV) | −29.89 (−31.58,−28.21) | −28.81 p3 (−30.31, −27.31) | −27.63 (− 30.06, −25.19) | −25.31 p6 (−28.98, −21.64) |
-
Imax is the maximal inward current detected in a neuron and normalized to the whole cell capacitance. VR is the reversal potential for sodium currents. V1/2 describes the membrane potential at which 50% of the sodium channels are activated. VR and V1/2 were determined for each neuron by curve fitting in GraphPad Prism using the equation I = g*(V-VR)/(1+exp(-0.03937*z*(V-V1/2))) (see Materials and methods). 95% CI is the 95% confidence interval. p1 = 0.8225, p2 = 0.1291, p3 = 0.3505, in corresponding t-tests between Control and Dravet excitatory neurons. p4 = 0.034, p5 = 0.7259, p6 = 0.2885, in corresponding t-tests between Control and Dravet inhibitory neurons.
-
Table 3—source data 1
Parameters characterizing INa activation for each neuron described in Table 3.
- https://doi.org/10.7554/eLife.13073.026
Table 4
Cell-type specific comparisons of INa steady-state inactivation between control and Dravet iPSC-derived neurons.
| Mean (95% CI) | Excitatory neurons | Inhibitory neurons | ||
|---|---|---|---|---|
| Control (3 subjects, 37 cells) | Dravet (2 subjects, 40 cells) | Control (4 subjects, 25 cells) | Dravet (2 subjects, 19 cells) | |
| V1/2’ (mV) | −44.87 (−46.13, −43.61) | −45.27 p1 (−46.47, -44.07) | −45.32 (−47.84, −42.79) | −43.31 p2 (−46.08, −40.55) |
-
V1/2’ describes the membrane potential at which 50% of the sodium channels are inactivated. V1/2’ was determined per neuron by curve fitting in GraphPad Prism using the equation I = 1/(1+exp((V- V1/2’)/a’)) (see Materials and methods). 95% CI is the 95% confidence interval. p1 = 0.6551 by t-test between control and Dravet excitatory neurons. p2 = 0.3035 by t-test between control and Dravet inhibitory neurons.
-
Table 4—source data 1
V1/2’ values for each neuron described in Table 4.
- https://doi.org/10.7554/eLife.13073.028
Additional files
-
Supplementary file 1
SNP array assessment of copy number variants (CNVs) in iPSCs.
- https://doi.org/10.7554/eLife.13073.035
-
Supplementary file 2
Pluripotent stem cell lines characterized by electrophysiology.
- https://doi.org/10.7554/eLife.13073.036
-
Supplementary file 3
qRT-PCR and single-cell RT-PCR primers.
- https://doi.org/10.7554/eLife.13073.037
-
Supplementary file 4
Primary antibodies used for immunofluorescence.
- https://doi.org/10.7554/eLife.13073.038
Download links
A two-part list of links to download the article, or parts of the article, in various formats.
Downloads (link to download the article as PDF)
Open citations (links to open the citations from this article in various online reference manager services)
Cite this article (links to download the citations from this article in formats compatible with various reference manager tools)
A deleterious Nav1.1 mutation selectively impairs telencephalic inhibitory neurons derived from Dravet Syndrome patients
eLife 5:e13073.
https://doi.org/10.7554/eLife.13073


