Gustatory-mediated avoidance of bacterial lipopolysaccharides via TRPA1 activation in Drosophila
- KU Leuven, Belgium
- VIB, Belgium
- University of Leuven School of Medicine, Belgium
- Neuroelectronics Research Flanders, Belgium
- NTNU, Norway
- Hôpital Pitié-Salpétrière, France
- Université Pierre et Marie Curie, Sorbonne Universités, France
Figures
Figure 1 with 1 supplement
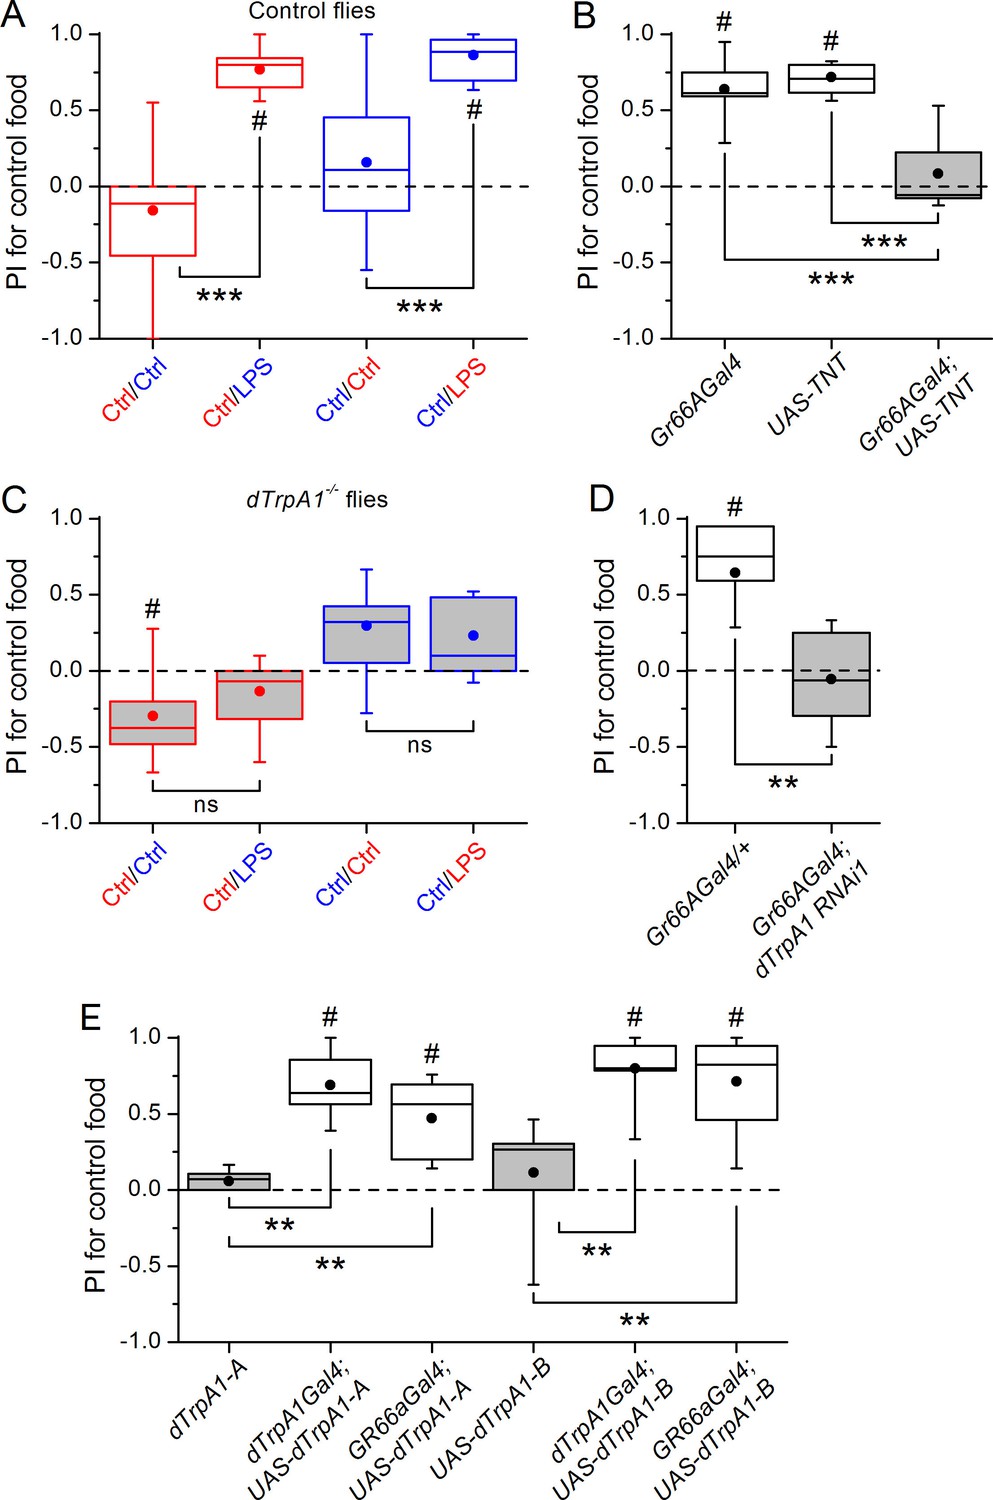
Gustatory dTrpA1-dependent avoidance of LPS in Drosophila melanogaster.
(A,C) Preference index (PI) of control CS10w1118 (A) and dTrpA1-deficient (C) male flies for control food over LPS-supplemented food. PI was calculated for the consumption of the control solution mixed with the color of the corresponding data symbol (n ≥ 6). (B) PI for control food of Gr66a>TNT flies and in the corresponding driver-only and responder-only control flies (n ≥ 6). (D) PI for control food of Gr66a>dTrpA1 RNAi flies (n ≥ 4–8). (E) Rescue of LPS avoidance in dTrpA11/dTrpA1ins; dTrpA1>dTrpA1 and dTrpA11/dTrpA1ins; Gr66a>dTrpA1-A/B flies (n ≥ 5). *P < 0.05; **P < 0.01; ***P < 0.001; ‘ns’, P > 0.05 (two-tailed Mann-Whitney U test). #, statistically significant differences from the no-preference zero level (two-tailed t test).
Figure 1—figure supplement 1
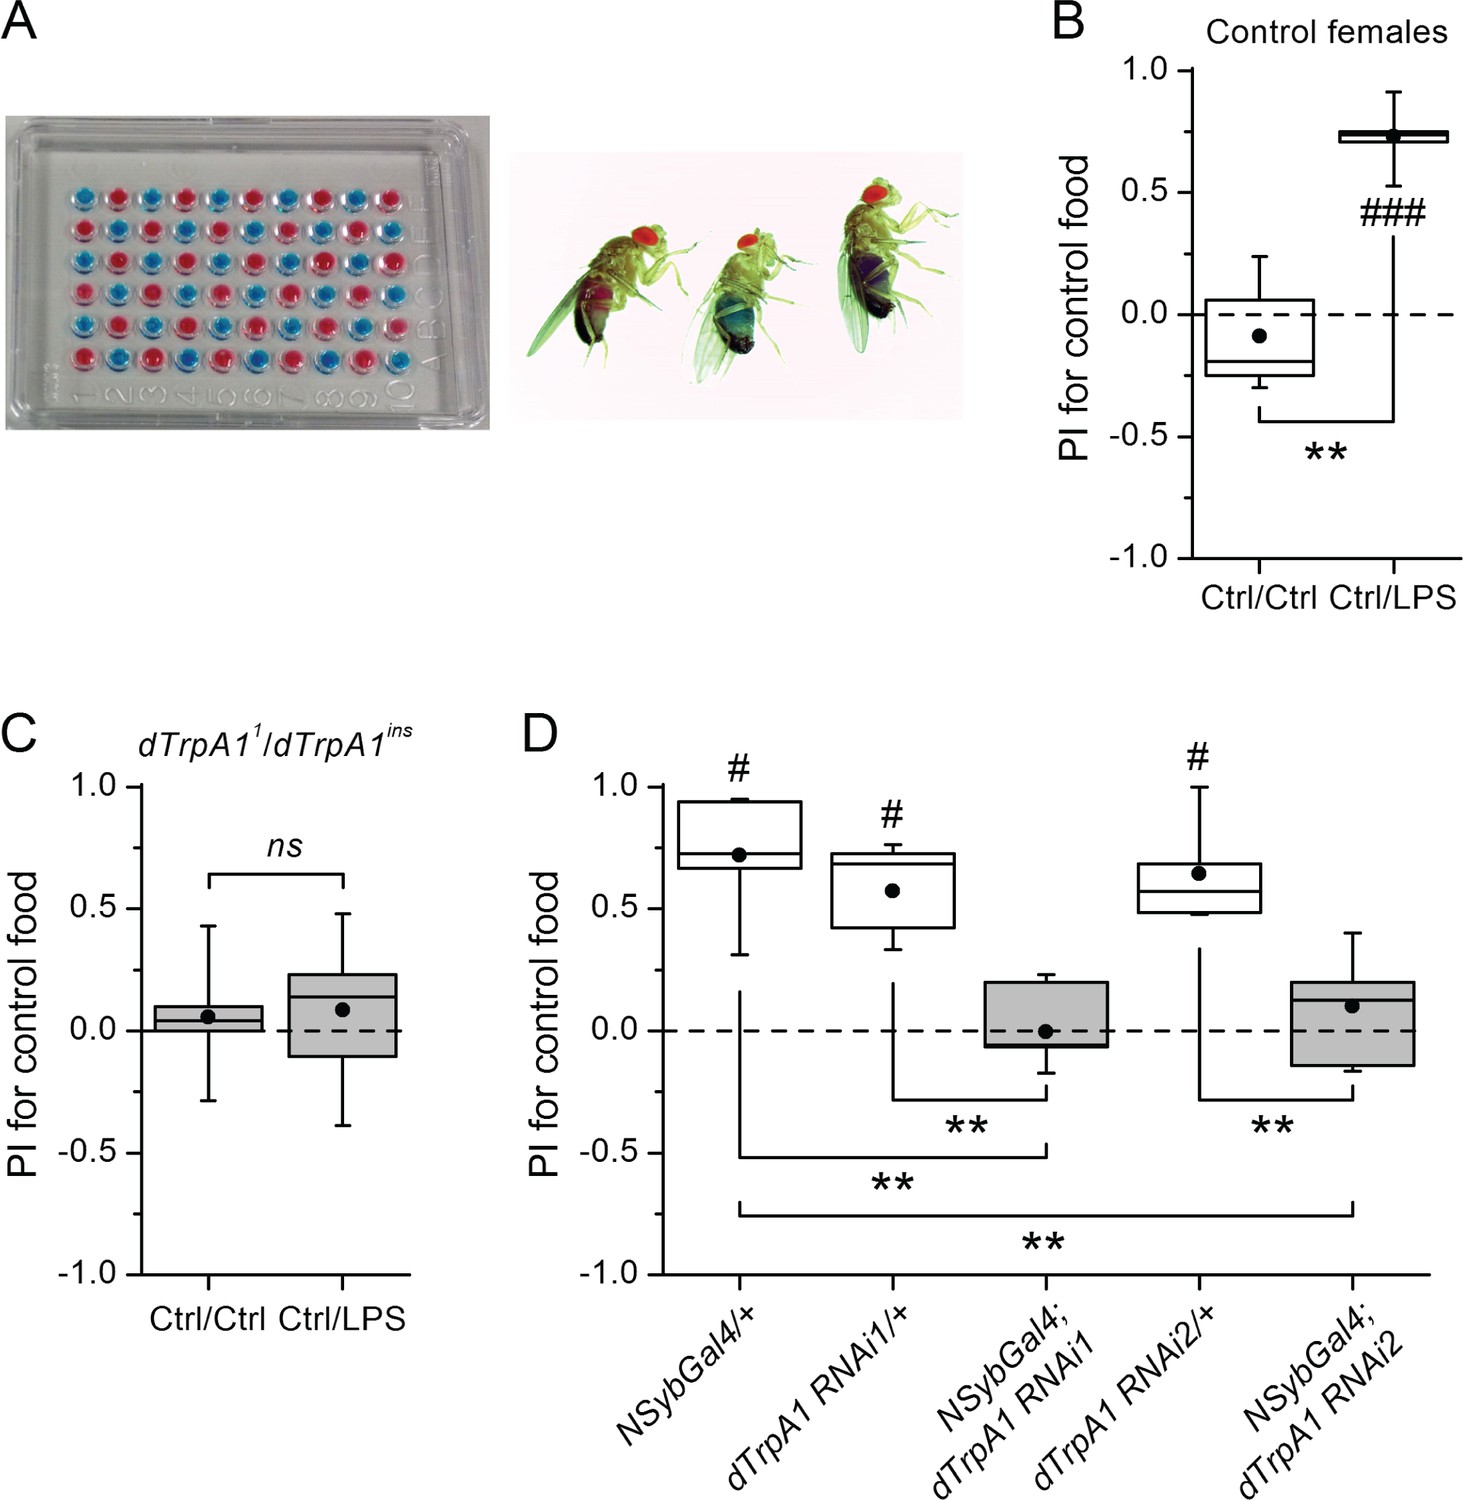
dTrpA1-dependent aversion to LPS in Drosophila.
(A) Left, microtiter plate used for the binary food choice test. Right after feeding, flies were visually inspected for abdomen color. (B) Female control CS10w1118 flies avoid food supplemented with LPS in a binary food choice assay. **P < 0.01 (two-tailed Mann-Whitney U test). #, statistically significant differences from the no-preference zero level (two-tailed t test). (C) Trans-heterozygote dTrpA1 mutants do not avoid food supplemented with LPS in a binary food choice assay. ‘ns’, no statistically significant difference, P > 0.05 (two-tailed Mann-Whitney U test). (D) Effect of silencing dTrpA1 using two independent RNA-interference lines (dTrpA1 RNAi1 and dTrpA1 RNAi2) on the preference index (PI) determined for ingestion of control food over LPS-supplemented food. The driver-only (NSybGal4/+) and responder-only (dTrpA1 RNAi1/+ and dTrpA1 RNAi2/+) controls are shown for comparison. **P < 0.01 (two-tailed Mann-Whitney U test) and #, statistically significant difference from the no-preference zero level (P < 0.05, two-tailed t test).
Figure 2
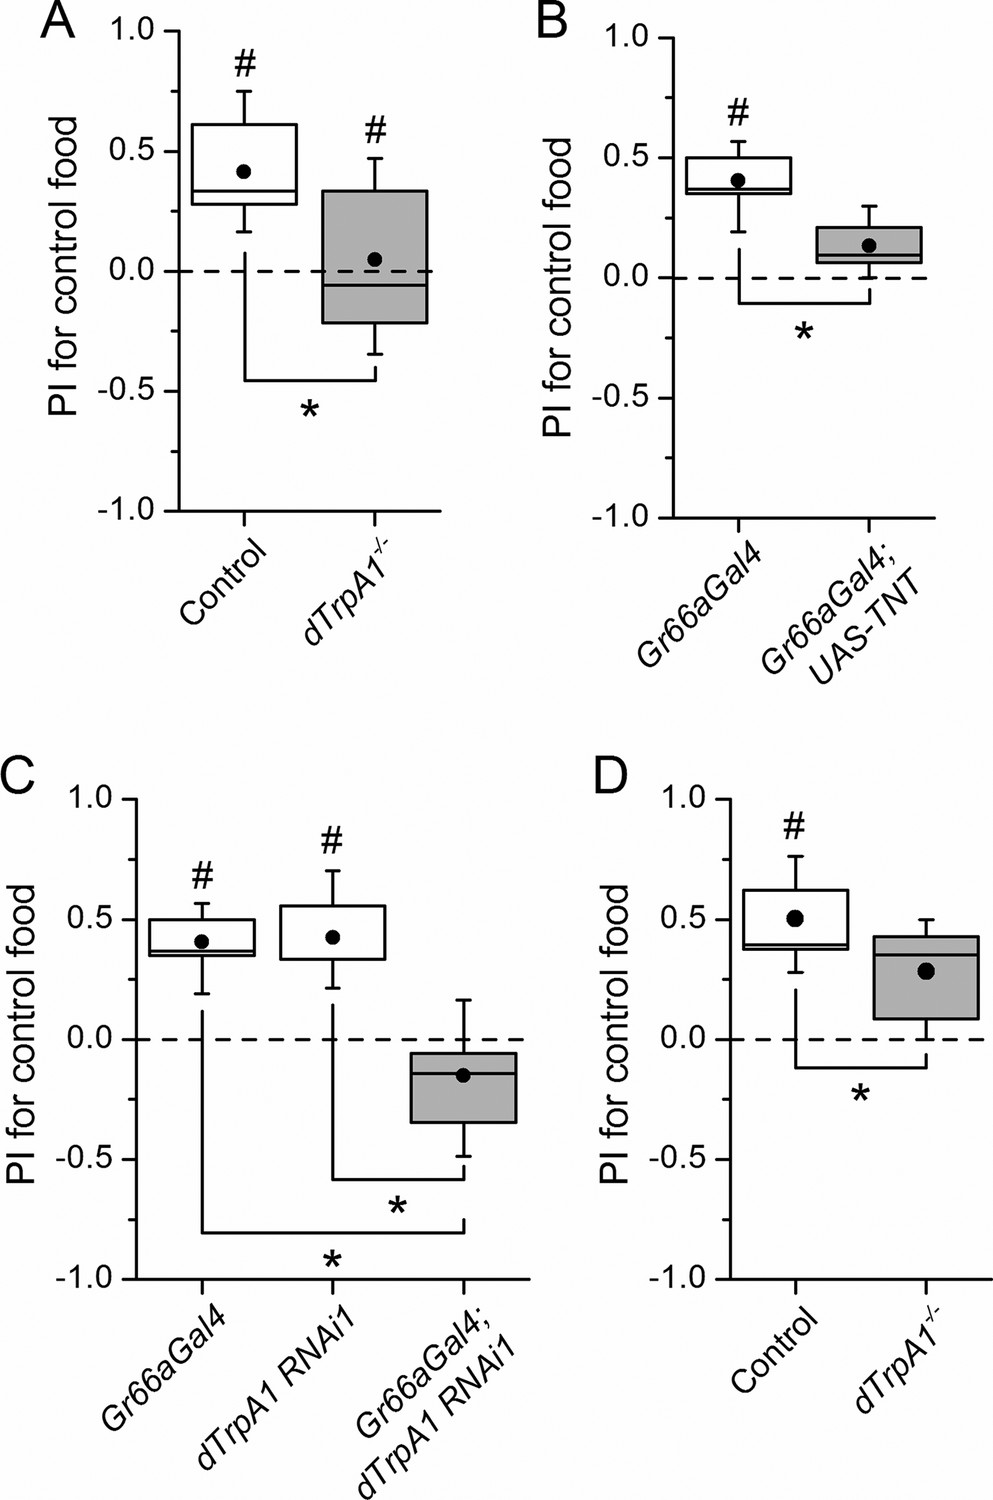
dTrpA1 expression in gustatory neurons is required for avoidance of LPS during oviposition.
(A) Preference index for oviposition in control food of wild type versus dTrpA1-/- flies (n ≥ 5). (B) Oviposition preference of Gr66a>TNT flies (n ≥ 6). (C) Oviposition preference of Gr66a>dTrpA1 RNAi flies (n ≥ 6). (D) Oviposition preference of wild type versus dTrpA1-/- flies in presence of E. coli. (n ≥ 8) *P < 0.05; **P < 0.01; ***P < 0.001 (two-tailed Mann-Whitney U test). #, statistically significant differences from the no-preference zero level (two-tailed t test).
Figure 3 with 2 supplements
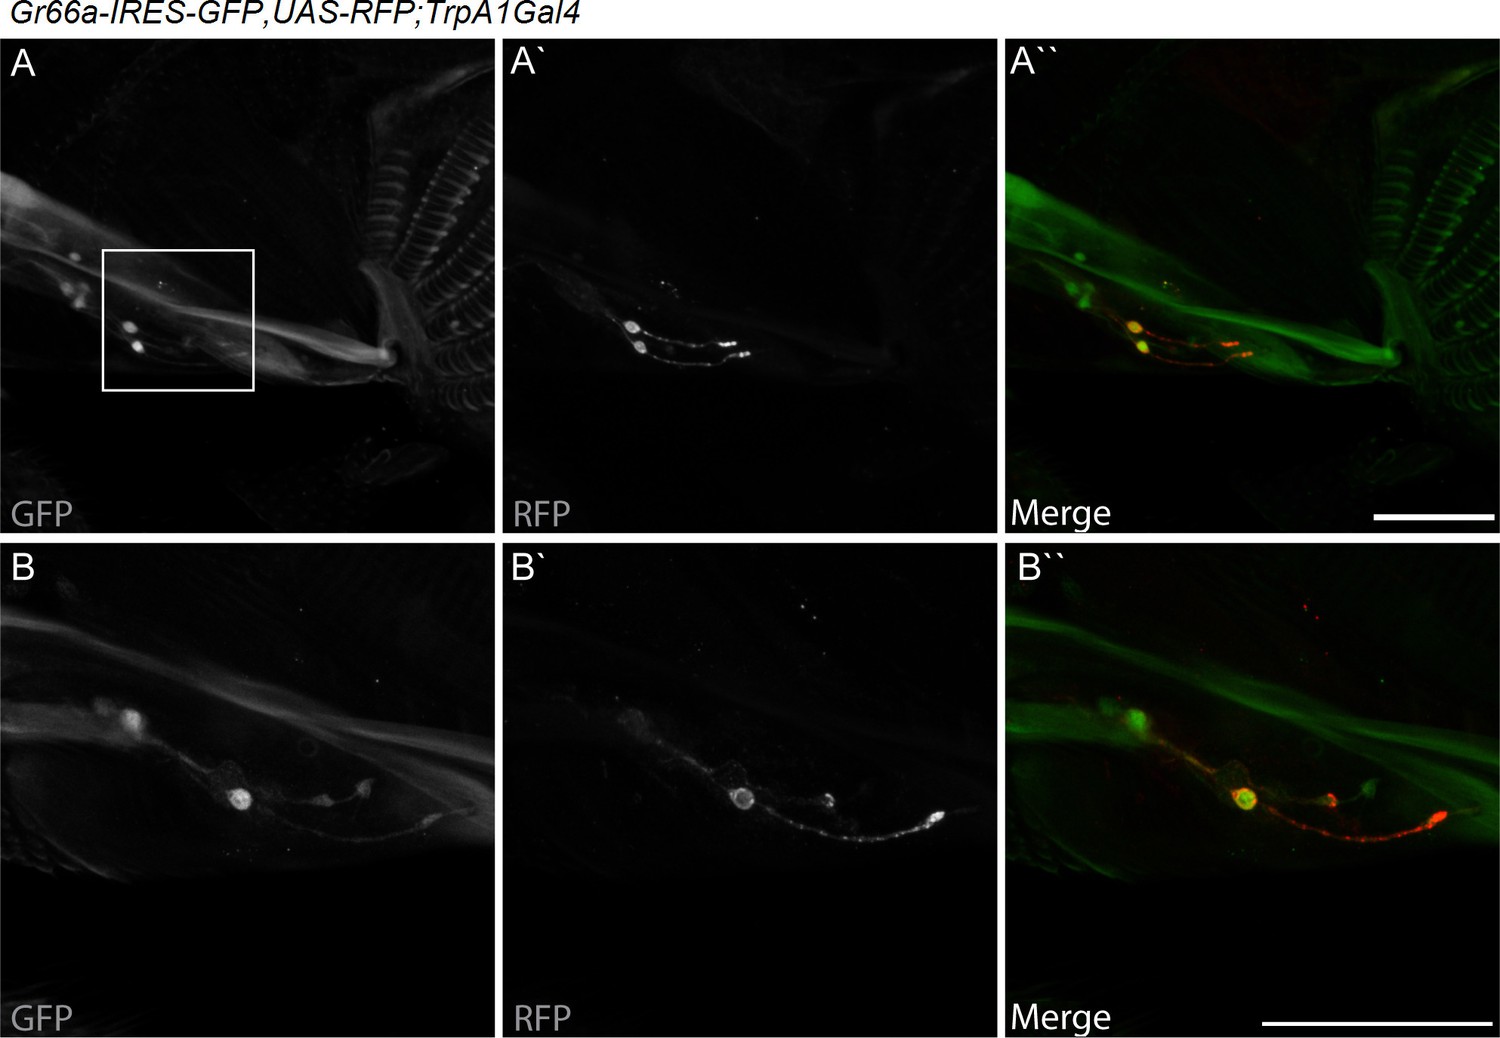
dTrpA1 is expressed in a subset of Gr66a-expressing neurons that can be directly stimulated by LPS.
(A) Immunofluorescence analysis of Gr66a-IRES-GFP,UAS-RFP;dTrpA1Gal4 adult proboscis. Anti-GFP immunohistochemistry (in green in the Merge panel) labels taste neurons while anti-RFP (in red in the Merge panel) labels dTrpA1-expressing cells. Scale bar = 50 μm. (B) High magnification image of esophageal neurons expressing Gr66a and TrpA1.
Figure 3—figure supplement 1

dTRPA1 is not expressed in tarsal Gr66a-expressing neurons.
Immunofluorescence analysis of Gr66a-IRES-GFP,UAS-RFP;dTrpA1Gal4 fly legs. Anti-GFP immunohistochemistry labels taste neurons (in Green in the Merge panel) while anti-RFP labels dTrpA1-expressing cells (In Red in the Merge panel). Nuclei are stained with DAPI (in Blue in the Merge panel) As shown in panels A and B there are different clusters of Gr66a-expressing neurons present in the different leg segments. (C) Higher magnification image. As shown in panel C we could not detect RFP expression in any of the GFP-expressing cells. Scale bar = 25 μm.
Figure 3—figure supplement 2
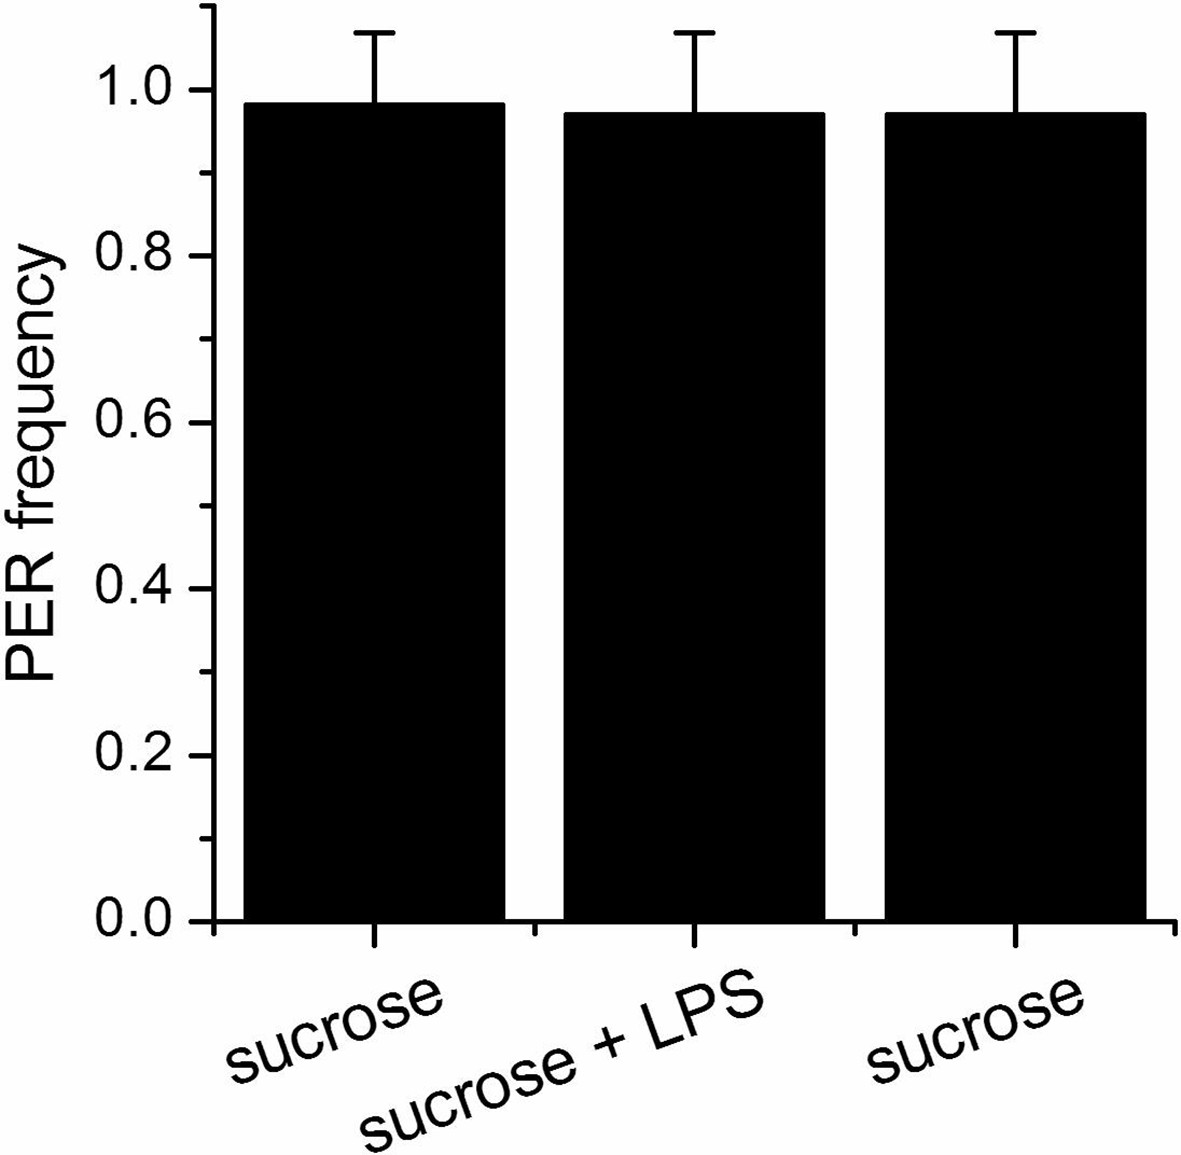
LPS does not alter the proboscis extension reflex.
Proboscis extension reflex (PER) to 100 mM sucrose alone or mixed with 1 mg/ml LPS. The sucrose has been offered both before and after LPS. The graphs show the frequency of extension as mean of 19 animals.
Figure 4 with 4 supplements
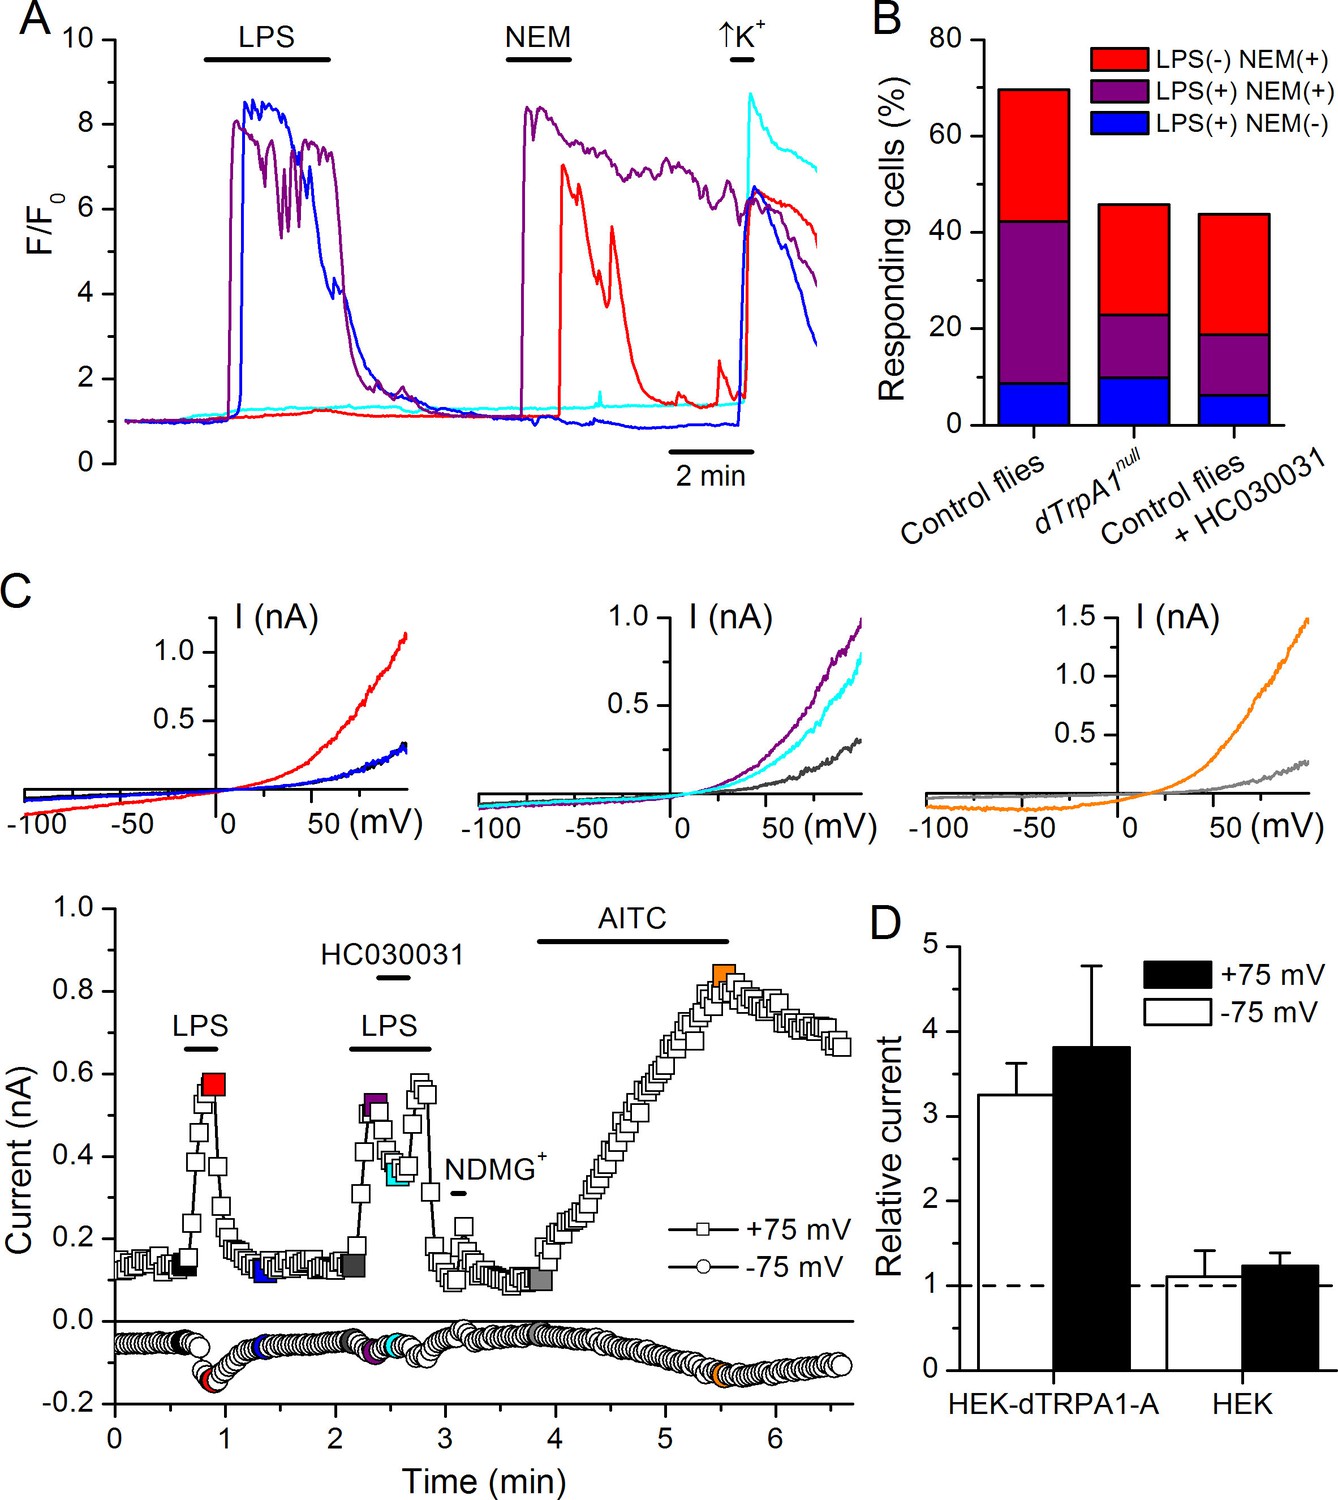
LPS stimulates dTRPA1.
(A) Intracellular Ca2+ imaging in cultured brain L3 neurons expressing RFP and GCaMP5 under the control of dTrpA1Gal4 in baseline conditions and during extracellular perfusion with LPS (30 µg/ml), NEM (300 µM) or high K+ (50 mM KCl). (B) Proportions of neurons responding to LPS (red), NEM (blue) or both (purple). (C) Time course of the currents amplitude measured at +75 and -75 mV during whole-cell patch-clamp recording in dTRPA1-A transfected HEK293T cell. The colored data points correspond to current traces shown at the top of the panel. (D) Average effects of LPS on the current amplitudes recorded at +75 and -75 mV in dTRPA1-A-transfected (n = 7) and non-transfected (n = 3) HEK293T cells. For each cell, the current amplitudes measured in the presence of LPS were normalized to those measured in control condition.
Figure 4—figure supplement 1
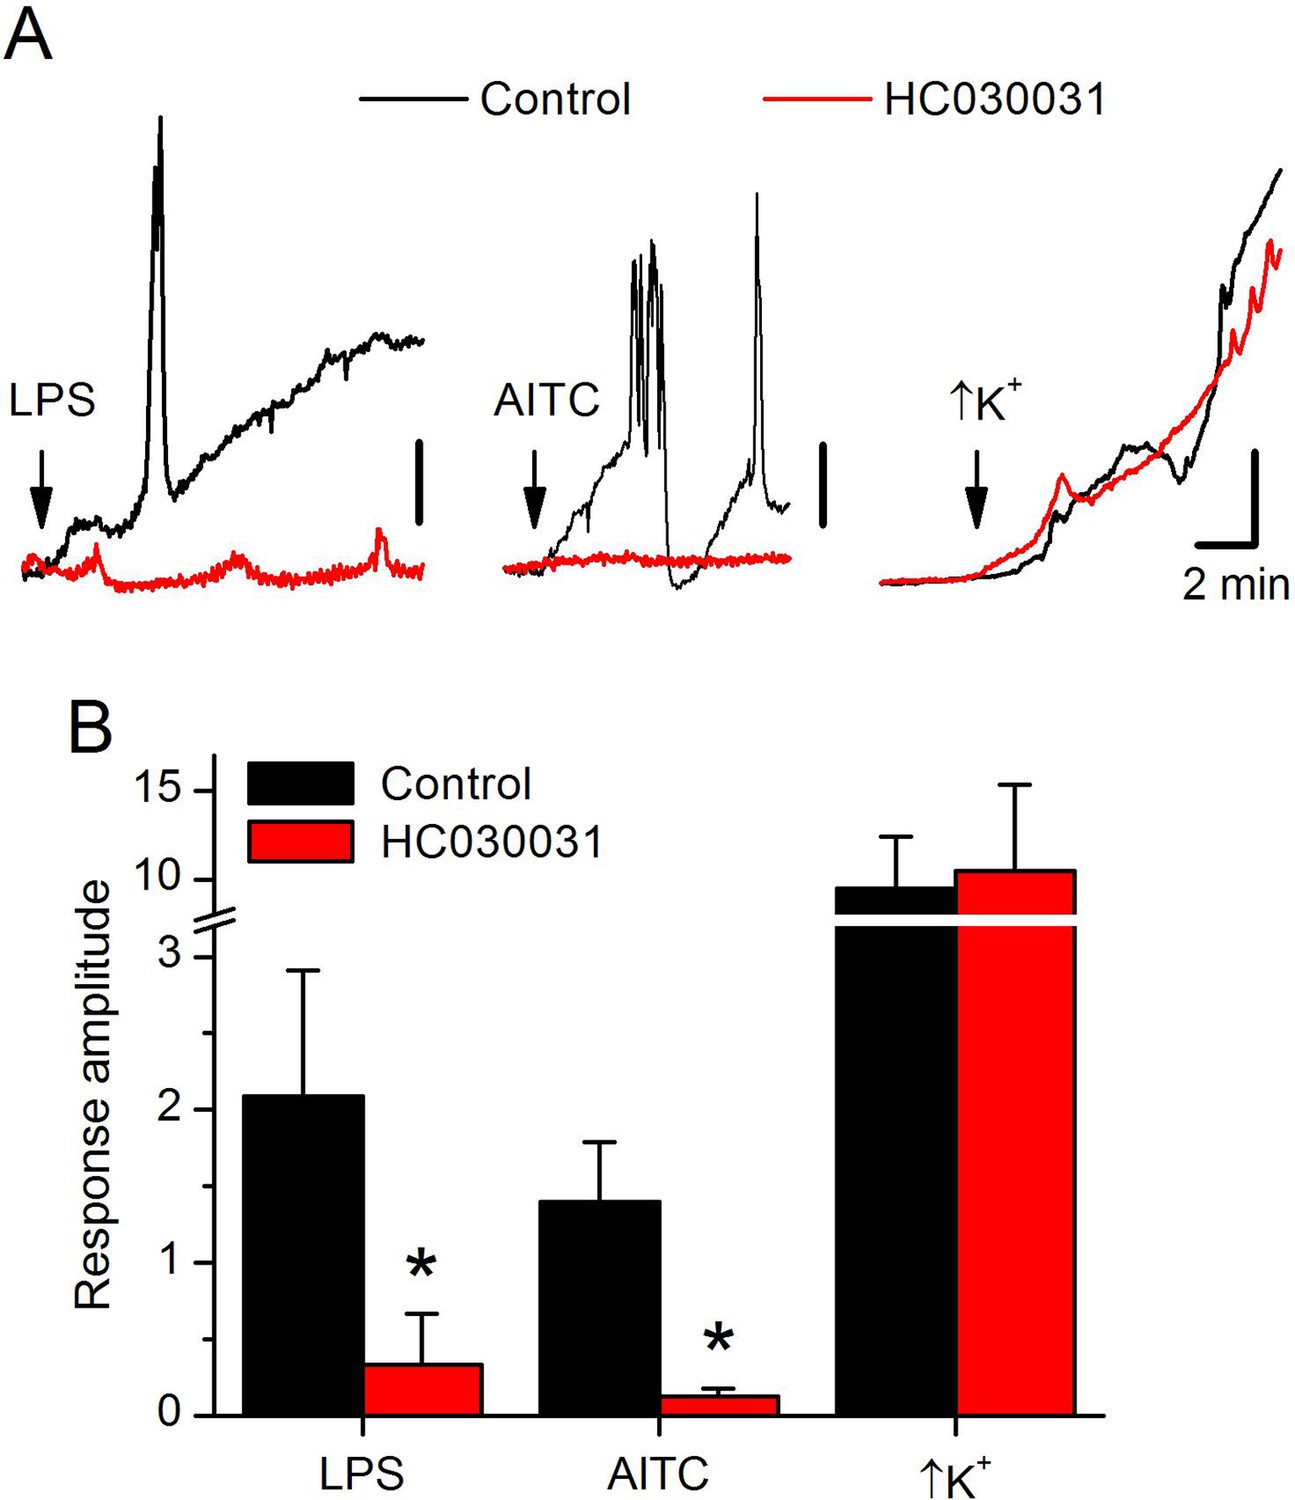
LPS stimulates dTRPA1 in vivo.
(A) Examples of intracellular Ca2+ imaging recordings performed in the ventral nerve cord of Drosophila larvae in an in vivo larval fillet preparation. The arrows indicate the time of application of LPS (50 µg/ml), AITC (100 µM) and a solution with high extracellular K+ concentration. The data are given in average pixel intensity (API) determined using the whole nerve cord region as region of interest (vertical scale bars: 1 for LPS and AITC and 5 for high K+). The black lines represent recordings in control conditions, whereas the red lines represent recordings in preparations that were incubated in the presence of the TRPA1 inhibitor HC030031 for 15 min. (B) Average amplitude of the intracellular Ca2+ responses elicited by LPS, AITC and high extracellular K+ in control and in the presence of HC030031. *, P < 0.05 (Mann-Whitney U test).
Figure 4—figure supplement 2
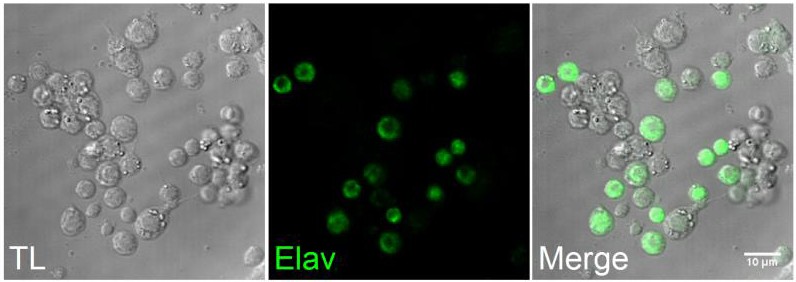
Images of a culture of cells from third instar larvae brains.
Left, bright field; center, immuno-fluorescence staining with the neuronal marker Elav; right, merged images.
Figure 4—figure supplement 3
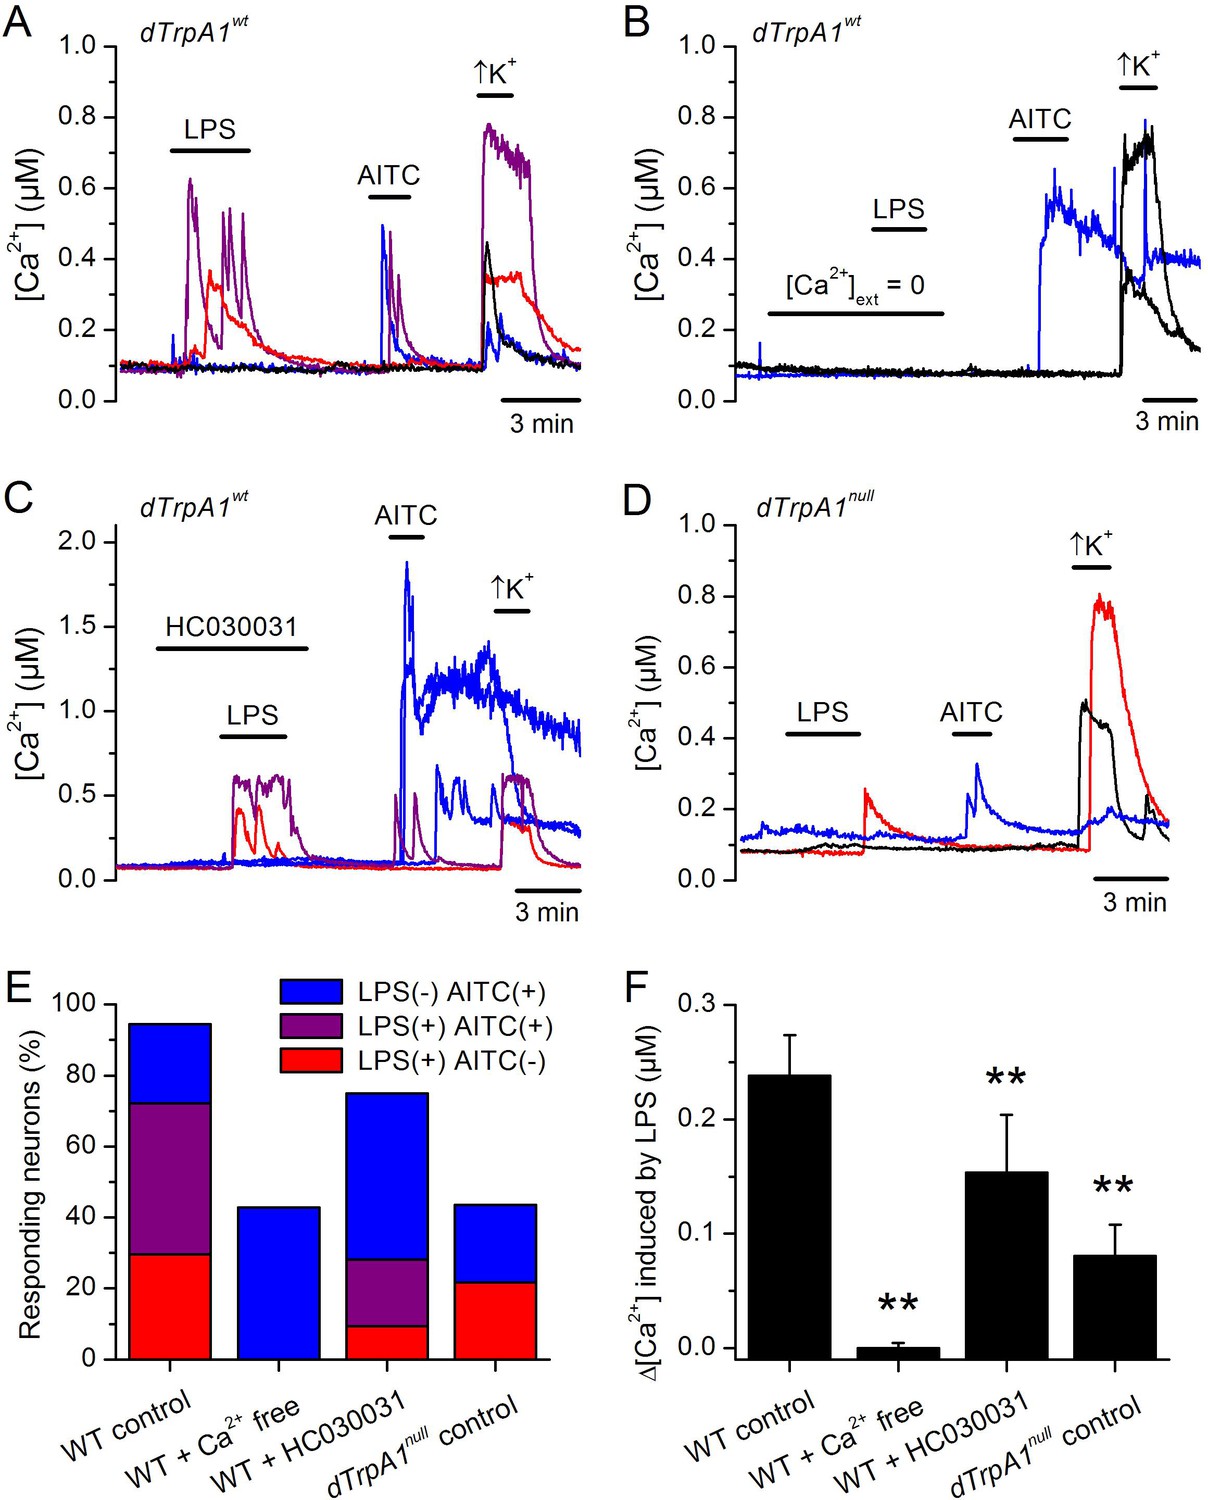
LPS stimulates Drosophila neurons in vitro in a dTRPA1-dependent manner.
(A) Examples of the effects of extracellular application of LPS (60 µg/ml), AITC (100 µM) or a high K+ solution on the intracellular Ca2+ concentration recorded in neurons isolated from control (dTrpA1 wt) larvae. (B and C) Effects if LPS on neurons isolated from control larvae in the absence of extracellular Ca2+ or in the presence of the dTRPA1 inhibitor HC030031 (100 µM). (D) Effects of extracellular application of LPS (60 µg/ml), AITC (100 µM) or a high K+ solution on the intracellular Ca2+ concentration recorded in neurons isolated from dTrpA1-null (dTrpA11) larvae. (E) Proportions of neurons responding to LPS only (red), AITC only (blue) and to both LPS and AITC (purple). The conditions Ca2+-free and HC030031 refer to application of LPS in the absence of extracellular Ca2+ or in the presence of the TRPA1 inhibitor HC030031 (100 µM), respectively. dTrpA1-null control refers to data obtained in neurons isolated from dTrpA1-null larvae in control conditions. (F) Average amplitude of the responses to LPS elicited in neurons isolated from control larvae (in control, Ca2+-free and HC030031) and from dTrpA1-null larvae in control conditions. **denote statistically significant difference from the data in wild type larvae in control conditions, with P < 0.01 (two-tailed Mann-Whitney U test).
Figure 4—figure supplement 4
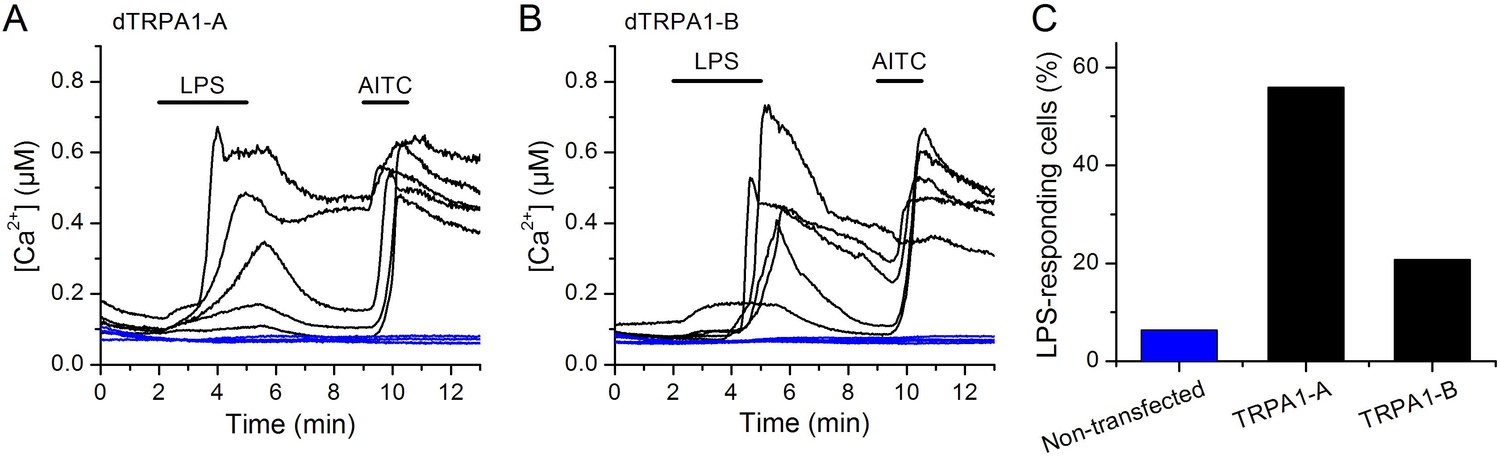
LPS-induced responses in HEK293T cells transfected with dTRPA1 channels.
(A and B) Intracellular Ca2+ imaging experiment showing that E. coli LPS (60 µg/ml) stimulates cells transfected with dTRPA1-A (A) or dTRPA1-B (B) (responsive to 100 µM AITC, black traces), but not non-transfected HEK293T cells (unresponsive to AITC, blue traces). (C) Percentage of cells responding to LPS. In each experiment, non-transfected and transfected cells were identified by their unresponsiveness or responsiveness to the dTRPA1 agonist AITC.
Download links
A two-part list of links to download the article, or parts of the article, in various formats.
Downloads (link to download the article as PDF)
Open citations (links to open the citations from this article in various online reference manager services)
Cite this article (links to download the citations from this article in formats compatible with various reference manager tools)
Gustatory-mediated avoidance of bacterial lipopolysaccharides via TRPA1 activation in Drosophila
eLife 5:e13133.
https://doi.org/10.7554/eLife.13133


