PCH1 integrates circadian and light-signaling pathways to control photoperiod-responsive growth in Arabidopsis
- Donald Danforth Plant Science Center, United States
- University of California at Riverside, United States
- Michigan State University, United States
- Mary Institute and Saint Louis Country Day School, United States
Figures
Figure 1 with 5 supplements
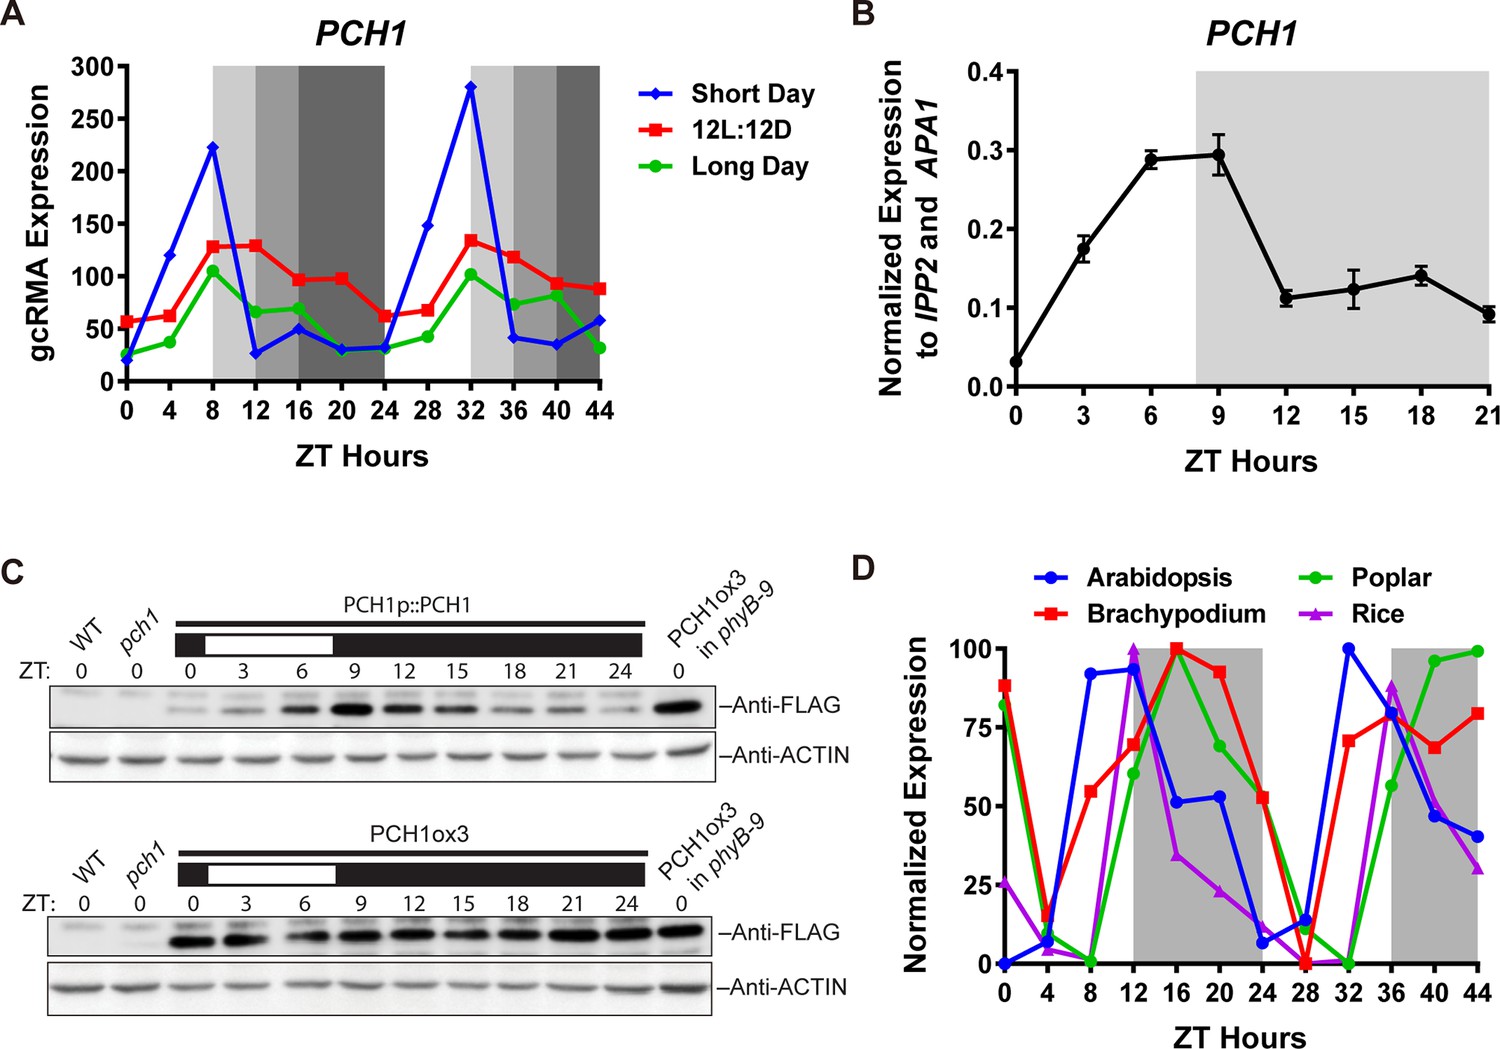
PCH1 (At2g16365.2) encodes a conserved evening-phased protein.
(A) Time-course gcRMA (GeneChip Robust Multiarray Averaging) values of PCH1 expression (from Diurnal database, http://diurnal.mocklerlab.org/, Mockler et al., 2007) under short day, 12L:12D and long day conditions (Light: Dark hours = 8:16, 12:12 and 16:8, respectively). Grey shading indicates dark period. (B) Time-course qPCR analysis of PCH1 expression using cDNA samples (from ZT 0 to 24, with 3 hr intervals) of 4-day-old seedlings grown under short day conditions, normalized to IPP2 and APA1. Mean ± SD (n=3 biological reps). (C) Anti-FLAG immunoblotting detecting PCH1-His6-FLAG3 levels using protein extracts from time-course samples (from ZT 0 to 24, with 3 hr intervals) of 4-day-old, short-day-grown PCH1p::PCH1 and PCH1ox3 plants, which express the tagged PCH1 protein driven by the PCH1 native promoter or the 35S CaMV promoter, respectively. Actin was used for normalization. Rectangles above blots represent light/dark conditions under which samples were flash frozen in liquid N2, white = light and black = dark. Wild type (WT), pch1 and PCH1ox3 in phyB-9 were controls for immunoblots. (D) Normalized gcRMA values of PCH1 orthologs from Arabidopsis thaliana (At2g16365), Brachypodium distachyon (Bradi2g46850), Oryza sativa (Rice, LOC_Os01g49310), and Populus trichocarpa (Poplar, POPTR_0004s16430.1) under 12L:12D conditions from Diurnal database, http://diurnal.mocklerlab.org/, Mockler et al., 2007). Expression is normalized to min and max value.
Figure 1—figure supplement 1
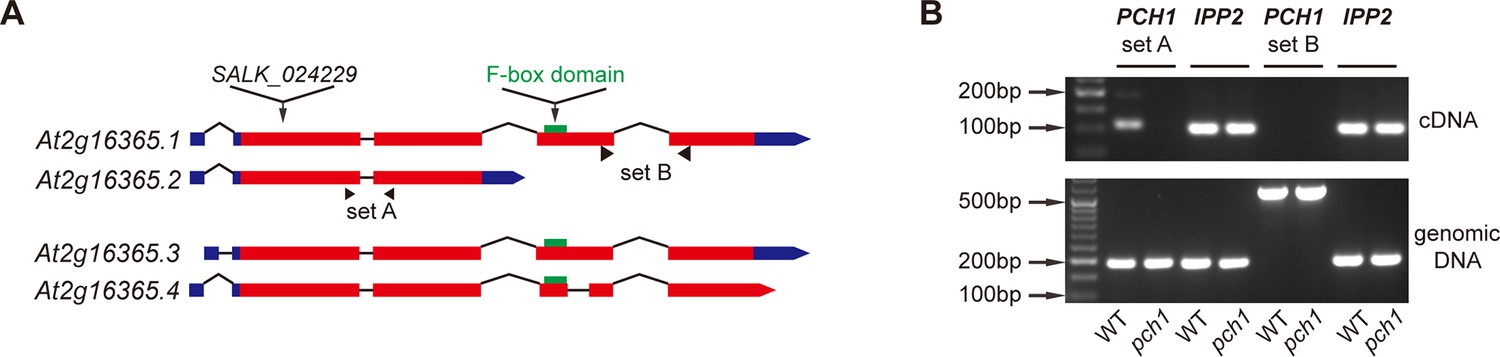
At2g16365.2 is the predominant transcript of PCH1.
(A) Schematic structures of four splice variants of At2g16365. Solid boxes represent exons (red) and UTR (blue), while introns are shown as lines. The T-DNA insertion site of SALK_024229 (pch1), two sets of primers A and B for qPCR, and the F-box domain (green) are denoted. (B) Semi-quantitative qPCR indicates At2g16365.2 is the predominant transcript. Primer set A and B from (A) were used to distinguish transcripts of At2g16365.2 from those of At2g16365.1, 3 and 4 (for set A, cDNA amplicon = 109 bp, genomic DNA amplicon = 191 bp; for set B, cDNA amplicon = 163 bp, genomic DNA amplicon = 554 bp). Expression of IPP2 was used for normalization. Both cDNA and genomic DNA of WT and pch1 were used for comparison.
Figure 1—figure supplement 2
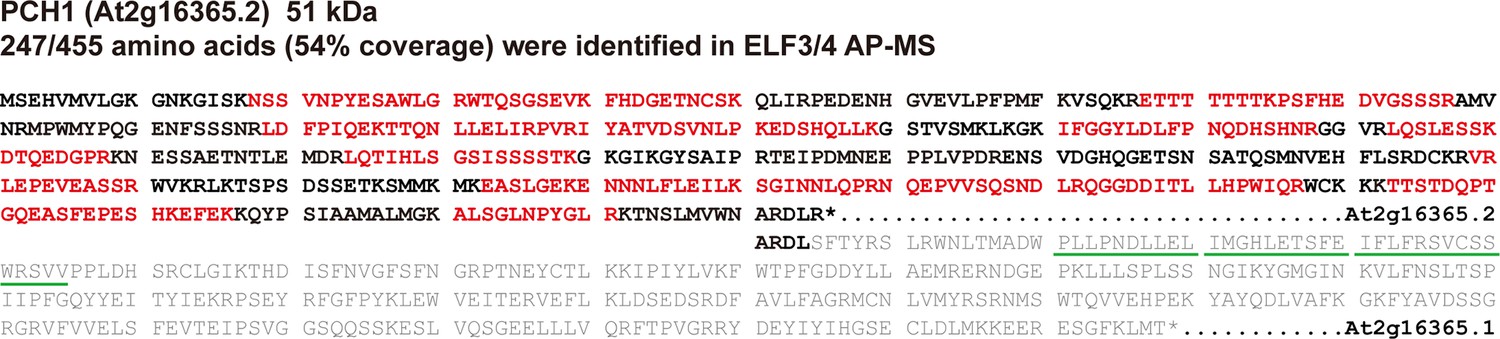
Peptides identified by ELF3/4 AP-MS only mapped to the protein encoded by At2g16365.2.
Comparison of the amino acid sequences of protein encoded by At2g16365.2 and At2g16365.1 (amino acids encoded by exon 3 and 4 were in gray), with peptides that were identified by ELF3 or ELF4 AP-MS (Huang et al., 2015) highlighted by red color and the F-box motif underscored with green lines. The star symbol means the stop codon.
Figure 1—figure supplement 3
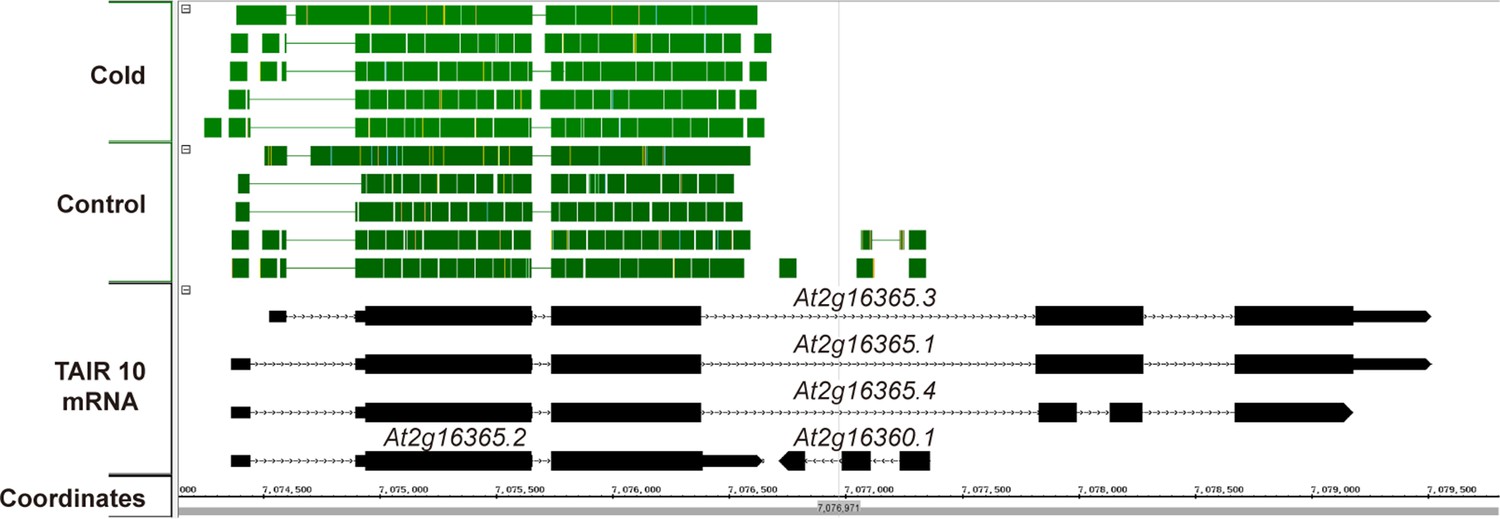
Available RNAseq data suggest only At2g16365.2 is expressed.
A screen capture from IGB (Integrated Genome Browser) analyzing a publically available RNAseq dataset (Gulledge et al., 2014). RNAseq reads are represented by solid green blocks and only mapped to the At2g16365.2 locus.
Figure 1—figure supplement 4
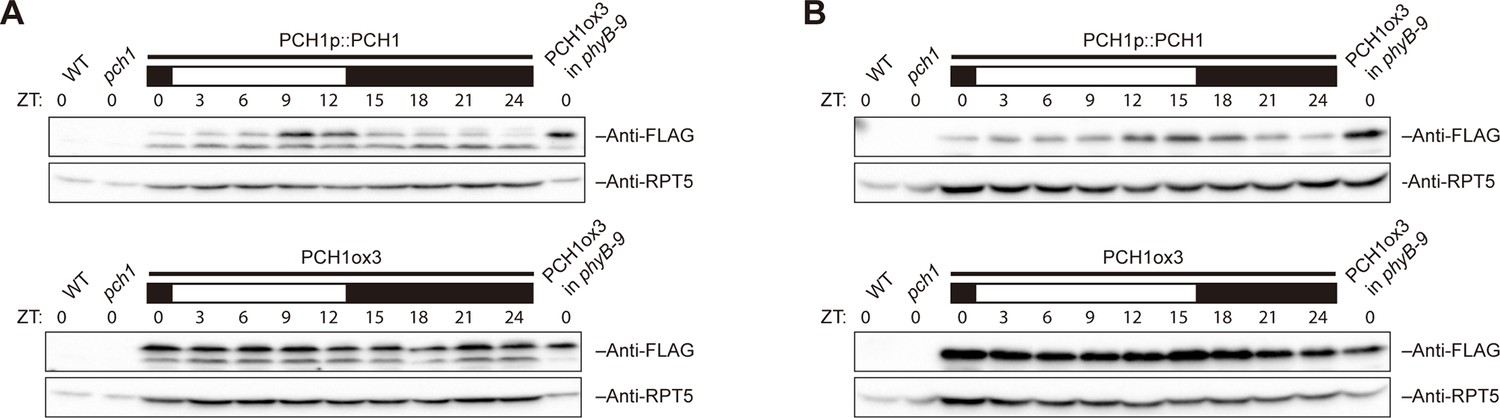
PCH1 levels peak at dusk under 12L:12D or long day conditions.
Time-course protein extracts (from ZT 0 to 24, with 3 hr intervals) from 4-day-old PCH1p::PCH1 and PCH1ox3 lines grown under either 12L:12D (A) or long day (B) conditions were immunoblotted with anti-FLAG antibodies to detect the PCH1-His6-FLAG3 fusion protein. RPT5 was used as a loading control. The rectangles above represent the light conditions during harvesting: black= lights off, white= lights on. Extracts of WT, pch1, and PCH1ox3 in phyB-9 were loaded as western controls.
Figure 1—figure supplement 5
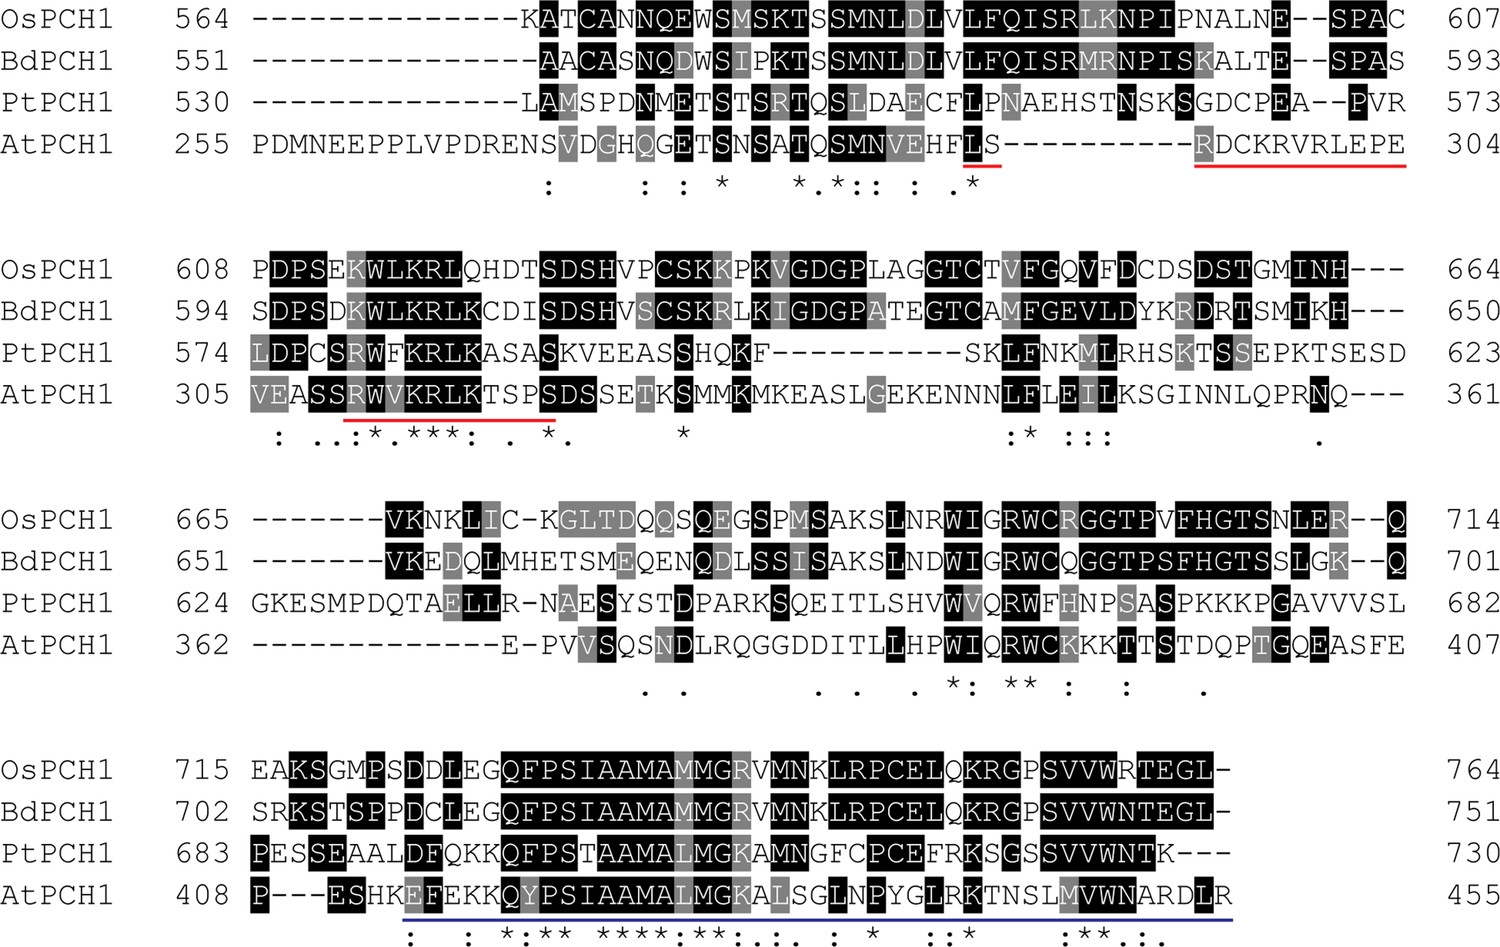
Multiple sequence alignments of PCH1 orthologs at the C-terminus.
The last 201 amino acids of PCH1 orthologs from Arabidopsis thaliana (AtPCH1, At2g16365.2), Brachypodium distachyon (BdPCH1, Bradi2g46850) (International Brachypodium Initiative, 2010), Oryza sativa (OsPCH1, LOC_Os01g49310) (Ouyang et al., 2007), and Populus trichocarpa (PtPCH1, POPTR_0004s16430.1) (Tuskan et al., 2006) were compared. Multiple sequence alignments were done using Clustal Omega with default settings (http://www.ebi.ac.uk/Tools/msa/clustalo/) and formatted by BoxShade server (http://www.ch.embnet.org/software/BOX_form.html). Conserved residues were highlighted and labeled with symbols. A conserved region C-terminus (the last 43 amino acids) was underscored with blue. A bipartite nuclear localization sequence predicted by cNLS Mapper (Kosugi et al., 2009) was underscored in red.
Figure 2 with 1 supplement
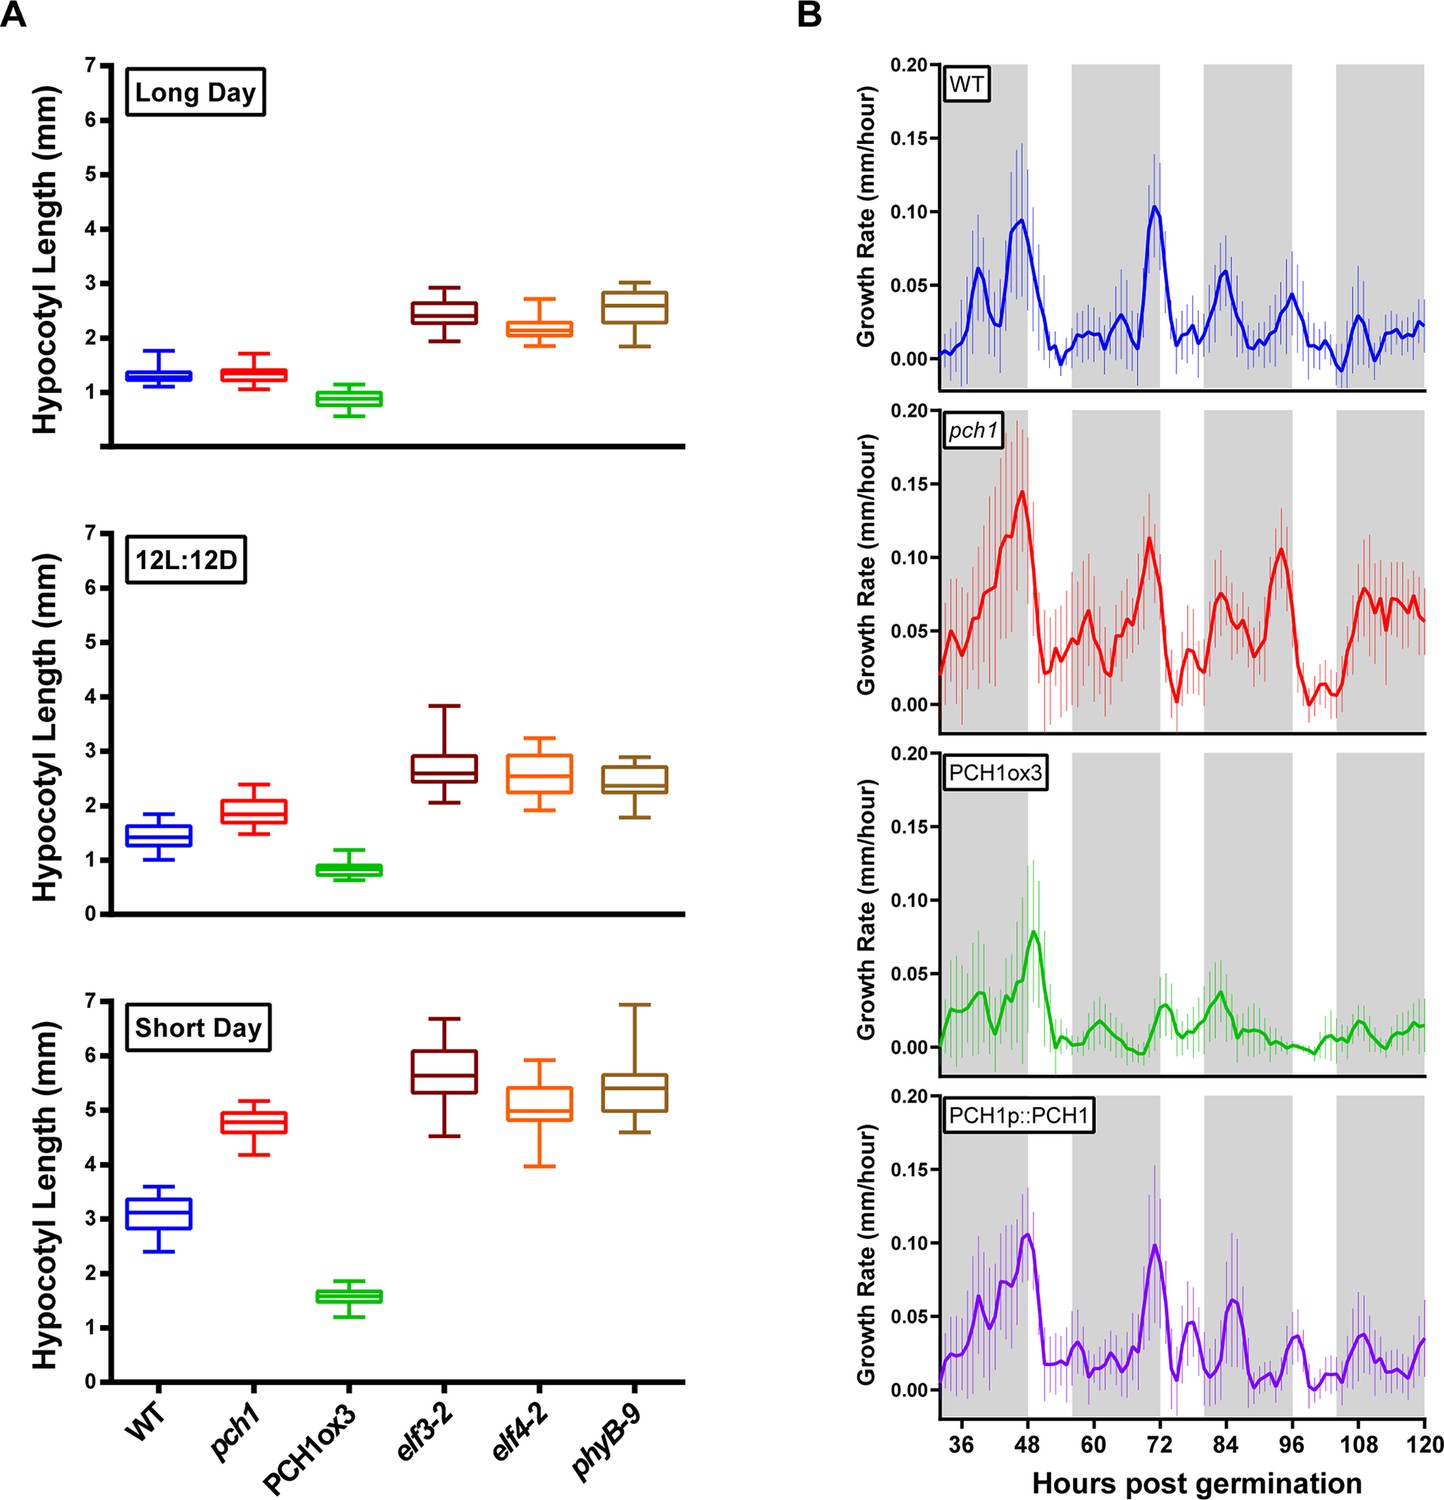
PCH1 regulates the photoperiodic response of hypocotyl elongation in the evening.
(A) Hypocotyl lengths of 4-day-old WT, pch1, PCH1ox3, elf3-2, elf4-2 and phyB-9 seedlings grown under long day, 12L:12D and short day conditions. Mean ± 95% confidence interval (CI) (n=20). (B) pch1 grows faster than WT during night. Time-lapse images were taken every hour for each seedling of WT, pch1, PCH1ox3 and PCH1p::PCH1 grown under short day conditions. Growth rate was calculated as the hypocotyl increase per hour and plotted against time. Solid lines are the regression analyses of data. Mean ± SEM (n ≥ 14). Grey shading indicates dark period. Also see Figure 2—source data 1 and 2.
-
Figure 2—source data 1
Raw measurements of hypocotyl lengths for Figure 2A.
Hypocotyl lengths (mm) of 4-day-old WT, pch1, PCH1ox3, elf3-2, elf4-2 and phyB-9 seedlings grown under long day, 12L:12D and short day conditions, with n = 20.
- https://doi.org/10.7554/eLife.13292.010
-
Figure 2—source data 2
ANOVA analyses and Bonferroni's multiple comparison tests for Figure 2A.
2-way ANOVA analyses were carried out using GraphPad Prism (version 6.0, Graphpad.com, La Jolla, California), with Bonferroni's multiple comparisons test results.
- https://doi.org/10.7554/eLife.13292.011
Figure 2—figure supplement 1
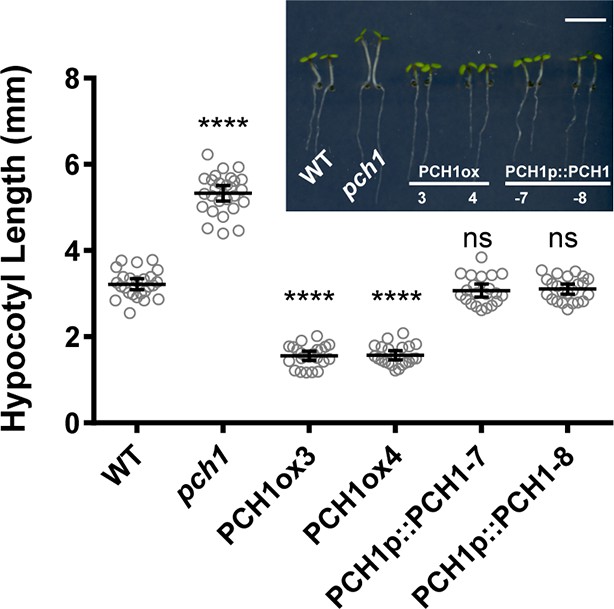
PCH1 levels regulate hypocotyl length under short day conditions.
Hypocotyl lengths of short-day-grown, 4-day-old plants of WT, pch1, two independent overexpression lines (PCH1ox3 and 4, in WT) and two complementation lines (PCH1p::PCH1-7 and -8, in pch1) were measured. Inset photo of each genotype with scale bar = 5 mm. Mean ± 95% CI (n=20). (****p<0.0001, ns = not significant, each compared to WT).
Figure 3 with 1 supplement
Phenotypic characterization of pch1 and PCH1ox3 in circadian and flowering pathways.
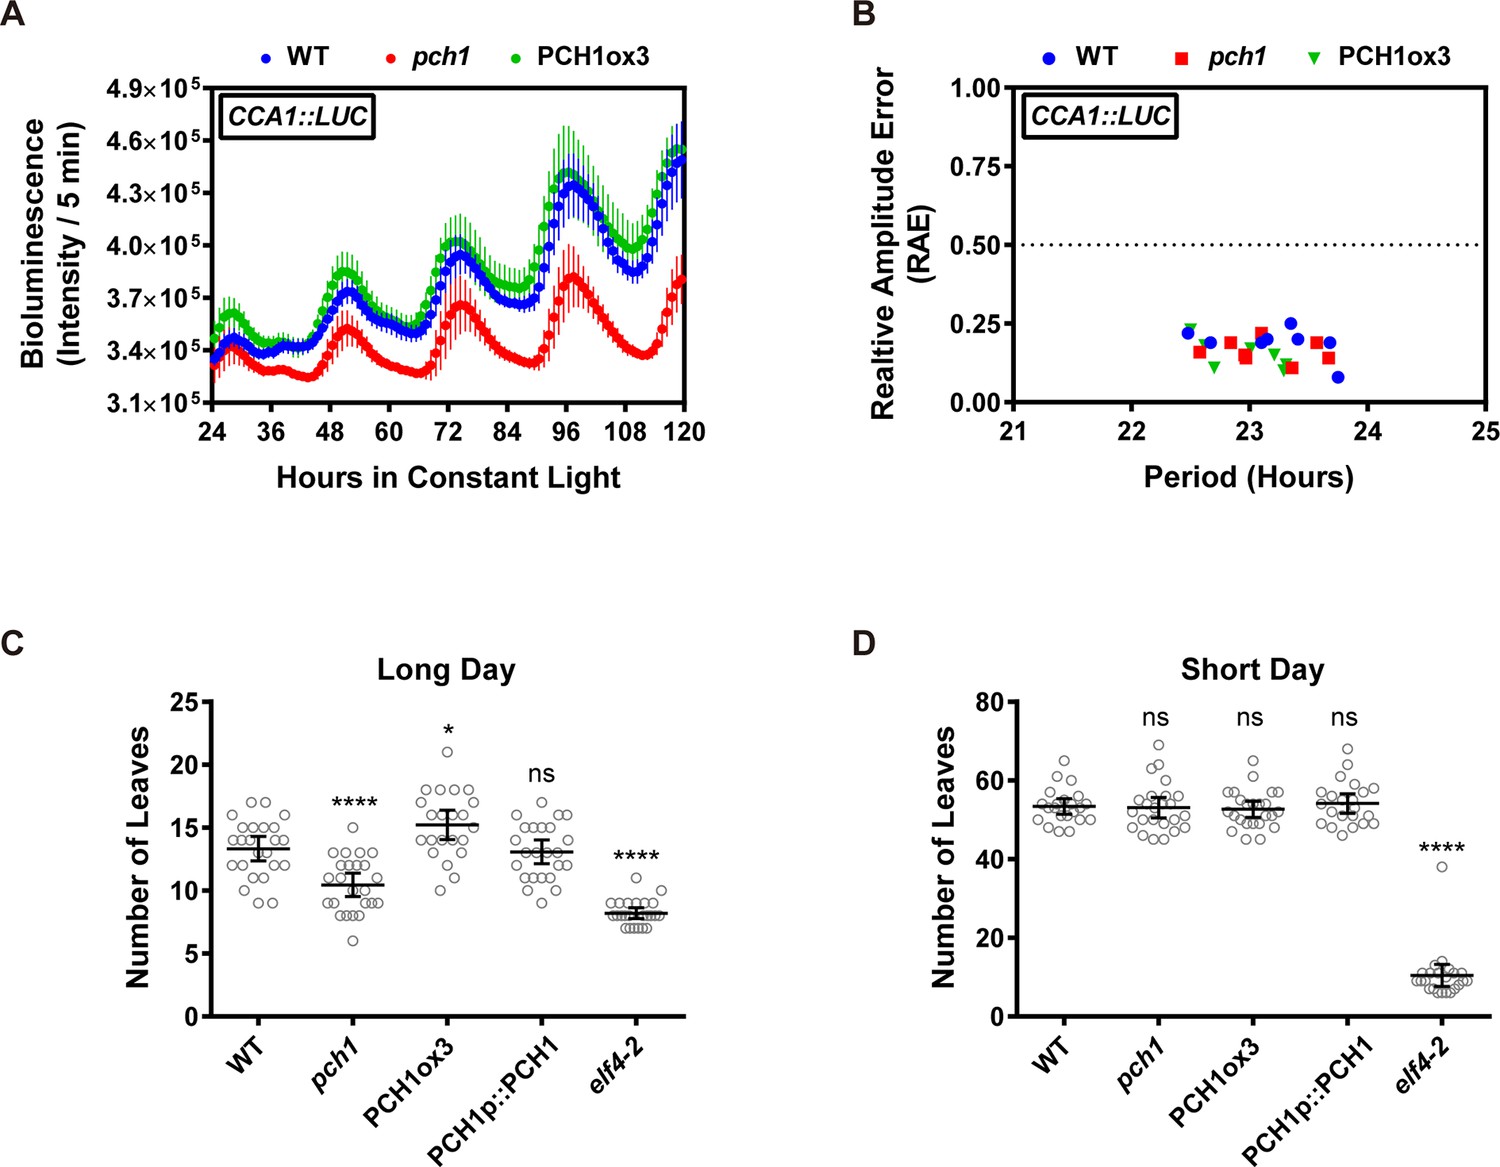
(A) Seedlings of WT, pch1, or PCH1ox3 carrying the CCA1:LUC luciferase reporter were grown under 12L:12D conditions for five days before transferring to continuous white light. Bioluminescence were plotted against ZT hours. Mean ± SD (n = 8). Experiments were repeated at least three times. (B) Relative amplitude error (RAE) versus period of WT, pch1, and PCH1ox3 rhythms was plotted. RAE = 0.5 was used as a cutoff (dotted line), above which a seedling is not considered rhythmic (n = 8). Experiments were repeated at least three times. (C) and (D) Flowering assays under either long day (C) or short day (D) conditions were conducted. Number of rosette leaves from WT, pch1, PCH1ox3 and PCH1p::PCH1 plants with 1 cm inflorescence stem was counted. Mean ± 95% CI (n ≥ 20). One-way ANOVA and multiple comparisons were done, with star symbols indicating if it is significantly different from WT (*p=0.012, ****p<0.0001, ns = not significantly different). Experiments were repeated twice.
Figure 3—figure supplement 1
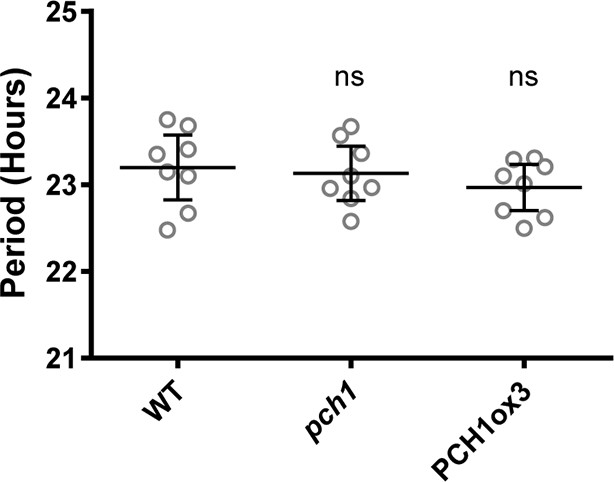
Modulating PCH1 levels does not affect the circadian period.
Comparison of WT, pch1, and PCH1ox3 periods using data from Figure 3A and B. Mean ± 95% CI (n = 8). ns = not significantly different than WT. Experiments were repeated at least three times.
Figure 4 with 1 supplement
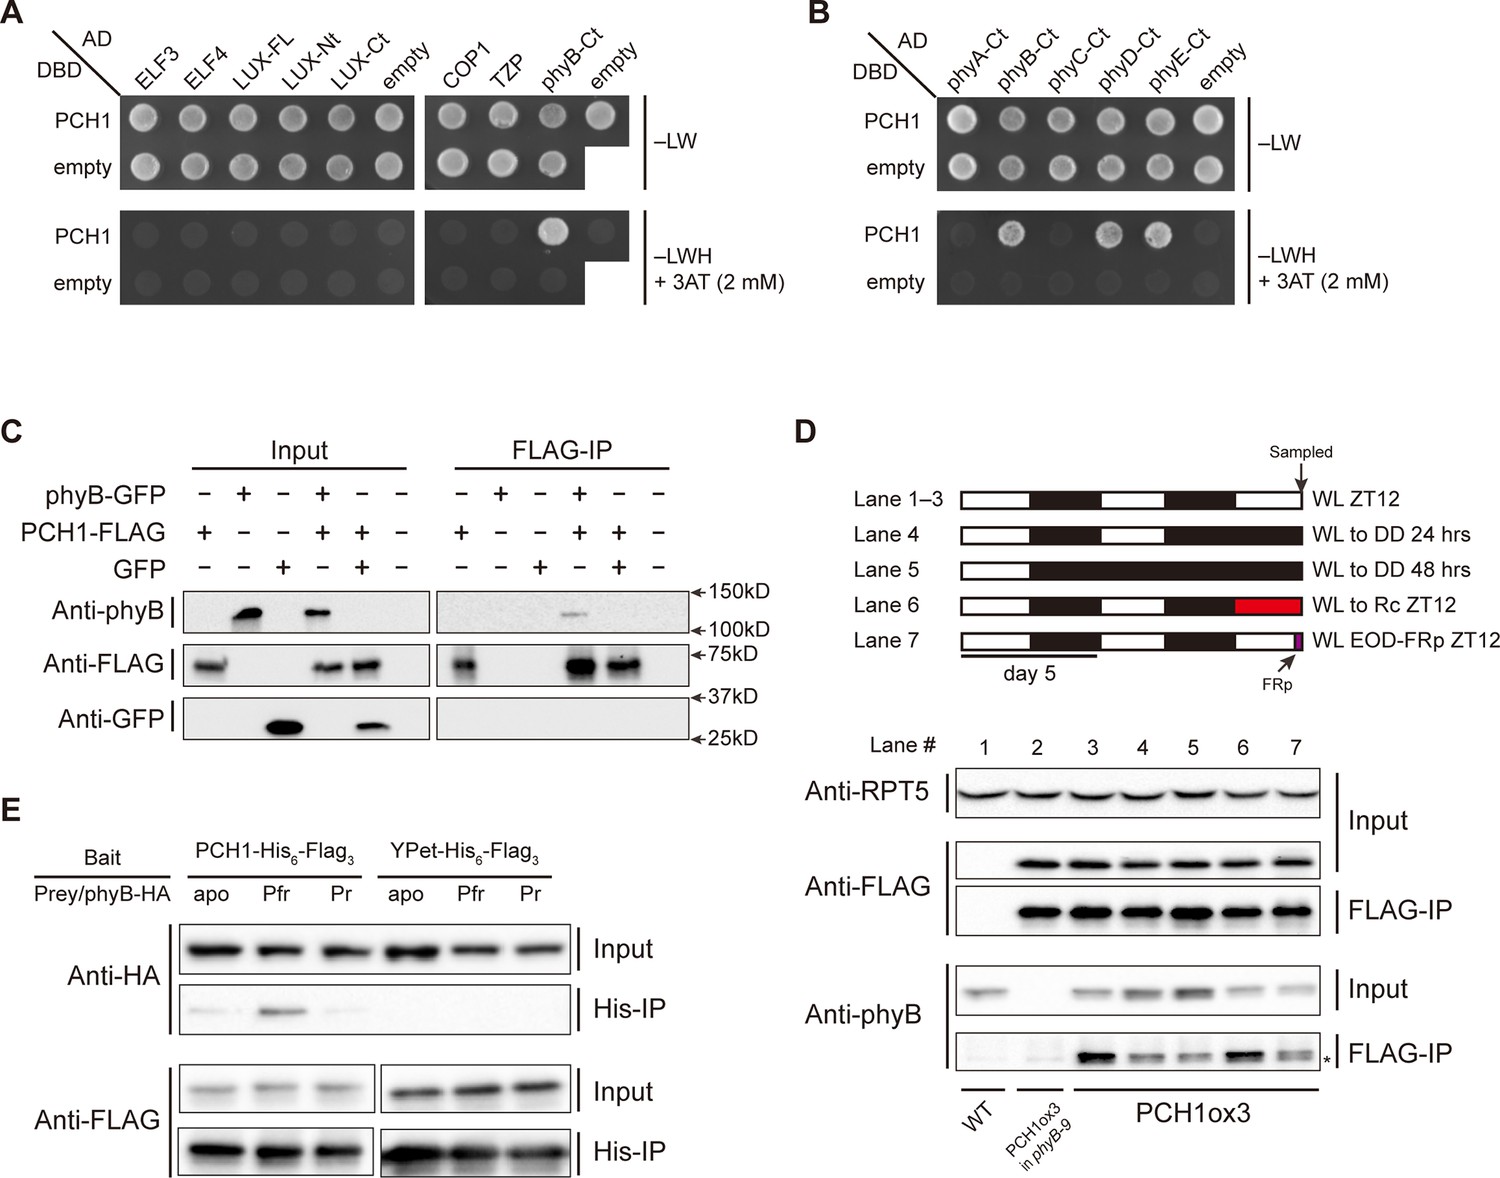
PCH1 directly interacts with phyB in a light-dependent manner.
(A) and (B) yeast two-hybrid between PCH1 (fused to GAL4 DNA binding domain, DBD) and preys (ELF3, ELF4, N-/C- termini (Nt or Ct) and full length (FL) LUX, COP1, TZP and the Ct of phyA, B, C, D, and E fused to GAL4 activating domain, AD). –LW select (minus Leu and Trp) for presence of both DBD and AD constructs and–LWH+3AT plates (minus Leu, Trp and His, with 2 mM 3AT added) tested interactions. (C) Transient tobacco co-immunoprecipitation (IP) assay with PCH1-His6-FLAG3 and phyB-GFP or GFP. IPs were done against FLAG followed by westerns using either anti-FLAG, phyB or GFP antibodies. (D) The in-vivo PCH1-phyB interaction is light-sensitive. A schematic of the light treatment is above western. PCH1ox3 seedlings entrained in 12L:12D white light (WL) were either exposed to WL for 12 hr (WL ZT12, lane 1 to 3), subjected to extended dark (WL to DD) for 24 or 48 hr (lane 4 and 5), red light for 12 hr (WL to Rc ZT12, lane 6), or an end-of-day far-red pulse for 10 min after 12 hr of WL (WL EOD-FRp ZT12, lane 7). WT and PCH1ox3 in phyB-9 plants are western controls. IPs were done against FLAG followed by westerns using either anti-FLAG or phyB antibodies. Anti-RPT5 was used as a loading control. The asterisk at the FLAG-IP / anti-phyB notes an unspecific band that migrates faster than phyB that is present in every lane. (E) PCH1 preferentially binds the Pfr form of phyB in in vitro. Recombinant His6-PCH1-His6-FLAG3 or His6-YPet-His6-FLAG3 was incubated with phyB-HA transcribed and translated by rabbit-reticulate lysate. PΦB absent (apo) phyB precipitations were incubated in the dark, while red (Pfr) or far red light (Pr) were incubated with 20 μM PΦB. His-affinity capture was followed by immunoblotting for anti-HA or anti-FLAG.
Figure 4—figure supplement 1
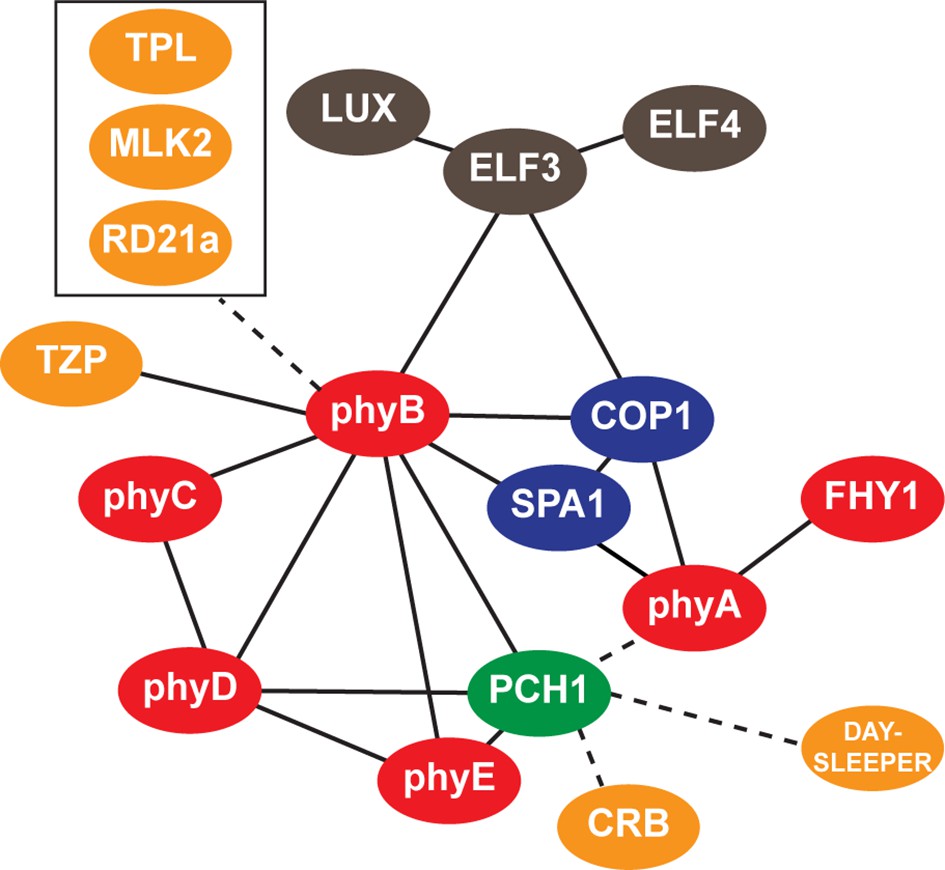
Interaction map of PCH1-associated proteins.
An updated interaction map from previous described (Huang et al., 2015), which integrate our AP-MS and protein-protein interaction data to illustrate both directly and indirectly interacting proteins that co-precipitate with PCH1. Solid lines indicate direct interactions determined in this study or previously defined, while dotted lines indicate association.
Figure 5 with 1 supplement
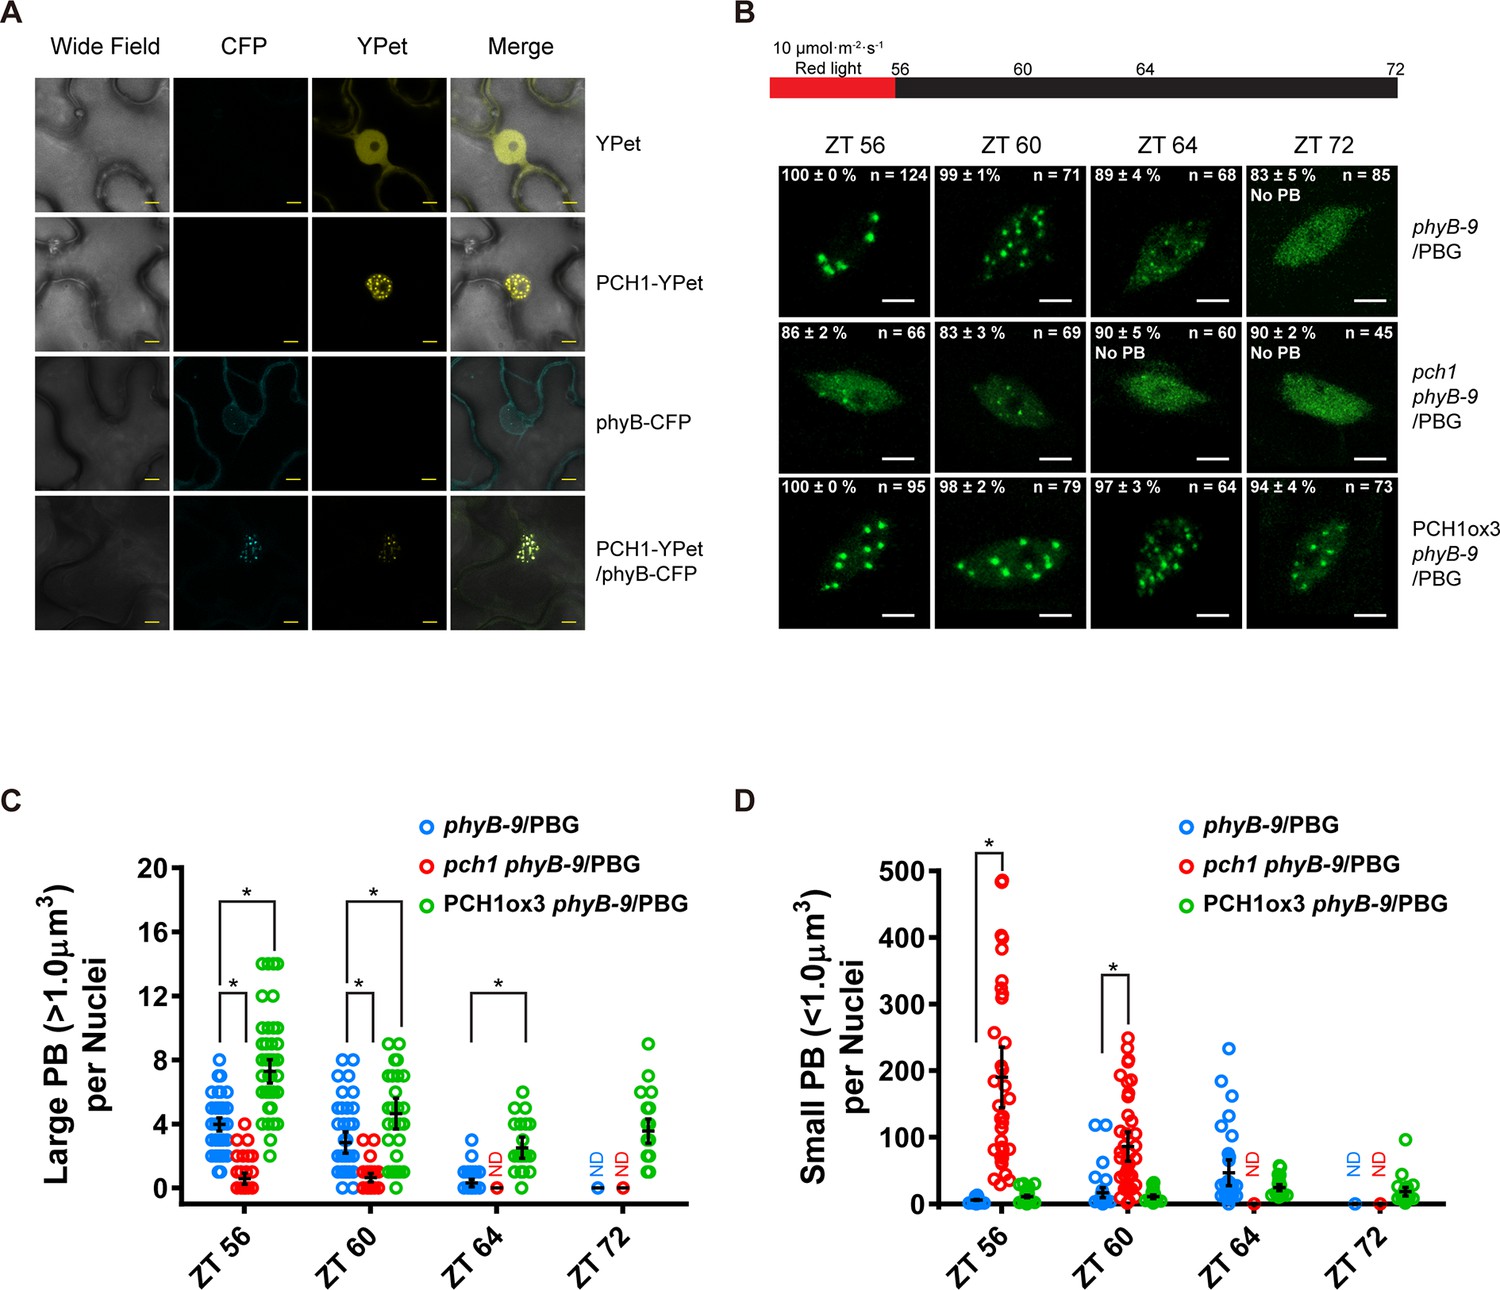
PCH1 is localized in the nucleus to stabilize phyB-containing photobodies.
(A) PCH1-YPet is nuclear localized when transiently expressed in tobacco and co-localizes with phyB-CFP to photobodies. YPet alone was used as control. Scale bars = 25 µm. (B) Representative confocal images showing phyB-GFP-containing photobodies in phyB-9, pch1 phyB-9 and PCH1ox3 phyB-9 plants at indicated time points during light-to-dark transition. Plants were entrained in short days with 10 µmol·m-2·s-1 of red light for two days before transferring to extended dark (ZT 56 to 72). The representative images were picked based on the photobody morphology of the majority of the nuclei (>50%). The percentage of nuclei showing the corresponding photobody patterns (with or without photobodies) were calculated based on three independent experiments. N represents the total number of nuclei analyzed for each time point. Scale bars equal to 5 μm. No PB = photobodies not detected. (C) and (D) compare quantitative measurements of large (>1 μm3, C) or small (<1 μm3 , D) phyB photobodies in all backgrounds. Mean ± 95% CI (n ≥ 29). ND = no PB of according size were detected. * symbol indicates significantly different (p<0.05, see text for more details about each p value).
Figure 5—figure supplement 1
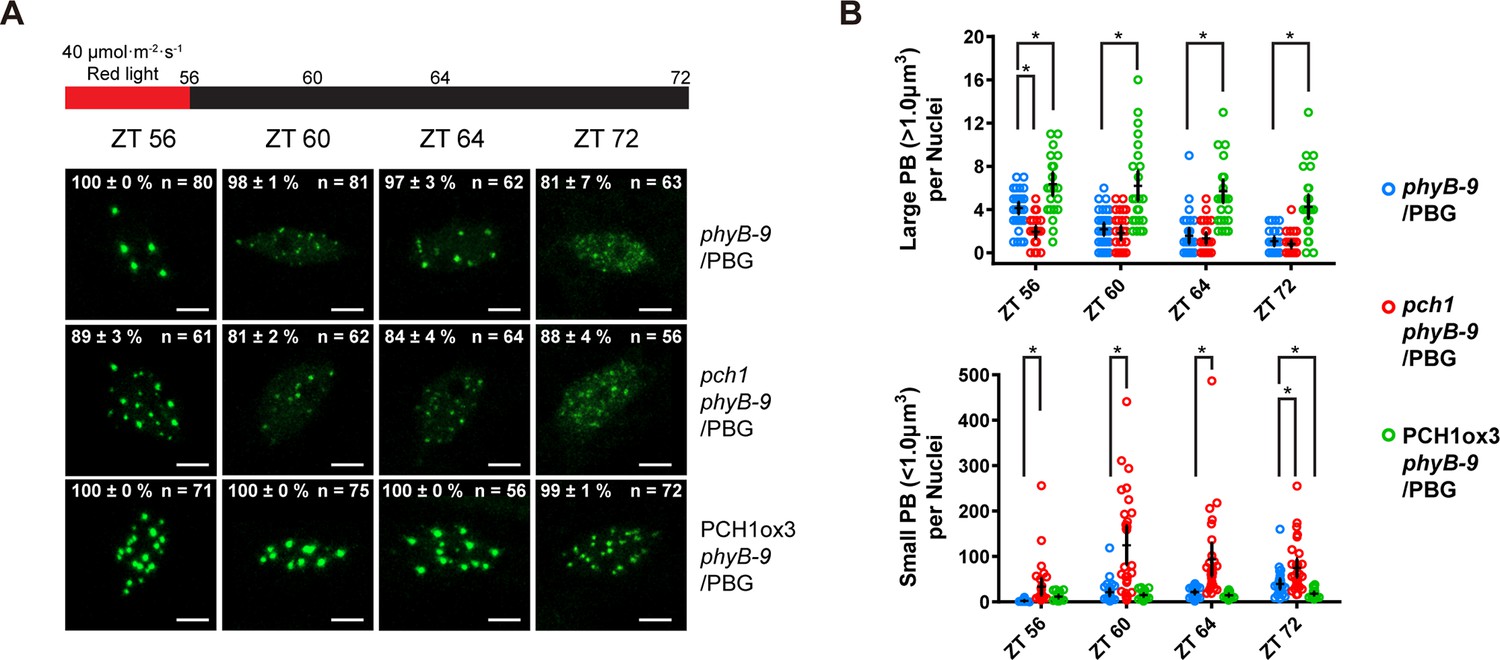
Fewer large photobodies were detected in pch1 with higher intensity of red light treatment.
(A) Representative confocal images showing phyB-containing photobodies in phyB-9, pch1 phyB-9 and PCH1ox3 phyB-9 plants expressing a phyB-GFP (PBG) fusion protein. Plants were entrained by the short day condition supplemented with 40 µmol·m-2·s-1 of red light for two days before extended dark treatment. Scale bars indicate 5 µm. The percentage value in each representative image indicates the mean percentage of all nuclei with the phenotypes shown in the image (with or without photobodies) from three independent experiments. n indicates the total number of nuclei to generate the percentage. (B) Quantitative measurements of photobodies larger than 1.0 μm3 (Large PB, upper) or smaller than 1.0 μm3 (Small PB, lower) were analyzed in all seedlings and indicated by Mean ± 95% CI (n ≥ 29). * symbol indicates significantly different (p<0.05, see text for more details about each p value).
Figure 6 with 1 supplement
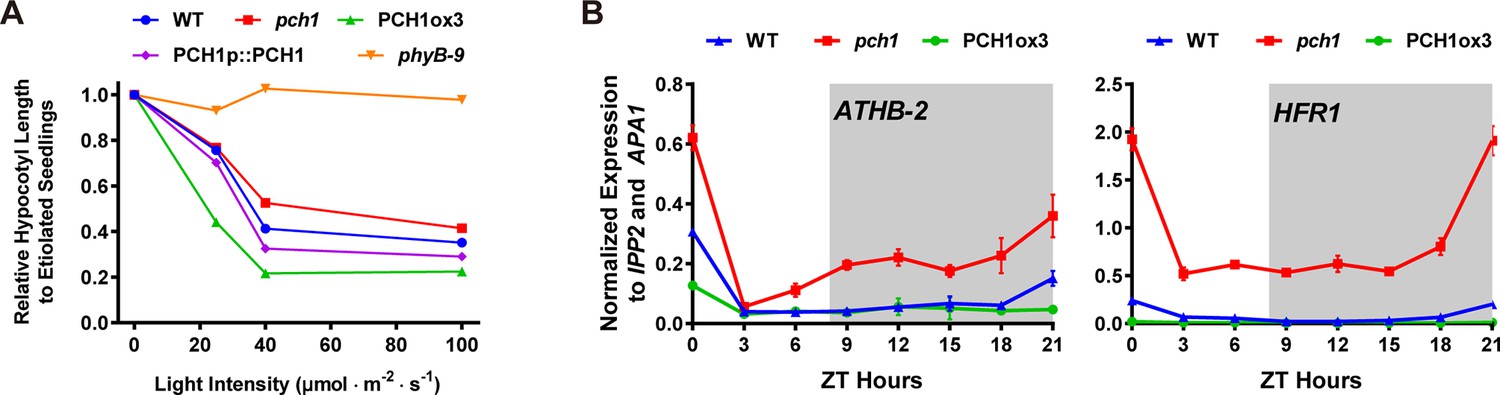
pch1 exhibits defects in red light responsive hypocotyl growth and expression of downstream transcription factors.
(A) Hypocotyl lengths of 4-day-old WT, pch1, PCH1ox3, PCH1p::PCH1 and phyB-9 seedlings grown under either dark or constant red light of various intensities (25, 40 and 100 µmol·m-2·s-1). Mean ± 95% CI (n = 20). Hypocotyl lengths of light-grown seedlings were normalized to dark-grown (etiolated) seedlings, and were plotted against light intensities to generate the responsive curve. Etiolated hypocotyl lengths (mean ± SD) of WT, pch1, PCH1ox3, PCH1p::PCH1 and phyB-9 are 9.02 ± 0.90, 8.47 ± 0.66, 8.04 ± 0.70, 8.71 ± 0.71 and 7.63 ± 0.79, respectively. (B) qPCR of HFR1, ATHB-2 using time-course cDNA samples of short-day grown, 4-day-old WT, pch1 and PCH1ox3 seedlings. Expression was normalized to IPP2 and APA1. Mean ± SD (n=3 biological reps). Grey shading indicates dark period.
Figure 6—figure supplement 1
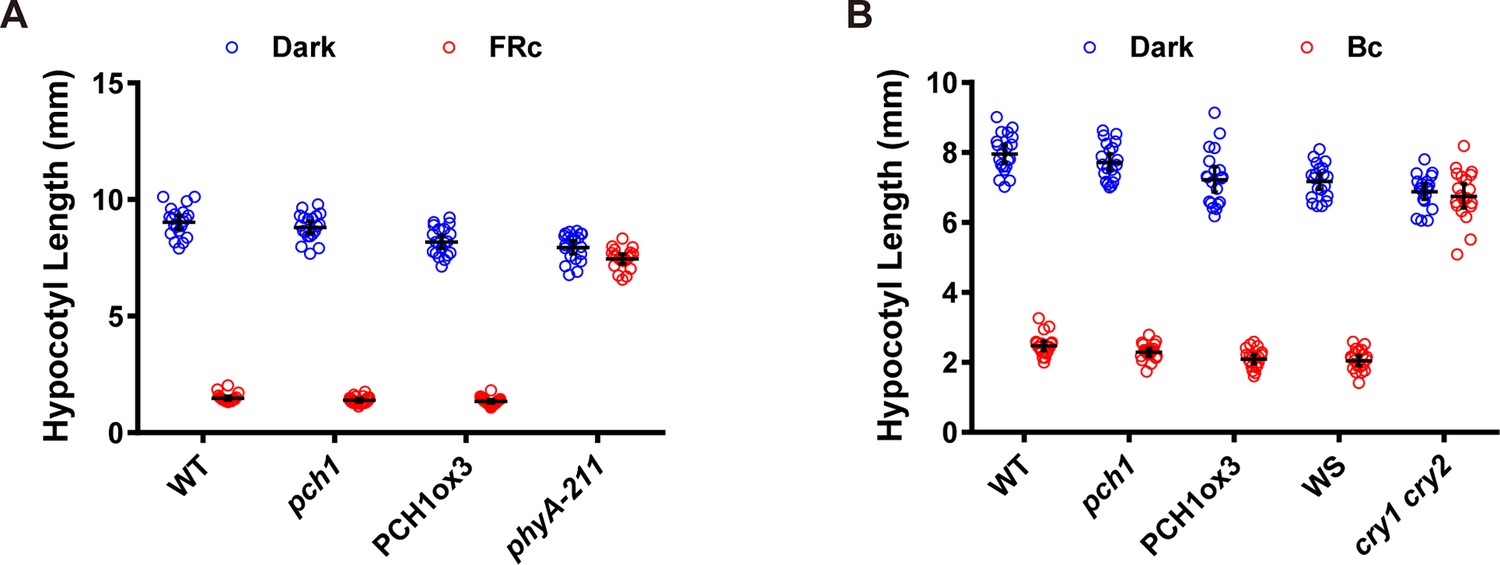
pch1 does not affect far-red or blue light mediated hypocotyl elongation.
(A) Hypocotyl measurements of 4-day-old WT, pch1, PCH1ox3 and phyA-211 seedlings grown under either dark or constant far-red light conditions (FRc, 25 µmol·m-2·s-1). Mean ± 95% CI (n = 20). (B) Hypocotyl measurements of 4-day-old WT (Col), pch1, PCH1ox3, Wassilewskija (WS) and cry1 cry2 (in WS) seedlings under either dark or constant blue light conditions (Bc, 20 µmol·m-2·s-1). Mean ± 95% CI (n = 20).
Figure 7
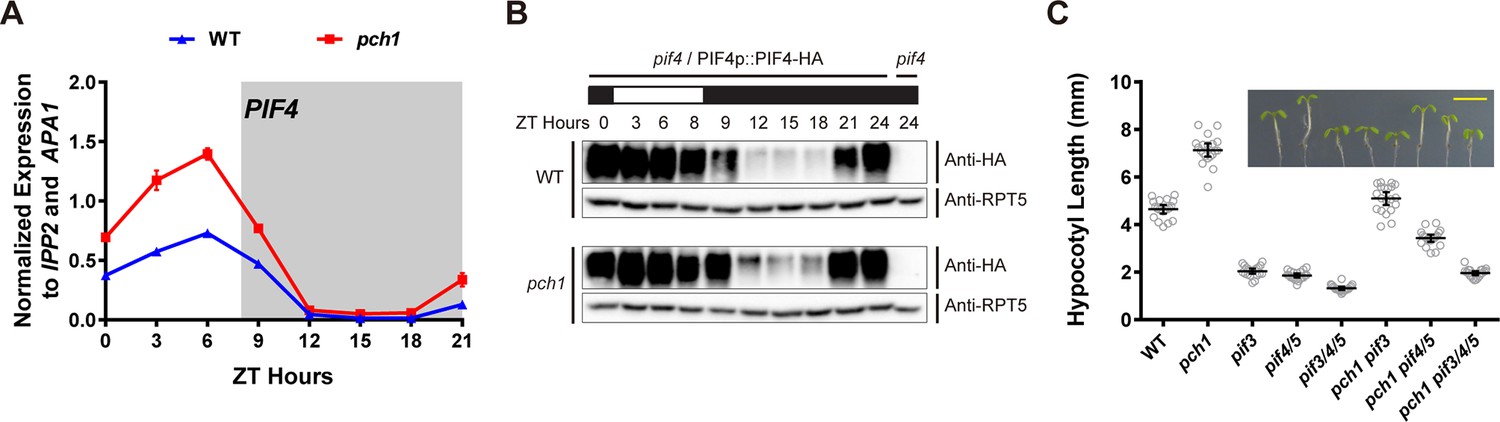
pch1 affects PIF4 levels and PIFs are required for the hypocotyl phenotype in pch1.
(A) qPCR of PIF4 using time-course cDNA samples of short-day grown, 4-day-old WT and pch1 seedlings. Expression was normalized to IPP2 and APA1. Mean ± SD (n=3 biological reps). Grey shading indicates dark period. (B) Anti-HA immunoblots for testing PIF4-HA levels in WT (pif4/PIF4p::PIF4-HA) and pch1 (pch1 pif4/PIF4p::PIF4-HA) genetic backgrounds. Time-course protein extracts (from ZT 0 to 24, with 3 hr intervals, plus ZT 8) were made from short-day-grown, 4-day-old seedlings. Rectangles above blots represent light/dark conditions under which samples were flash frozen in liquid N2, white = light and black = dark. Anti-RPT5 used as a loading control. pif4 extracts were used as a negative western control. (C) Hypocotyl lengths of 7-day-old, short-day-grown WT, pch1, pif3, pif4/5, pif3/4/5, pch1 pif3, pch1 pif4/5 and pch1 pif3/4/5 seedlings were measured. Mean ± 95% CI (n = 20). Inset shows representative phenotypes with the scale bar = 5 mm.
Figure 8 with 1 supplement
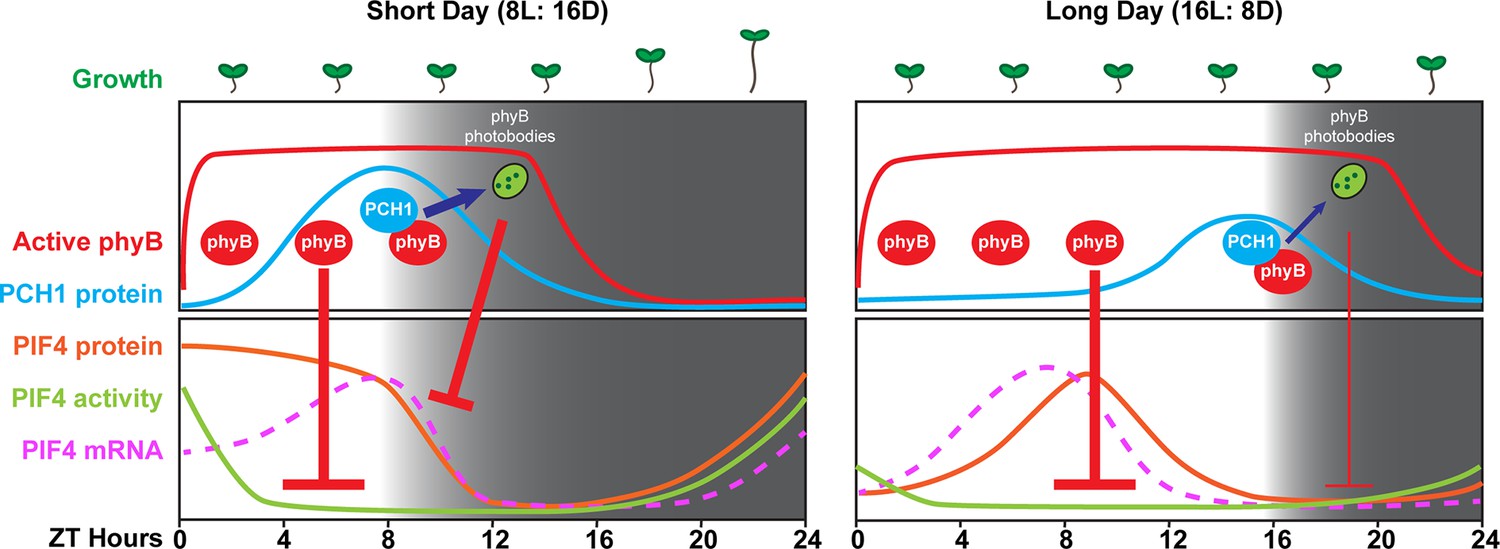
A model of PCH1-regulated day-length specific growth.
A proposed model illustrates the role of PCH1 in controlling the photoperiodic hypocotyl elongation response. In short days, PCH1 peaks at dusk (ZT 8), maintains phyB photobody formation to suppress PIF4 levels and activities (downstream gene expression) to suppress hypocotyl elongation in the early evening. In long days, PIF4 peaks in the middle of the day and is repressed by active phyB. PIF4 protein decreases to basal level prior to dusk (Figure 8—figure supplement 1 and Yamashino et al., 2014), therefore no longer requiring the additional suppression mediated by PCH1-regulated phyB photobodies in the evening.
Figure 8—figure supplement 1
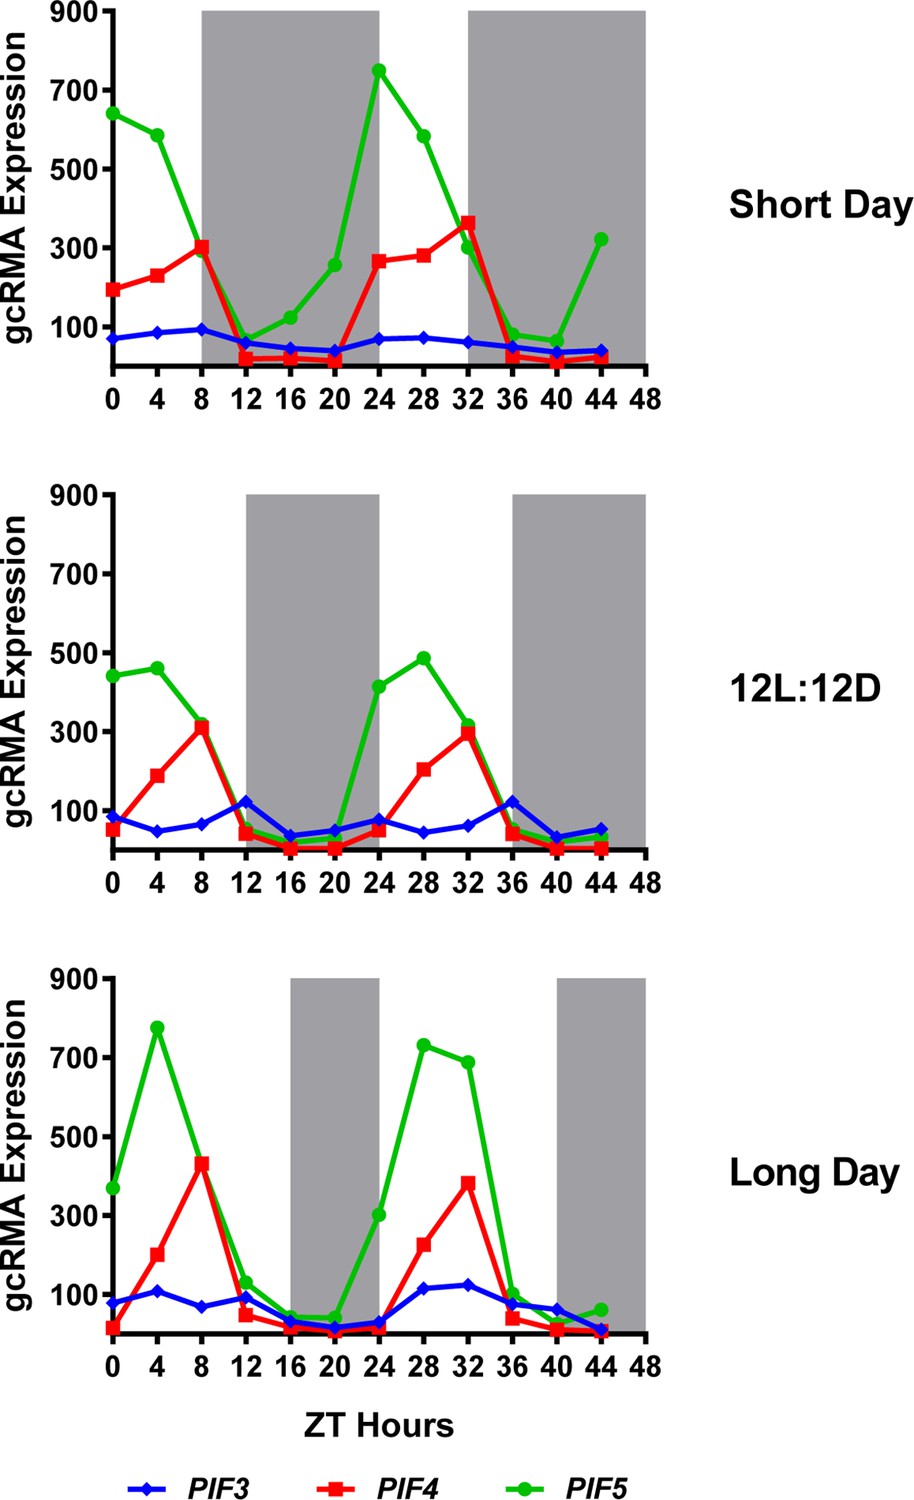
Expression of PIF3, PIF4 and PIF5 under multiple photoperiods.
Daily expression (represented as gcRMA values) of PIF3, PIF4, and PIF5 under short day, 12L:12D (Col_LDHH) and long day conditions were generated from microarray data (Diurnal database, http://diurnal.mocklerlab.org/, Mockler et al., 2007). Note high levels of PIFs (e.g. PIF4s) expression at ZT8 are at dusk in short days, while shifted gradually to the middle of the day when day length increases (e.g. long day conditions). Grey shadings indicate dark periods.
Tables
Table 1
Proteins Co-Purified by PCH1 AP-MS in WT and phyB-9. Proteins co-purified with PCH1 were identified from affinity purification coupled with mass spectrometry (AP-MS) analyses using 12L:12D grown, 10-day-old PCH1ox3 plants (in either WT or phyB-9 mutant backgrounds) harvested at ZT12.
| AGI number | Protein name | ELF3 AP-MSb | Exclusive unique peptide count/Percent coveragea | ||||
|---|---|---|---|---|---|---|---|
| PCH1ox3 in WT | PCH1ox3 in phyB-9 | ||||||
| rep1 | rep2 | rep3 | rep1 | rep2 | |||
| At2g16365 | PCH1c | Y | 30/73% | 41/85% | 37/79% | 40/85% | 32/77% |
| At2g18790 | phyB | Y | 46/69% | 47/65% | 41/60% | — | — |
| At5g35840 | phyC | Y | 31/44% | 23/28% | 25/29% | — | — |
| At4g16250 | phyD | Y | 22/47% | 19/34% | 20/38% | 22/38% | 6/11% |
| At4g18130 | phyE | Y | 41/55% | 40/52% | 45/60% | 49/60% | 31/41% |
| At1g09570 | phyA | Y | 31/46% | 36/49% | 35/45% | 36/48% | 29/39% |
| At2g37678 | FHY1 | N | 2/22% | 2/21% | 4/28% | 4/28% | 2/21% |
| At3g42170 | DAYSLEEPER | Y | 5/13% | — | 4/11% | 3/8% | 2/6% |
| At1g09340 | CRB | Y | —d | —d | 4/17% | 6/24% | 3/13% |
| At5g43630 | TZP | Y | 9/15% | 6/12% | 12/23% | — | — |
| At2g32950 | COP1 | Y | 7/15% | 8/16% | 8/18% | — | — |
| At2g46340 | SPA1 | Y | 8/14% | 5/7% | 8/12% | — | — |
| At2g25930 | ELF3 | Y | 6/12% | 11/25% | 12/26% | — | — |
| At2g40080 | ELF4 | Y | —d | 4/60% | 3/42% | — | — |
| At3g46640 | LUX | Y | 2/6% | —d | 4/15% | — | — |
| At3g03940 | MLK2 | Y | —d | 2/6% | 2/6% | — | — |
| At1g15750 | TPL | N | —d | 3/3% | 4/5% | 2/2% | — |
| At1g47128 | RD21a | Y | —d | 3/8% | 2/4% | —d | —d |
| Also see Table 1—source data 1 | |||||||
-
a All listed proteins match 99% protein threshold, minimum number peptides of 2 and peptide threshold as 95%. Proteins not matching the criteria were marked with "—".
-
b ELF3 AP-MS (Huang et al., 2015) was used for comparison.
-
c Percent coverage for PCH1 is calculated using protein encoded by At2g16365.2.
-
d Only one exclusive unique peptide was detected.
-
Table 1—source data 1
The full list of proteins identified by AP-MS, listing unique peptides and the percent coverage.
The full list is generated and exported by Scaffold (Proteome Software Inc., Portland, Oregon; v.4.4.3) showing all co-purified proteins from all replicates of PCH1ox3 AP-MS and the GFP Control. The file contains reports on exclusive unique peptide counts and percent coverage for each co-purified proteins, with their names, accession numbers and molecular weight.
- https://doi.org/10.7554/eLife.13292.016
Table 2
Proteins Co-Purified by PCH1 AP-MS in elf4-2 and elf3-2, compared to WT. Proteins co-purified with PCH1 were identified from affinity purification coupled with mass spectrometry (AP-MS) analyses using 12L:12D grown, 10-day-old PCH1ox3 plants in either elf4-2 or elf3-2 mutant backgrounds harvested at ZT12.
| AGI number | Protein name | ELF3 AP-MSb | Exclusive unique peptide count/Percent coveragea | ||||||
|---|---|---|---|---|---|---|---|---|---|
| PCH1ox3 in WTc | PCH1ox3 in elf4-2 | PCH1ox3 in elf3-2 | |||||||
| rep1 | rep2 | rep3 | rep1 | rep2 | rep1 | rep2 | |||
| At2g16365 | PCH1d | Y | 30/73% | 41/85% | 37/79% | 29/77% | 34/78% | 42/82% | 36/82% |
| At2g18790 | phyB | Y | 46/69% | 47/65% | 41/60% | 47/70% | 31/46% | 42/63% | 40/56% |
| At5g35840 | phyC | Y | 31/44% | 23/28% | 25/29% | 30/43% | 13/16% | 20/28% | 15/18% |
| At4g16250 | phyD | Y | 22/47% | 19/34% | 20/38% | 20/42% | 12/25% | 20/37% | 16/30% |
| At4g18130 | phyE | Y | 41/55% | 40/52% | 45/60% | 42/57% | 37/50% | 43/55% | 40/53% |
| At1g09570 | phyA | Y | 31/46% | 36/49% | 35/45% | 32/47% | 24/34% | 34/49% | 27/38% |
| At2g37678 | FHY1 | N | 2/22% | 2/21% | 4/28% | —e | 3/21% | —e | 3/21% |
| At3g42170 | DAYSLEEPER | Y | 5/13% | — | 4/11% | 3/7% | 5/11% | 2/5% | —e |
| At1g09340 | CRB | Y | —e | —e | 4/17% | 2/9% | 5/22% | 3/13% | 3/13% |
| At5g43630 | TZP | Y | 9/15% | 6/12% | 12/23% | 4/7% | —e | 12/21% | 2/3% |
| At2g32950 | COP1 | Y | 7/15% | 8/16% | 8/18% | 3/7% | —e | 12/25% | 7/11% |
| At2g46340 | SPA1 | Y | 8/14% | 5/7% | 8/12% | 5/10% | 2/4% | 17/26% | 7/11% |
| At2g25930 | ELF3 | Y | 6/12% | 11/25% | 12/26% | 4/9% | 3/6% | — | — |
| At2g40080 | ELF4 | Y | —e | 4/60% | 3/42% | — | — | — | —e |
| At3g46640 | LUX | Y | 2/6% | —e | 4/15% | —e | — | — | — |
| At3g03940 | MLK2 | Y | —e | 2/6% | 2/6% | — | — | 2/4% | — |
| At1g15750 | TPL | N | —e | 3/3% | 4/5% | 2/3% | 3/3% | 4/5% | 4/5% |
| At1g47128 | RD21a | Y | —e | 3/8% | 2/4% | —e | 2/8% | 3/8% | —e |
| Also see Table 1—source data 1 | |||||||||
-
a All listed proteins match 99% protein threshold, minimum number peptides of 2 and peptide threshold as 95%. Proteins not matching the criteria were marked with "—".
-
b ELF3 AP-MS (Huang et al., 2015) was used for comparison.
-
c PCH1ox3 in WT is as shown in Table 1, for comparison with PCH1ox3 in elf4-2 and elf3-2.
-
d percent coverage for PCH1 is calculated using protein encoded by At2g16365.2
-
e only one exclusive unique peptide was detected.
Table 3
Primers used in this study.
| Primers used for cloning PCH1 and PCH1 promoter a | ||
|---|---|---|
| Amplified Fragments | Forward primer (5'->3') | Reverse primer (5'->3') |
| PCH1-stop | CACCATGTCTGAACATGTTATGGTTTTGG | CTACCTCAAATCCCTTGCATTCCA |
| PCH1-nonstop | CACCATGTCTGAACATGTTATGGTTTTGG | CCTCAAATCCCTTGCATTCCAAAC |
| PCH1-promoter b | AAGCTTAGTTTCCTCATCATTTGCTATTG | GCGTAAATCCTCACCGGTCTT |
| Primers used to generate yeast two-hybrid constructs, all with a stop codon a | ||
| Amplified fragments | Forward primer (5'->3') | Reverse primer (5'->3') |
| PCH1 | CACCATGTCTGAACATGTTATGGTTTTGG | CTACCTCAAATCCCTTGCATTCCA |
| ELF3 | CACCATGAAGAGAGGGAAAGATGAG | CTAAGGCTTAGAGGAGTCATAGCGTTT |
| ELF4 | CACCATGAAGAGGAACGGCGAGACGA | TTAAGCTCTAGTTCCGGCAGCACC |
| LUX (full length) | CACCATGGGAGAGGAAGTACAAA | TTAATTCTCATTTGCGCTTCCACCT |
| LUX-Nt (amino acids 1-143) | CACCATGGGAGAGGAAGTACAAA | CTATTTAAGTGTTTTCCCAGATAG |
| LUX-Ct (amino acids 144-324) | CACCATGCGACCGCGTTTAGTGTGGACA | TTAATTCTCATTTGCGCTTCCACCT |
| phyA-Ct (amino acids 606-1123) | CACCATGGATCTCAAAATTGATGGTATACAA | CTACTTGTTTGCTGCAGCGAGTTC |
| phyB-Ct (amino acids 640-1173) | CACCATGGCGGGGGAACAGGGGATTGATGAG | CTAATATGGCATCATCAGCATCATGTCA |
| phyC-Ct (amino acids 592-1112) | CACCATGGATAATAGGGTTCAGAAGGTAGAT | TCAAATCAAGGGAAATTCTGTGAGGATCAC |
| phyD-Ct (amino acids 645-1165) | CACCATGGTACAGCAAGGGATGCAG | TCATGAAGAGGGCATCATCATCA |
| phyE-Ct (amino acids 583-1113) | CACCATGAATGGCGTAGCAAGAGATGC | CTACTTTATGCTTGAACTACCCTCTGT |
| COP1 | CACCATGGAAGAGATTTCGACGGA | TCACGCAGCGAGTACCAGAACTTTG |
| TZP | CACCATGGGAGATGGAGATGAGCAA | CTAAAAGCCTAACATTTTTCTCTGCTGA |
| Primers used for qPCR | ||
| Gene | Forward primer (5'->3') | Reverse primer (5'->3') |
| PCH1 set A | CCGGCTCCATTTCTTCGTCA | TCCGGAACAAGAGGTGGTTCT |
| PCH1 set B | GAAGTTATTGTTGTCGCCCT | GGGAAATCCAAAGCGGTATT |
| IPP2 | CTCCCTTGGGACGTATGCTG | TTGAACCTTCACGTCTCGCA |
| APA1 (At1g11910) c | CTCCAGAAGAGTATGTTCTGAAAG | TCCCAAGATCCAGAGAGGTC |
| HFR1 | TAAATTGGCCATTACCACCGTTTA | ACCGTGAAGAGACTGAGGAGAAGA |
| ATHB-2 | GAAGCAGAAGCAAGCATTGG | CGACGGTTCTCTTCCGTTAG |
| PIF4 | GTTGTTGACTTTGCTGTCCCGC | CCAGATCATCTCCGACCGGTTT |
| Primers for genotyping | ||
| Mutant | for wild type PCR (5'->3') | for mutant PCR (5'->3') |
| pch1 (SALK_024229) | TGTCAGGTATTTCGGTCCTTG (LP) and CACTTGCTTGATGCTCATGAG (RP) | AAGAACCGGCAAAGATACCAC (RP) and ATTTTGCCGATTTCGGAAC (LBb 1.3) |
| pif3 (SALK_081927C) | AGTCTGTTGCTTCTGCTACGC (LP) and AAGAACCGGCAAAGATACCAC (RP) | ACATACAGATCTTTACGGTGG (RP)and ATTTTGCCGATTTCGGAAC (LBb 1.3) |
| pif4 (pif4-101) d | CTCGATTTCCGGTTATGG (SL42) and CAGACGGTTGATCATCTG (SL43) | GCATCTGAATTTCATAACCAATC (PD14) and CAGACGGTTGATCATCTG (SL43) |
| pif5 (pif5-1) d | TCGCTCACTCGCTTACTTAC (SL46) and TCTCTACGAGCTTGGCTTTG (SL47) | TCGCTCACTCGCTTACTTAC (SL46) and GGCAATCAGCTGTTGCCCGTCTCACTGGTG (JMLB1) |
| elf3-2 c | TGAGTATTTGTTTCTTCTCGAGC and CATATGGAGGGAAGTAGCCATTAC | TGGTTATTTATTCTCCGCTCTTTC and TTGTTCCATTAGCTGTTCAACCTA |
| elf4-2 c | ATGGGTTTGCTCCCACGGATTA and CAGGTTCCGGGAACCAAATTCT, cut with HpyCH4V. WT has 5 cuts while elf4-2 has 4 cuts to give a unique 689 bp band. | |
| phyB-9 | GTGGAAGAAGCTCGACCAGGCTTTG and GTGTCTGCGTTCTCAAAACG, cut with MnlI, phyB-9 gives 167+18 bp bands, WT gives a 185 bp band. | |
| Primers for making pB7SHHc and pB7YSHHc | ||
| Primer Name | Sequence (5'->3') | |
| pDAN0193 | TGCCCGCCTGATGAATGCTC | |
| pDAN0202 | GCGGGATATCACCACCCTAGGCACCACTTTGTACAAGAAAGCTGA | |
| pDAN201 | TCAGCTTTCTTGTACAAAGTGGTGCCTAGGGTGGTGATATCCCGC | |
| pDAN0223 | ATTCTCATGTATGATAATTCGAGG | |
| pDAN0242 | TACAAAGTGGTGCCTAGGGGTGGAAGCTGGAGCCACCCTC | |
| pDAN0241 | GCGGGATATCACCACCCTAGTGATGGTGATGGTGATGAGCG | |
| pDAN0249 | GCTTTCTTGTACAAAGTGGTGCCTGCTGCTGCTGCC | |
| pDAN0250 | GGTGGCTCCAGCTTCCACCCCCCTTATAGAGCTCGTTC | |
-
a CACC (underscored) were added to forward primers for cloning into the pENTR/D-TOPO vector.
-
b a Hind III restriction site (in bold) was added to the forward primer.
-
c (Nusinow et al., 2011).
Download links
A two-part list of links to download the article, or parts of the article, in various formats.
Downloads (link to download the article as PDF)
Open citations (links to open the citations from this article in various online reference manager services)
Cite this article (links to download the citations from this article in formats compatible with various reference manager tools)
PCH1 integrates circadian and light-signaling pathways to control photoperiod-responsive growth in Arabidopsis
eLife 5:e13292.
https://doi.org/10.7554/eLife.13292


