An external sodium ion binding site controls allosteric gating in TRPV1 channels
- National Institutes of Health, United States
Figures
Figure 1 with 4 supplements
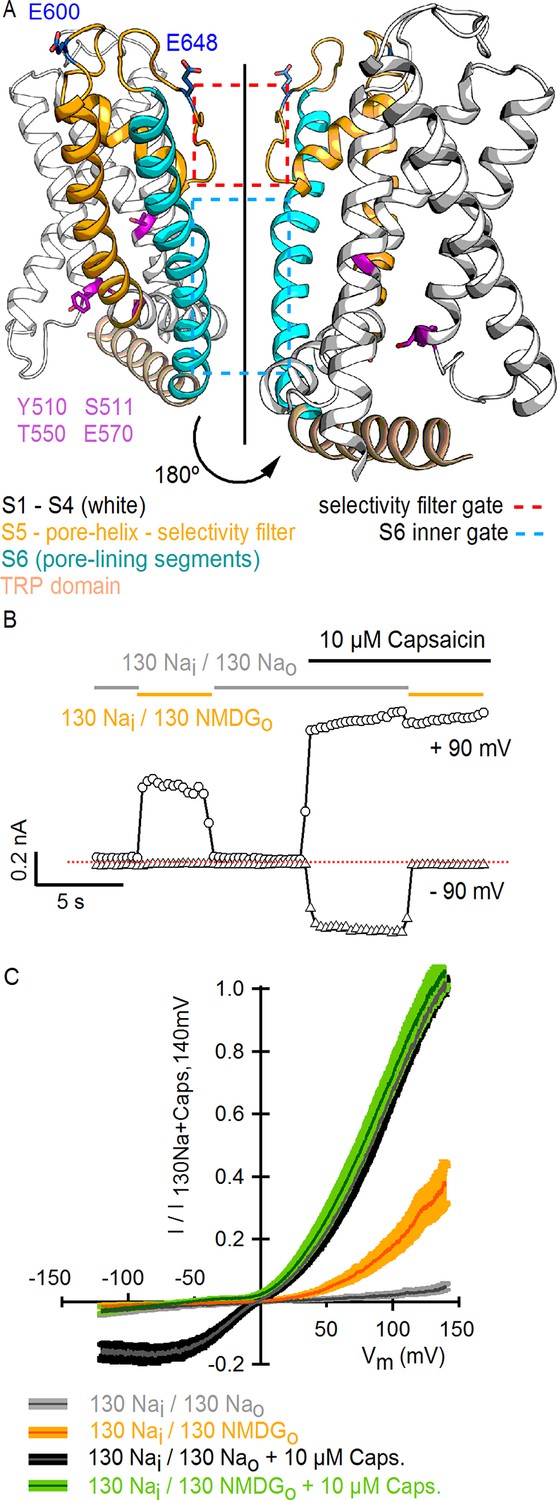
Substitution of extracellular Na+ with NMDG+ increases TRPV1-mediated currents.
(A) Side view in ribbon representation of the transmembrane domains of two opposing TRPV1 subunits (as indicated by the black arrow, extracellular face on the top, intracellular face on the bottom) in the apo state (refined TRPV1 structural model [Bae et al., 2016]). The dashed boxes denote the location of the two constrictions proposed to serve as gates. Side chains of residues forming the binding site for capsaicin (purple) or determining activation of TRPV1 by protons (blue) are shown as sticks. (B) Representative time-course of whole-cell TRPV1-mediated currents elicited by 100-ms voltage pulses from -90 mV (triangles) to +90 mV (circles) at 300 ms intervals and at room temperature. The colored horizontal lines signal the onset of rapid-solution exchange as indicated by the labels. The dotted red line indicates the zero-current level. (C) Normalized TRPV1 current-voltage (I-V) relations obtained from 1s-duration voltage-ramps, following the same solution-exchange sequence as in (B). The darker curves are the mean and lighter-colored envelopes the standard error (n = 8).
Figure 1—figure supplement 1
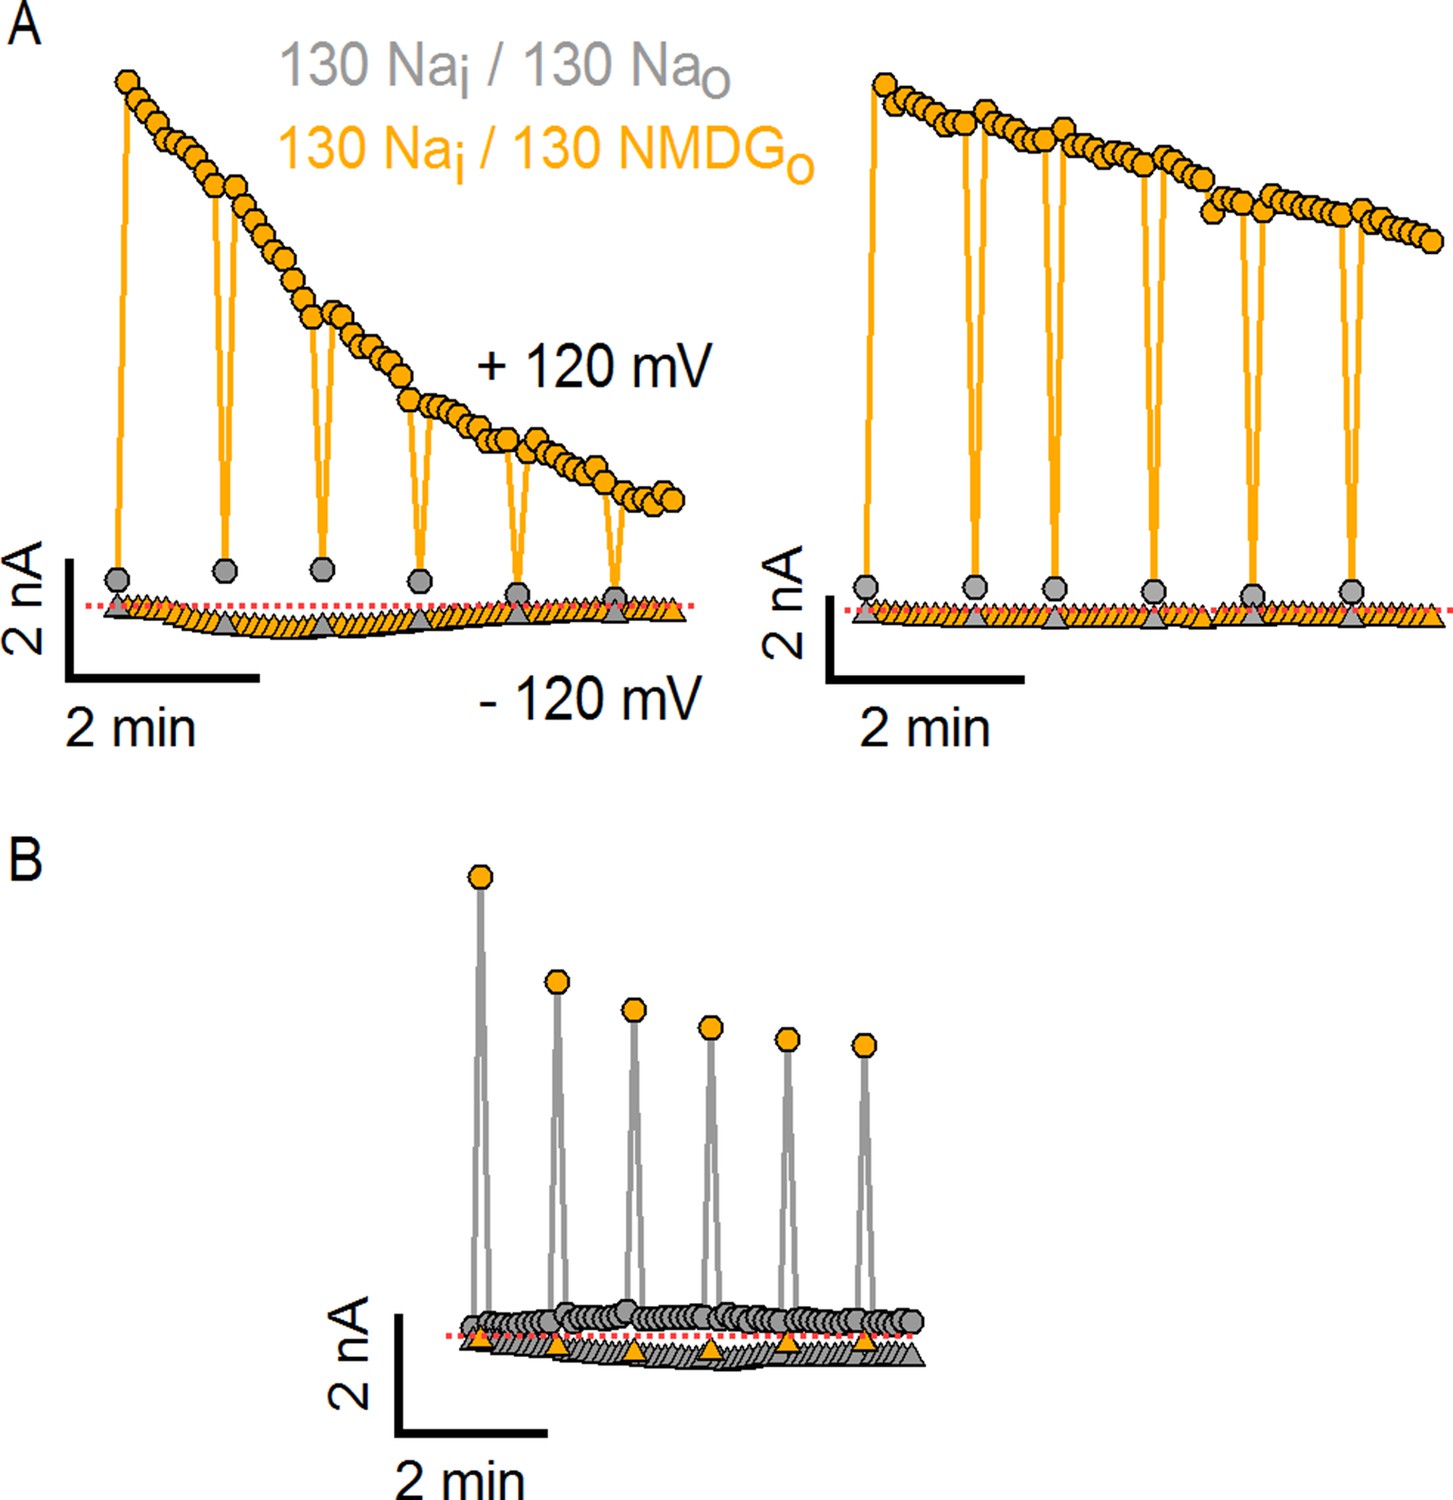
Substitution of external Na+ with NMDG+ induces channel rundown at room temperature with high cell-to-cell variability.
(A) Two representative TRPV1 current time courses obtained from a train of voltage ramps in the whole-cell configuration, constructed by plotting the mean currents at -120 (triangles) and +120 mV (circles) for each ramp within the train as a function of time. Rapid switching between extracellular solutions containing either 130 mM Na+ (Nao, gray) or 130 mM NMDG+ (130 NMDGo, yellow) is indicated by the color of the symbols. The rate of channel rundown in the absence of external Na+ exhibited large cell-to-cell variability, as observed when comparing the experiment on the left (prominent inactivation) to the one on the right (modest and slow inactivation). Rundown could not be prevented by adding ATP and/or diC8-PIP2 to the intracellular solution or by maintaining the intracellular milieu intact in perforated patch recordings (data not shown). The dotted red lines indicate the zero-current level. (B) Rundown could be slowed down if cells were kept for longer periods of time in the presence of 130 mM external Na+.
Figure 1—figure supplement 2
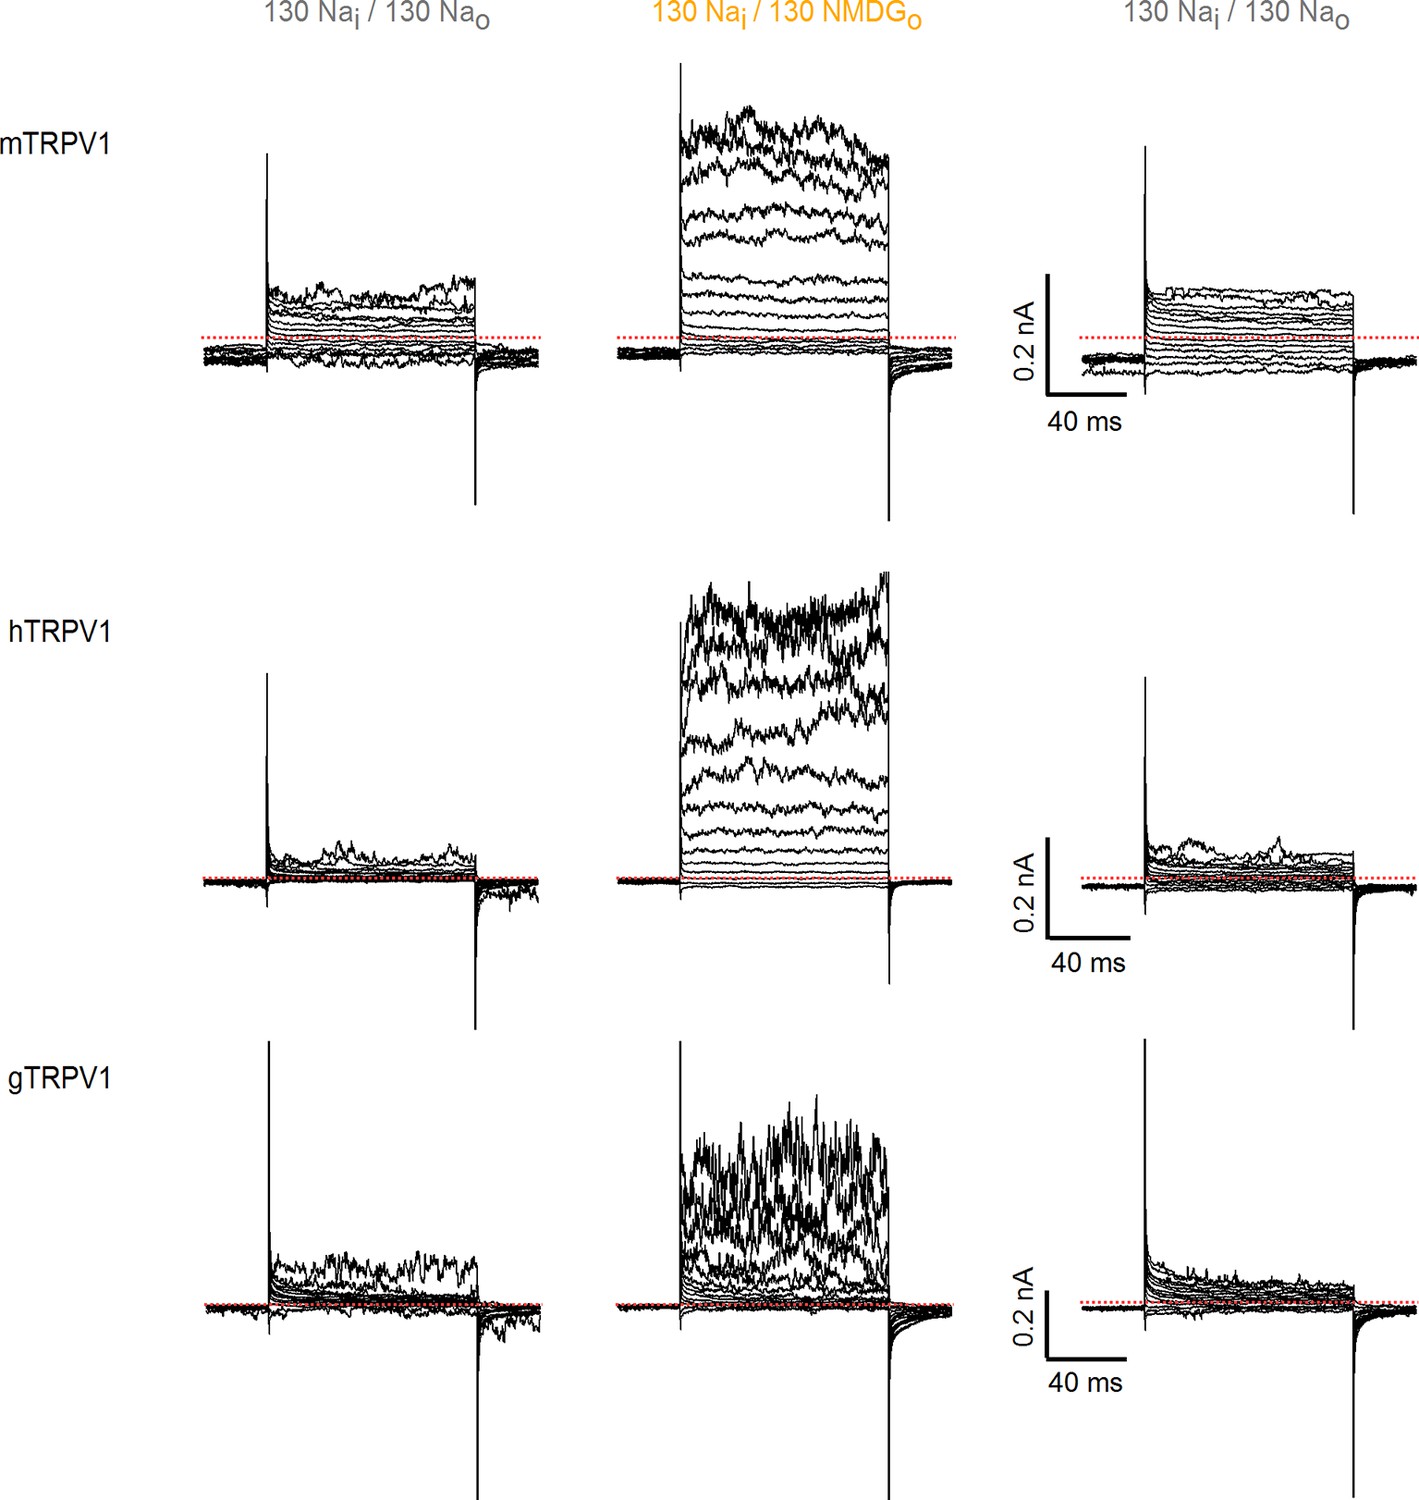
Activation of rat TRPV1 channel orthologues by substituting external Na+ with NMDG+.
Representative current families recorded from outside-out patches containing TRPV1 channels from different species (mouse, human and chicken) at room temperature. Currents were elicited by voltage steps of 100 ms duration going from -120 to +140 mV in 10-mV increments, and different solutions were applied using the fast solution-exchange system. The red-dotted lines denote the zero-current level.
Figure 1—figure supplement 3
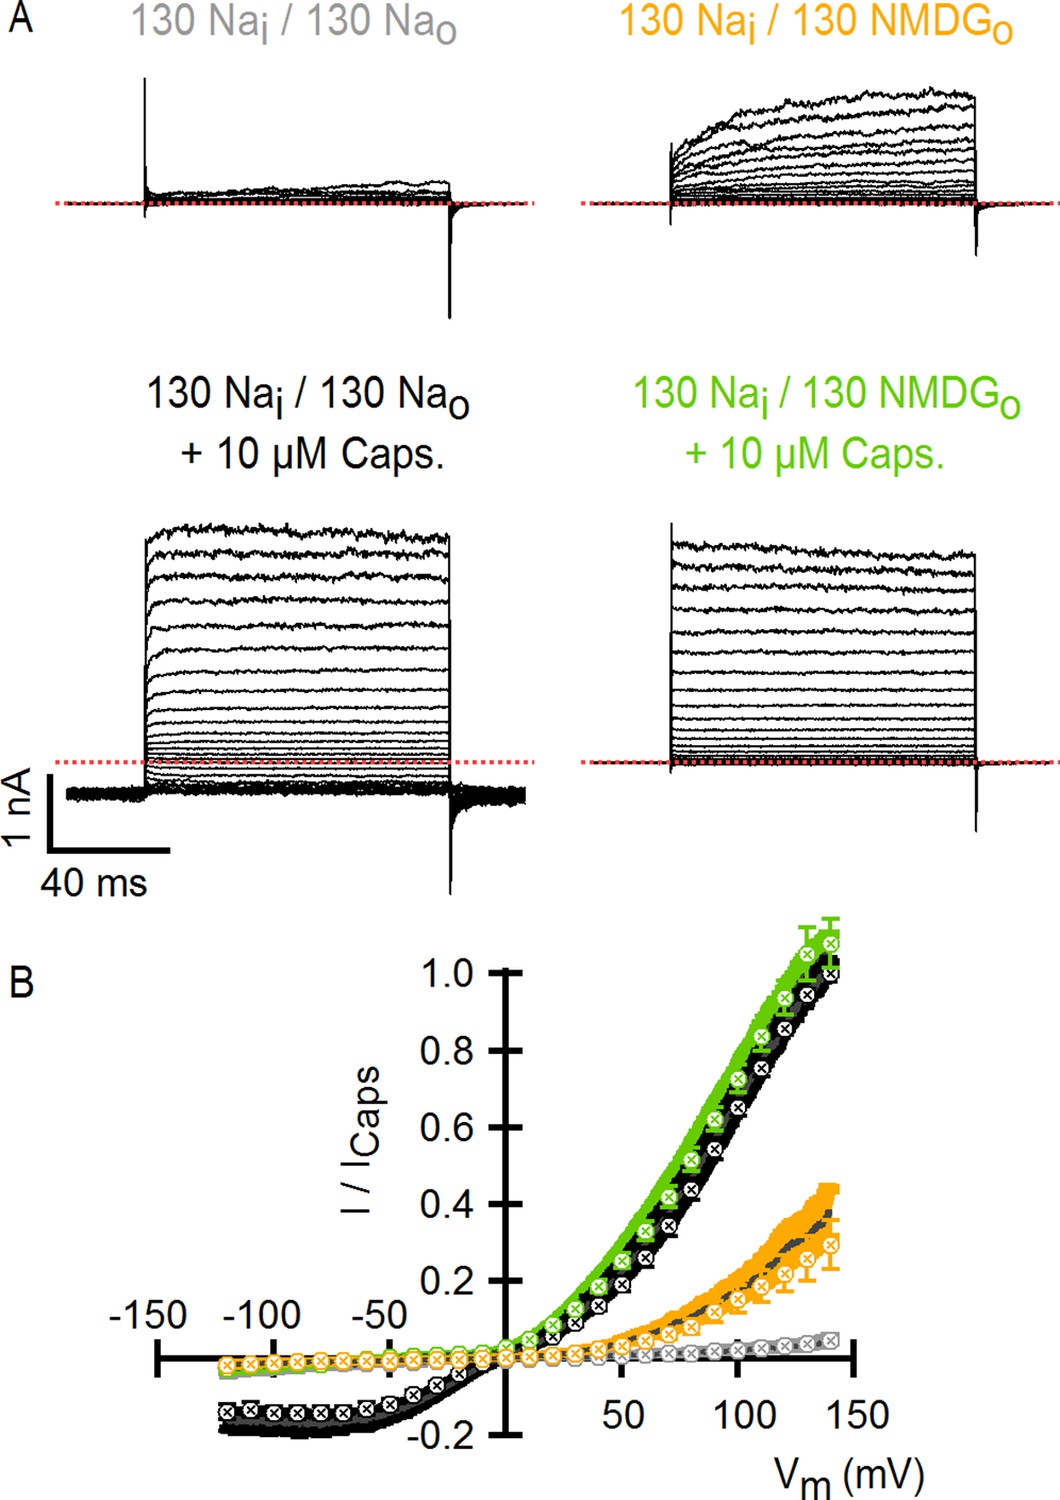
Comparison of TRPV1 channel I-V relations measured using voltage steps and voltage ramps.
(A) Representative whole-cell TRPV1 current families obtained at room temperature in response to 100-ms voltage pulses from -120 to +140 mV in 10-mV increments and recorded in the absence and presence of external Na+ or NMDG+, with and without saturating capsaicin. The dotted red lines indicate the zero-current level. (B) Superposition of the normalized I-V relations obtained from voltage ramps (continuous curves, Figure 1C) or from families of voltage pulses (crossed circles) as in (A). For the ramps, the dark gray curves are the mean and the colored envelopes the standard error (n = 8). For the pulses, data are shown as mean ± SEM (n = 7). For both ramps and pulses, normalization was done as indicated on the y-axis label.
Figure 1—figure supplement 4
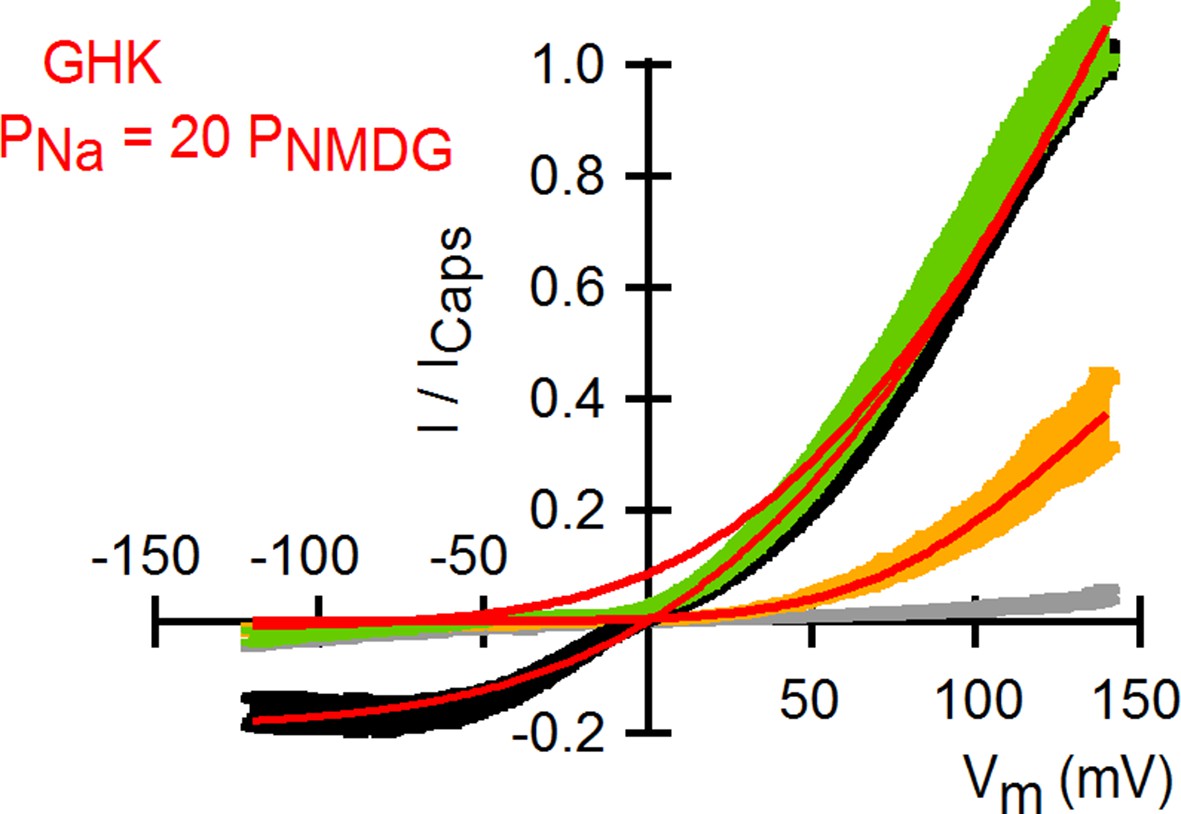
Theoretical I-V relations in the presence and absence of external Na+ obtained with the Goldman-Hodgkin-Katz current equation.
Superposition of the I-V relations obtained from voltage ramps (Figure 1C) and theoretical I-V curves calculated using the Goldman-Hodgkin-Katz current equation (red curves) with a permeability of TRPV1 for Na+ ions that is 20-fold larger than that for NMDG+. Theoretical I-V relations were calculated with the following equation: where I(V) is the current as a function of voltage (V), N is the number of channels, Po,minis the minimal open probability at V << 0, Po,max is the maximal open probability at V >> 0, z is the gating charge of the channel, V1/2 is the voltage of half-maximal channel activation, F is Faraday’s constant, R is the gas constant, T is the temperature, PX1 is the permeability of the intracellular cation (i.e. Na+), zX1 and zX2 are the charges of the intracellular and extracellular cations, respectively, [X1]iand [X2]o are the molar concentrations of the intracellular (Na+) and extracellular (Na+ or NMDG+) cations, respectively, and f is the permeability ratio for cations 1 and 2 (PX2/PX1). At saturating capsaicin, the parameters used were: Po,min = 0.05; Po,max = 0.9; z = 0.31 e0; V1/2 = 71 mV and f = 1 for 130 Nao or 0.05 for 130 NMDGo. For 130 NMDGo the parameters were: Po,min = 0; Po,max = 0.30; z = 0.72 e0; V1/2 = 99 mV and f = 0.05. A permeability for Na+ of 2.04721 x 10⁻¹⁹ m/s was used.
Figure 2 with 1 supplement

Extracellular sodium ions are allosteric inhibitors of the TRPV1 channel.
(A, left) Representative recordings at +90 mV performed on outside-out patches containing a few TRPV1 channels in the presence of 130 mM external Na+ (top) or NMDG+ (bottom) at room temperature. The continuous horizontal line represents the zero-current level (C, all channels closed) and the dotted red lines indicate current value levels corresponding to one (O1), two (O2) or three (O3) simultaneously open channels. (A, right) All-points current amplitude histograms constructed from the recordings on the left. The red curves are fits to a sum of Gaussian functions. (B) Normalized I-V relations constructed from voltage-ramps measured in the whole-cell configuration with 260 mM internal Na+ (Nai) and the extracellular solutions indicated in the figure. The dark curves are the mean and the lighter-colored envelopes the standard error (n = 4). (C) I-V relations obtained from families of 100 ms voltage-pulses in either the inside-out (left) or outside-out (right) configuration (mean ± SEM, n = 4–5). (D) Sodium dose-response relations (mean ± SEM, n = 7) obtained from voltage-ramps in the whole-cell configuration using solutions with different Na+/NMDG+ ratios, all adding up to a total cation concentration of 130 mM. The continuous curves are fits to the Hill equation with a Hill coefficient of 1.2 ± 0.1. (E) K1/2-V relation from fits as in (D). The red curve is a fit to K1/2(V) = K1/2(0) x exp(-zδV/kBT).
Figure 2—figure supplement 1
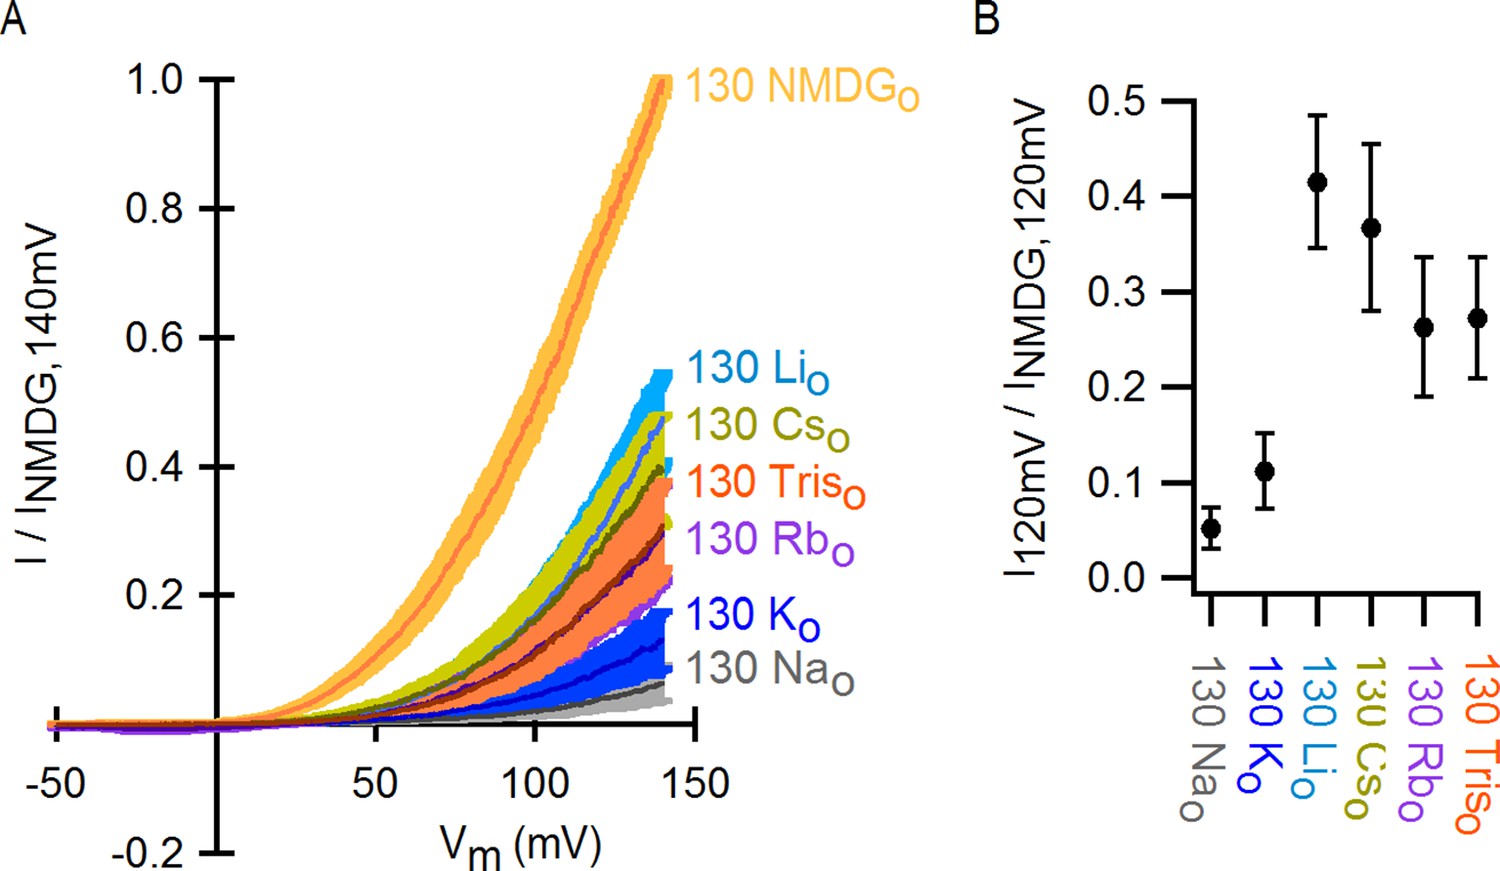
Monovalent cation selectivity of the external Na+-binding site in TRPV1.
(A) Voltage-ramps (darker thin curves are the mean, lighter-colored envelopes the SEM, n = 5) obtained in the whole-cell configuration in the presence of different extracellular cations (and 130 mM internal Na+), and normalized to the current measured at +140 mV in the presence of 130 mM external NMDG+. (B) Fractional current at +120 mV (mean ± SEM, n = 5) measured from ramps as shown on the left in the presence of each extracellular monovalent cation tested, relative to the current measured in the presence of external NMDG+ at +120 mV.
Figure 3 with 1 supplement
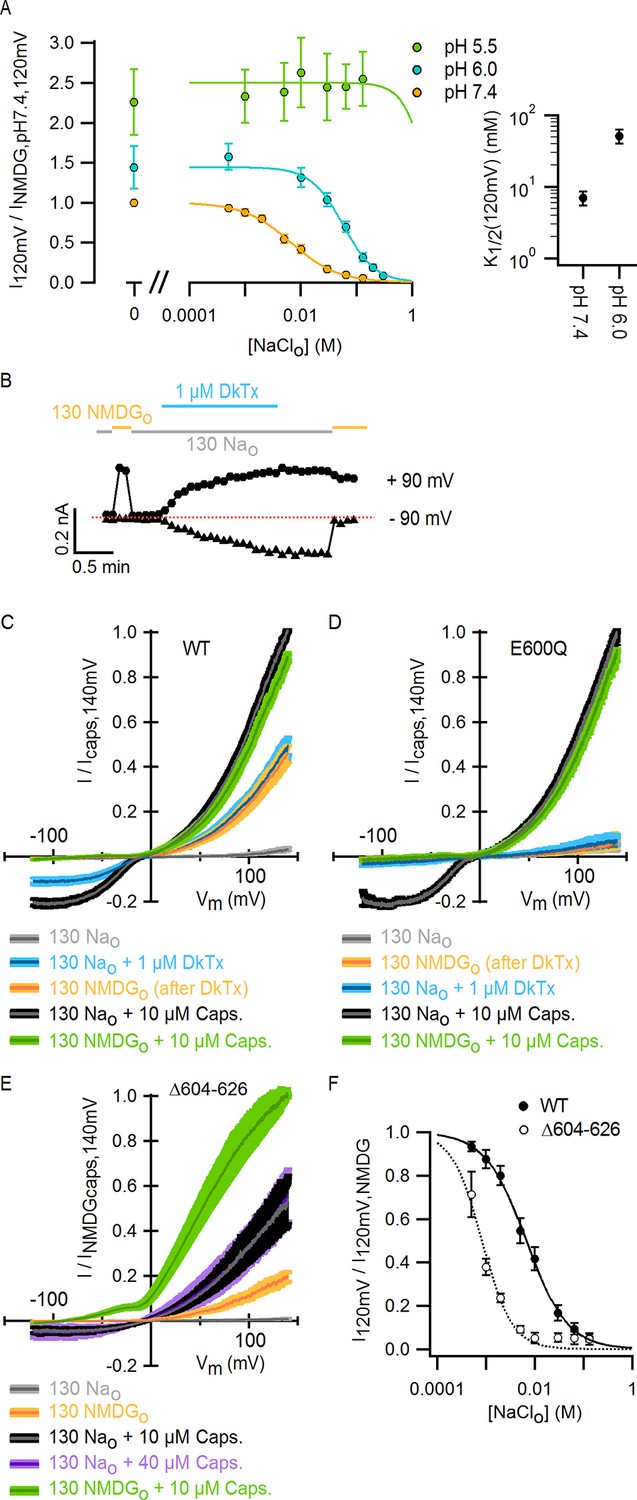
External Na+, H+ and DkTx modulate the TRPV1 channel through overlapping mechanisms involving E600 in the extracellular pore.
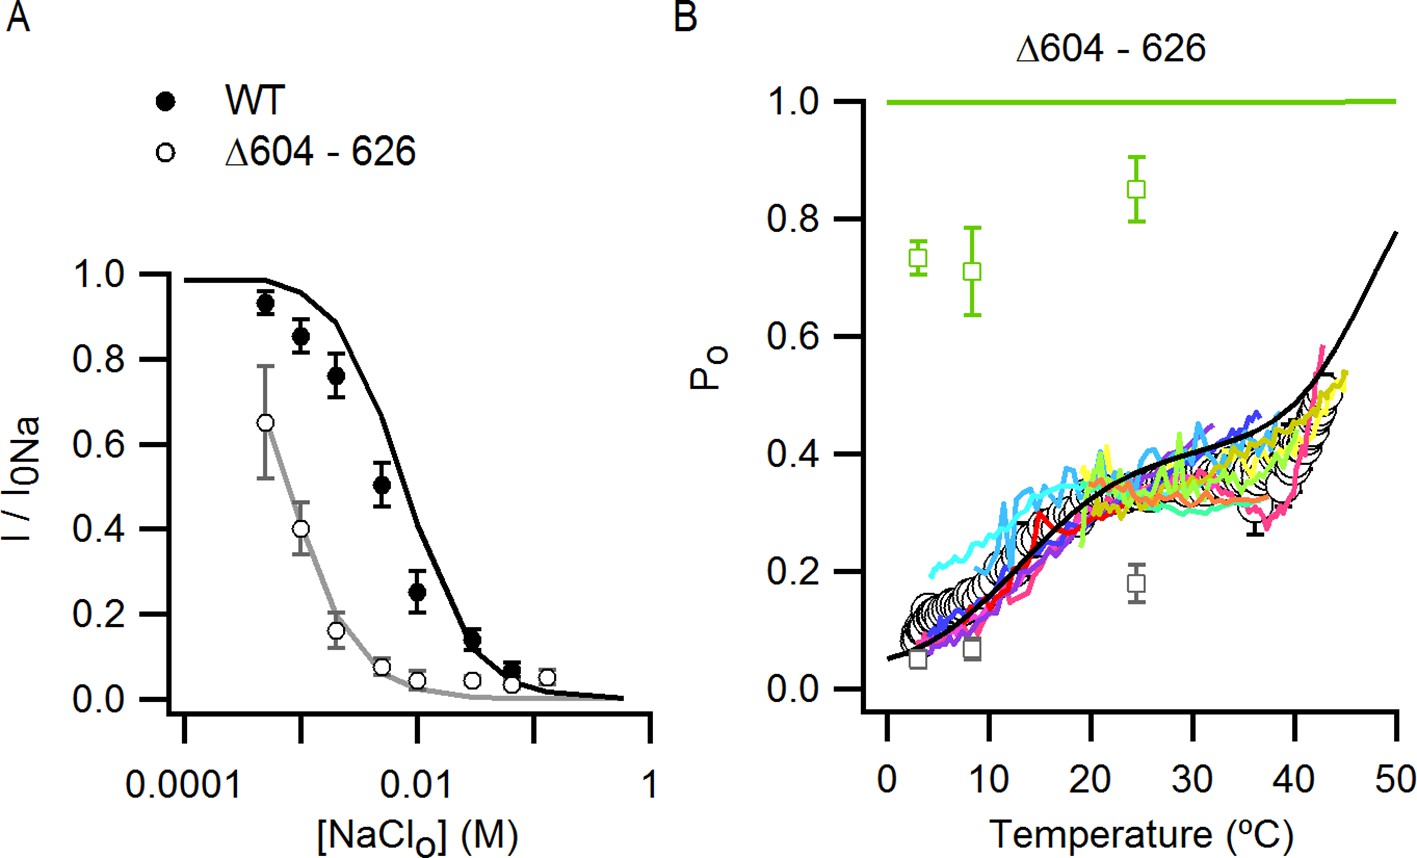
(A) Extracellular Na+ dose-response relations measured at different extracellular pH values at +120 mV in the whole-cell configuration in response to voltage ramps (mean ± SEM, n = 3–7). Experiments at different pH values were recorded from independent cells at room temperature. The data on the left of the axis break reflect activation of TRPV1 channels by protons in the absence of external Na+. The continuous curves are fits to the Hill equation. The obtained parameters were: s = 1.2 ± 0.08 and K1/2 = 7 ± 0.15 mM at pH 7.4 (n = 7); s = 1.5 ± 0.08 and K1/2 = 51.2 ± 11.5 mM at pH 6.0 (n = 3). The Hill equation was not fit to the data at pH 5.5 (n = 5), but the Hill function shown (green curve) has s = 2.0 and K1/2 = 2.0 M. Mean K1/2 values from the fits to data at pH 7.4 and 6.0 are shown on the right panel insert. For all cells, data were normalized to the currents measured in the absence of external Na+ at pH 7.4 (130 mM NMDG+ for pH 7.4 and 5.5; 300 mM NMDG+ for pH 6.0). (B) Representative whole-cell WT TRPV1 current time-course at -90 and +90 mV constructed from a train of voltage-ramps at room temperature. Horizontal thick lines denote the removal of external Na+ (yellow) or the application of DkTx (blue). The dotted line denotes the zero-current level. (C) Mean normalized I-V relations (mean – thin darker curves – ± SEM – lighter-colored envelopes, n = 4) from WT TRPV1 channels obtained from whole-cell recordings at room temperature in response to voltage ramps with 130 mM intracellular Na+ and the extracellular solutions indicated by the labels at the bottom. The order of the labels reflects the order in which the different solutions were tested in each experiment. (D) Mean normalized I-V relations (mean ± SEM, n = 4) from TRPV1 channels with the E600Q mutation, obtained as in (C). In these experiments, the 0 Nao-solution was tested before application of DkTx. (E) Normalized I-V relations for TRPV1 Δ604–626 obtained in the whole-cell configuration at room temperature (continuous curves are the mean, lighter envelopes the SEM, n = 6) in response to voltage ramps. (F) External Na+ dose-response relations for TRPV1 Δ604–626 (open circles, mean ± SEM, n = 4) measured at +120 mV from voltage-ramps in the whole-cell configuration. The dotted curve is a fit to the Hill equation with parameters: s = 2.2 ± 0.7, K1/2 = 0.7 ± 0.1 mM. Closed circles are data for WT TRPV1 at +120 mV (Figure 2D and 3A - pH 7.4). The continuous curve is a fit to the Hill equation with parameters indicated in (A).
Figure 3—figure supplement 1
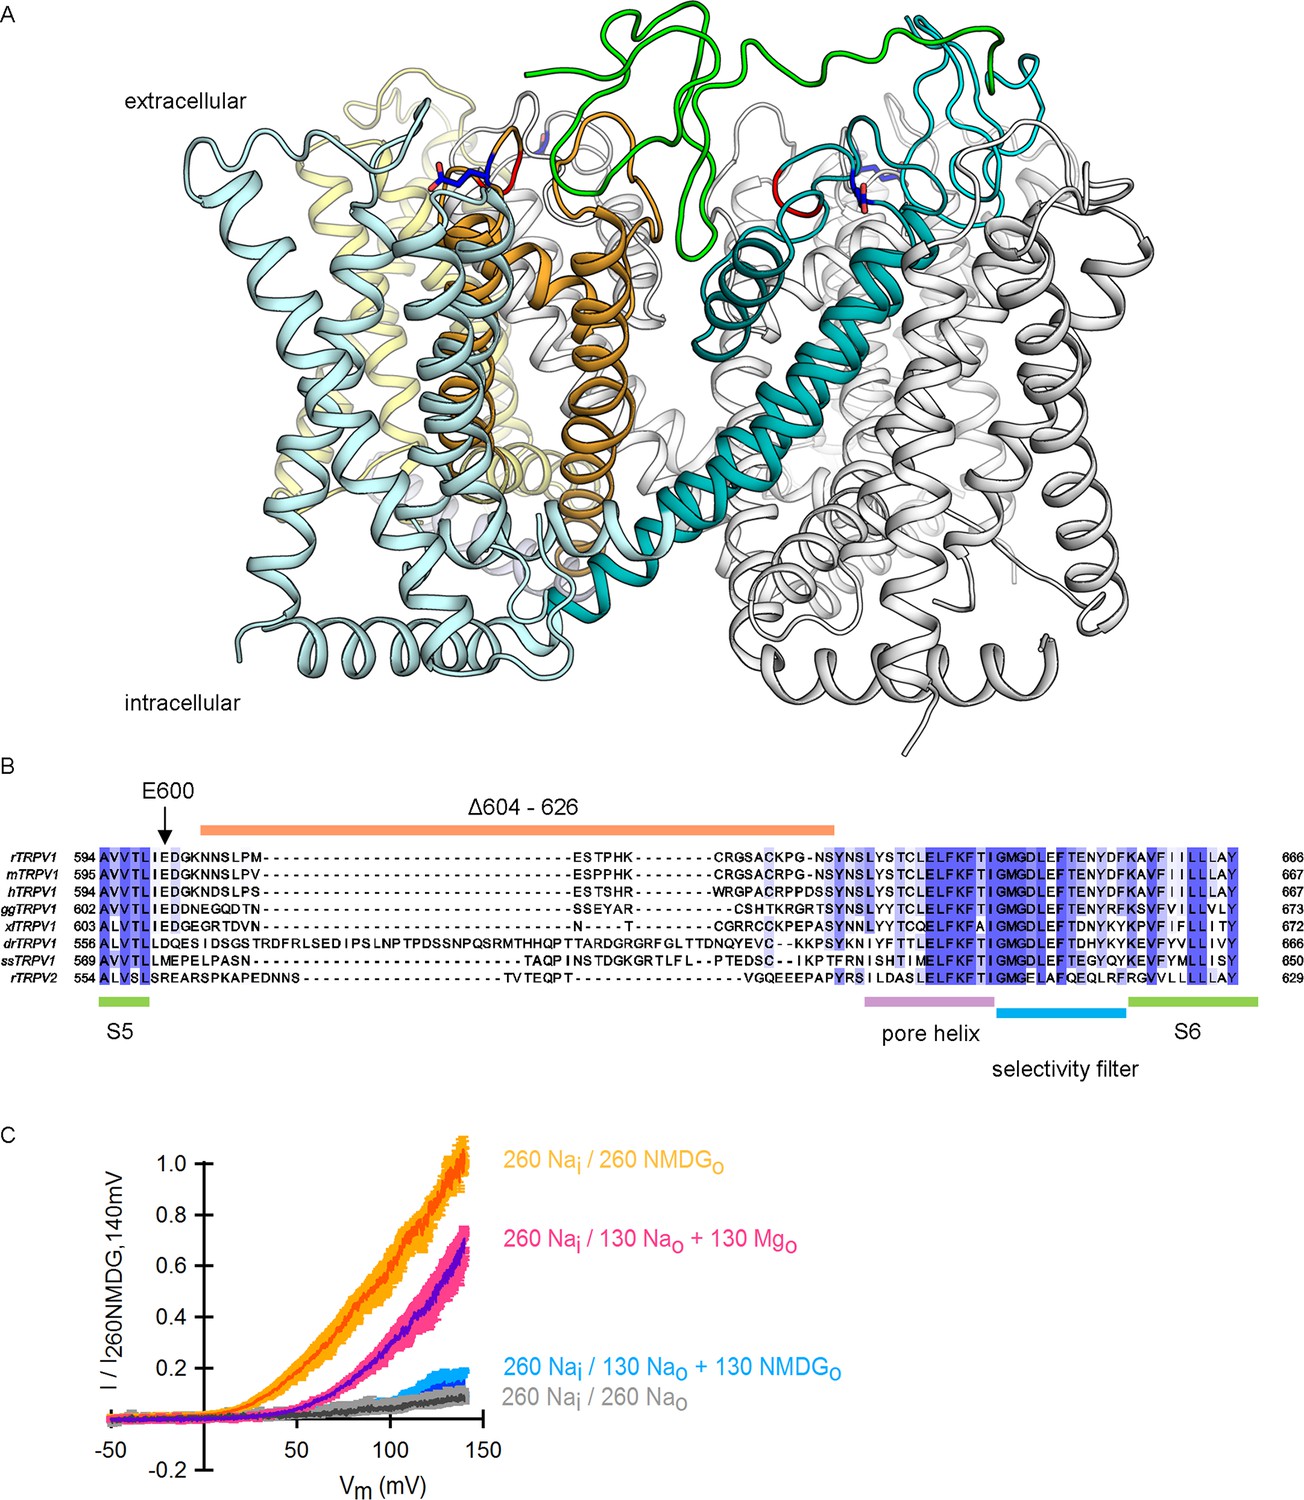
The location of E600, the extracellular pore turret and the binding site for DkTx within the outer pore of TRPV1, and the role of external Mg2+ ions in TRPV1 modulation.
(A) Side view of a ribbon representation of the transmembrane domain of the TRPV1 channel bound to DkTx/RTx (refined structural model for TRPV1 with the docked solution structure of DkTx) (Bae et al., 2016). The pore domains of two adjacent subunits in contact with the K1 lobe of DkTx (shown in green) are colored in teal and yellow, and their respective S1-S4 domains are colored in lighter blue and yellow, respectively. All other subunits (including that in contact with the K2 lobe of DkTx, shown in cyan) are colored in white. The DkTx molecule bound to the two subunits in the back was omitted for clarity. Residue E600 is shown in stick representation and colored in dark blue. The red coloring near E600 indicates the position from which the extracellular pore turret was deleted in the construct used for structure determination. (B) Amino acid sequence alignment corresponding to the pore region of several TRPV1 channel orthologues together with rat TRPV2, highlighting the location and sequence conservation of the extracellular pore turret denoted by the thick orange line. The green thick lines delimit the location of the S5 and S6 transmembrane regions as based on the structure of the rat TRPV1 channel (Cao et al., 2013; Liao et al., 2013). The purple line denotes the pore helix and the blue line the location of the selectivity filter. The intensity of the blue text background denotes sequence conservation between the aligned proteins, with darker coloring representing higher conservation. The vertical arrow denotes the position of E600 within the sequence. (C) Normalized I-V relations constructed from voltage-ramps measured in the whole-cell configuration with 260 mM internal Na+ (Nai) and the extracellular solutions indicated in the figure. The dark curves are the mean and the lighter-colored envelopes are the standard error (n = 4). The data without magnesium are the same as in Figure 2B, as activation by NMDG+ and Mg2+ was tested in the same experiment.
Figure 4 with 2 supplements
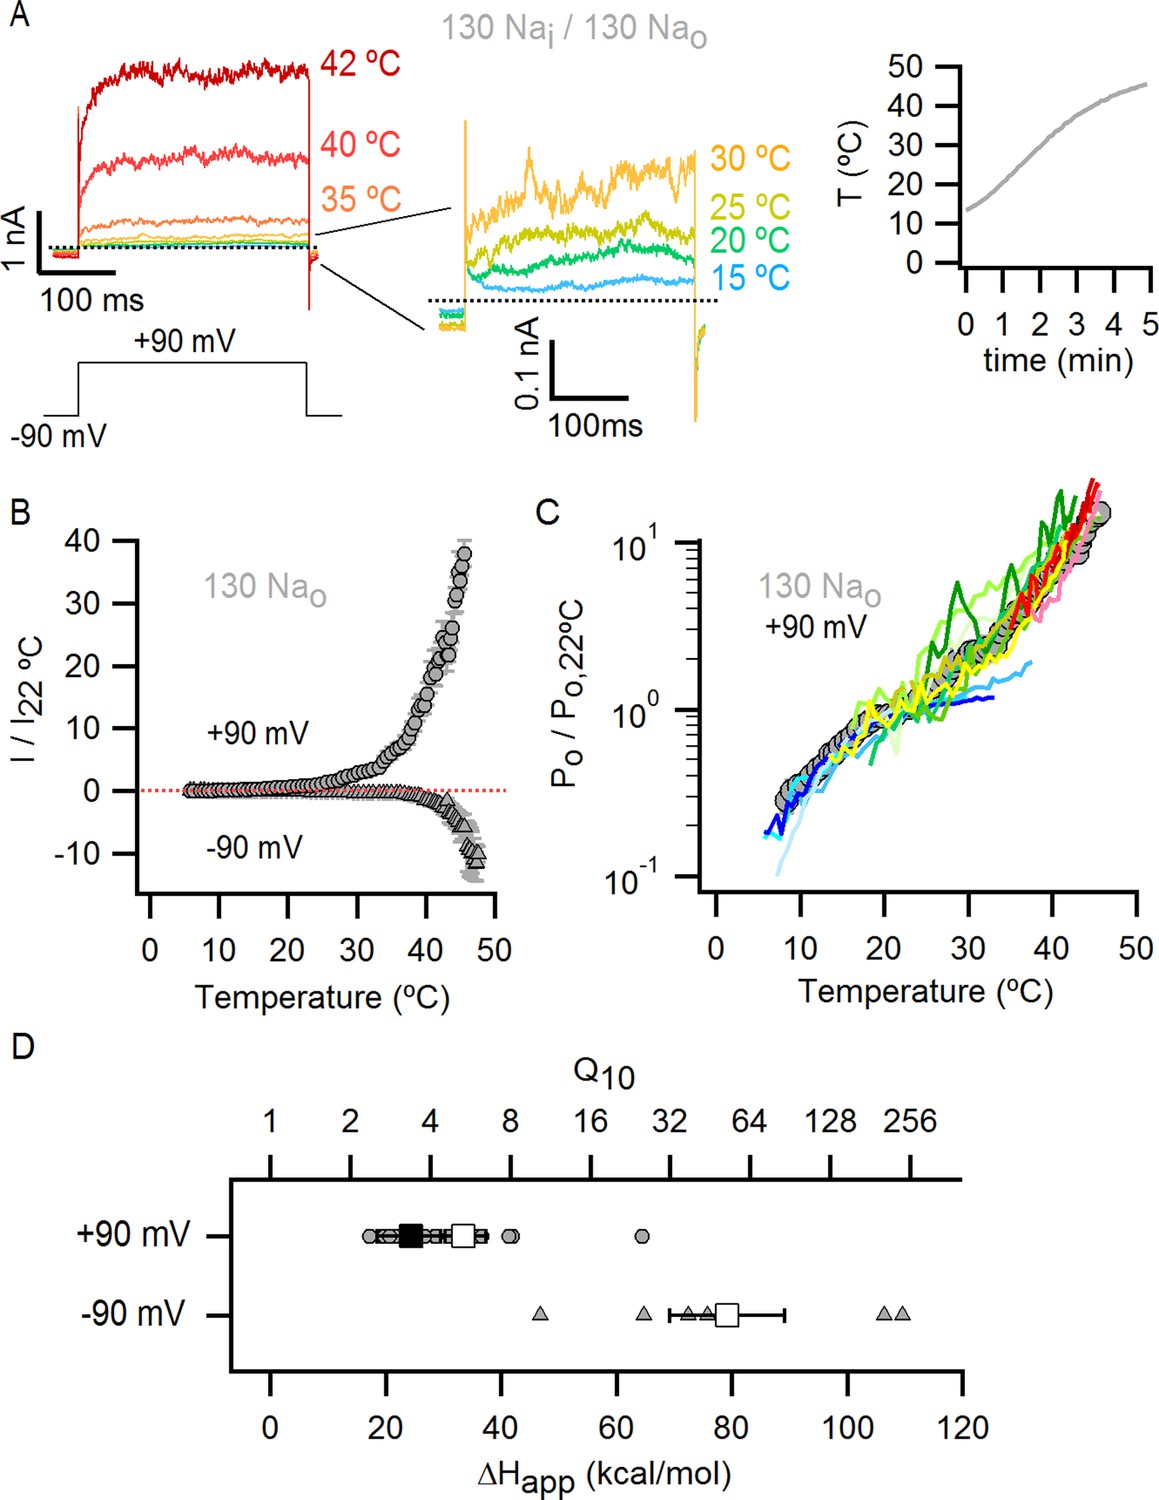
Temperature-dependent gating of TRPV1 in the presence of external Na+.
(A) Representative whole-cell current family in the presence of external Na+ elicited by a train of pulses from -90 to +90 mV while increasing temperature (temperature vs time plot is shown on the right panel) using the temperature-controlled recording chamber (Figure 4—figure supplement 1A). The traces obtained at 15–30°C are shown at higher magnification in the middle panel. Dotted lines denote the zero-current level. (B) Mean current-temperature (I-T) relations obtained from experiments as in (A) by plotting the steady-state mean current values at -90 (triangles) and +90 mV (circles) for each voltage-pulse within a train as a function of temperature (mean ± SEM, n = 14, I-T relations for individual cells are shown in Figure 4—figure supplement 2A and B). The dotted line denotes the zero-current level. (C) Normalized Po-T relations (mean ± SEM, grey circles; individual cells are shown as colored curves, n = 14) obtained from I-T relations as in (B) at +90 mV as described in Methods and illustrated in Figure 4—figure supplement 1. (D) ΔHapp from fits of Equation 1 to Po-T relations (see Figure 4—figure supplement 2 for individual cells (circles) and their mean ± SEM (squares)). The mean ΔHapp for the fits to data with external Na+ at T > 25°C (Po-T relations in (C) colored in green, yellow, orange and red) is shown as an open square (mean ± SEM, n = 10). The mean ΔHapp from fits to data in external Na+ at T < 25°C (Po-T relations in (C) colored in blue) is shown as a closed square (mean ± SEM, n = 4). ΔHapp values for data at -90 mV were obtained from fits of Equation 1 to I-T relations (Figure 4—figure supplement 2B), followed by subtracting the enthalpy associated with ion conduction (9 kcal/mol).
Figure 4—figure supplement 1
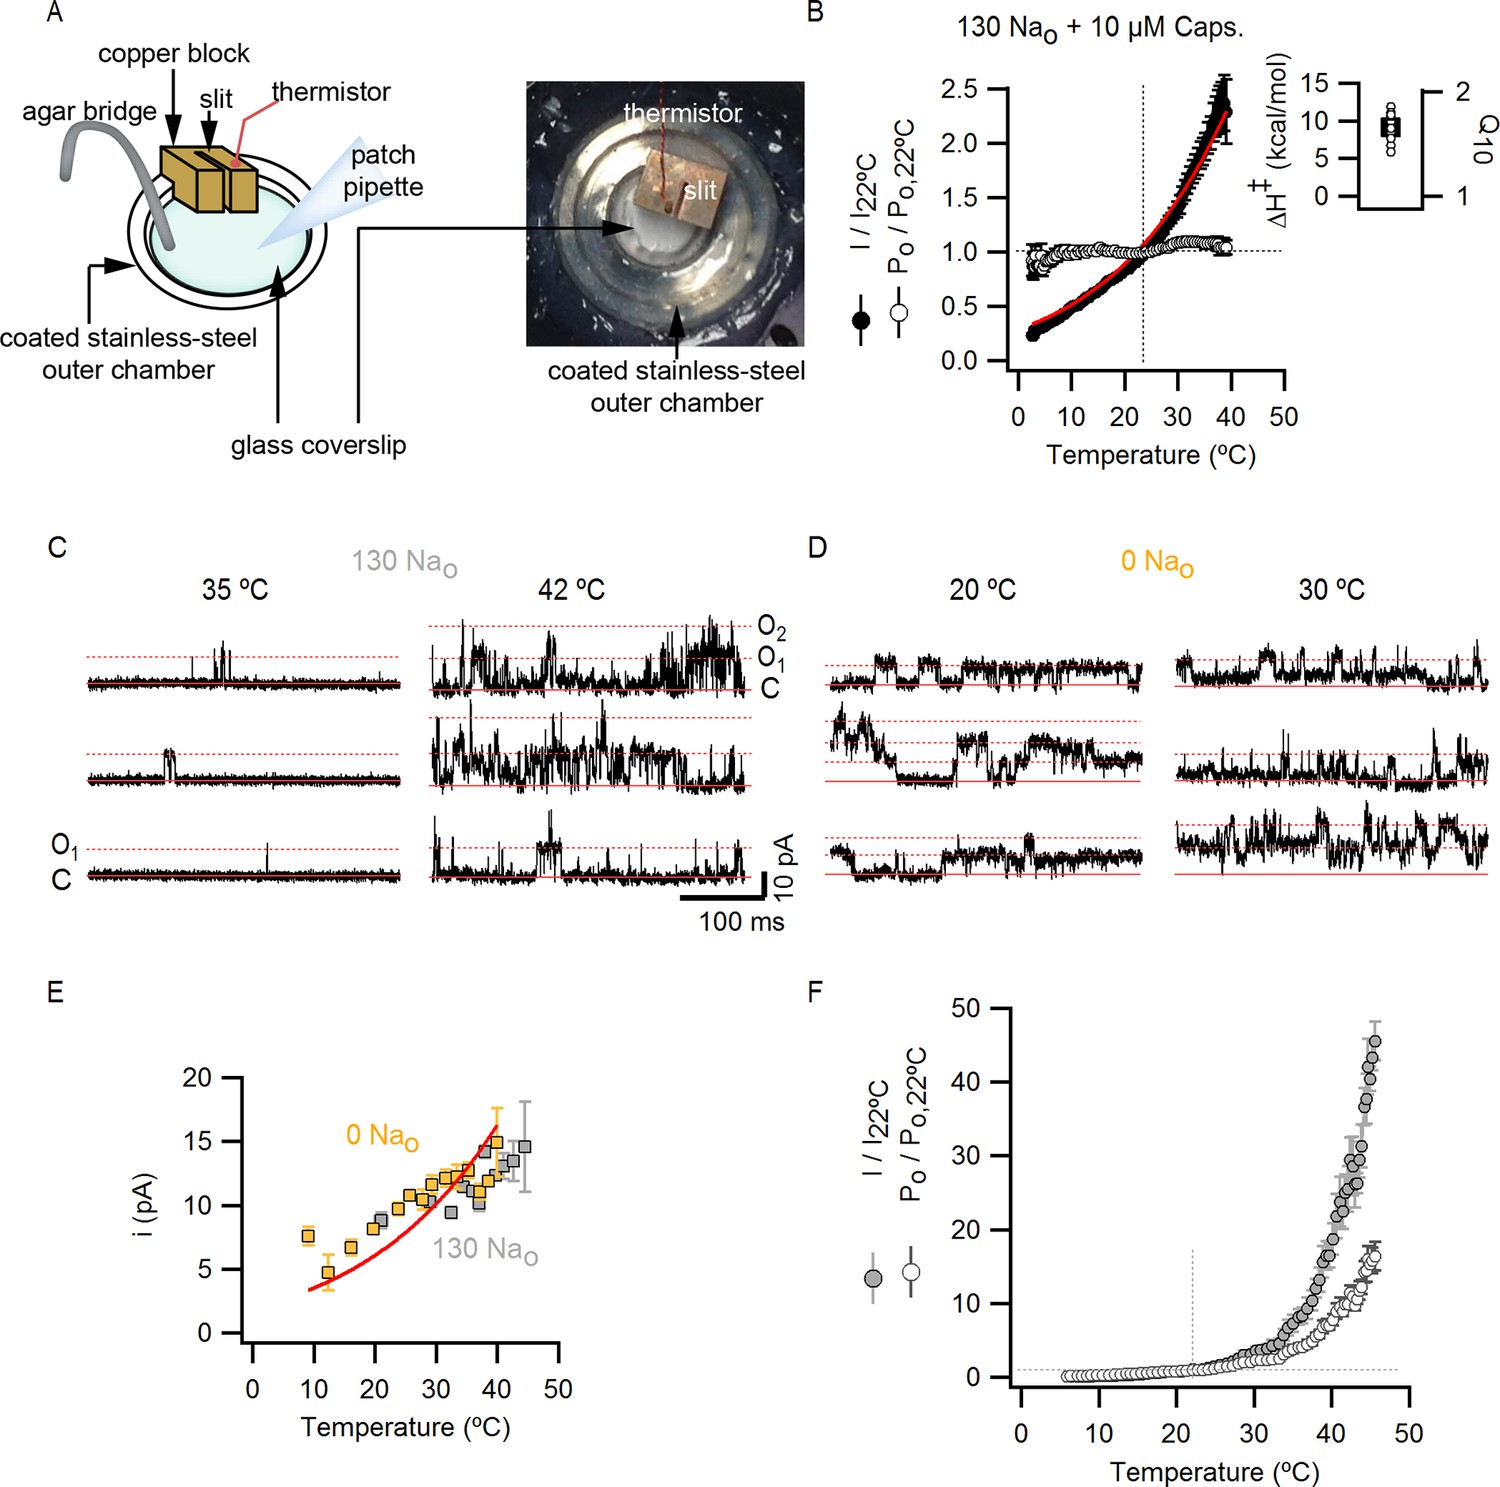
Estimation of the temperature-dependence of ion conduction through an open channel for obtaining Po-T relations.
(A) Scheme of the custom-modified temperature-controlled microincubator stage (HCMIS and PTC-10 controller, Ala Scientific, Farmingdale, NY) used to obtain I-T relations. A round glass coverslip was attached to the bottom of the stage and an additional stainless steel 25 mm chamber (MS-502S, Ala Scientific) was added to the stage to reduce the volume of recording solution (500 µL). Thermal grease was applied between the stainless-steel chamber (outer chamber) and the incubator stage. The metal surface of the outer chamber was covered with a thin layer of silicon or teflon spray for electrical insulation. Finally, a copper block of ~1 cm3 with an embedded thermistor probe and an axial slit (0.7 mm diameter) in one face was positioned to make contact with the outer chamber. Once the whole-cell configuration was obtained, the cells were lifted and the pipette tip introduced into the slit in the copper block, which served as a 'buffer' to ensure that the temperature at the pipette tip closely matched that of the embedded thermistor. The addition of the copper block significantly increased the accuracy of temperature measurements, as judged from experiments in which the resistances of open pipettes were recorded during temperature ramps (data not shown). A fan-based heat sink (Koolance, Warner Instruments, Hamden, CT) for the Peltier elements in the temperature controlled-stage was used during heating when performing temperature-ramps, whereas a refrigerated water circulator (NESLAB RTE7, Thermo Scientific, Waltham, NA) at 6.3°C was used for cooling. (B) Normalized I-T (filled circles) and Po-T relations (empty symbols, mean ± SEM, n = 11) at +90 mV constructed from whole-cell TRPV1 current recordings in the presence of 130 mM external Na+ and saturating capsaicin (10 µM). I-T (and Po-T) relations from individual cells were normalized relative to the current at 22°C before averaging (as denoted by the vertical and horizontal dotted lines and the y-axis labels). The red curve is a fit to the mean I-T relation using Equation 1 (see Materials and methods) with an enthalpy (ΔH≠) of 9 kcal/mol, which reflects the temperature-dependence of ion conduction through an open channel. Po-T relations were obtained from the quotient between individual I-T relations and Equation 1 with an enthalpy of 9 kcal/mol (see Materials and methods for further details). The enthalpies resulting from fits of Equation 1 to I-T relations from individual cells (open circles) are plotted together with their mean ± SEM (black square, 9.0 ± 0.5 kcal/mol) on the insert to the right. (C and D) Representative recordings at two temperatures obtained from two outside-out patches containing a few channels, one in the presence of 130 mM external Na+ (C) and other in the absence of external Na+ (D). Currents were elicited by trains of 500 ms pulses from -90 to +90 mV during a temperature ramp using the temperature-controlled chamber described in (A). The continuous horizontal red line represents the zero-current level (all channels closed) and the dotted lines denote the current levels for one (O1), two (O2) or three simultaneously open channels. (E) Single channel current amplitudes obtained from recordings as in (C) and (D) at several temperatures with 130 Nao (grey squares, n = 3) or 0 Nao (yellow squares, n = 7). The red curves are fits of Equation 1 to the data with ΔH≠ = 9.0 kcal/mol. Estimates of i from different patches at similar temperatures were averaged and are plotted as mean ± SEM. The standard errors for temperature (i.e. x-axis SEM) are also included but are negligible. (F) Normalized (mean ± SEM, n = 14) I-T (closed circles) and Po-T (open circles) relations obtained in the presence of 130 mM extracellular Na+. The dotted lines denote that both relations were normalized to their corresponding values at 22°C. Po-T relations were calculated as the quotient of individual I-T relations and Equation 1 with ΔH≠ = 9 kcal/mol.
Figure 4—figure supplement 2
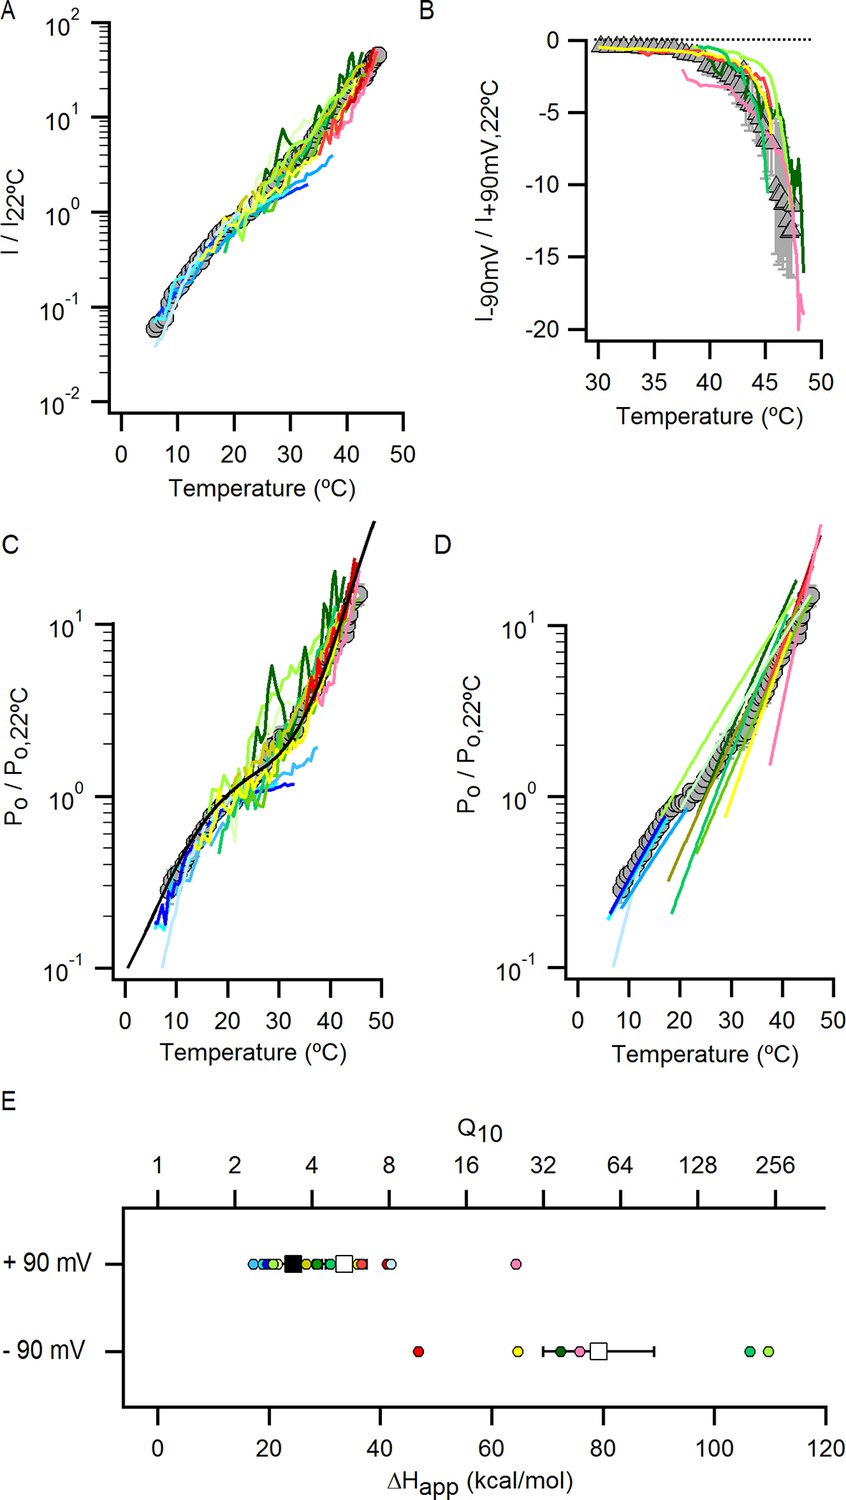
Individual Po-T relations in the presence of external Na+ measured over a wide range of temperatures uncover the presence of multiple temperature-dependent components in the gating mechanism of the TRPV1 channel.
(A) Normalized I-T relation (mean ± SEM, grey circles) obtained from data in the presence of 130 mM external Na+ (Figure 4B) at +90 mV with superimposed I-T relations from individual cells (colored continuous curves, n = 14). (B) The inward currents at -90 mV measured in the same experiments as the data at +90 mV shown in (A) were used to construct I-T relations at -90 mV. Each individual I-T relation at -90 mV was normalized to the current at 22°C from the I-T relation at +90 mV obtained from the same cell. Of the 14 cells included in (A), only those that exhibited a substantial mono-exponential increase in the inward currents (at -90 mV) at higher temperatures were analyzed and are included in the figure. Those cells that were not included had inward currents that were still too small as compared to the leak in the measured range of temperatures. The resulting normalized mean I-T relation (mean ± SEM, n = 5) is shown as grey triangles. The individual I-T relations are shown as colored continuous curves with data from each cell colored the same as in (A). The dotted line denotes the zero-current level. (C) Mean Po-T relation (grey circles) obtained from the data in (A) with superimposed Po-T relations from individual cells (colored continuous curves, same coloring for each cell as in (A)). The continuous black curve is the prediction from model i (Figure 7A) calculated with the parameters in Figure 7—source data 2A. (D) Mean Po-T relation shown in (C) with superimposed fits of Equation 1 (see Materials and methods) to each individual Po-T relation, with each fit extending over the temperature-range in which it was constrained during the fitting procedure. The color of the fits matches the color of their corresponding Po-T curves in (C). (E) Individual apparent enthalpy values for data at +90 mV corresponding to the fits in (D) as indicated by matching colors. The mean enthalpy for the fits at higher temperatures (mean ± SEM, n = 10, fits colored in green, yellow and red) is shown as an open square. The mean enthalpy from fits at low temperatures (mean ± SEM, n = 4, fits colored in blue) is shown as a closed square. The apparent enthalpy values for data at -90 mV were obtained from fits of Equation 1 to the I-T relations in (B), followed by subtracting the enthalpy associated with ion conduction (9 kcal/mol, Figure 4—figure supplement 1B–E).
Figure 5 with 3 supplements
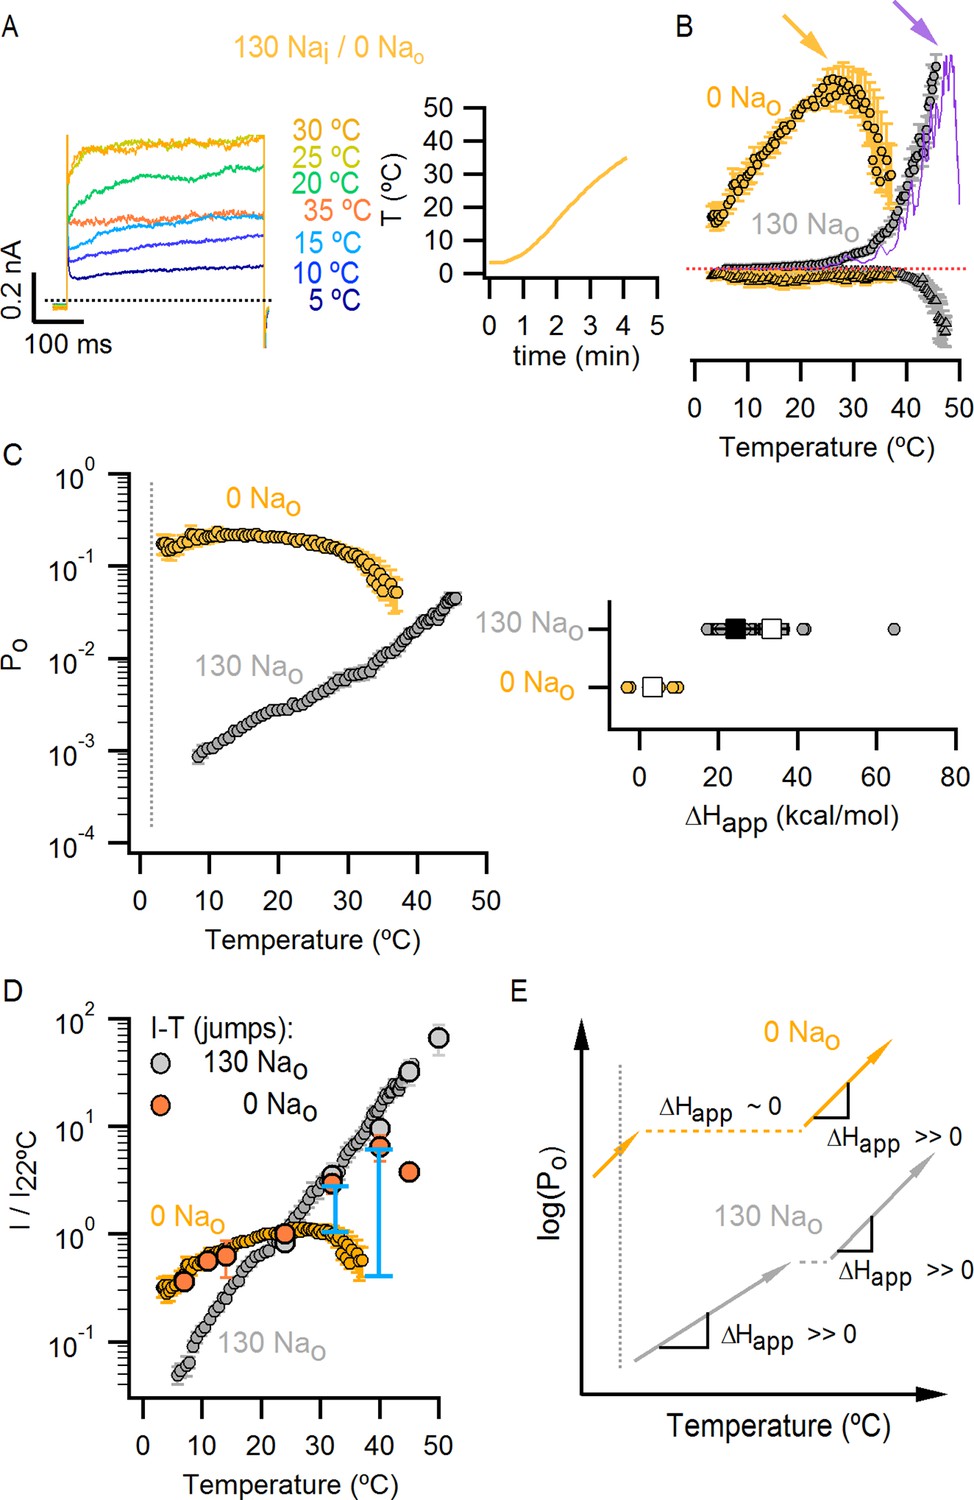
External Na+ has a strong influence on temperature-dependent gating of TRPV1.
(A) Representative whole-cell current family obtained as in Figure 4A in the absence of external Na+. The temperature vs time plot is shown on the right panel. Dotted lines denote the zero-current level. (B) Mean I-T relations in the absence (obtained from data as in (A), mean ± SEM, n = 7) and presence (same data as in Figure 4B) of external Na+ at +90 mV (circles) and -90 mV (triangles). The I-T relation in purple is from an experiment in the presence of 130 mM external Na+ with pronounced temperature-dependent inactivation at T < 50°C. The purple and yellow arrows denote the approximate onset of inactivation for data with and without external Na+, respectively. The dotted red line denotes the zero-current level. All relations are normalized to peak-current values at +90 mV. (C, left) Mean Po-T relations (+90 mV) in the presence (grey) and absence (yellow) of external Na+. Po values at room temperature for scaling Po-T relations on an absolute Po-scale were estimated from macroscopic I-V relations and noise analysis as described in Methods and Figure 5—figure supplement 2. The dotted vertical line delimits the lower range of experimentally accessible temperatures. Po-T relations from individual cells in the absence of external Na+ are shown in Figure 6—figure supplement 1A. (C, right) ΔHapp from fits of Equation 1 (see Materials and methods) to Po-T relations at +90 mV from individual cells (circles) and their mean ± SEM (squares). The mean ΔHapp for the fits to data with external Na+ at T > 25°C is shown as an open square (mean ± SEM, n = 10). The mean ΔHapp from fits to data in external Na+ at T < 25°C is shown as a closed square (mean ± SEM, n = 4). (D) Normalized I-T relations (+90 mV) from (B) plotted on a log-scale (small circles) with superimposed I-T relations obtained from rapid temperature-jumps from 8°C to higher temperatures (large circles, mean ± SEM, n = 3–8, see Materials and methods and Figure 5—figure supplement 3). The blue bars denote the increased inactivation observed in the I-T relation in the absence of external Na+ obtained from slow temperature ramps relative to that obtained with rapid temperature-jumps. (E) Schematic representation of the essential features on a log-scale of Po-T relations at +90 mV in the presence (grey) or absence (yellow) of external Na+. The dashed lines denote plateaus in which the Po does not visibly change with temperature. Arrows denote portions of the relations in which Po steeply increases with temperature. Monoexponential fits of Equation 1 correspond on a log-scale to straight lines with slope ~ΔHapp.
Figure 5—figure supplement 1
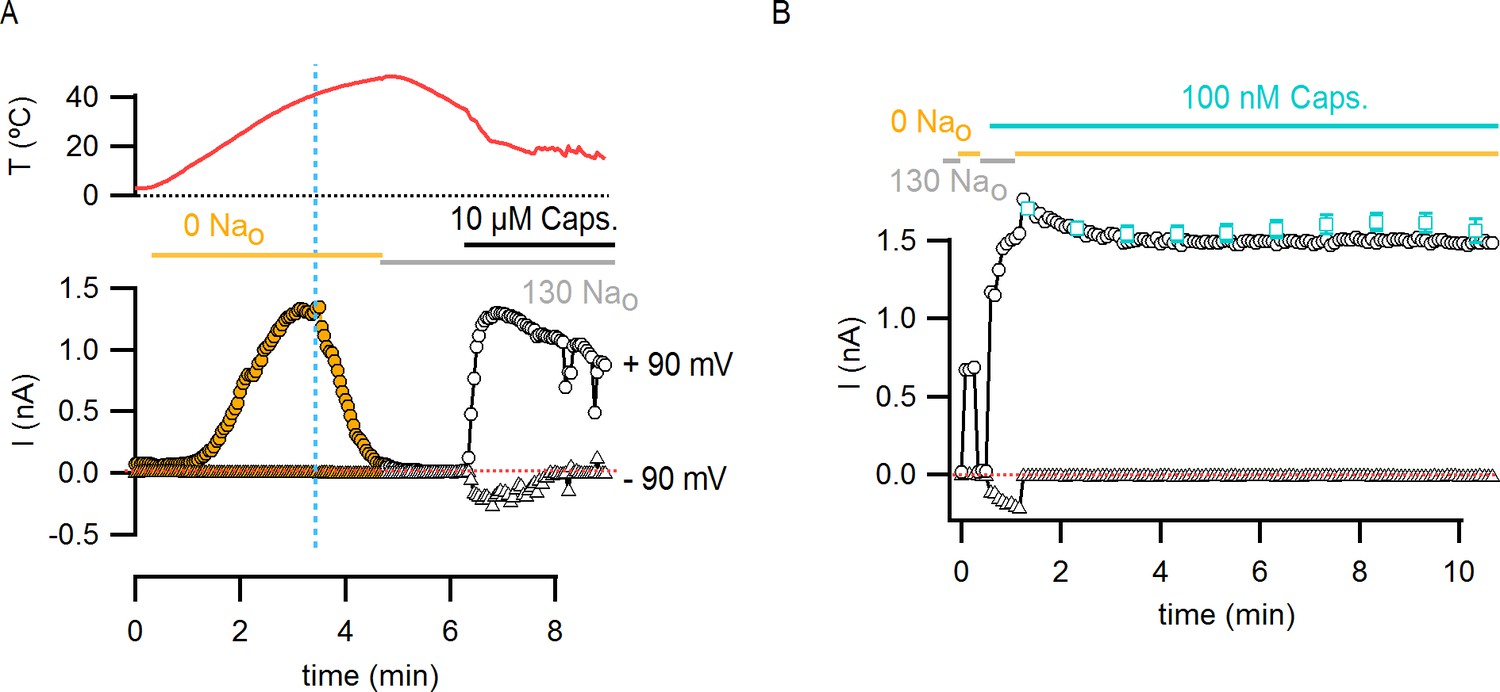
Temperature-dependent inactivation of TRPV1 channels in the absence of external Na+ can be partially reversed by capsaicin.
(A) Representative whole-cell current time course (lower panel) elicited by voltage steps from -90 to +90 mV while increasing temperature (time course for temperature is shown on the top panel) using the temperature-controlled chamber (Figure 4—figure supplement 1A). The continuous horizontal colored lines indicate the composition of the external solution in the recording chamber. The vertical dotted blue line denotes the onset of inactivation in the absence of external Na+ while the temperature is still increasing. The dotted red line denotes the zero-current level. Note that no detectable TRPV1-mediated current remains after inactivation at high temperatures, but substantial TRPV1 channel activation could still be attained by the addition of saturating capsaicin at room temperature. (B) The addition of a subsaturating concentration of capsaicin prevents rundown at room temperature in the absence of external Na+. Representative whole-cell TRPV1 channel current time-course at room temperature obtained from voltage ramps. Only current values at –90 (triangles) and +90 (circles) mV are shown. The dotted red line indicates the zero-current level. The teal open squares are the mean current time course (±SEM, n = 6) in the absence of external Na+ + 100 nM capsaicin calculated from identical experiments by normalizing each individual time-course to its initial current value (i.e. the first open square) in the solution of interest for subsequent averaging. Only data points at 1-min intervals are shown.
Figure 5—figure supplement 2
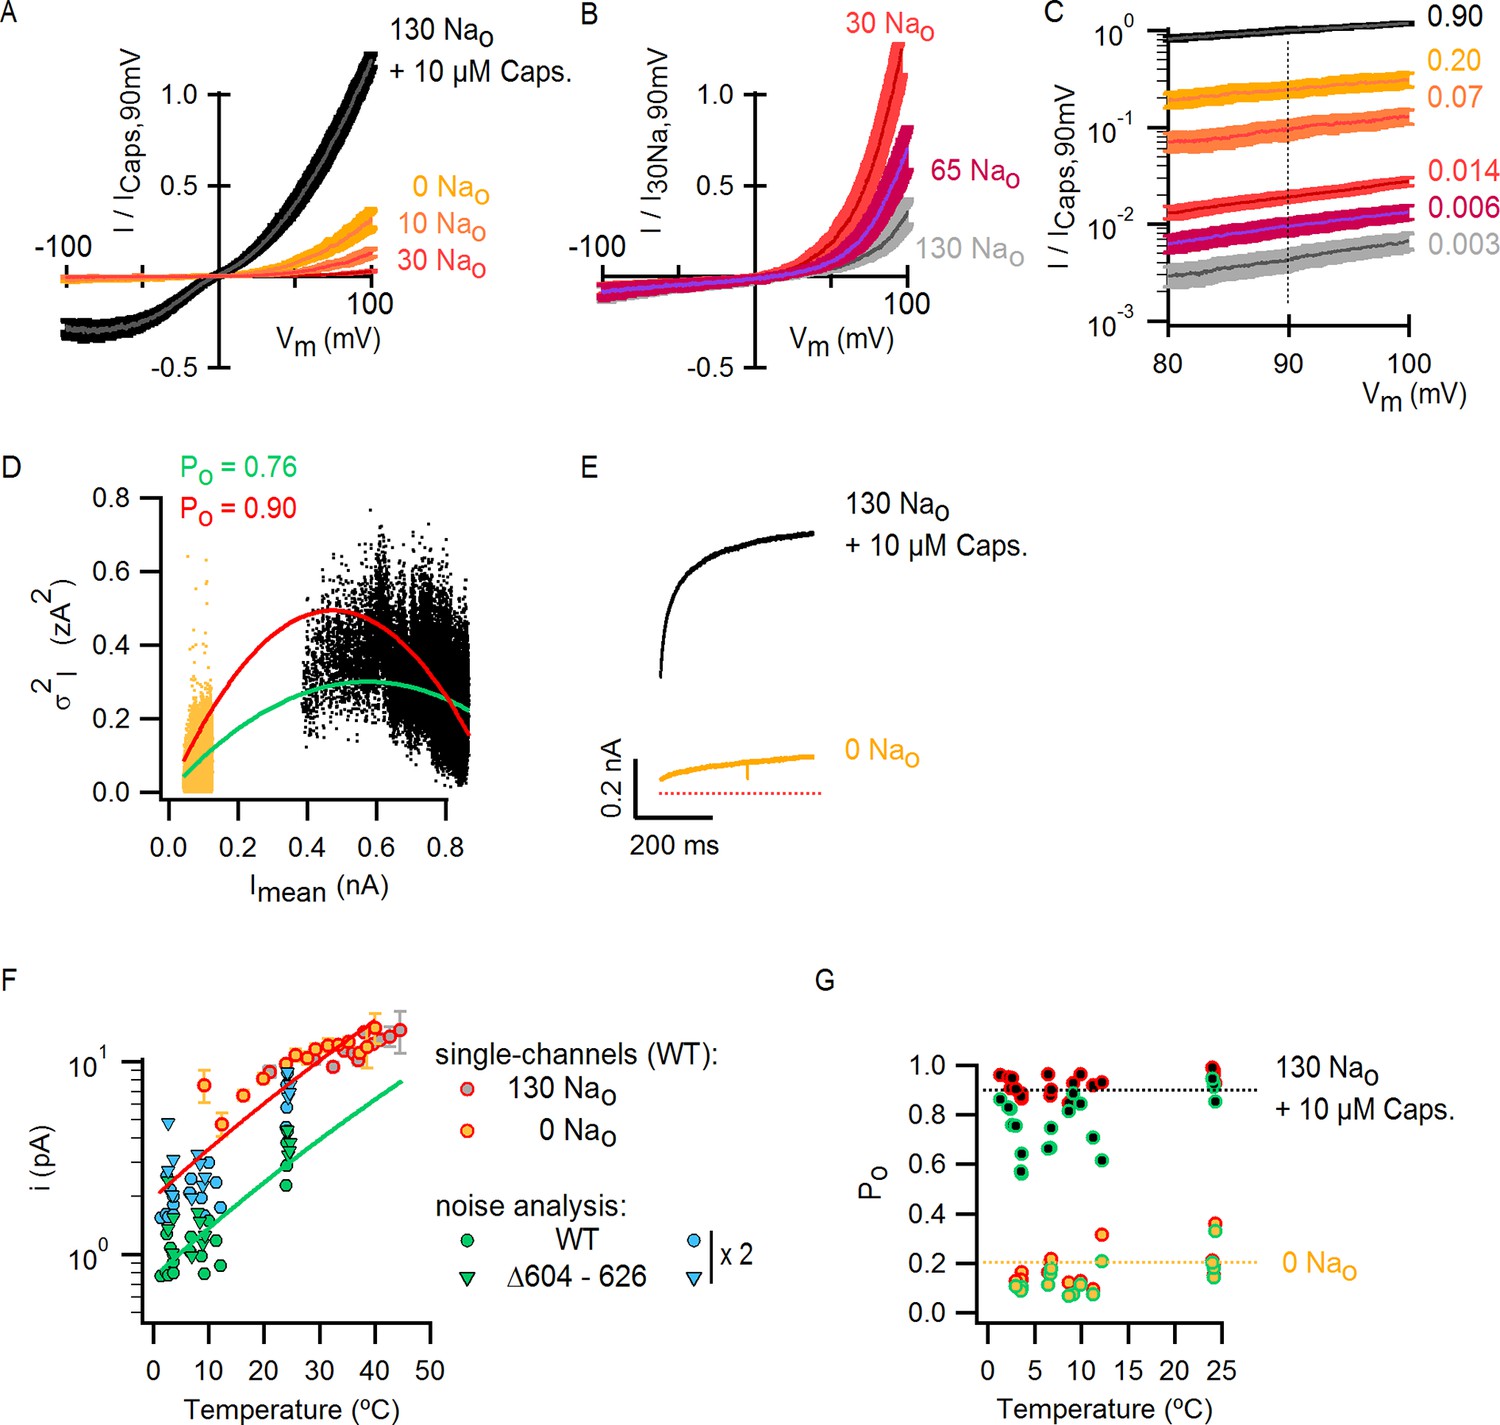
Scaling of Po-T relations based on estimates of absolute Po at room temperature from macroscopic I-V relations and noise-analysis.
(A) Mean normalized I-V relations at room temperature obtained in the whole-cell configuration using voltage ramps in the presence of extracellular solutions containing different Na+ concentrations or capsaicin. The darker thin curves are the mean, the lighter envelopes the SEM (n = 7–9). (B) Mean normalized I-V relations obtained as in (A) from cells with very high levels of expression (mean ± SEM, n = 6). (C) I-V relations from (A) and (B) (same color codes) scaled and plotted together on a log scale. The dotted line denotes that all curves were scaled relative to the current value at saturating capsaicin at +90 mV. The numbers on the right are the corresponding Po for each condition at room temperature if the Po for saturating capsaicin at +90 mV is 0.9 (see Materials and methods). (D) Representative WT TRPV1 variance (σ2I) vs mean current (Imean) plot obtained from noise analysis at ~3°C and +90 mV in the whole-cell configuration using the temperature-controlled chamber (Figure 4—figure supplement 1A). Data points on the left of the plot (yellow dots) were calculated from recordings in the absence of external Na+, whereas data on the right (black dots) were calculated from recordings in the same cell in the presence of 130 Nao + 10 µM capsaicin. Colored curves are fits to Equation 2 (, N is the number of channels in the cell, i is the single-channel current at +90 mV) with parameters: green fit (unconstrained fitting), N = 1064, i = 1.08 pA; red fit (i was constrained based on single-channel recordings, see Figure 4—figure supplement 1C–E), N = 439, i = 2.15 pA. The Po values shown at the top of the graph were calculated from the steady-state mean current at saturating capsaicin (Imean,ss) and the parameters from the fits of Equation 2 (constrained in red or unconstrained in green) with Equation 3: (E) Representative Imean from the experiment in (D) in the absence of external Na+ (yellow) or in the presence of 130 mM external Na+ and 10 µM capsaicin (black) at 3°C and +90 mV. The dotted red line denotes the zero-current level. (F) WT TRPV1 single-channel current amplitudes (+90 mV) at different temperatures estimated from recordings from outside-out patches expressing a few channels (yellow and grey circles with red envelopes, data from Figure 4—figure supplement 1E shown as mean ± SEM) or from noise analysis (green circles, individual symbols correspond to estimates from independent cells) from free-parameter fits of Equation 2 to σ2I vs Imean relations as in (E). Estimates of i for TRPV1 channels lacking the extracellular pore turret (TRPV1 Δ604–626, see Figure 9—figure supplement 1) also obtained from noise analysis are shown as green triangles. Noise analysis systematically underestimated i by a factor of ~2, as illustrated by i-values obtained from noise analysis after multiplication by 2 (blue symbols). The red and green curves are fits of Equation 1 with ΔH≠ = 9 kcal/mol, corresponding to the temperature-dependence of ion conduction through an open channel estimated from macroscopic I-T relations in saturating capsaicin (Figure 4—figure supplement 1B). (G) Po-T relations for 0 Nao and 130 Nao + 10 µM capsaicin obtained from noise analysis at different temperatures using two different methods and Equation 3. Po values calculated from unconstrained fits of Equation 2 to σ2I vs Imean relations (e.g. green fit in (D)) are shown as circles with green envelopes. Po values for the same cells calculated by constraining i in Equation 2 to the values obtained from direct single-channel recordings (e.g. red fit in (D)) are shown as circles with a red envelope. Yellow circles correspond to Po-values obtained from Equation 3 and Imean,ss in the absence of external Na+ (e.g. yellow trace in (E)), whereas black circles were calculated from Imean,ss from data in the presence of external Na+ and saturating capsaicin. Black and yellow dotted lines denote Po values of 0.9 and 0.2, respectively.
Figure 5—figure supplement 3
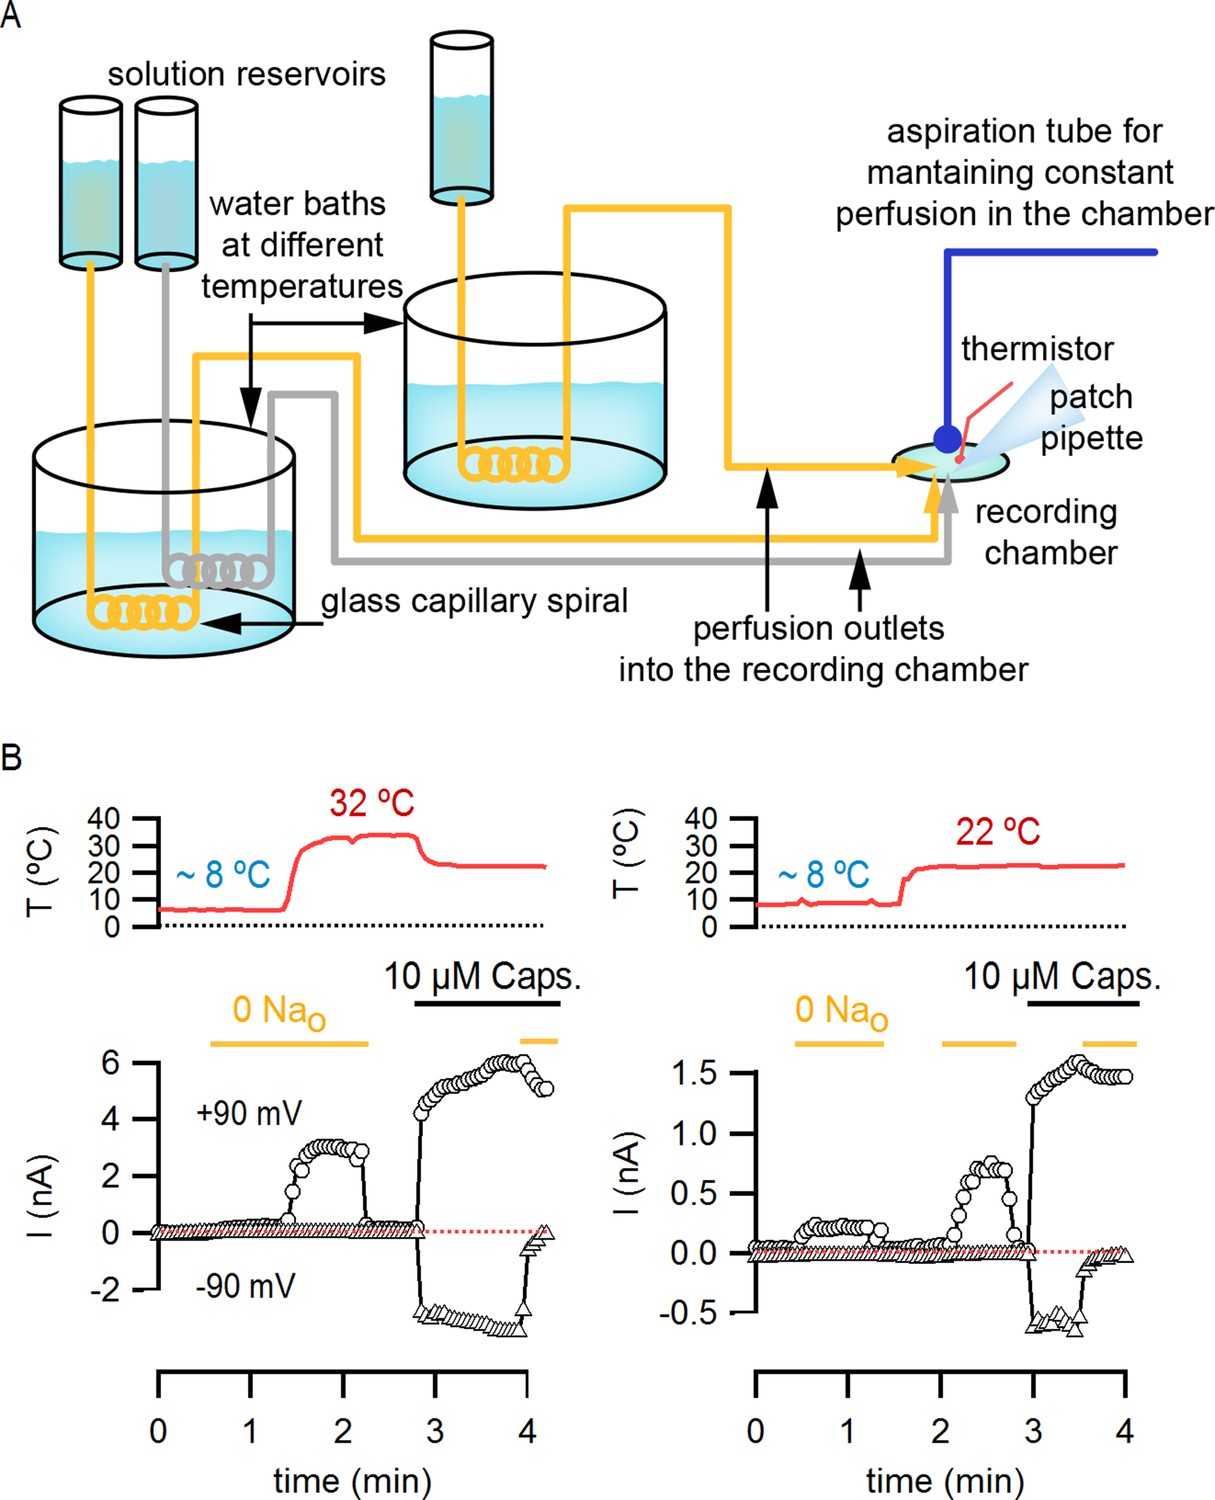
Perfusion-mediated temperature control.
(A) Schematic illustration of the perfusion-based temperature-control system used for rapid temperature jumps and I-V relations at low temperatures. Solutions kept in elevated reservoirs (for gravity-driven flow) were passed through glass capillary spirals immersed in water baths at different temperatures, and recordings were performed in a small-volume (200–500 µL) chamber during constant perfusion. Temperature was measured with a thermistor located very close to the pipette tip. Separate perfusion lines were used for each solution (e.g. one for 130 mM external Na+, shown in grey in the figure, and one for external NMDG+, shown in yellow). (B) Representative current time courses obtained during rapid perfusion-induced temperature changes showing both temperature (red traces, top panels) and current (open symbols, bottom panel) recorded in the whole-cell configuration at -90 mV (triangles) and +90 mV (circles). Horizontal thick lines denote changes in extracellular solution composition, and the red dotted lines indicate the zero-current level.
Figure 6 with 1 supplement
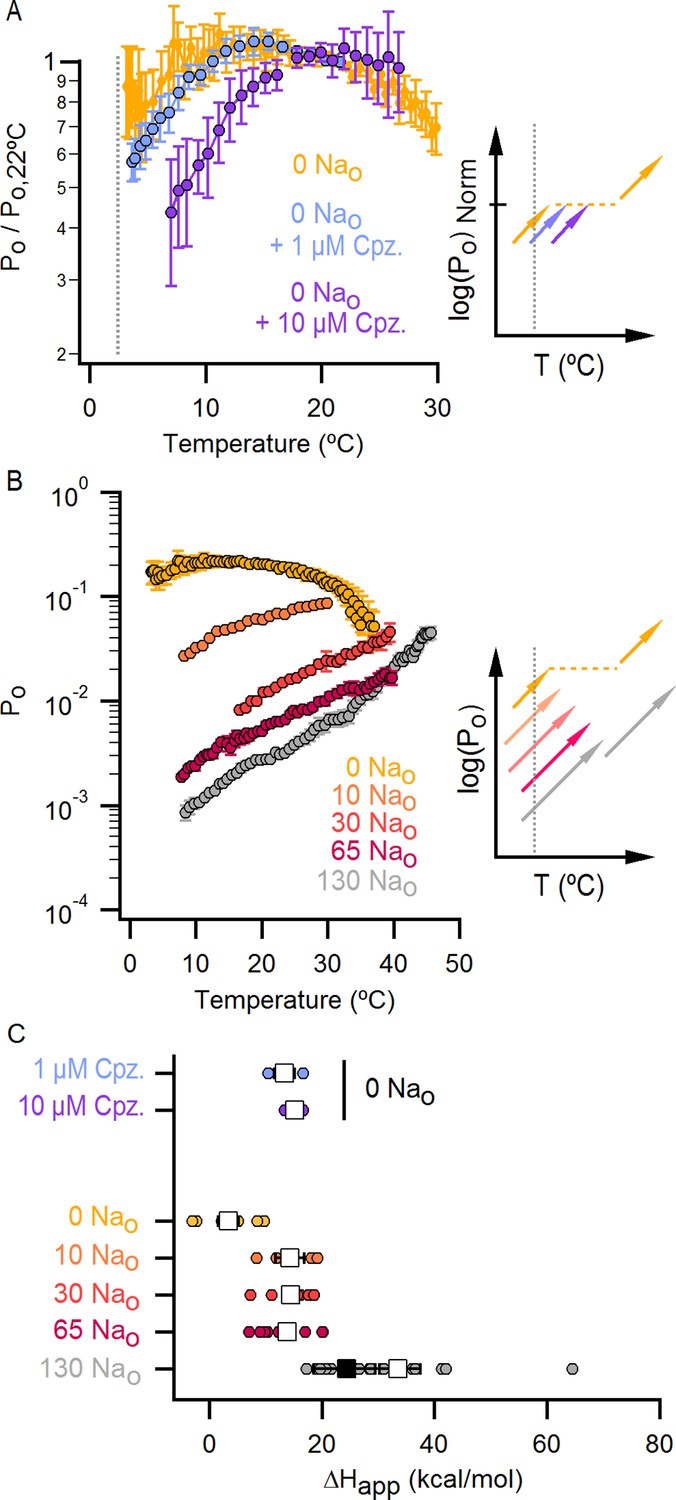
The response of the TRPV1 channel to heating is dominated by distinct conformational transitions over different temperature ranges.
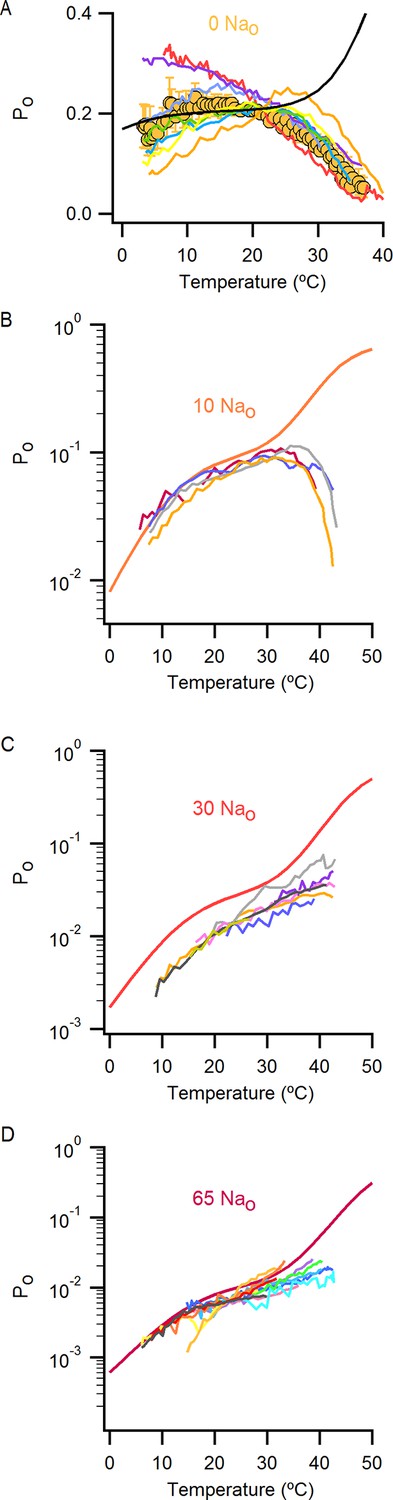
(A) Normalized Po-T relations (mean ± SEM, n = 3) obtained in the presence of 0 Nao and capsazepine (Cpz). Data in 0 Nao without capsazepine are shown for comparison. The essential features of the Po-T relations are schematized in the insert on the right as done in Figure 5E, showing that capsazepine causes a shift in the Po-T relations to higher temperatures in the absence of external Na+, uncovering temperature-dependent gating at low temperatures in the absence of Na+. The dotted vertical line delimits the lower range of experimentally accessible temperatures. (B) Po-T relations obtained in the presence of different concentrations of external Na+ at +90 mV (mean ± SEM, n = 4–14, see Figure 6—figure supplement 1 for individual cell data). Po-T relations are schematized as in Figure 5E on the right panel insert, showing that increasing the concentration of external Na+ shifts TRPV1 channel Po-T relations to higher temperatures. The dotted vertical line delimits the lower range of experimentally accessible temperatures. (C) ΔHapp obtained from fits of Equation 1 to Po-T relations from individual cells (circles) and their mean ± SEM (open squares). The filled square is the mean ΔHapp from fits to data in 130 Nao at T < 25°C (see Figure 4—figure supplement 2C–E).
Figure 6—figure supplement 1
Po-T relations from individual cells obtained with different concentrations of external Na+.
(A) Mean Po-T relation at +90 mV in the absence of external Na+ (0 Nao, large yellow circles, Figure 5C, no-T relation predicted by model i (Figure 7A) in the absence of external Na+ using the parameters in Figure 7—source data 2A. (B–D) Po-T relations from individual cells obtained in the presence of different concentrations of external Na+ from slow temperature ramps as in Figure 4A. Theoretical Po-T relations calculated for model i (Figure 7A) with parameters shown in Figure 7—source data 2A are also included as continuous colored curves.
Figure 7 with 5 supplements

An allosteric framework for TRPV1 channel gating.
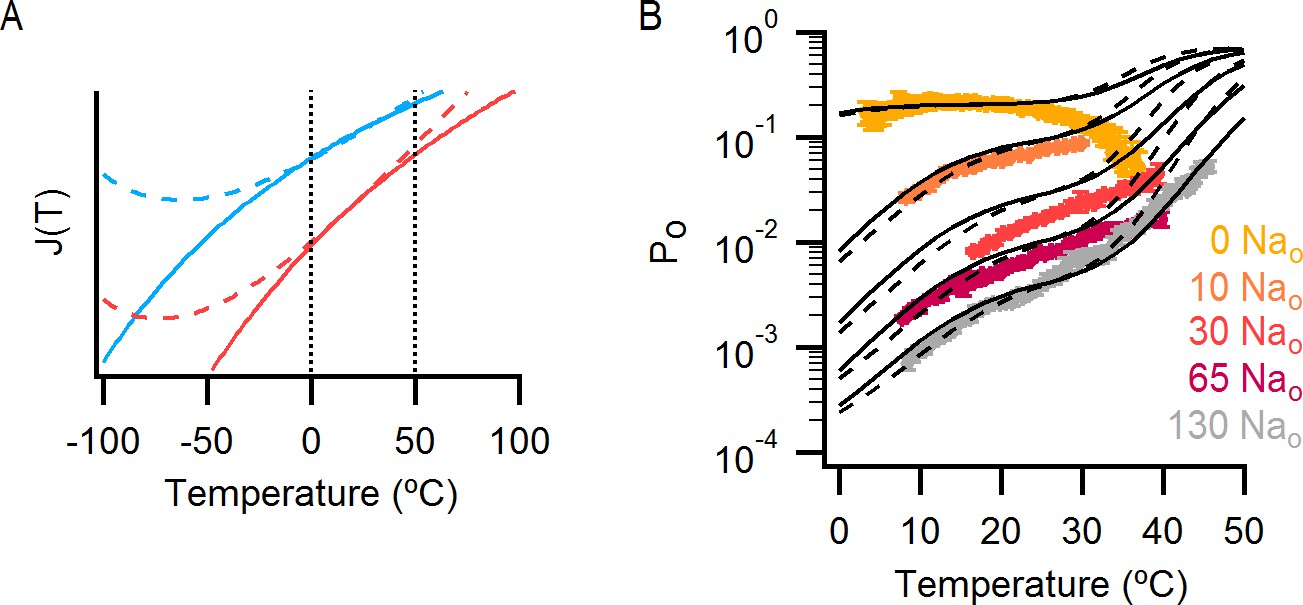
(A) Scheme for Model i with two temperature-dependent transitions (horizontal arrows) given by equilibrium constants J1 and J2 of the form J(T) = exp(-(ΔHo-TΔSo)/RT)) and a temperature-independent opening transition (vertical arrows) with equilibrium constant L. The first and second temperature-dependent transitions promote the open state by increasing L by a factor D or E, respectively. Binding of external Na+ (denoted by the subscript 'Na', diagonal arrows), which is given by equilibrium constant K1, decreases J1 by a factor G, J2 by a factor H and L by a factor F. The color of the letters indicates a positive allosteric effect (green, allosteric factor > 1) or a negative allosteric effect (red, factor < 1) on the associated equilibrium constants. The analytical expression for Po is given in Figure 7—source data 1A. (B) Mean experimental Po-T relations from data obtained in different concentrations of external Na+ (colored curves, data from Figure 6B) with the predictions of model i superimposed (black curves). Model parameters are provided in Figure 7—source data 2A.
-
Figure 7—source data 1
Analytical expressions for Po in different models.
- https://doi.org/10.7554/eLife.13356.022
-
Figure 7—source data 2
Parameters for the mathematical gating models.
- https://doi.org/10.7554/eLife.13356.023
Figure 7—figure supplement 1
Alternative models for describing temperature-dependent gating of TRPV1 and its modulation by external Na+.
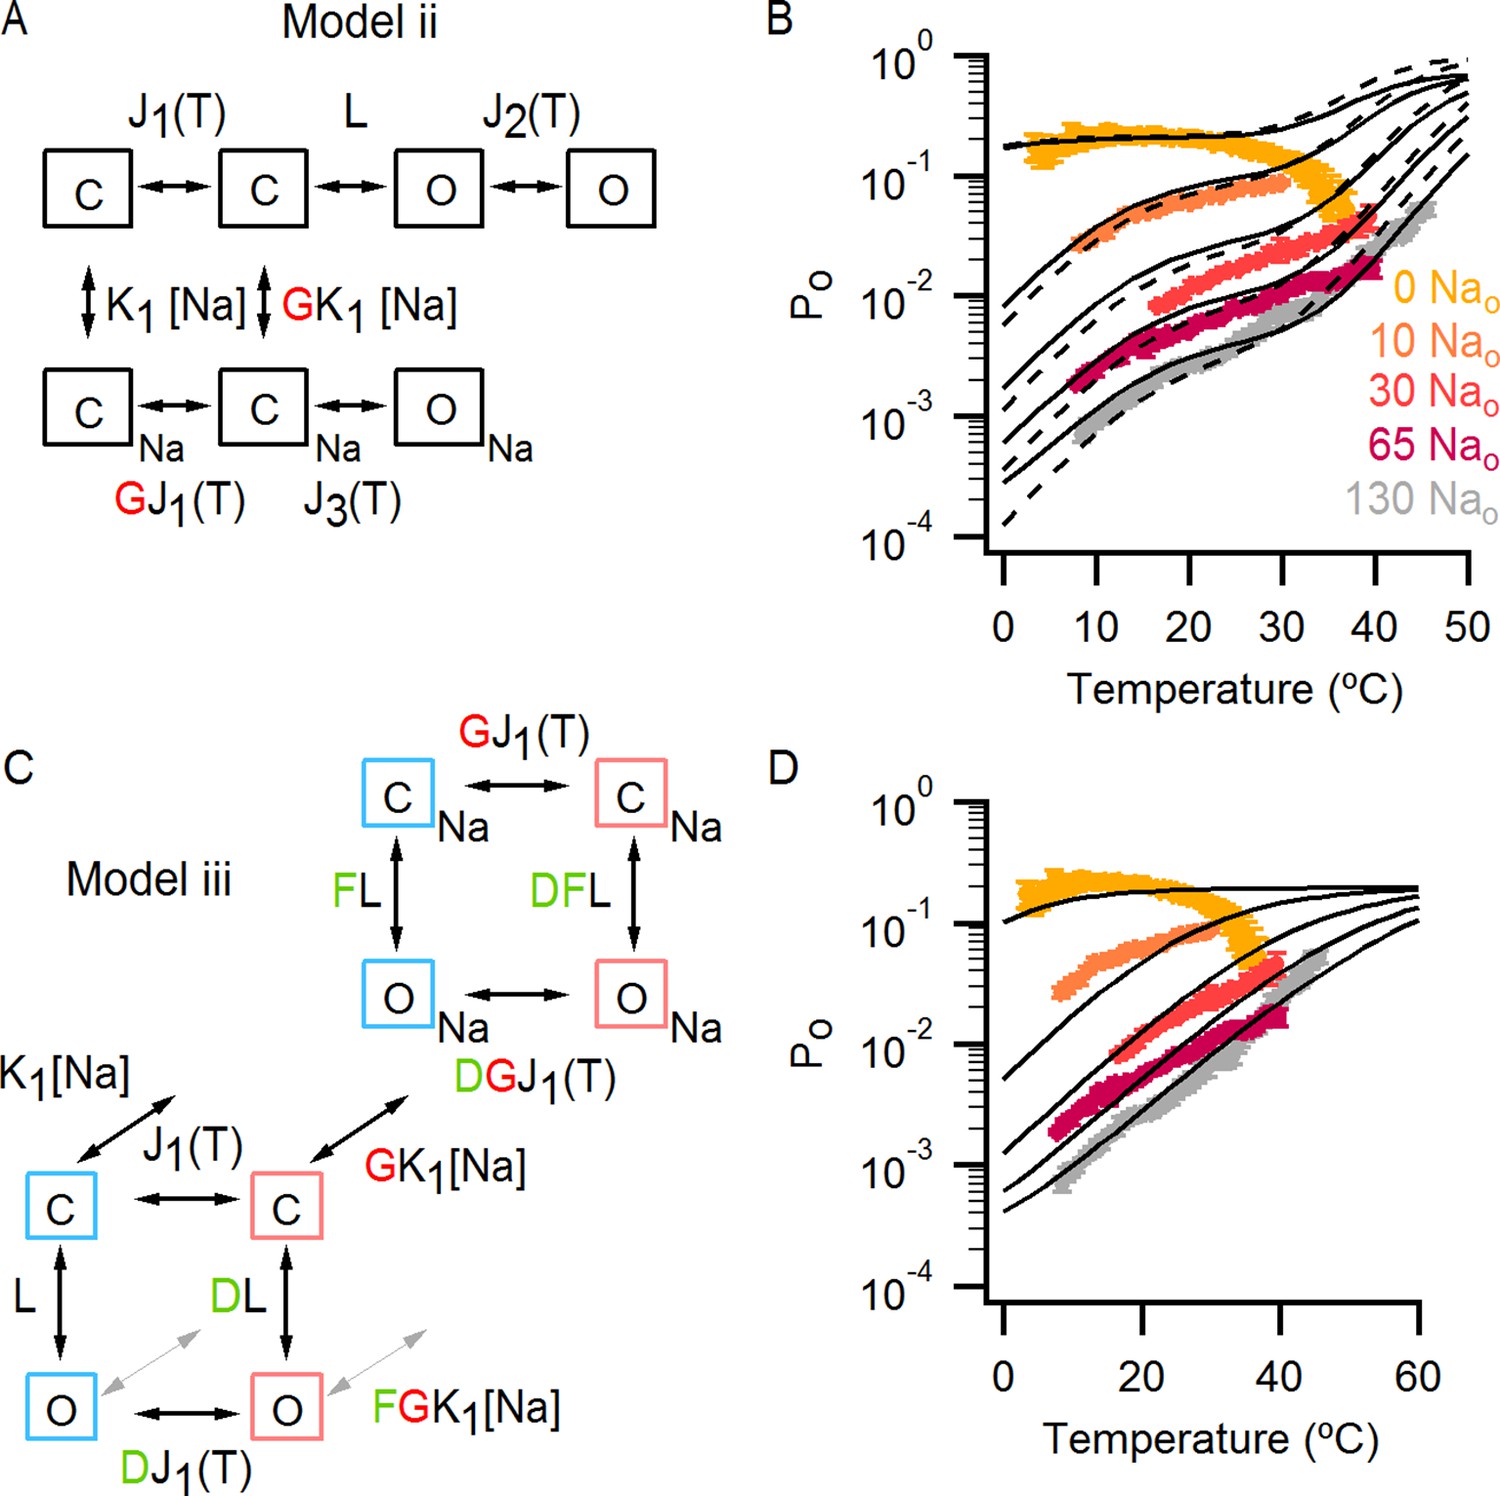
(A) Scheme for Model ii with individual conformational states represented as squares. ‘C’ labels denote closed states, ‘O’ open states and the subscript ‘Na’ denotes Na+-bound states. In the absence of external Na+ (upper row in the scheme), one temperature-dependent transition between closed states (given by temperature-dependent equilibrium constant J1) precedes a temperature-independent opening transition (given by the equilibrium constant L). A second temperature-dependent transition (given by J2) can occur between open states. The binding of external Na+ (lower row in the scheme) increases the midpoint temperature for the first temperature-dependent transition (given in the presence of Na+ by G x J1), and induces a temperature-dependent opening transition (given by J3) that is not observed in the absence of external Na+. The analytical expression for the Po for model ii can be seen in Figure 7—source data 1B. (B) Superimposed predictions of model i (continuous black curves, scheme in Figure 7A) and ii (dashed black curves, parameters in Figure 7—source data 2B) together with experimental data from Figure 6B. (C) Scheme for Model iii showing the four coupled equilibria considered and their allosteric couplings. Model iii is equivalent to model i (Figure 7A), but with a single temperature-dependent transition (horizontal transitions). Activation of the temperature sensor is controlled by equilibrium constant J1(T). The opening transition is controlled by equilibrium constant L (vertical transitions) and the binding of Na+ (diagonal transitions) by constant K1. The strength of the allosteric coupling is given by the allosteric factors D (between temperature-sensor and the opening transition), F (between the binding of external Na+ and the opening transition) and G (between the temperature-sensor and the binding of external Na+). The color of the letters indicates a positive allosteric effect (green, allosteric factor > 1) or a negative allosteric effect (red, factor < 1) on the associated equilibrium constants. The analytical expression for Po corresponding to this model is provided in Figure 7—source data 1C. (D) Theoretical Po-T relations (black curves) calculated using model iii and parameters in Figure 7—source data 2C for different external Na+ concentrations. The experimental data shown (mean ± SEM, colored curves) is that from Figure 6B for different concentrations of external Na+.
Figure 7—figure supplement 2
High concentrations of external Na+ do not fully prevent TRPV1 channel activation by positive voltages, capsaicin or heat.
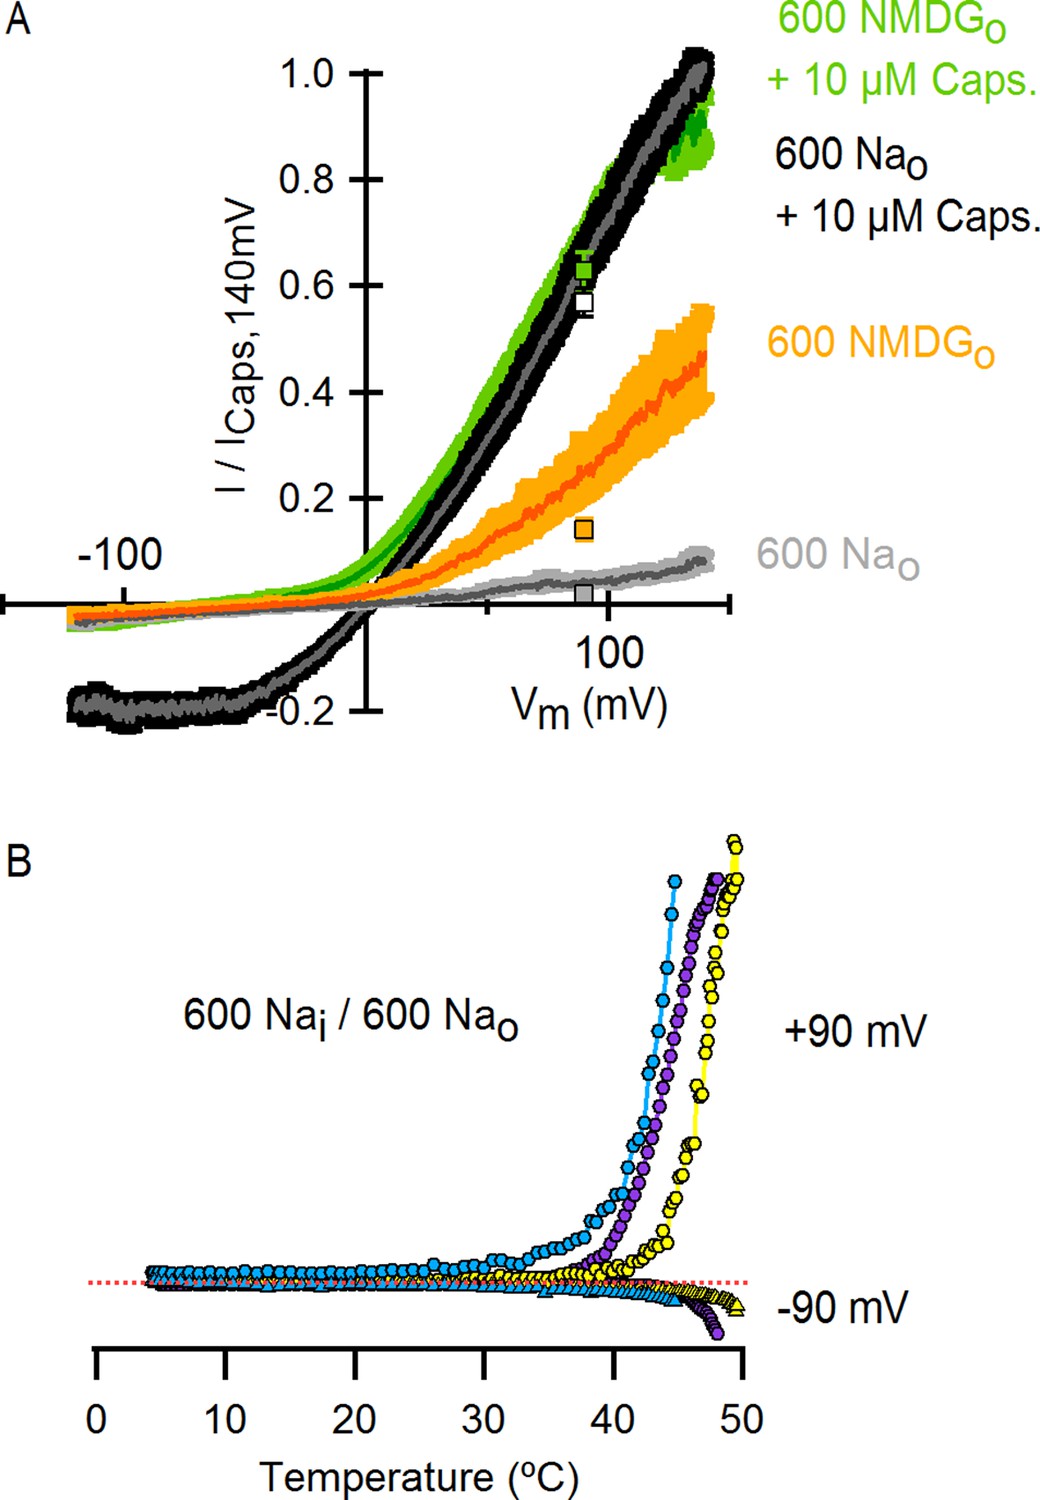
(A) Normalized I-V relations obtained from voltage ramps measured in the whole-cell configuration with an intracellular solution containing 600 mM NaCl and the following extracellular solutions (in mM): 600 NaCl (grey), 0 NaCl (600 NMDGCl, yellow), 600 NaCl + 10 µM capsaicin (black) and 0 NaCl (600 NMDGCl) + 10 µM capsaicin (green). Dark thin curves are the mean, and the colored envelopes the SEM (n = 4). The colored squares are the normalized current values (mean ± SEM) at +90 mV from the I-V relations in Figure 1C, which were obtained with solutions containing a concentration of permeant cations of 130 mM. (B) Representative whole-cell I-T relations obtained in the presence of 600 mM intra- and extracellular Na+. Data wwere obtained using the same procedure as for I-T relations shown in Figure 4A and B. Data for three different cells (yellow, purple and blue) are shown. Each curve was normalized to the peak current value at +90 mV. The red-dotted line indicates the zero-current level.
Figure 7—figure supplement 3
Assessing the influence of voltage on temperature-dependent gating of TRPV1 channels in the absence of external Na+.
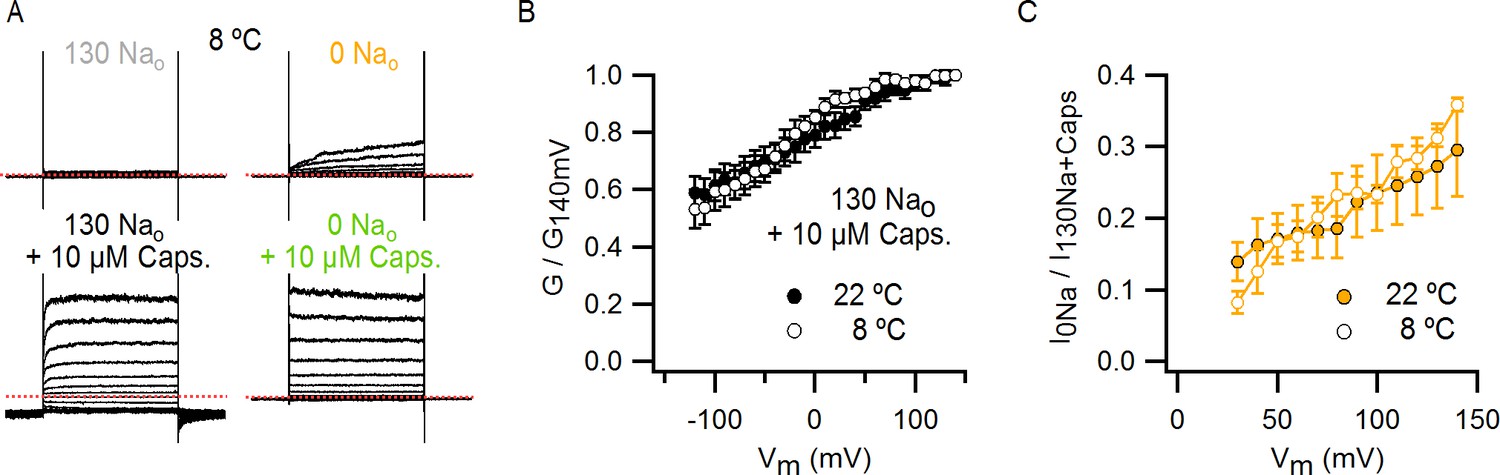
(A) Representative whole-cell TRPV1 current families obtained at 8°C in response to 400 ms voltage pulses from -120 to +140 mV in 10 mV increments (only traces for steps to even voltages are shown for clarity) and recorded in the absence and presence of external Na+ or NMDG+, with and without saturating capsaicin. Solutions were delivered though a temperature-controlled perfusion system as illustrated in Figure 5—figure supplement 3A. The dotted red lines indicate the zero-current level. (B) Normalized conductance-voltage (G-V) relations obtained in 130 Nao + 10 µM capsaicin from current families as in (A) (~8°C, n = 5) or as in Figure 1—figure supplement 3A (~22°C, n = 7). Conductance was calculated from the tail currents at -90 mV right after each test pulse and normalized to the tail current amplitude after the voltage pulse to +140 mV. (C) Fraction of current activated in the absence of external Na+ relative to 130 Nao + 10 µM capsaicin as a function of voltage at 8 and 22°C, obtained from current families as in (A) (for 8°C data) or as in Figure 1—figure supplement 3A (22°C). Data are shown as mean ± SEM.
Figure 7—figure supplement 4
The effect of a change in heat capacity associated with the operation of the temperature-sensor on the predictions of the allosteric gating model.
(A) Graph showing how J1(T) (blue) and J2(T) (red) (see model i in Figure 7A) change as a function of temperature when they are associated with a change in heat capacity (dashed curves, parameters in Figure 7—source data 2D) or not (continuous curves, parameters in Figure 7—source data 2A). The vertical dotted black lines denote the range of temperatures in which the experimental data was obtained. (B) Theoretical Po-T relations (dashed black curves) calculated using model i (Figure 6A) with a heat capacity difference associated with the two temperature-dependent transitions governed by J1(T) and J2(T) (see Materials and methods and model parameters in Figure 7—source data 2D). Predictions of model i with temperature-independent changes in enthalpy and entropy (i.e., no change in heat capacity) associated with temperature-sensor function are shown as continuous black curves. Experimental Po-T relations (colored circles, data from Figure 6B) for different external Na+ concentrations are also included.
Figure 7—figure supplement 5
Incorporating temperature-dependent inactivation into the allosteric model.
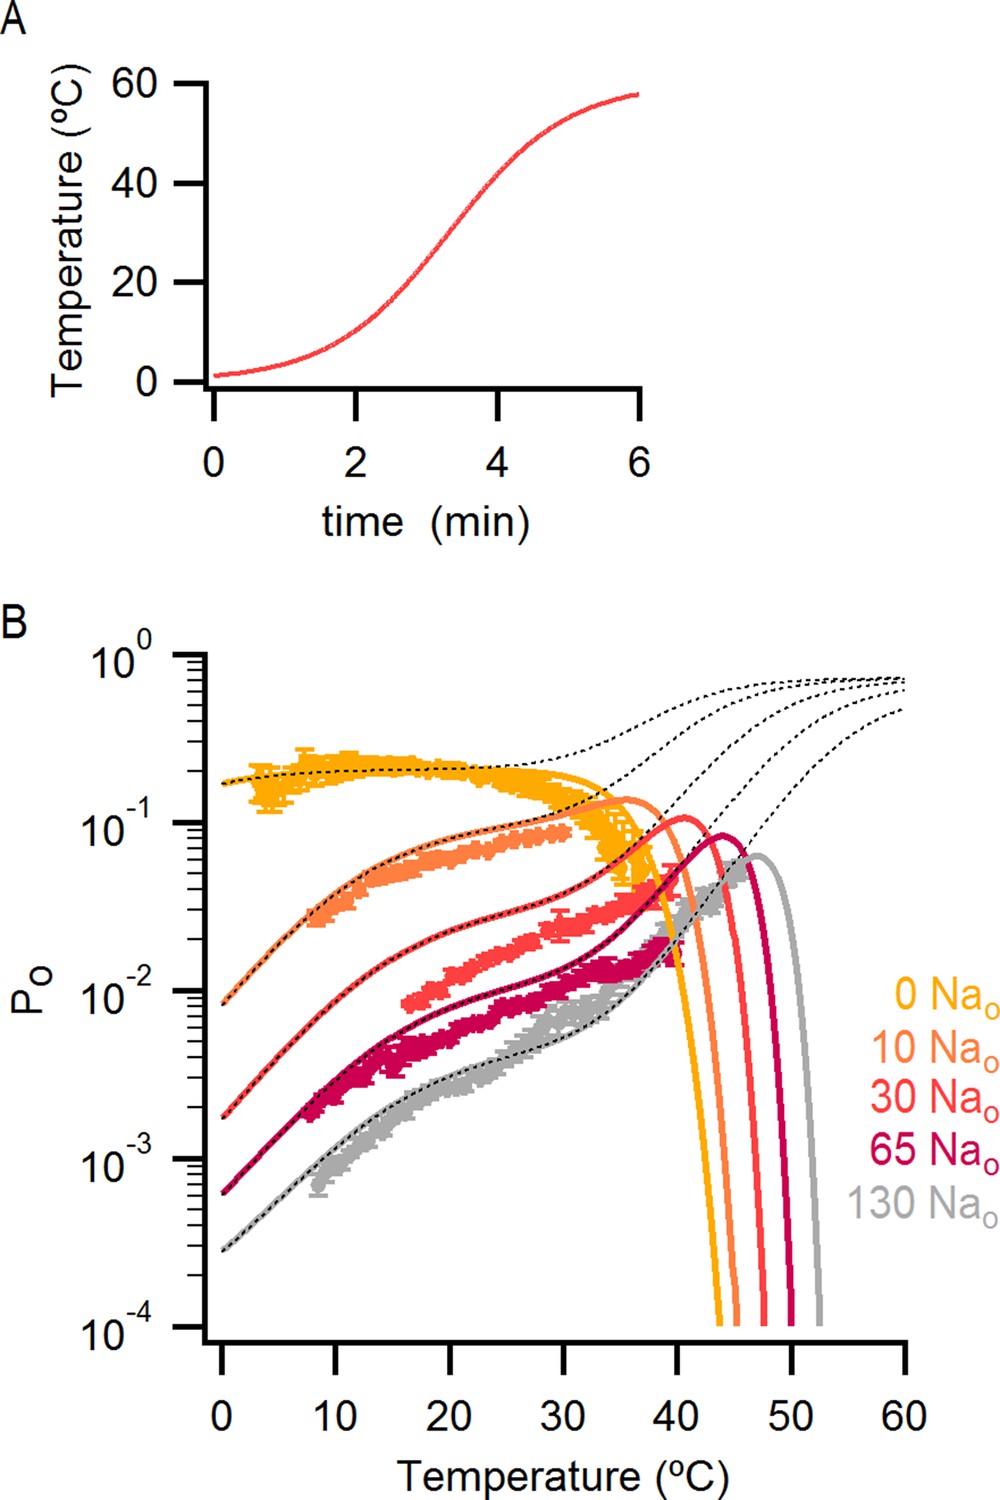
(A) Theoretical plot of temperature vs time used for introducing temperature-dependent inactivation into the predictions of model i (see Materials and methods). (B) Theoretical Po-T relations (model i with the parameters in Figure 7—source data 2A, see Materials and methods for details) in which temperature-dependent inactivation was taken into account (continuous colored curves). The dotted black lines are the predictions of the model without inactivation, and experimental data are shown as colored circles (data from Figure 6B).
Figure 8 with 1 supplement

The effect of capsaicin on temperature-dependent gating of TRPV1.
(A) Po-T relations (mean ± SEM, n = 4–14) obtained in the presence of 130 mM external Na+ and different concentrations of capsaicin (see Figure 8—figure supplement 1A for Po-T relations from individual cells). The numbers in parenthesis indicate the mean Po at 22°C and +90 mV estimated from IV relations (see Materials and methods). Continuous curves are the predictions from Model i including capsaicin shown in (B) with Po given in Figure 7—source data 1A and parameters in Figure 7—source data 2A (see Figure 8—figure supplement 1B and C for theoretical Po-T relations over a larger temperature range). The insert on the right shows schematized Po-T relations on a log scale as in Figure 5E. (B) Schematic depiction of the allosteric Model i (Figure 7A) including capsaicin with four coupled equilibria denoted by the numbers in parenthesis: (1) opening and closing of the pore, determined by the temperature-independent equilibrium constant L; (2) two-step activation/deactivation of the temperature sensor(s), given by temperature-dependent equilibrium constants J1 and J2 of the form ; binding/unbinding of sodium (3) or capsaicin (4), determined by temperature-independent equilibrium constants K1 and K2, respectively. Arrows indicate allosteric coupling between equilibria, with red denoting allosteric inhibition (allosteric factor < 1) and green stimulation (allosteric factor > 1). The magnitude of the coupling is determined by the multiplicative temperature-independent allosteric factors next to the arrows.
Figure 8—figure supplement 1
Po-T relations from individual cells for different concentrations of capsaicin and predictions of the allosteric model over an extended range of temperatures.
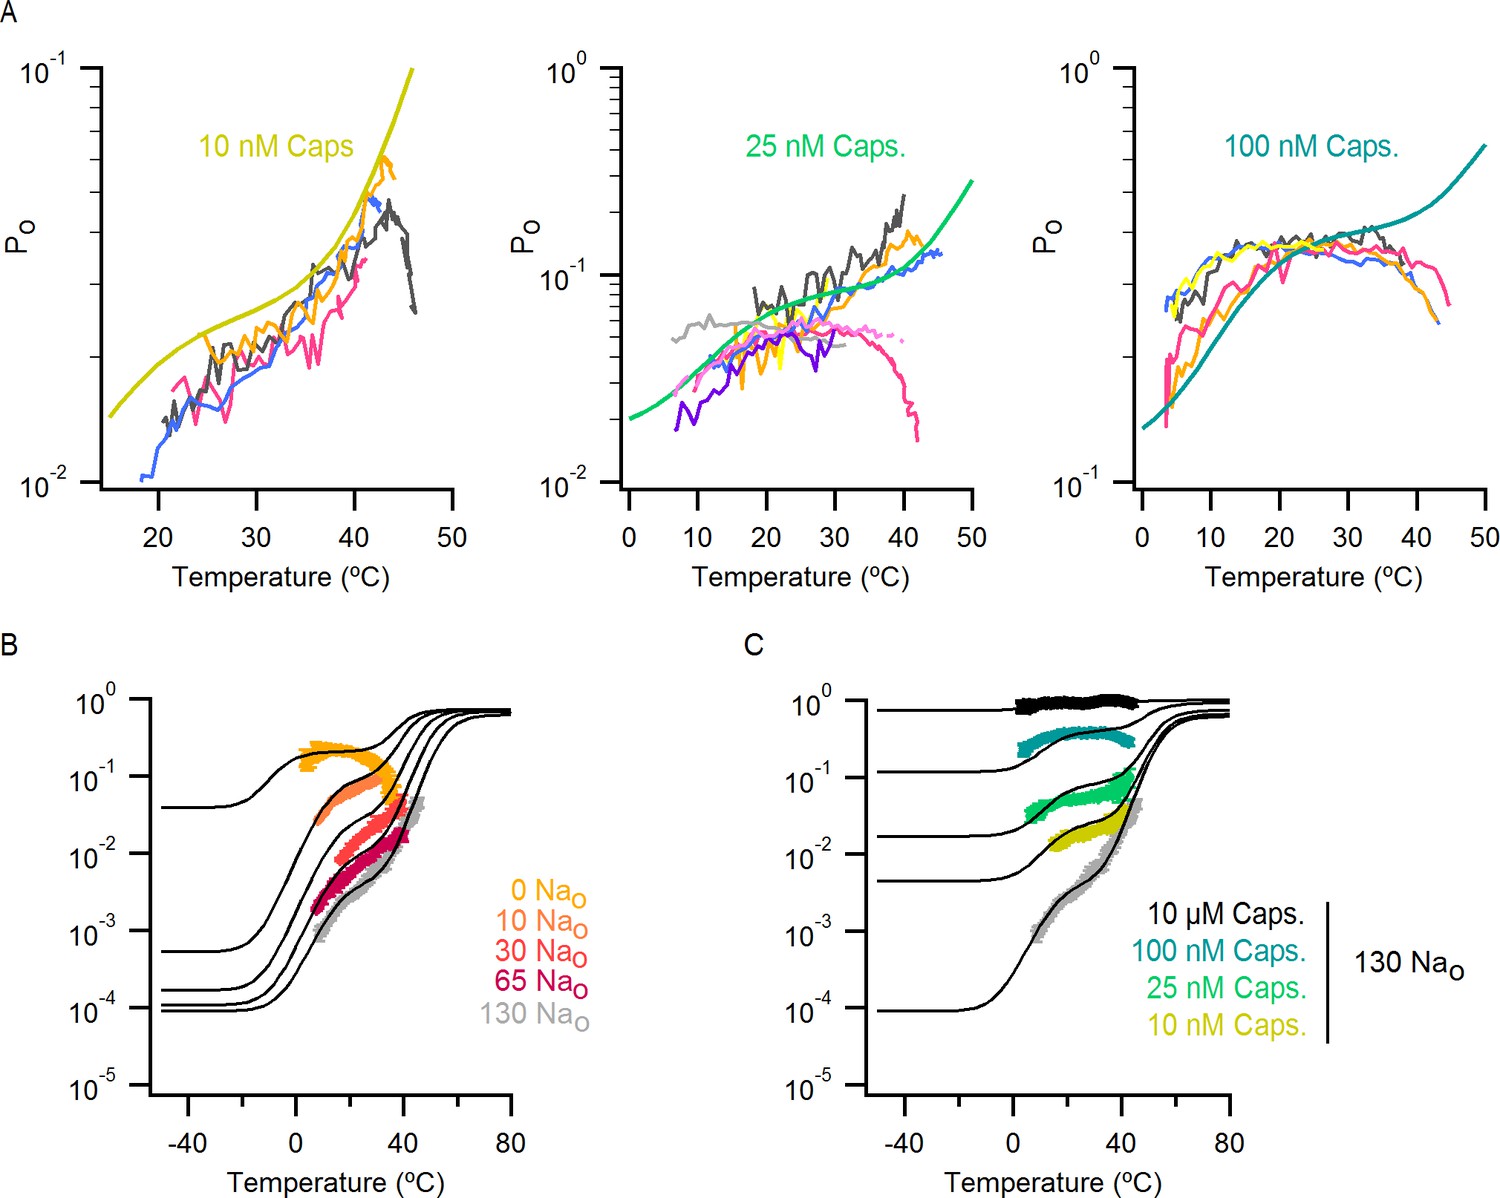
(A) Theoretical Po-T relations (thick continuous curves, model i with capsaicin – Figure 8B, Po-equation in Figure 7—source data 1A, parameters in Figure 7—source data 2A) calculated for three concentrations of capsaicin and 130 mM extracellular Na+ with superimposed Po-T data for individual cells (thin colored lines). (B and C) Same graphs as in Figure 7B and 8A with an extended temperature-axis to illustrate predictions of the model over extremes of temperature. Theoretical Po-T relations are shown in black.
Figure 9 with 1 supplement
Deletion of the outer pore turret uncovers temperature-sensitive gating of TRPV1 in saturating capsaicin.
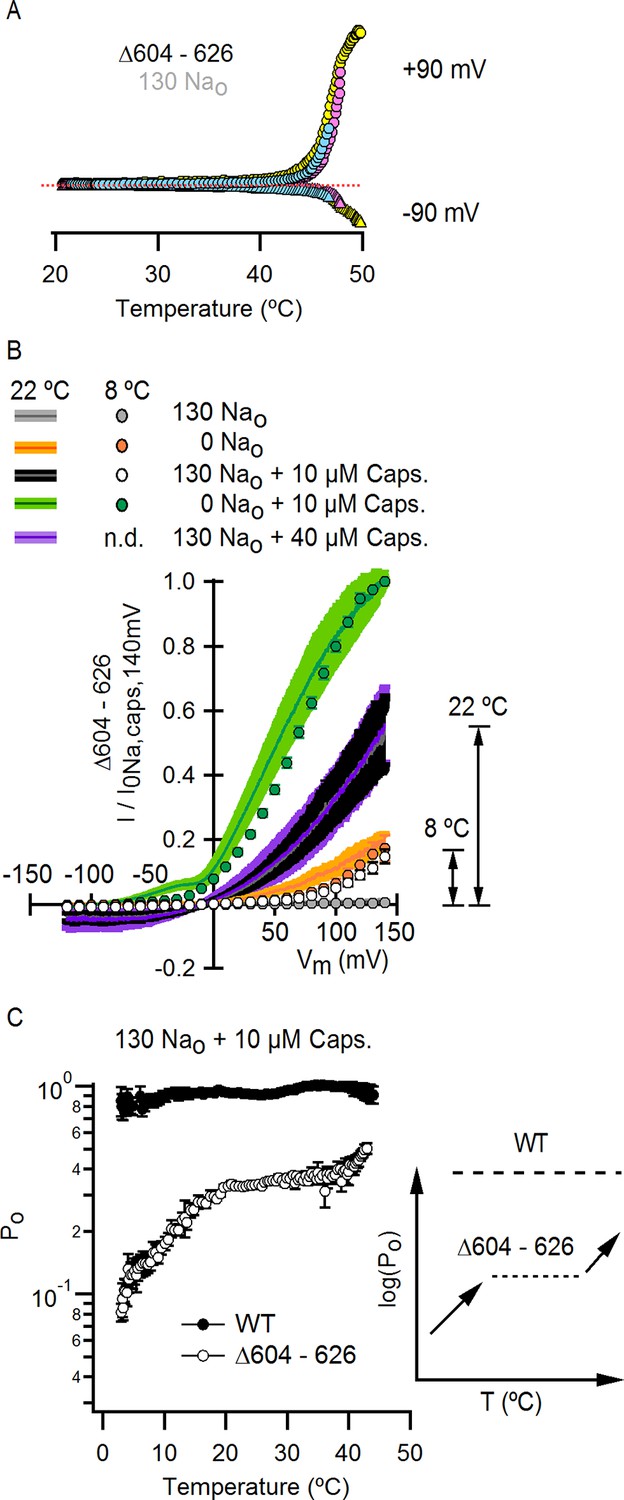
(A) Three representative TRPV1 Δ604–626 whole-cell I-T relations measured in 130 mM external Na+ in response to pulses from -90 to +90 mV as in Figure 4A and B. The dotted line is the zero-current level. (B) Normalized I-V relations for TRPV1 Δ604–626 obtained in the whole-cell configuration at 22°C (continuous curves are the mean, lighter envelopes the SEM, n = 6, same data as Figure 3E) or 8°C (circles, mean ± SEM, n = 9) in response to voltage ramps or families of voltage pulses, respectively. The arrows indicate the fractional activation by capsaicin in the presence of external Na+ at both 8 and 22°C. (C) Po-T relation (mean ± SEM, n = 12) for TRPV1 Δ604–626 (open circles) at +90 mV scaled based on the I-V relations in (B) at 22°C (assuming maximal Po of 0.9 at room temperature in the presence of 10 µM capsaicin without external Na+). The mean Po-T relation for the WT channel in the presence of 130 mM external Na+ and 10 µM capsaicin is shown as closed black circles (data from Figure 4—figure supplement 1B, mean ± SEM, n = 11). The insert on the right schematizes as in Figure 5E the Po-T relations for both WT (long-dash line) and Δ604–626 (short-dash line and arrows) channels in the presence of saturating capsaicin and external Na+. See Figure 9—figure supplement 1B for Po-T relations from individual cells.
Figure 9—figure supplement 1
Influence of the pore turret of TRPV1 on temperature-dependent gating and modulation by sodium.
(A) External Na+ dose-response relations for TRPV1 Δ604–626 (open circles, mean ± SEM, n = 4) measured at +90 mV from voltage-ramps in the whole-cell configuration. Closed circles are data for WT TRPV1 at +90 mV. The grey and black continuous curves are the predicted normalized dose-response relations generated with model i (Figure 7A and 8B with capsaicin) for TRPV1 Δ604–626 (parameters in Figure 7—source data 2E) or WT TRPV1 (parameters in Figure 7—source data 2A), respectively. (B) Mean Po-T relation (large open circles, mean ± SEM, n = 12, data from Figure 9C) for TRPV1 Δ604–626 at +90 mV. The Po-T relations for all individual cells are shown as continuous colored curves (each cell has a different color). The open squares are the mean Po ± SEM (n = 4–5 for each temperature-range) obtained from noise analysis at different temperatures (see Materials and methods and Figure 5—figure supplement 2D–G) for TRPV1 Δ604–626, after averaging Po-data obtained at similar temperatures in the presence of 130 Nao + 10 µM caps. (grey open squares) or 0 Nao +10 µM caps. (green open squares). The continuous black and light-green curves are predictions of model i for 130 Nao + 10 µM caps. (black) and 0 Nao +10 µM caps. (light green) using parameters in Figure 7—source data 2E.
Figure 10 with 1 supplement
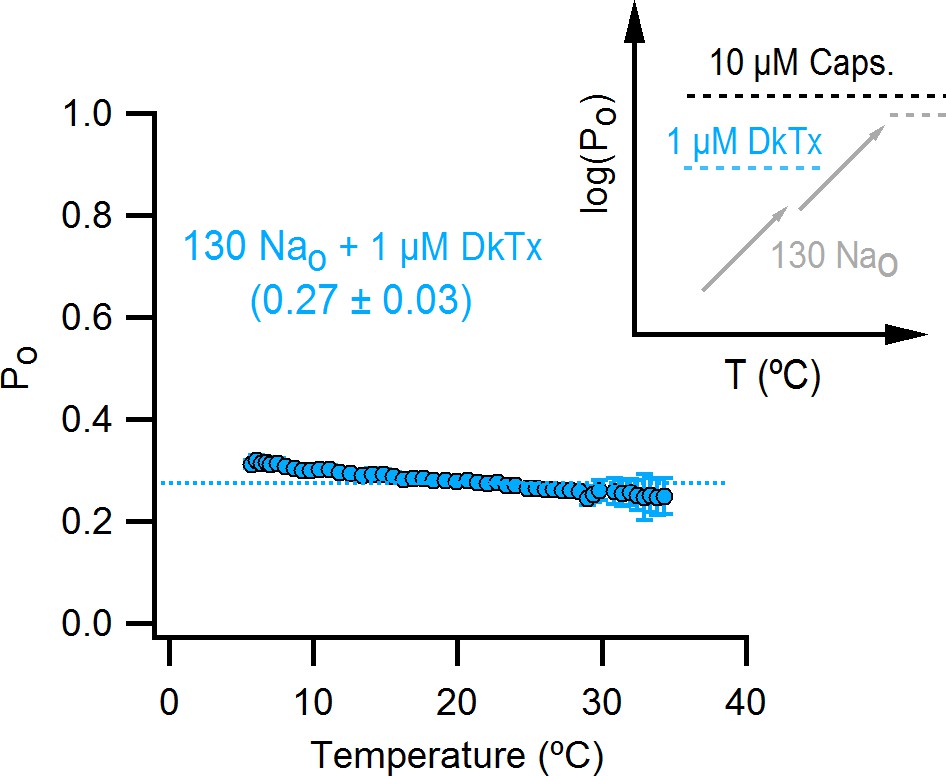
The binding of DkTx to the outer pore of TRPV1 effectively ablates temperature-dependent gating over a wide range of temperatures.
Po-T relation (mean ± SEM, n = 9) for WT TRPV1 obtained in the presence of external Na+ and DkTx. The dotted line denotes the mean Po at 22°C and +90 mV as estimated from the I-V relations in DkTx relative to saturating capsaicin shown in Figure 3C. The insert to the upper right represents experimental Po-T relations on a log scale measured in the presence of external Na+ and saturating capsaicin (dashed black line denoting the absence of temperature-dependent gating), external Na+ and DkTx (dashed blue line, no temperature-dependent gating) and external Na+ alone (two temperature-dependent transitions). See Figure 10—figure supplement 1B for Po-T relations from individual cells.
Figure 10—figure supplement 1
DkTx binding to TRPV1.
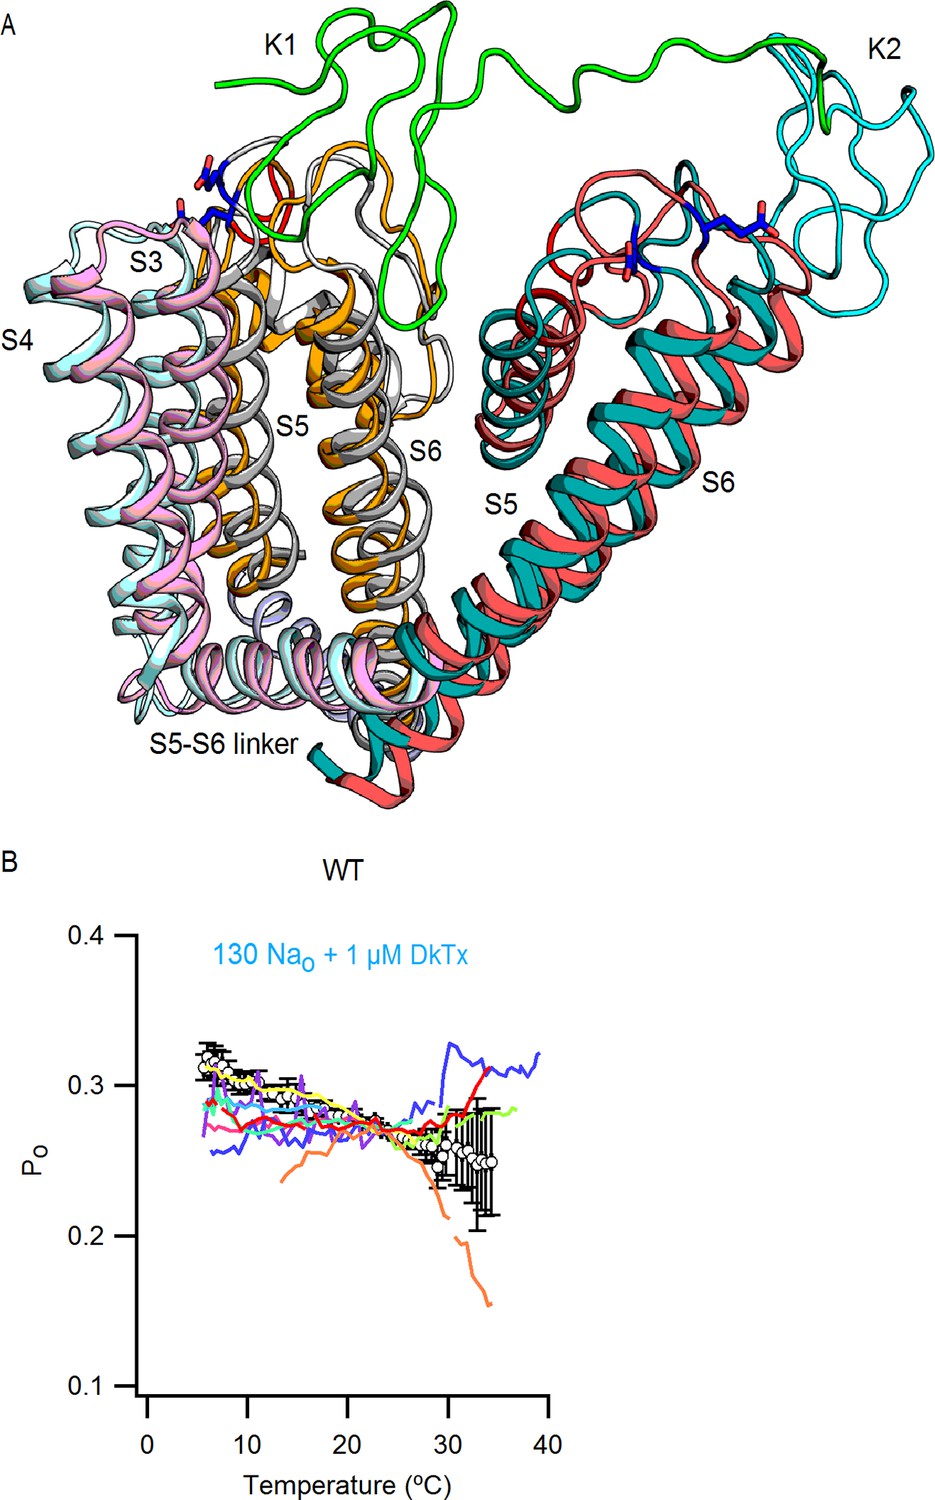
(A) Overlay of the side views of the S3-S6 segments of one TRPV1 subunit and the S5-S6 segments of an adjacent subunit in the apo (subunit 1, S3-S4 in light pink, S5-S6 in magenta; subunit 2, S5-S6 in light grey) and the DkTx/RTx bound state (subunit 1, S3-S4 in light blue, S5-S6 in teal; subunit 2, S5-S6 in light orange). The structures shown are the refined structural models of TRPV1 from (Bae et al., 2016), with the docked solution structure of DkTx (K1 in green and K2 in cyan). E600 is shown in stick representation and colored in dark blue, and the red highlight denotes the location from which the pore turret was deleted in the structure used for structure determination (Cao et al., 2013; Liao et al., 2013). (B) Mean Po-T relation (mean ± SEM, n = 9, data from Figure 10,) for WT TRPV1 obtained in the presence of external Na+ and DkTx. The Po-T relations for individual cells are shown as colored continuous curves.
Download links
A two-part list of links to download the article, or parts of the article, in various formats.
Downloads (link to download the article as PDF)
Open citations (links to open the citations from this article in various online reference manager services)
Cite this article (links to download the citations from this article in formats compatible with various reference manager tools)
An external sodium ion binding site controls allosteric gating in TRPV1 channels
eLife 5:e13356.
https://doi.org/10.7554/eLife.13356


