Mesolimbic confidence signals guide perceptual learning in the absence of external feedback
- Bernstein Center for Computational Neuroscience, Germany
- Charité Universitätsmedizin, Germany
- Universitätsklinikum Hamburg-Eppendorf, Germany
Figures
Figure 1
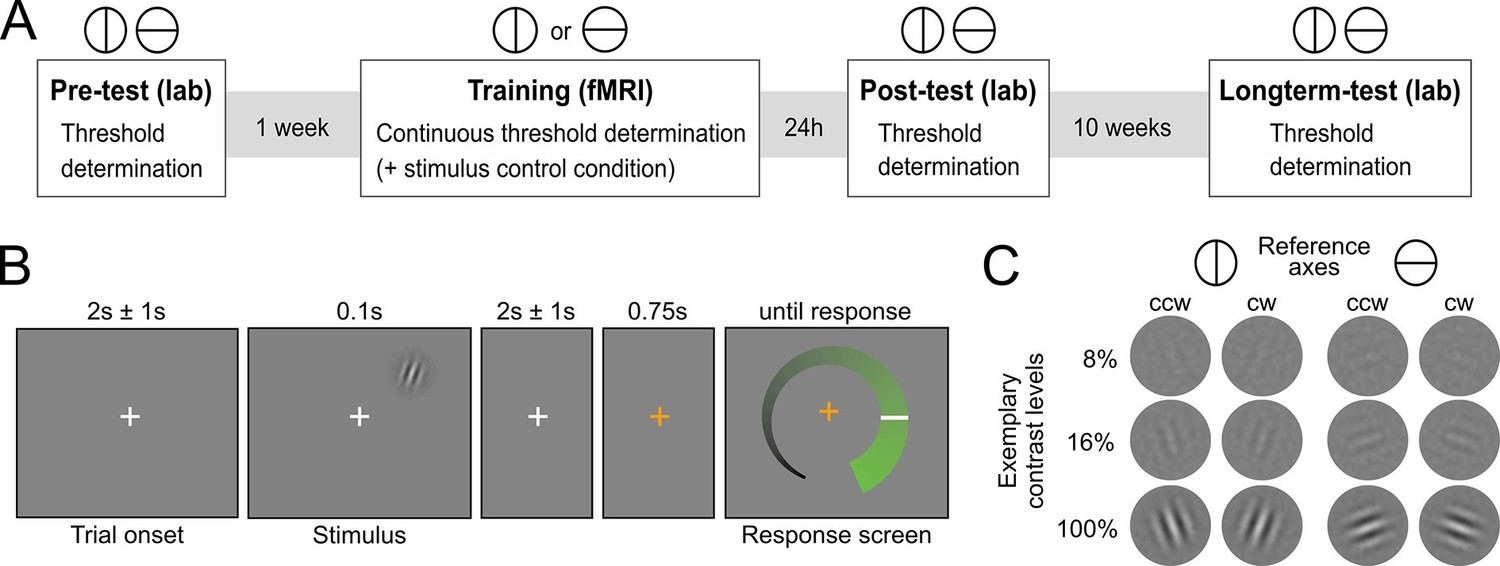
Experimental design.
(A) Overview over experimental sessions. The experiment consisted of one training session and three test sessions (pre-test, post-test and longterm-test). The test sessions included both reference axes and were used to determine the contrast threshold for a performance of 80.35 percent correct at different stages of the experiment. In the training session, only one reference axis was shown. Here too, a staircase procedure was used to continuously determine the contrast threshold for a performance level of 80.35%. In addition, the training session included a condition with constant contrast as a control for stimulus factors. (B) Procedure of an experimental trial. Participants were presented with Gabor stimuli, which were oriented either clockwise or counterclockwise with respect to a reference axis. In the unspeeded response phase participants indicated their level of confidence about the stimulus orientation on an analogue scale and subsequently made a binary orientation judgment. (C) Examples of the stimuli. Gabor patches were oriented 20° clockwise (cw) or 20° counterclockwise (ccw) relative to either the vertical or the horizontal reference axis. Three exemplary contrast levels are shown, where 8% corresponds to the participant average during training, 16% to the highest obtained thresholds and 100% to full contrast.
Figure 2 with 2 supplements

Behavioral results.
(A) Contrast thresholds across the runs of the training session and in the three test-sessions (pre/post/long-term). (B) Relationship between confidence ratings and performance during the training session. Percent correct responses were computed by means of a sliding window across sorted confidence values (window size: 5% of all trials).
Figure 2—figure supplement 1
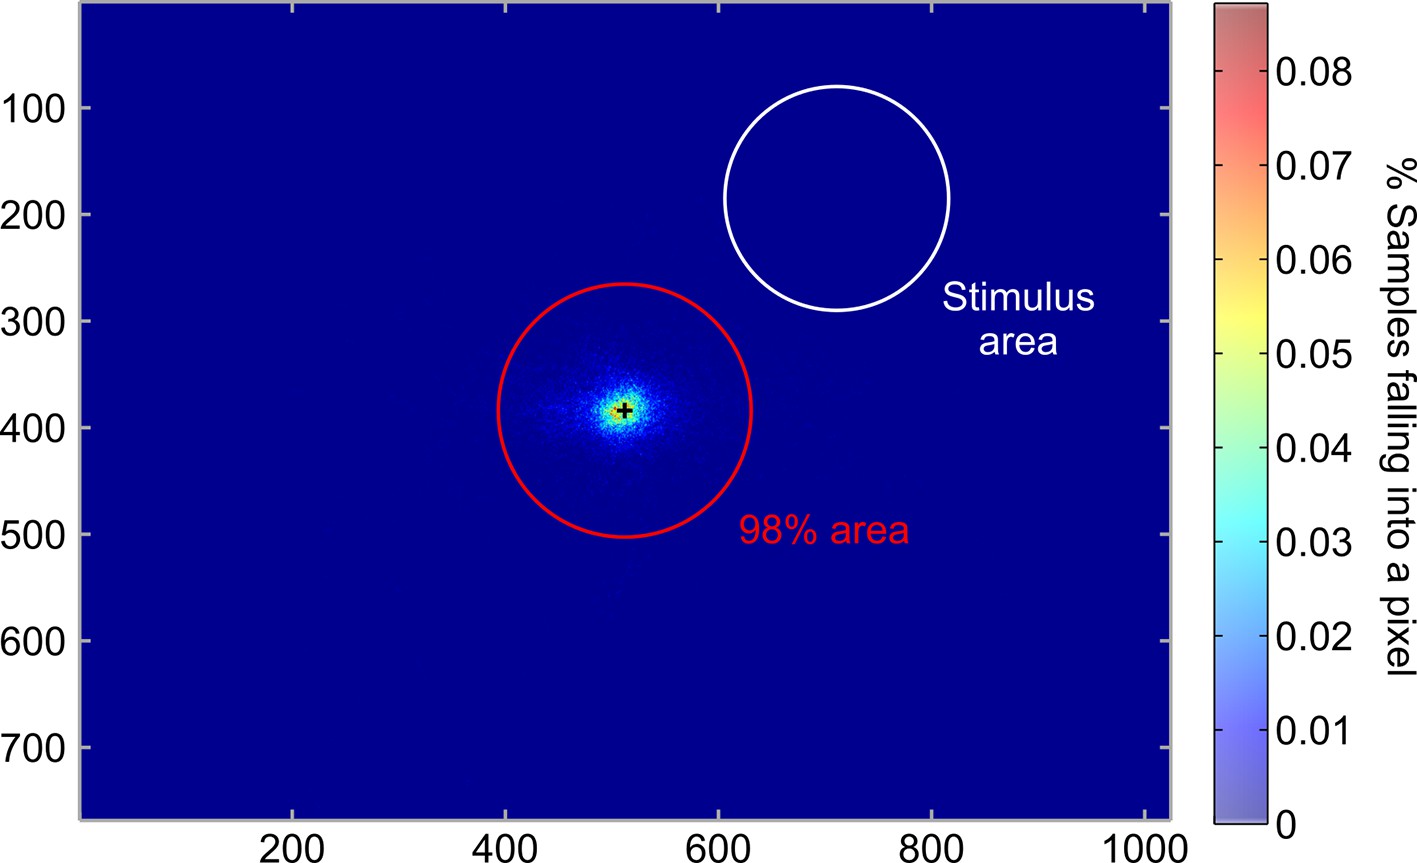
Eyetracking.
Heatmap indicating the percentage of eye gaze position at every pixel of the screen. The red circle indicates the area that contained 98% of all eye gaze positions and the white circle depicts the area covered by the Gabor patch. On average, 98.5 ± 0.6% of recorded eye gaze positions during the training session were within the fixation area (radius r = 2.5° of visual angle), demonstrating that the participants maintained fixation throughout the fMRI experiment. Please note, that one participant was excluded due to fixation failure (<95%) and i
Figure 2—figure supplement 2
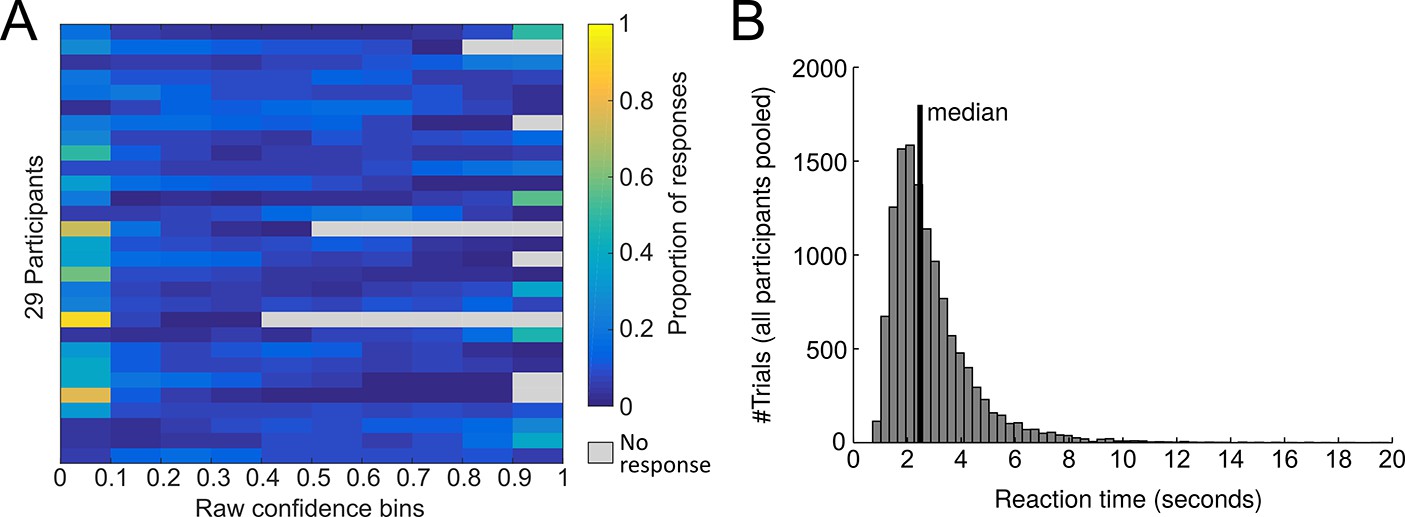
Confidence ratings.
(A) Distribution of confidence ratings at the single-subject level. (B) Distribution of the pooled response times of all participants. The median response time was 2.47 s. There was a modest negative relationship between reaction time and confidence (mean ± SE of individual z-transformed correlation coefficients: rPearson = −0.06 ± 0.02; one-sample t-test against Fisher z’ = 0: t28 = −3.3, p0.002). The correlation with choice accuracy was not significant (rPearson = −0.02 ± 0.01, t28 = −1.5, p=0.14).
Figure 3 with 1 supplement
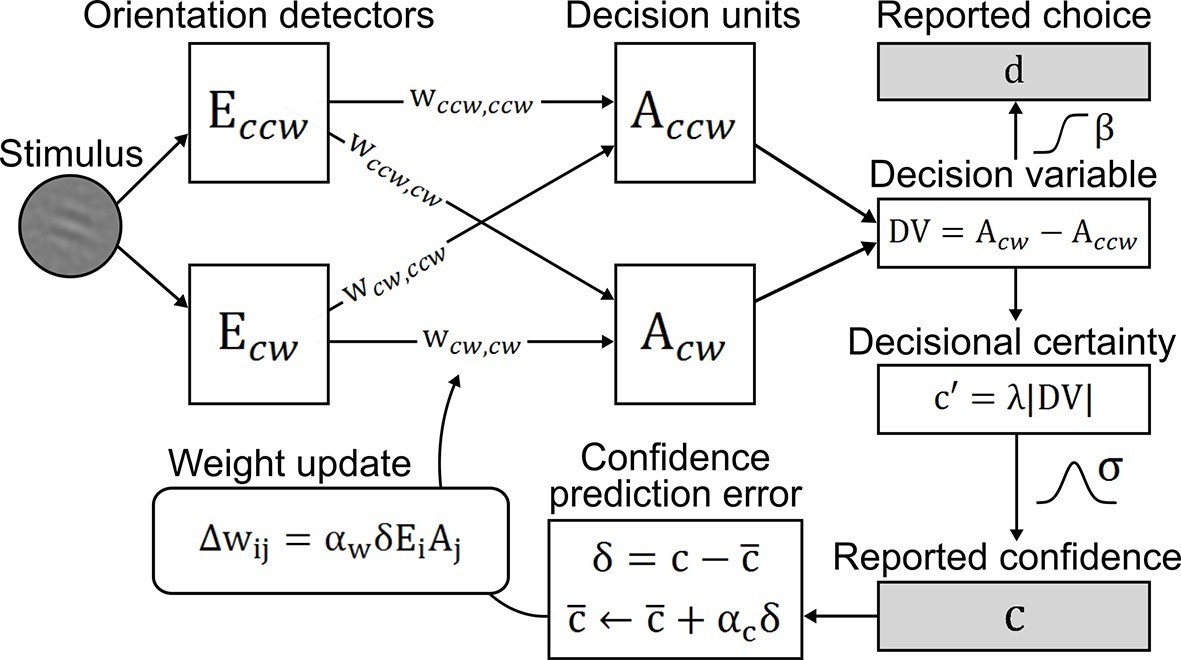
Confidence-based model of perceptual learning.
Counterclockwise (Ecw) and clockwise (Eccw) orientation energy detectors of a dedicated representational subsystem are connected via signal weights (horizontal) and noise weights (diagonal) to decision units (Accw, Acw). Reported choices (decisions) d are probabilistically modeled by a decision value DV = Accw− Acw and the reported confidence c is modeled through the absolute value of x. Weights are updated through an associative reinforcement learning update rule. The reinforcement component is based on a confidence prediction error δ, reflecting the difference between reported confidence and a weighted running average of previous confidence experiences (expected confidence ). The Hebbian component (Ei× Aj) ensures that the update more strongly affects those connections that contribute more to the final choice. Grey-shaded boxes indicate observed variables.
Figure 3—figure supplement 1

Exemplary time course of model variables and behavioral reports.
(A) Energy. Stimulus energy for clockwise (cw) and counterclockwise (ccw) orientation as computed by the representational subsystem. (B) Signal weights. Strength of weights connecting orientation detectors to decisional units of the same orientation. (C) Noise weights. Strength of weights connecting orientation detectors to decisional units of the opposing orientation. (D) Choices. Depicted are the model’s choice probability for clockwise choices and the subject’s actual choices (cw = 1, ccw = 0). Correct subject choices are marked by a circle. (E) Confidence. Confidence ratings predicted by the model (corresponding to λ∙|DV|) and subject’s actual confidence ratings. (F) Confidence prediction error and expected confidence. Depicted are the hidden model variables for the confidence prediction error (CPE) and expected confidence (EC).
Figure 4 with 3 supplements
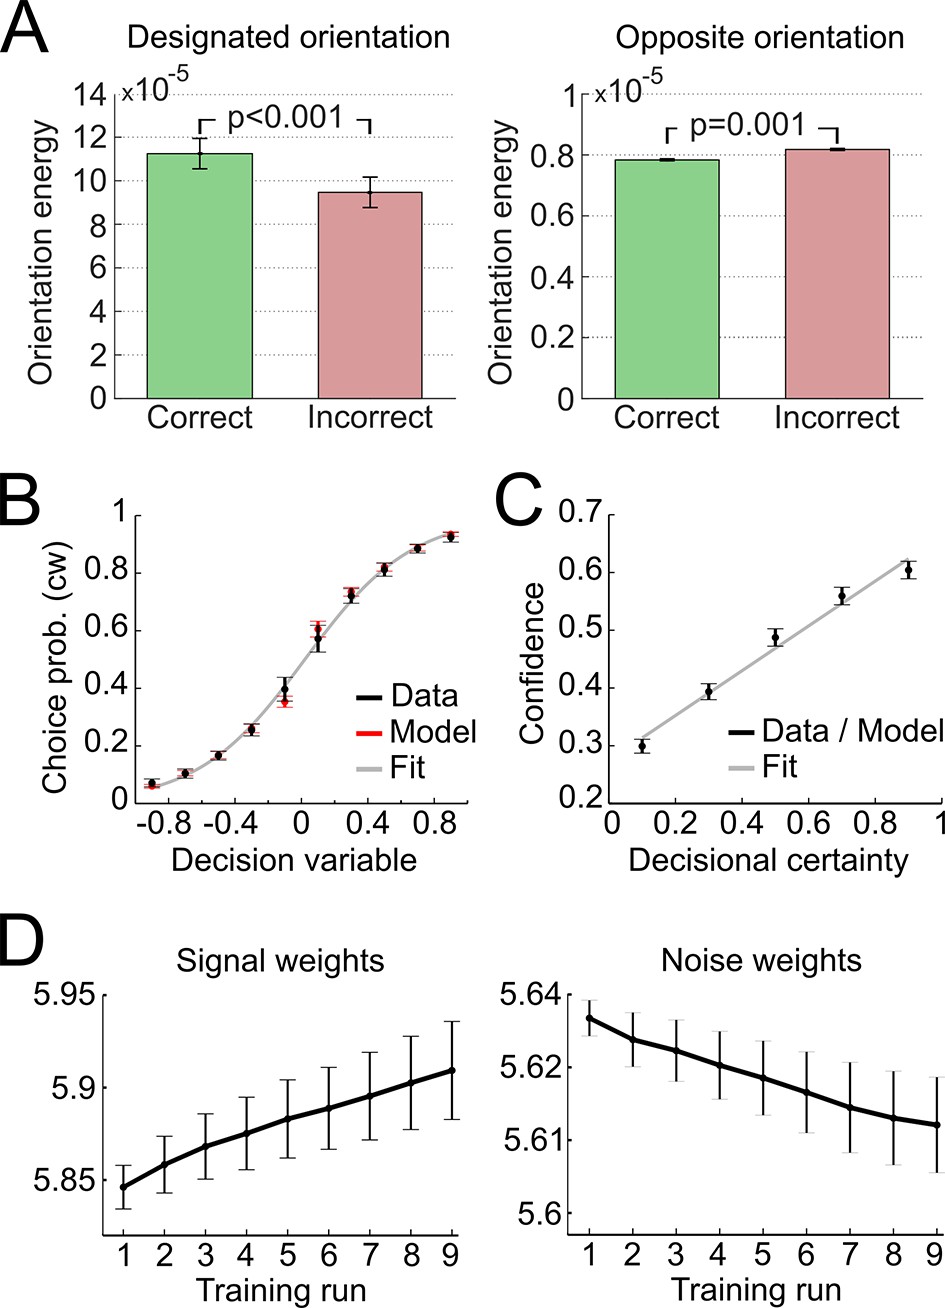
Modeling results.
(A) Orientation energy computed by the model’s representational subsystem. The energy is depicted separately for correct and incorrect responses as well as for designated and opposing orientations. (B) Binned choice probabilities (clockwise) for observed data (black) and model predictions (red) as a function of the model-derived DV (gry: logistic fit to data). (C) Correspondence between participants’ binned confidence ratings and model-based decisional certainty (grey: linear fit). (D) Change of signal and noise weights across training runs. All error bars denote SEM corrected for between-subject variance (Cousineau, 2005).
Figure 4—figure supplement 1

Validation of the representational subsystem.
Depicted is the stimulus energy for spatial frequencies (Gabor frequency, ± 1 octave) and orientations around the spatial frequency (1.25 cycles/degree) and orientations (−20°/20° and 70°/110°) of the experimental Gabor stimuli, respectively. As expected, the energy content is higher for the spatial frequency and orientations used to generate the Gabor patches relative to other frequencies and orientations, thereby validating the computed orientation energies. Error bars represent SEM.
Figure 4—figure supplement 2
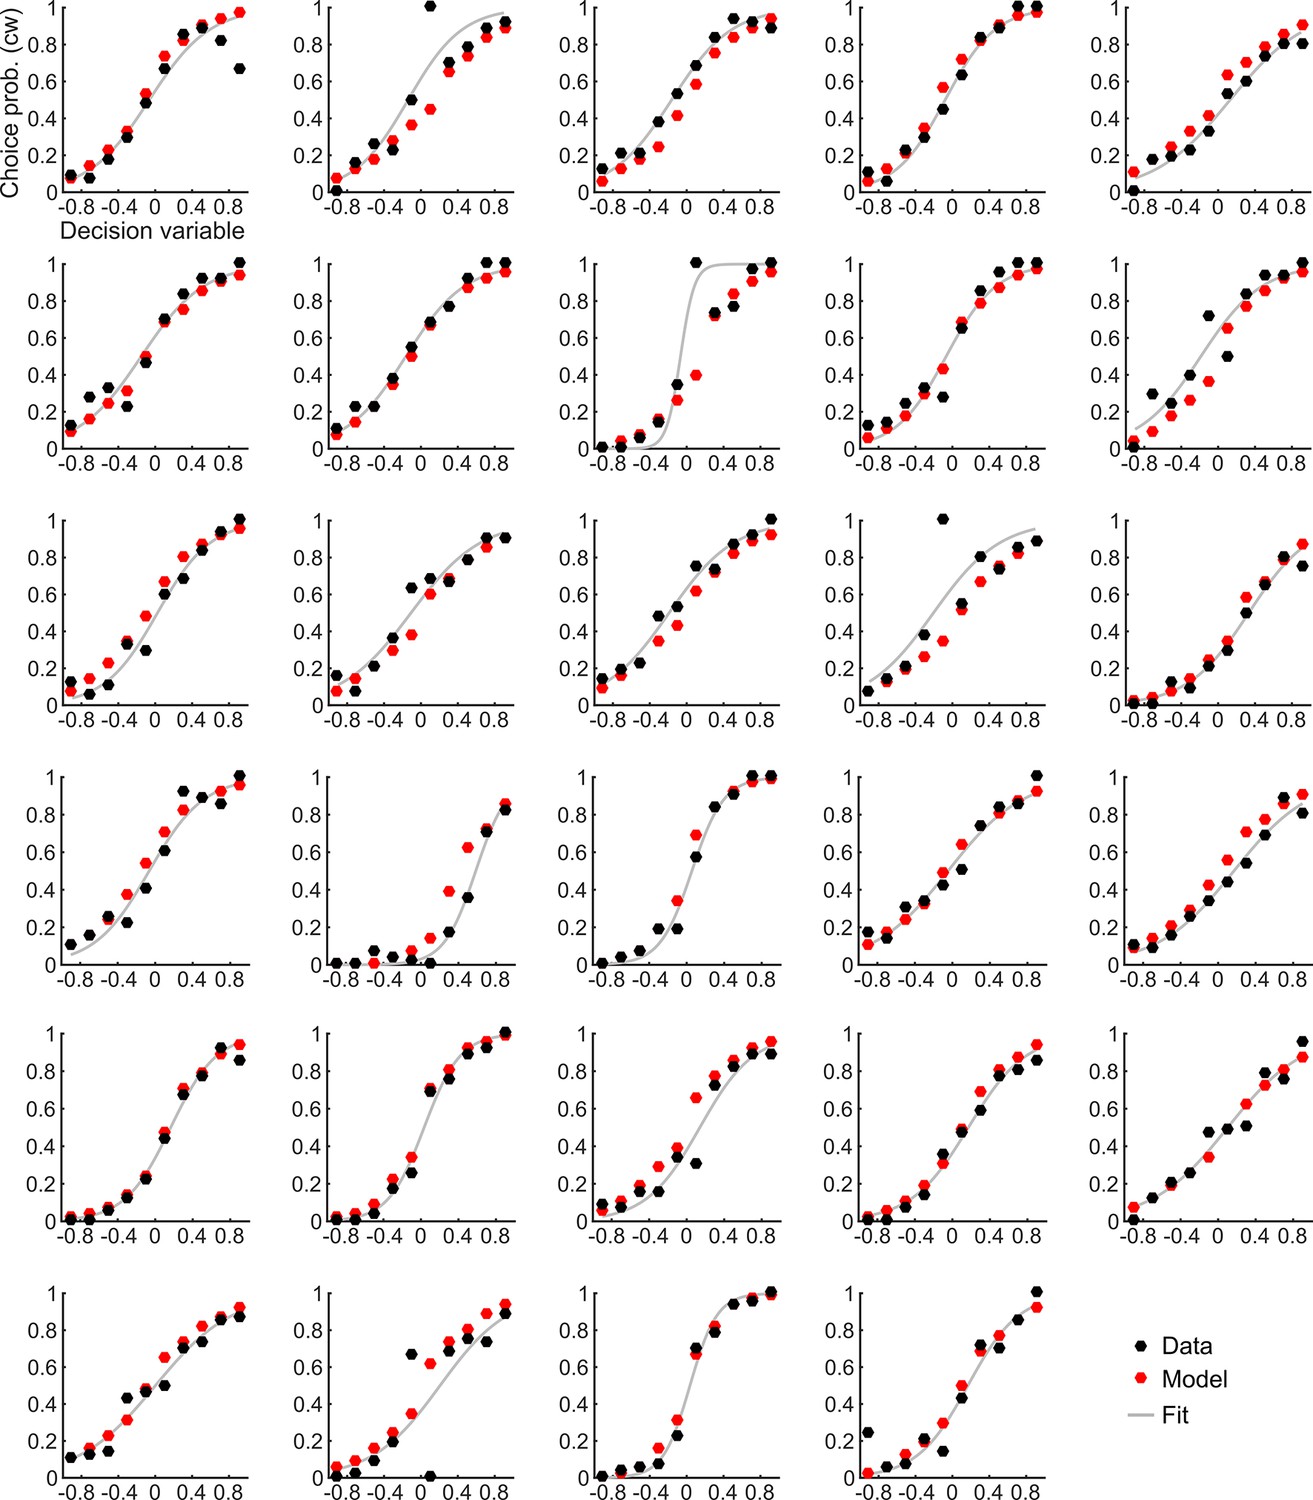
Choice probabilities and the corresponding model prediction for individual participants.
https://doi.org/10.7554/eLife.13388.011
Figure 4—figure supplement 3
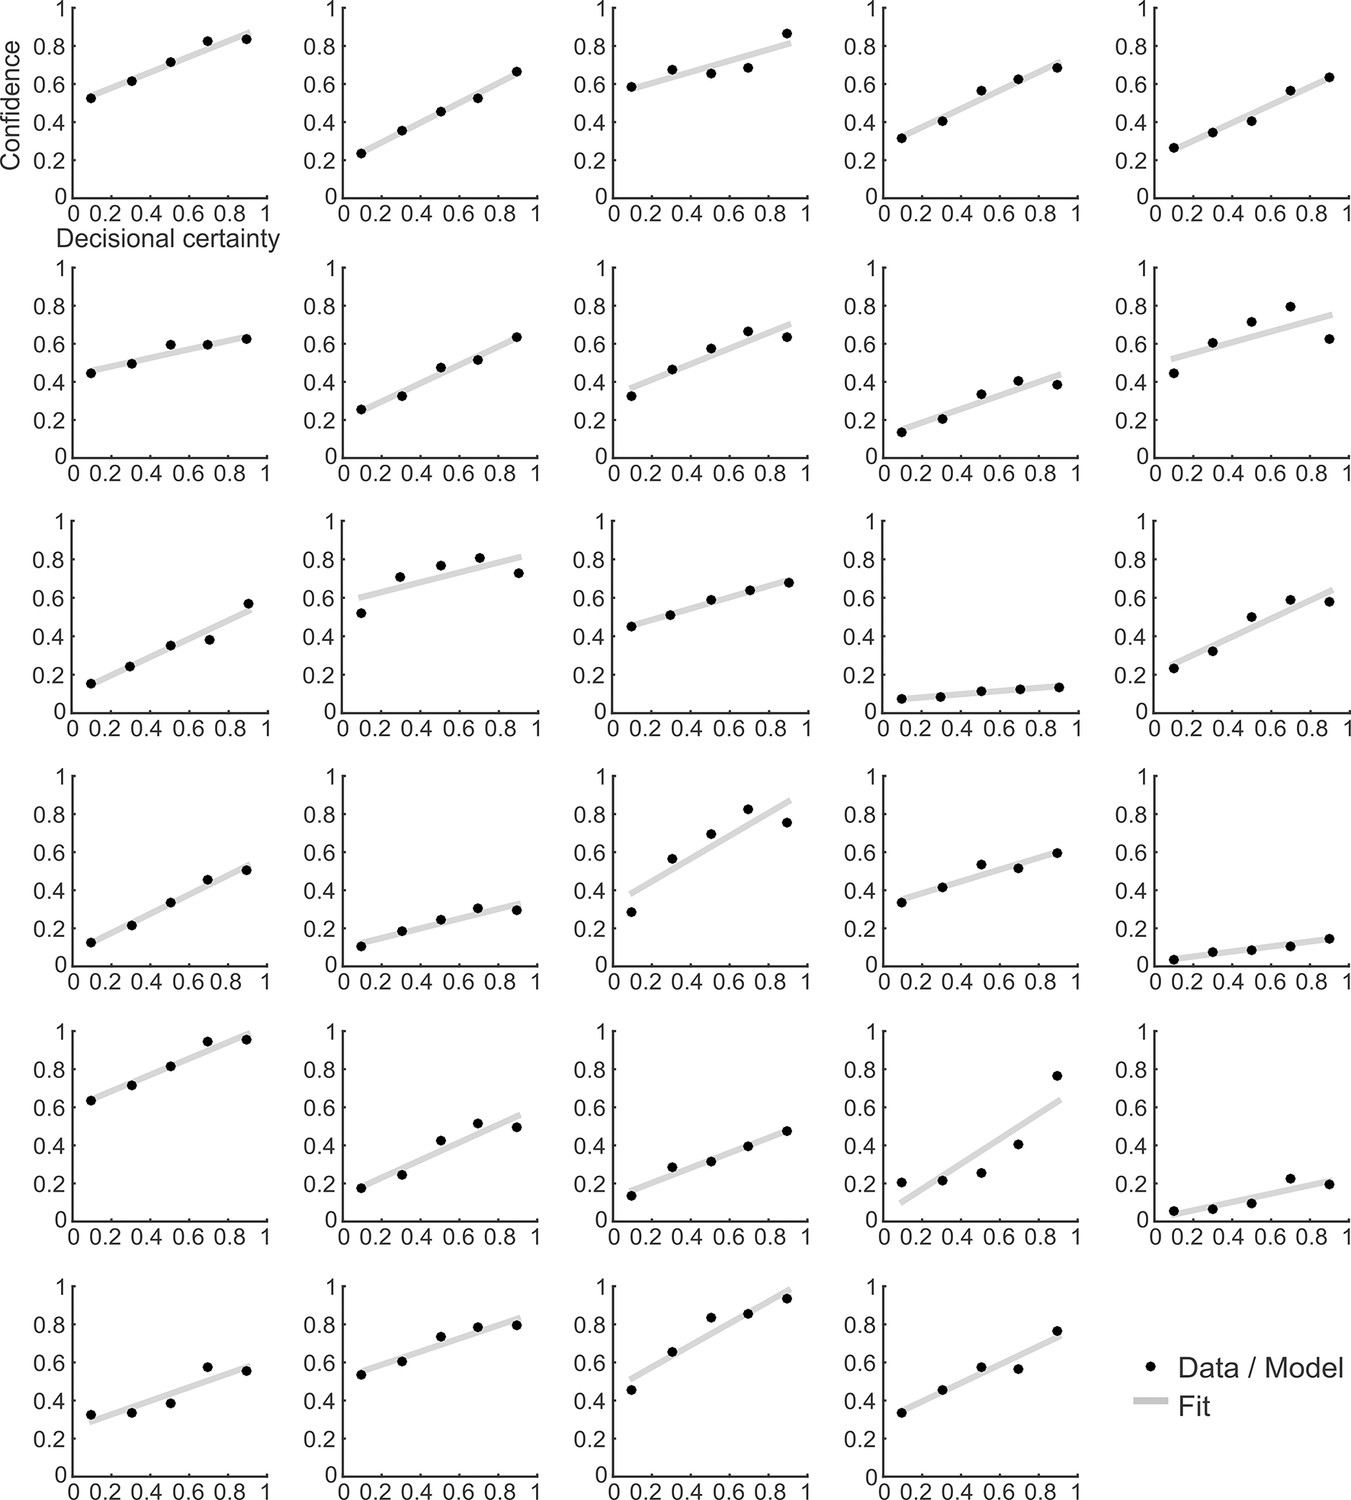
Confidence ratings and the corresponding model prediction for individual participants.
https://doi.org/10.7554/eLife.13388.012
Figure 5 with 1 supplement
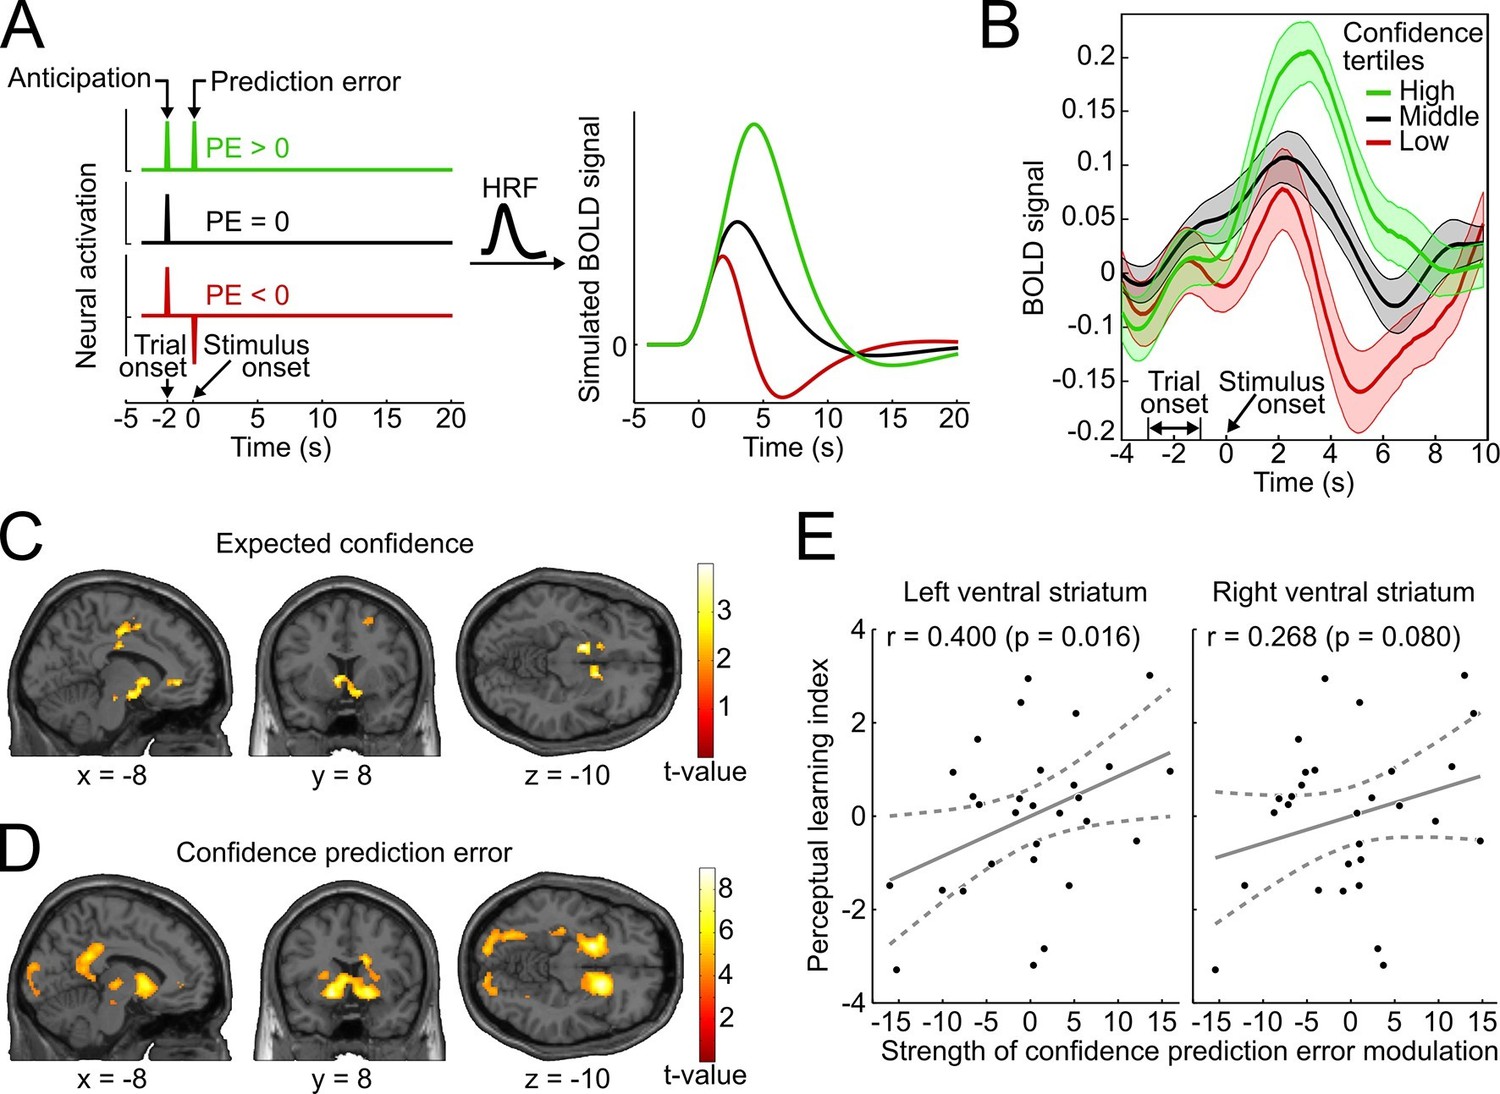
Confidence signals in the mesolimbic system and their relation to perceptual learning.
(A) Neural activation time courses consisting of an anticipatory peak at trial onset and a positive, absent, or negative reward prediction error (PE) during outcome (stimulus onset). To simulate the associated BOLD response, the time courses were convolved with the standard canonical hemodynamic response function provided by SPM. (B) Event-related BOLD time courses in the ventral striatum for three tertiles of the behavioral confidence reports (representing 'low', 'middle' and 'high' confidence trials). The shaded areas denote SEM. (C, D) Whole-brain t-maps showing brain regions with a positive relationship between BOLD signal and expected confidence at trial onset (C), and between BOLD signal and CPE at stimulus onset (D). The t-maps were thresholded at p<0.005 (C) and p<0.001 (D), uncorrected, for illustration purposes. (E) Scatter plot for the relation between the strength of striatal modulation by confidence prediction errors (peak values, after age correction) and individual perceptual learning success.
Figure 5—figure supplement 1

Control analyses accounting for effects of absolute orientation energy.
The GLM of the model-based analysis was extended with a second parametric regressor for absolute orientation energy (i.e., energy for the presented orientation) in a way that any variance shared between the energy and the CPE regressor would be accounted for by the energy regressor. (A) Whole-brain t-map for a positive relationship between BOLD signal and confidence prediction error (CPE), after accounting for absolute orientation energy (threshold: p < 0.001, uncorrected). Even after this correction for stimulus energy, a strong positive relationship in bilateral ventral striatum (left: peak at [−16 8 −10], t28 = 7.34, prFWE < 0.001; right: peak at [14 14 −6], t28 = 7.53, prFWE < 0.001) and in the ventral tegmental area (peak at [−6 −22 −16], t28 = 2.98, prFWE = 0.028) was present. (B) The converse model, in which variance was first accounted for by the CPE regressor and second by the energy regressor, showed no residual activation in the mesolimbic ROIs (even at a liberal threshold of p < 0.05, uncorrected). The strongest trends for a modulation by stimulus energy on top of CPEs was present in voxels located within our stimulus localizer ROI (left occipital cortex: peak at [−42 −74 −8], t28 = 2.85, p = 0.004, uncorrected; left posterior fusiform gyrus: peak at [−32 −56 −12], t28 = 2.60, p = 0.007, uncorrected). Interestingly, the modulation of activity in putative V1 by CPEs (cf. Supplementary file 2) appears to be entirely accounted for by CPEs, as no significant modulation by energy was detectable in this analysis (p > 0.05, uncorrected). (C) Whole-brain t-map for a positive relationship between BOLD signal and energy, without correcting for CPE. No cluster survived correction for multiple comparisons at the whole-brain level. The strongest activation was found in right dorsolateral prefrontal cortex (peak at [32, 38, 18], t28 = 5.24, p = 0.000007, uncorrected). A second notable activation was found in our stimulus localizer ROI (left fusiform gyrus: peak at [−32, −56, −12], t28 = 3.89, p = 0.0003, uncorrected).
Figure 6

The neural basis of perceptual and decisional model variables.
(A) Model-derived signed orientation energy (OE). The panel shows the t-map for multivariate decoding of OE. Red outlines indicate areas generally responding to the stimulus as measured with the independent stimulus localizer (t-contrast: stimulus > baseline). (B) Model-derived decision value (DV). T-map for multivariate decoding of the model-derived DV. All t-maps are thresholded at p < 0.005, for illustration.
Additional files
-
Supplementary file 1
Model parameters.
- https://doi.org/10.7554/eLife.13388.016
-
Supplementary file 2
List of active brain regions in the model-based fMRI analysis of confidence prediction errors (CPEs).
- https://doi.org/10.7554/eLife.13388.017
Download links
A two-part list of links to download the article, or parts of the article, in various formats.
Downloads (link to download the article as PDF)
Open citations (links to open the citations from this article in various online reference manager services)
Cite this article (links to download the citations from this article in formats compatible with various reference manager tools)
Mesolimbic confidence signals guide perceptual learning in the absence of external feedback
eLife 5:e13388.
https://doi.org/10.7554/eLife.13388


