Kinetics of initiating polypeptide elongation in an IRES-dependent system
- University of Pennsylvania, United States
Figures
Figure 1 with 1 supplement
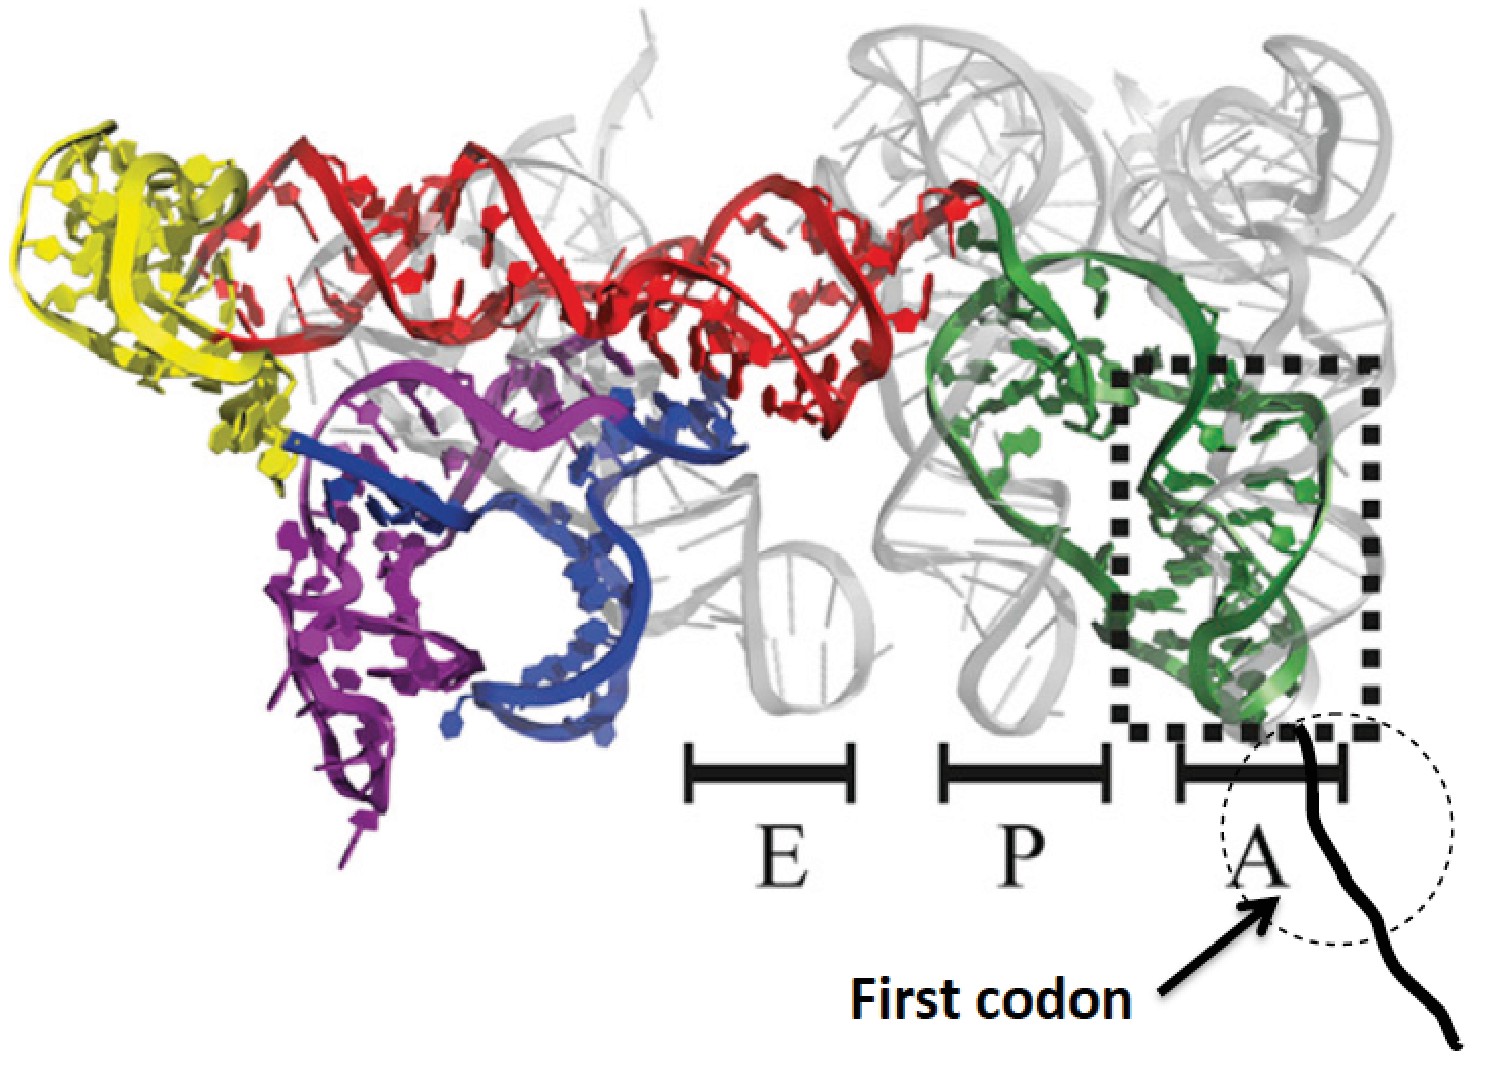
Structure of CrPV-IRES bound to the 80S ribosome superposed on A, P, and E tRNA binding sites.
The position of the first codon is indicated. Adapted from Fernandez et al. (2014).
Figure 1—figure supplement 1
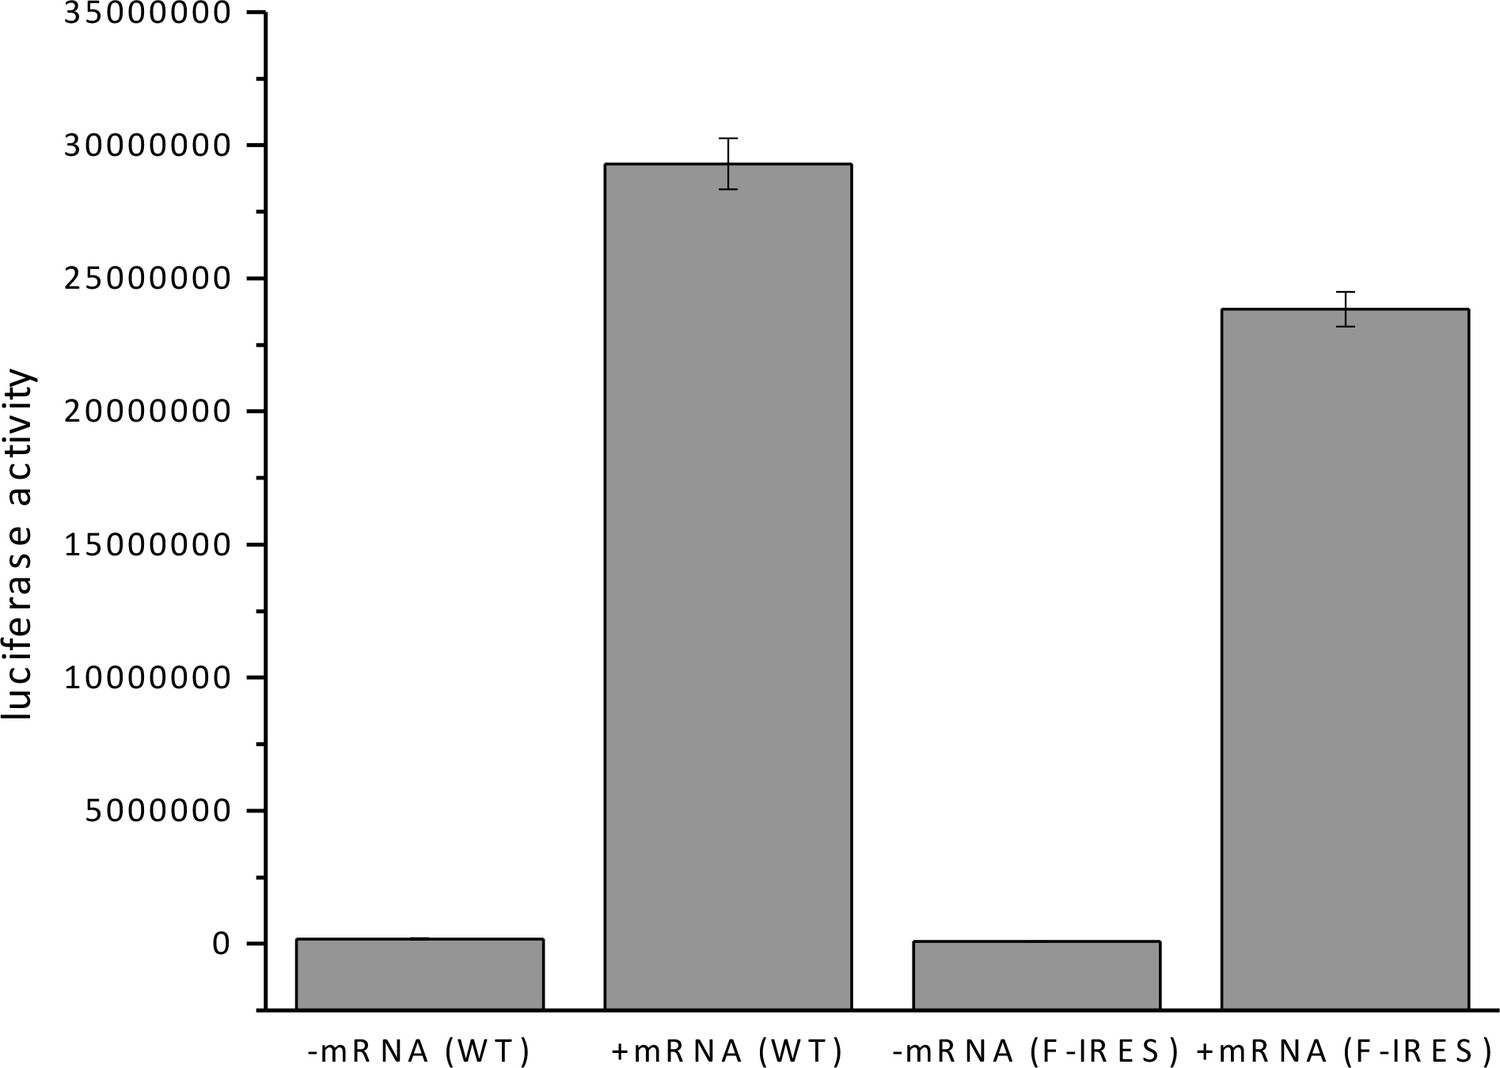
In vitro translation of firefly luciferase with WT and mutated F-IRES mRNA.
https://doi.org/10.7554/eLife.13429.004
Figure 2
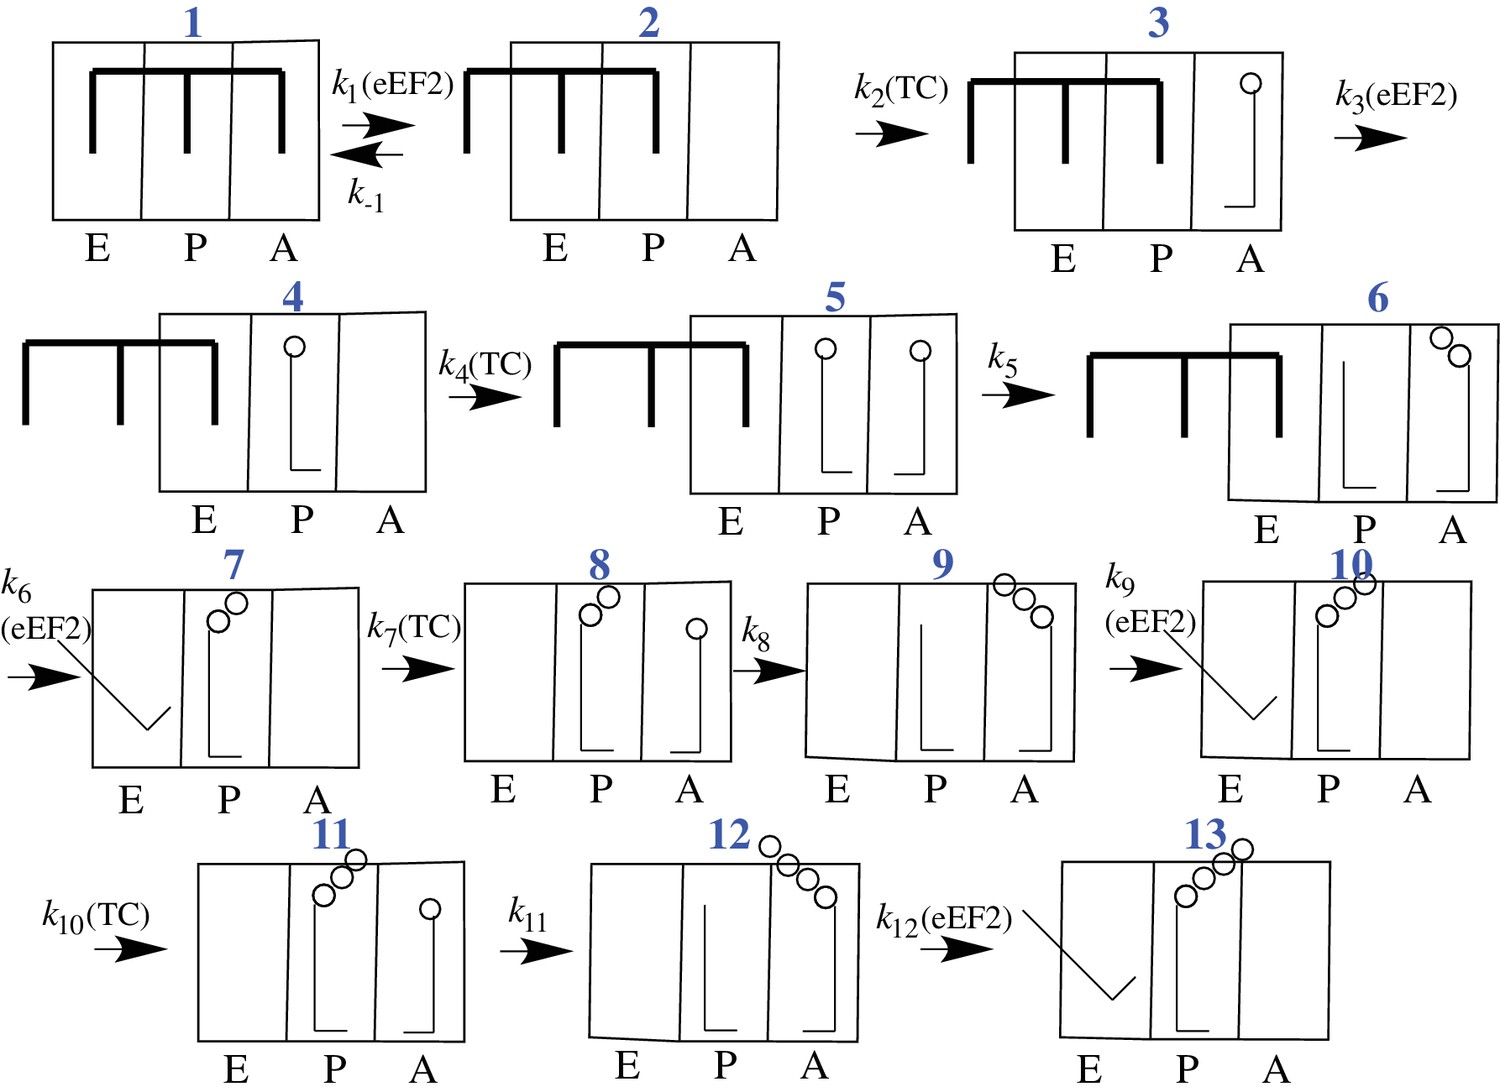
Proposed scheme for initial tetrapeptide synthesis on CrPV IRES-programmed ribosomes.
This simplified scheme neglects the several substeps, including GTP hydrolysis, Pi release, and elongation factor release, that accompany both productive binding of ternary complex to the ribosome (Steps 2, 4, 7, 10) and tRNA translocation (Steps 3, 6, 9, 12).
Figure 3 with 2 supplements
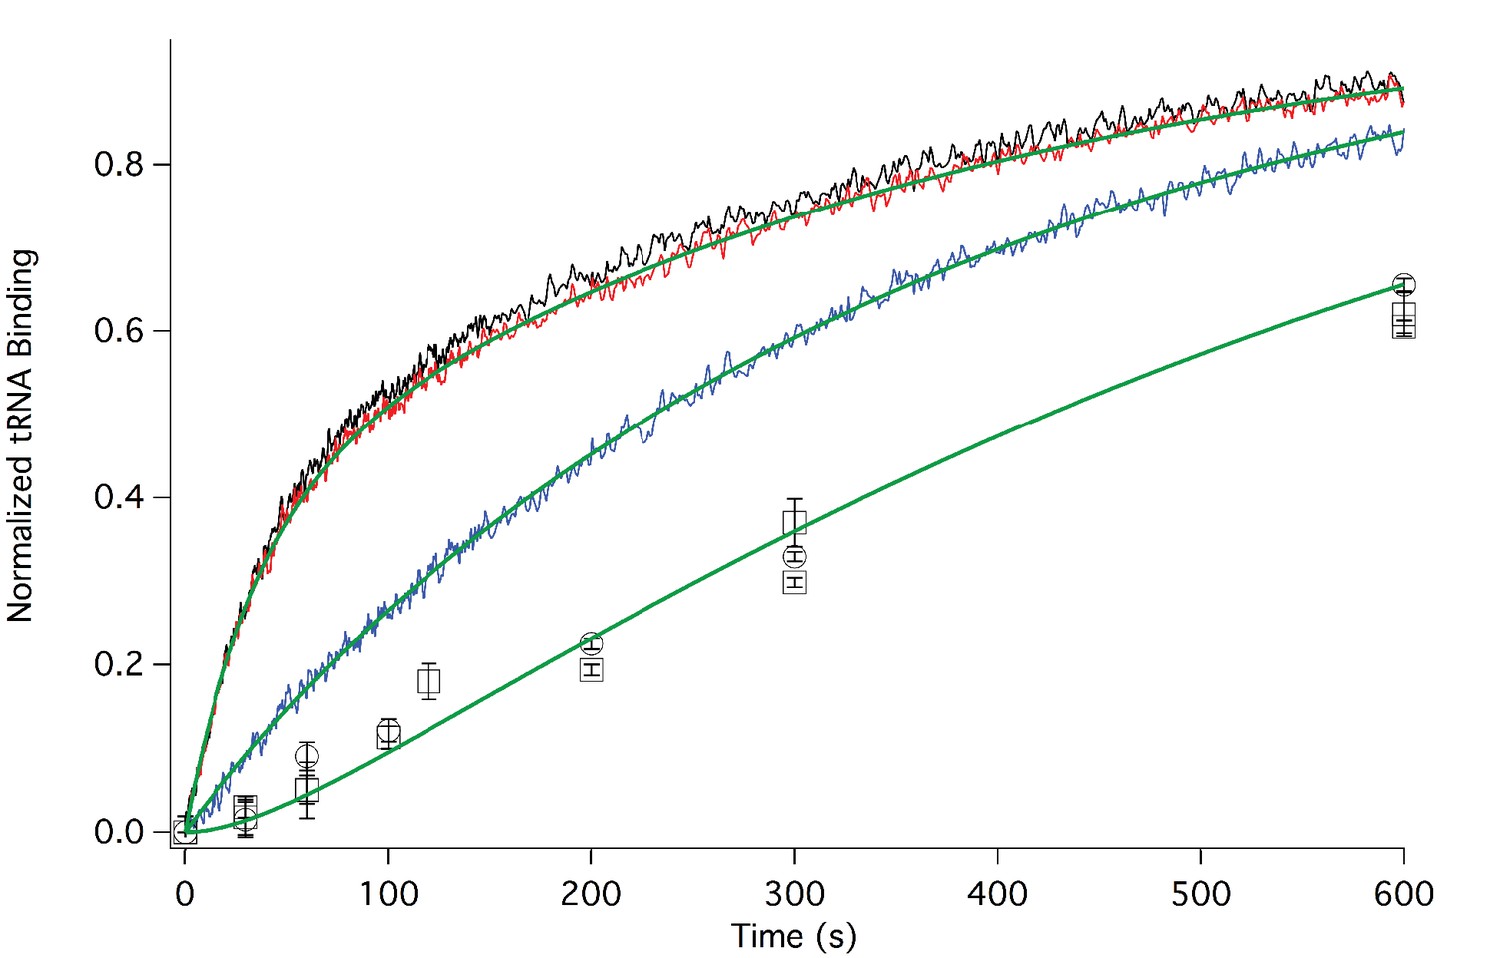
Rates of initial Phe-tRNAPhe binding measured by fluorescence anisotropy or Phe-tRNAPhe cosedimentation.
Fluorescence anisotropy changes were monitored after rapid mixing of Phe-tRNAPhe (Prf) ternary complex (0.1 µM final concentration, containing 1 mM GTP)with 80S·FVKM-IRES complex (0.1 µM final concentration) either in the absence of eEF2 (blue line) or with 80S·FVKM-IRES complex that was pre-incubated with either 3 µM (black line) or 1 µM eEF2·GTP (red line) for 1–2 hr. These long times ensured full equilibration prior to TC addition. In the latter cases, eEF2 concentration was kept constant by including 3 µM or 1 µM eEF2, respectively, in the TC solution. eEF2 displays virtually no GTPase activity when it is not bound to the ribosome (Nygård and Nilsson, 1989). Rates of Phe-tRNAPhe binding to the P site, as determined by cosedimentation, were measured by rapidly mixing Phe-TC (1.6 µM final concentration) with 80S·FVKM-IRES complex (0.8 µM final concentration) pre-incubated for 5’ – 60’ in the presence (1 µM) (□) or absence of eEF2·GTP (○). In both cases, eEF2 final concentration after mixing was adjusted to 1 µM, by including 1 µM or 2 µM eEF2·GTP, respectively, in the TC solution. After quenching with 0.5 M MES buffer (pH 6.0), ribosome bound Phe-tRNAPhe was measured by cosedimentation. In the preincubation experiment, three-fold increases of both eEF2·GTP and Phe-TC concentrations, or of just eEF2·GTP concentration, had little effect on the cosedimentation results. Results in this Figure are corrected for IRES-independent changes in fluorescence anisotropy or Phe-tRNAPhe cosedimentation (Figure 3—figure supplements 1,2). All three solid green lines are best fits of the results obtained to the scheme in Figure 2, using the numerical integration program Scientist.
Figure 3—figure supplement 1

Corrected IRES-dependent time courses for initial Phe-tRNAPhe binding as measured by fluorescence anisotropy.
Experiments were carried out as described in Figure 3, but in the presence or absence of added IRES. Fluorescence anisotropy changes were monitored after rapid mixing of Phe-tRNAPhe(Prf) ternary complex (0.1 µM final concentration) with either 80S·FVKM-IRES complex (0.1 µM final concentration) or just 80S (0.1 µM final concentration). These experiments were carried out either in the absence of eEF2 (80S·FVKM-IRES complex, dotted blue line; 80S, dotted purple line) or with 0.5–2.5 hr preincubation with eEF2 [80S·FVKM-IRES complex, dotted red line, 1 μM eEF2; dotted black line, 3 μM eEF2; 80S, 1 μM eEF2, dotted green line). In the latter cases, eEF2 concentration was kept constant by including 1 or 3 µM eEF2 in the TC solution. Subtraction of the results obtained with 80S alone from the results obtained with 80S·FVKM-IRES complex yields the corrected time courses for IRES-dependent fluorescence anisotropy change with eEF2 preincubation (solid red (1 μM) and black (3 μM) lines) or in the absence of eEF2 (solid blue line). These solid lines are presented in Figure 3.
Figure 3—figure supplement 2
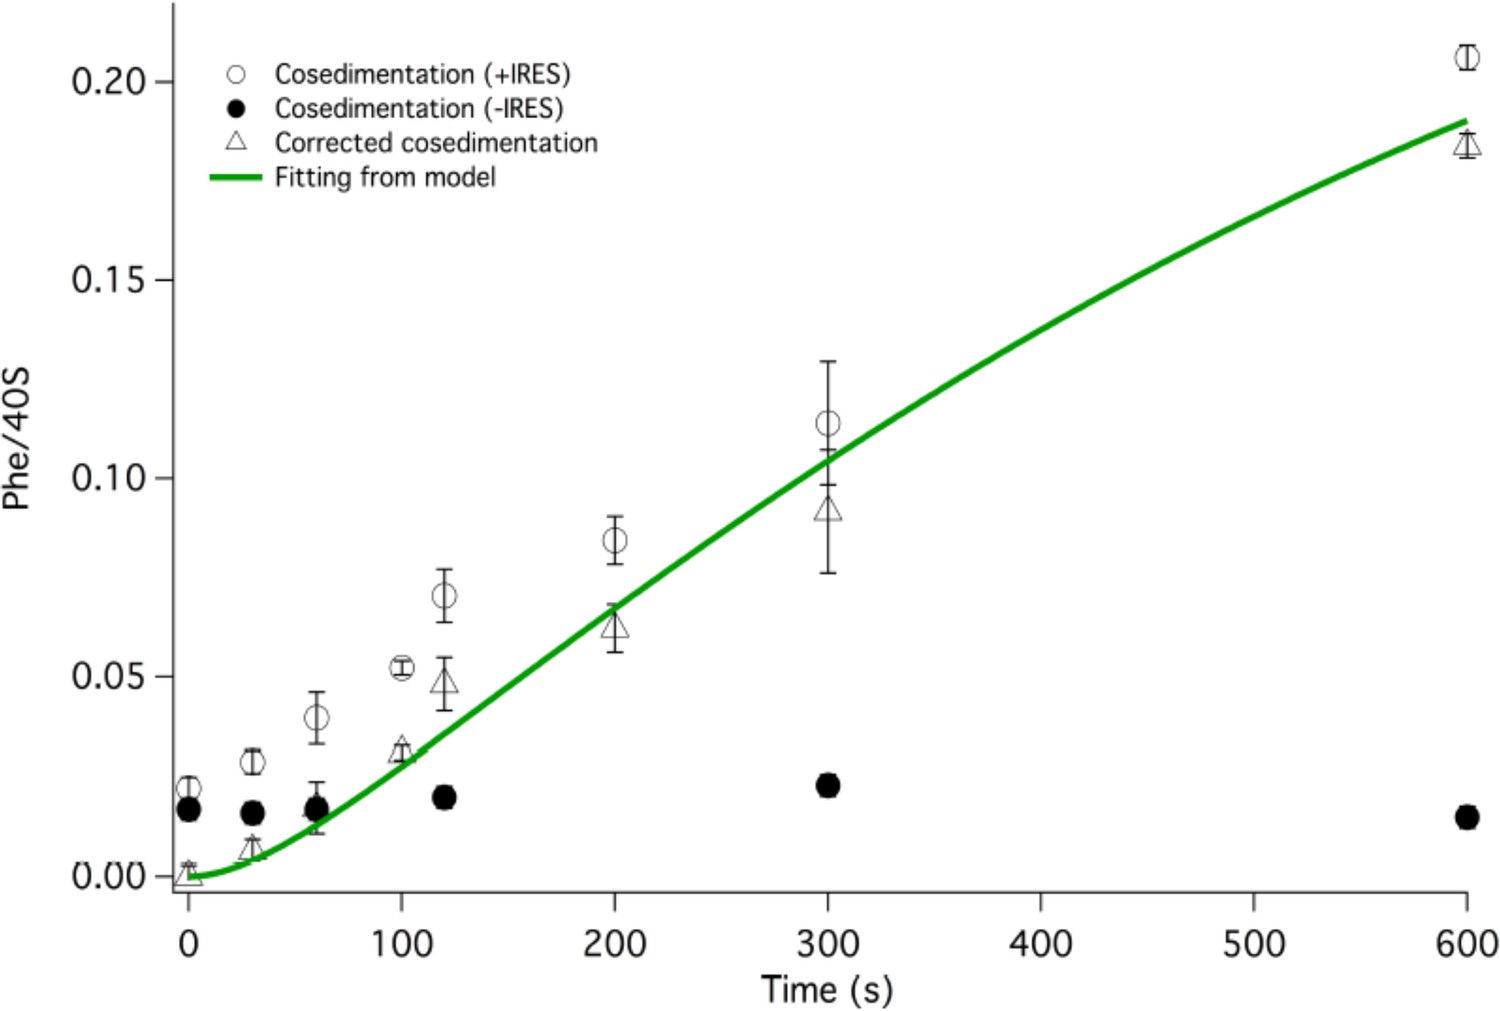
Corrected IRES-dependent time courses for initial Phe-tRNAPhe binding as measured by Phe-tRNAPhe cosedimentation.
Phe-TC (1.6 µM final concentration) was rapidly mixed with either 80S·FVKM-IRES complex (0.8 µM final concentration) or just 80S (0.8 µM final concentration). These experiments were carried out either in the absence of preincubation with eEF2 or with 5–60 min preincubation with 1 µM eEF2. In both cases, eEF2 final concentration after mixing was adjusted to 1 µM by adding the appropriate amounts to the TC solution. After quenching with 0.5 M MES buffer (pH 6.0), ribosome bound Phe-tRNAPhe was measured by cosedimentation. As preincubation with eEF2 gave no significant difference on either IRES-dependent or IRES-independent Phe-tRNAPhe cosedimentation, the results with and without eEF2 preincubation were averaged. Subtraction of the averaged results obtained with 80S alone (l) from the averaged results obtained with 80S·FVKM-IRES complex (O) yields the corrected time course for IRES-dependent Phe-tRNAPhe cosedimentation (Δ). The corrected results and solid line which is a best fit of the results obtained to the scheme in Figure 2, using the numerical integration program Scientist, are presented in Figure 3. The final corrected stoichiometry was 0.29 Phe/40S.
Figure 4 with 2 supplements
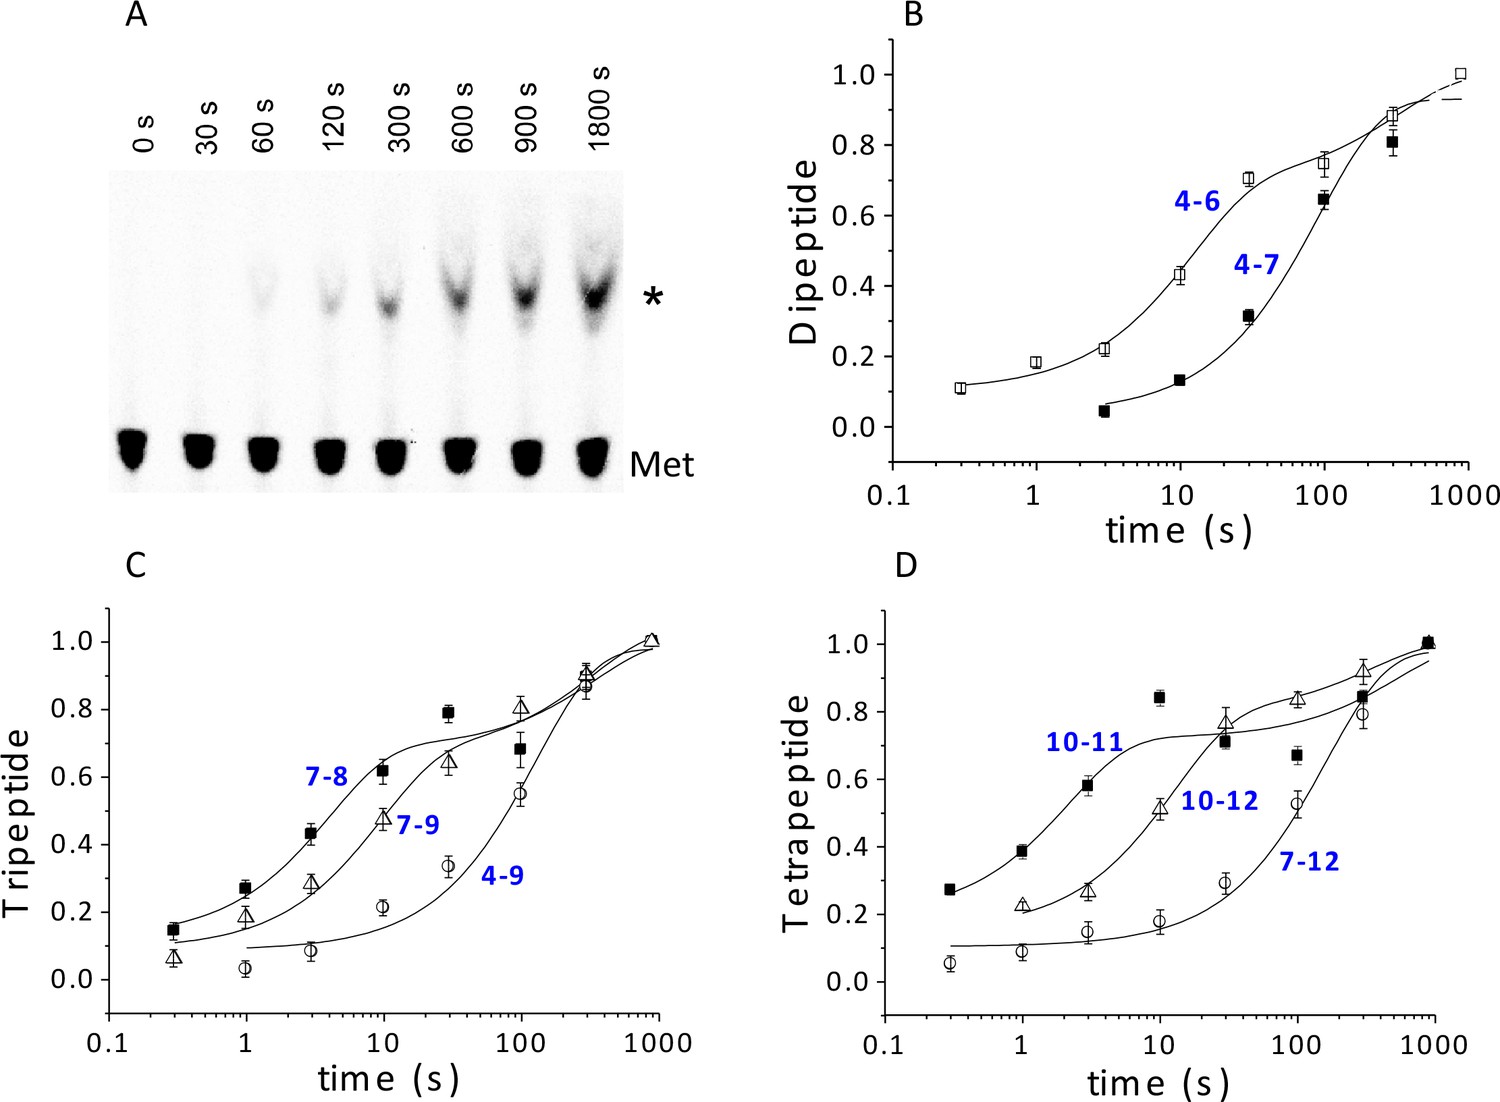
Kinetics of peptide synthesis and Met-tRNAMet cosedimenting with ribosomes.
Reaction mixtures were quenched at various times after mixing. Peptide synthesis aliquots were quenched with 0.8 M KOH, and the released [35S]-containing peptide was resolved and quantified by TLE and autoradiography (Materials and methods). Cosedimentation assay aliquots were quenched with with 0.5 M MES buffer (pH 6.0) and [35S] cosedimenting with ribosomes was determined. For all the reactions shown, final concentrations of reactants after mixing were: 80S·IRES complexes (0.8 μM); all added TCs (1.6 µM); eEF2·GTP (1 µM). The numbers in blue in parts (B–D) refer to the Structures in Figure 2 whose rates of conversion are measured. For example, the peptide synthesis result in part (B) labeled 4 – 6 measures conversion of Structure 4 to Structure 6. (A) Time course for formation of PheValLysMet tetrapeptide as determined by TLE. 80S·FVKM-IRES complex was mixed with Phe-TC, Val-TC, Lys-TC and [35S]-Met-TC. The migration positions of [35S]-Met and [35S]-PheValLysMet (*) are indicated. (B) 80S·FM-IRES complexes with Phe-tRNAPhe at the P site were mixed with [35S]-Met-TC. Dipeptide synthesis (□); cosedimentation assay (■). (C) Tripeptide synthesis: 80S·FKM-IRES complexes with either Phe-tRNAPhe (O) in the P site (Structure 4) or PheLys-tRNALys (Δ) in the P site (Structure 7) were mixed with either Lys-TC and [35S]-Met-TC or with just [35S]-Met-TC, respectively. Cosedimentation assay: 80S·FKM-IRES complex with PheLys-tRNALys in the P site was mixed with [35S]-Met-TC (■). (D) Tetrapeptide synthesis: 80S·FVKM-IRES complexes with either PheVal-tRNAVal (O) in the P site (Structure 7) or PheValLys-tRNALys (Δ) in the P site (Structure 10) were mixed with either Lys-TC and [35S]-Met-TC or with just [35S]-Met-TC, respectively. Cosedimentation assay: 80S·FKM-IRES complex with PheValLys-tRNALys in the P site was mixed with [35S]-Met-TC (■). Solid lines are best fits using single (B, 4–7; C, 4–9; D, 7–12) or double (B, 4–6; C, 7–8, 7–9; D, 10–11, 10–12) exponentials.
Figure 4—figure supplement 1
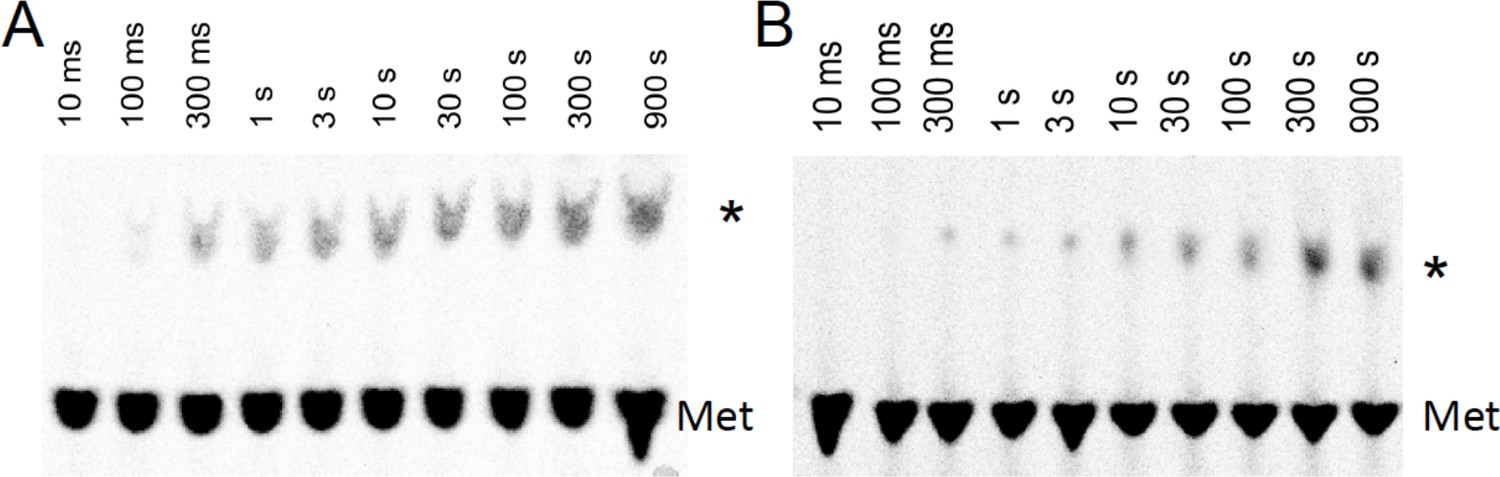
Time courses for formation of PheMet dipeptide and PheLysMet tripeptide as determined by TLE.
(A) Dipeptide synthesis: 80S·FM-IRES complex with Phe-tRNAPhe in the P site was mixed with [35S]-Met-TC. (B) Tripeptide synthesis: 80S·FKM-IRES complex with Phe-Lys-tRNALys (Δ) in the P site was mixed with [35S]-Met-TC. The migration positions of [35S]-Met and [35S]-labeled peptides (*) are indicated.
Figure 4—figure supplement 2
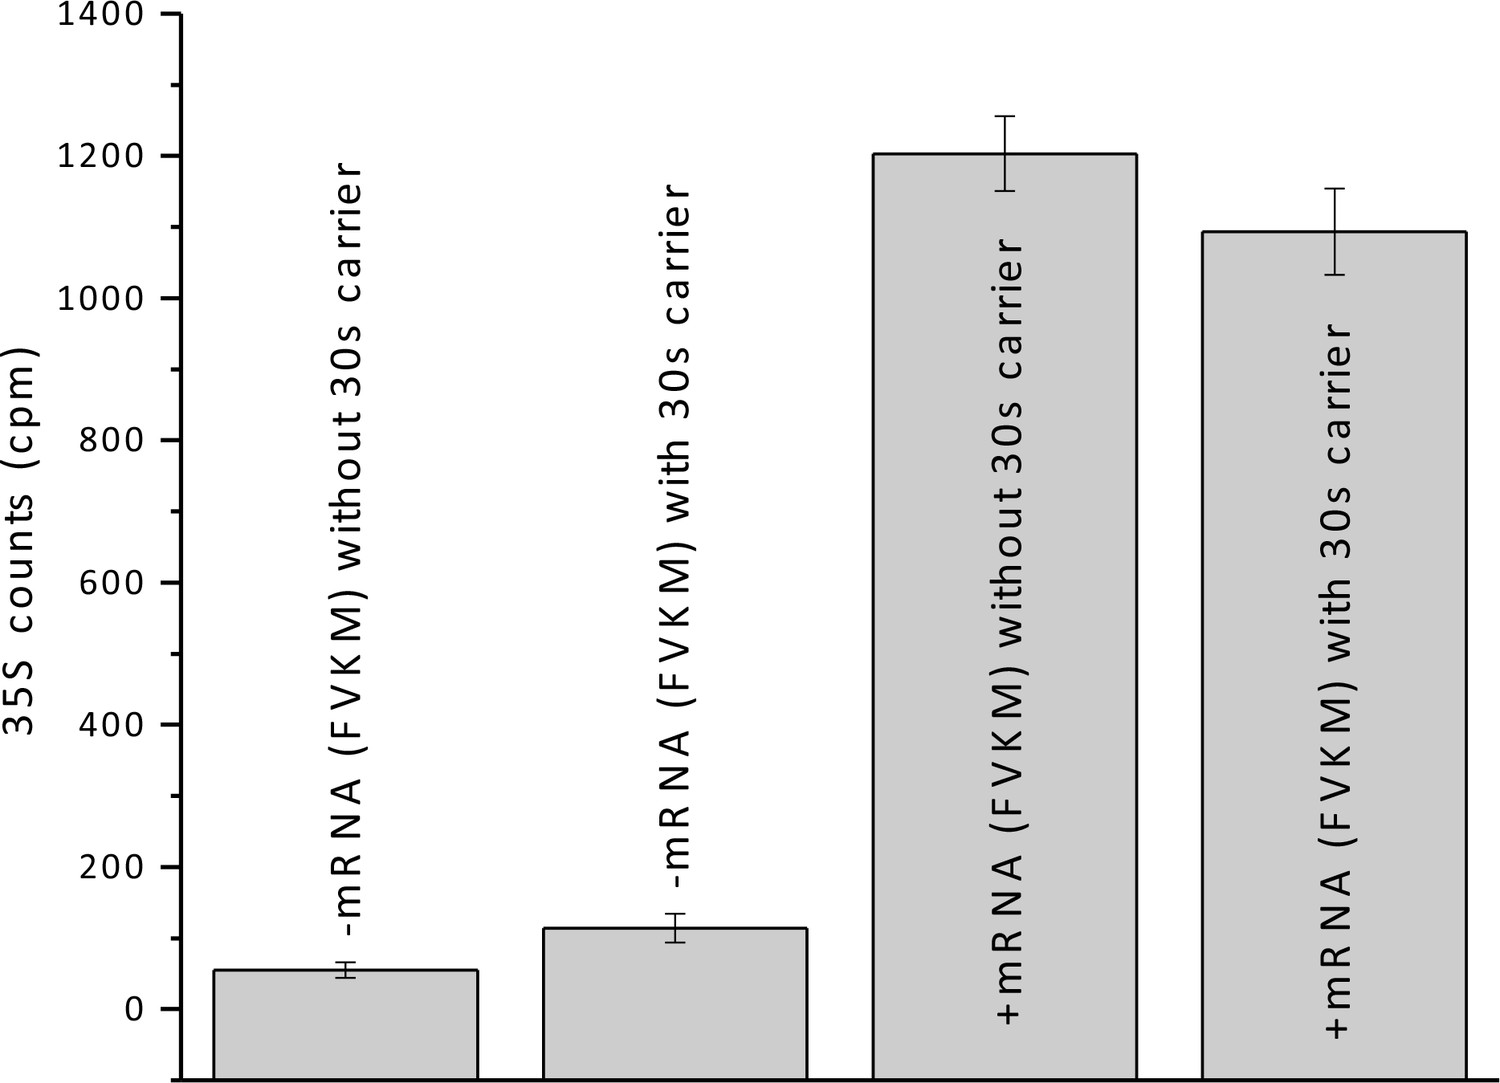
Added 30S carrier does not significantly change the amount of FVKM-tRNAMet co-sedimenting with 80S ribosomes in the presence and absence of FVKM-IRES.
https://doi.org/10.7554/eLife.13429.012
Figure 5 with 1 supplement
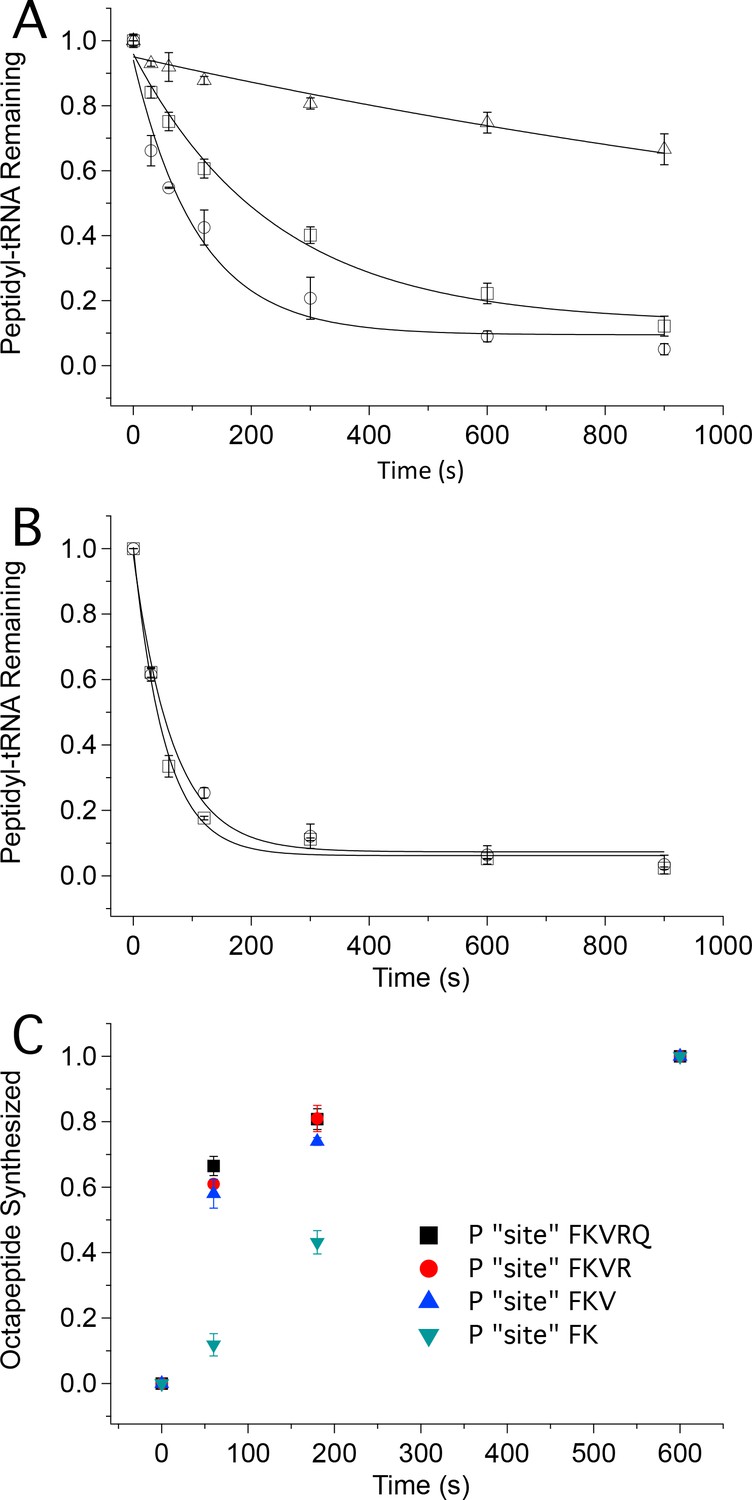
Tetrapeptide translocation (Step 12) is faster than tripeptide translocation (Step 9).
(A) Puromycin reaction with PheValLys-tRNALys bound either at the A site (D) or at the P-site (O) of the 80S·FVKM-IRES complex or being translocated from the A site to the P site (□). (B) Puromycin reaction with PheValLysMet-tRNAMet either bound at the P-site (O) of the 80S·FVKM-IRES complex or being translocated from the A site to the P site (□). Lines in A. and B. Are fits to single exponentials. (C) Time dependence of PheLysValArgGlnTrpLeuMet octapeptide synthesis from the 80S·FKVRQWLM-IRES complex containing various peptidyl-tRNAs pre-bound at the P site, as indicated. The pre-bound peptidyl tRNAs were prepared using the standard procedure (see Complex Preparations in Materials and methods) by incubating the 80S-IRES complex with the relevant TCs for 15 min. The remaining TCs needed for octapeptide synthesis, including [35S]-Met-TC, were then added, each at a concentration of 1.6 µM, for the indicated times prior to quenching. PheLysValArgGlnTrpLeuMet octapeptide synthesis was measured by [35S]-Met cosedimenting with 80S ribosome.
Figure 5—figure supplement 1
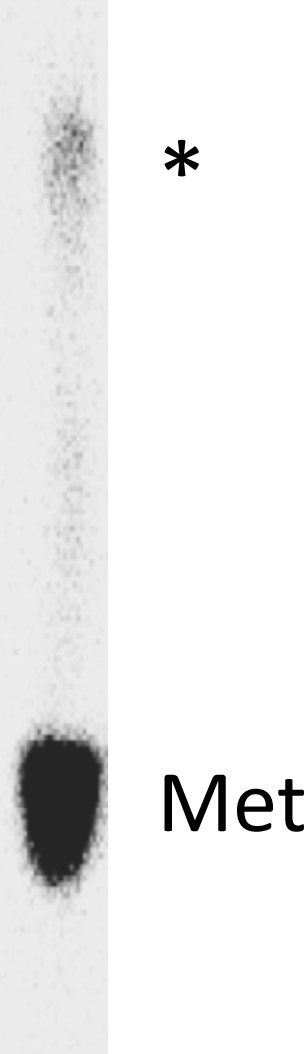
Octapeptide synthesis: 80S·FKVRQWLM-IRES complex with FKVRQWLM-tRNAMet in the P-site was prepared using the standard procedure (see Complex Preparations in Materials and methods) and incubating the 80S-IRES complex with the eight relevant TCs (including [35S]-Met-TC) for 40 min.
The resulting labeled octapeptide, released by base hydrolysis, was analyzed by TLE. Migration positions of [35S]-Met and [35S]-labeled FKVRQWLM (*) are indicated.
Tables
Table 1
Apparent rate constants for Steps 1 and 2.
| Apparent rate constants (s-1) | -eEF2 | +eEF2 |
|---|---|---|
| k1 | 0.0071 ± 0.0033 | 0.0033 ± 0.0001 |
| k-1 | 0.15 ± 0.04 | 0.0034 ± 0.0001 |
| k2 ([Phe-TC] = 0.1 µM) | 0.11 ± 0.04 | 0.0256 ± 0.0002 |
Table 2
t1/2 values*.
| Step (s) | t1/2 (s) |
|---|---|
| 1† 1 (+eEF2)† | 230 ± 5 237 ± 5 |
| 2‡ 2 (+eEF2)‡ | 15 ± 9 30 ± 5 |
| 3 | 210 ± 10 |
| 4 + 5 | 8 ± 2 |
| 4-8 | 98 ± 15 |
| 6 = (4-8) – (4+5) – (7+8)§ | 84 ± 16 |
| 7 | 3 ± 1 |
| 8 = (7+8) – 7§ | 4 ± 2 |
| 7 + 8 | 6 ± 2 |
| 7-11 | 128 ± 26 |
| 9 = (7-11) – (7+8) – (10+11)§ | 110 ± 30 |
| 10 | 2 ± 1 |
| 11 = (10 + 11) – 10§ | 7 ± 3 |
| 10 + 11 | 9 ± 2 |
| 12 | <10 |
-
* Error ranges shown are based on the variances of fits to single or double exponentials of the results presented in Figure 4, unless otherwise noted.
-
† Calculated as 0.69 (k-1 + k2)/k1k2 (see Table 1).
-
‡ Calculated as 0.69 (k-1 + k2)/k22 (see Table 1).
-
§ Error ranges for these steps, which are not observed directly, are based on the error ranges of the directly observed steps.
Additional files
-
Supplementary file 1
Initial coding sequences of variants used in this work.
- https://doi.org/10.7554/eLife.13429.016
Download links
A two-part list of links to download the article, or parts of the article, in various formats.
Downloads (link to download the article as PDF)
Open citations (links to open the citations from this article in various online reference manager services)
Cite this article (links to download the citations from this article in formats compatible with various reference manager tools)
Kinetics of initiating polypeptide elongation in an IRES-dependent system
eLife 5:e13429.
https://doi.org/10.7554/eLife.13429


