Nucleophosmin integrates within the nucleolus via multi-modal interactions with proteins displaying R-rich linear motifs and rRNA
- St. Jude Children's Research Hospital, United States
- University of Tennessee Health Sciences Center, United States
- The Scripps Research Institute, United States
- Oak Ridge National Laboratory, United States
Figures
Figure 1 with 2 supplements
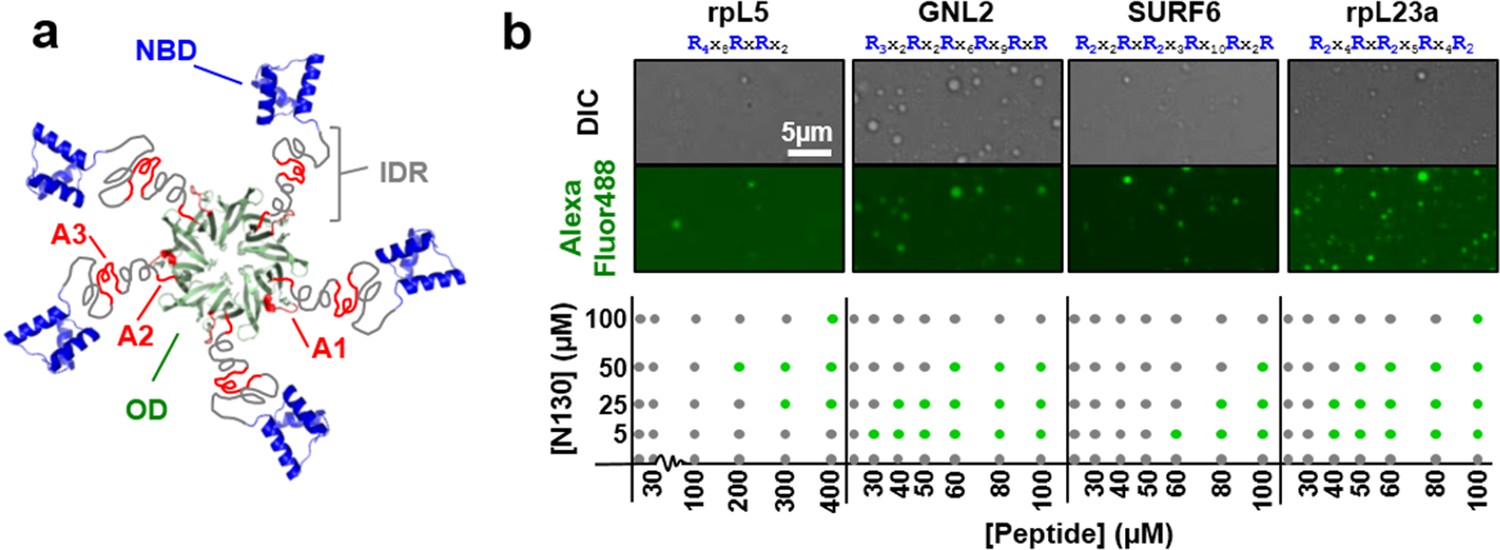
Multivalency of acidic tracts within NPM1 and R-motifs within nucleolar substrates mediates liquid-liquid phase separation.
(a) Composite model of NPM1 structure; the oligomerization domain (OD, green, PDB ID 4N8M), containing the A1 acidic tract (red), is connected via a disordered region (IDR, grey), containing two additional acidic tracts (A2 & A3, red), to the C-terminal nucleic acid binding domain (NBD, blue, PDB ID 2VXD); (b) Phase separation diagrams for mixtures of N130 and four R-motif containing peptides (bottom dot graphs); phase separation was assessed by the formation of liquid-like droplets detected using light microscopy (grey dot, clear solution observed; green dot, liquid-like droplets observed). Representative examples of liquid-like droplets formed between 50 μM N130 and the lowest peptide concentration associated with phase separation, visualized by DIC (top panel) and Alexa Fluor488 emission of labeled N130 (bottom panel) are illustrated. The composition of the R-motif peptides is given at the top of each pair of images; R is arginine; and X is any other amino acid.
Figure 1—figure supplement 1

Representative ITC curves for titrations of multivalent R-motif containing peptides into N122 and N130.
https://doi.org/10.7554/eLife.13571.004
Figure 1—figure supplement 2
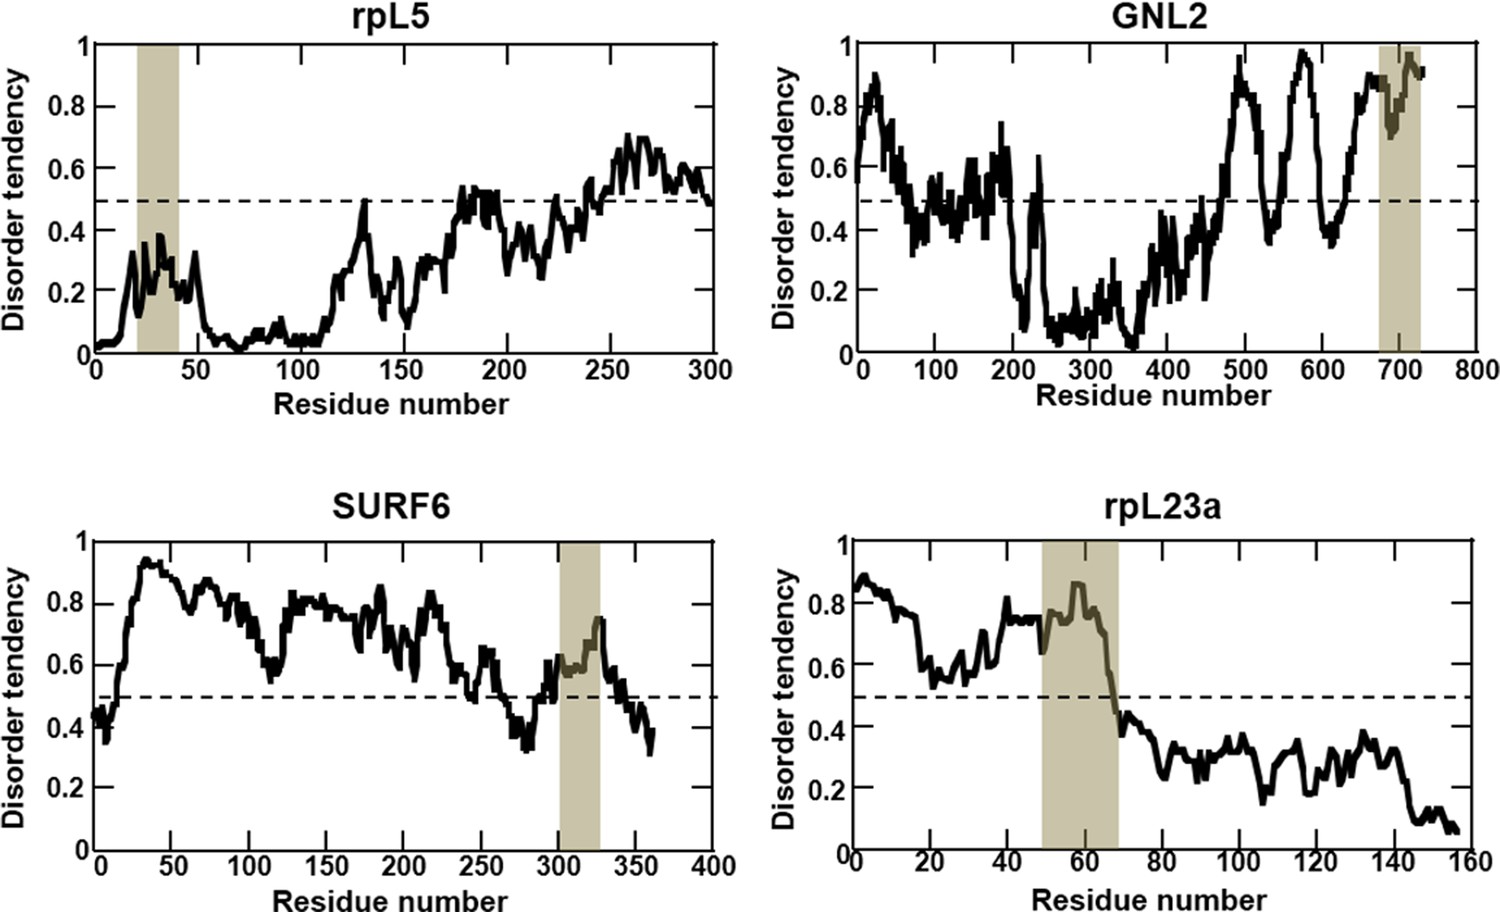
Multivalent R-motifs reside in disordered regions of proteins.
IUPRED predictions of protein disorder. The location of R-motif peptides is highlighted. rpL5 and rpL23 structures have been resolved in the context of the assembled ribosome, where they adopt helical structures in complex with other ribosomal proteins and rRNA. In isolation, however, these structural features may not be highly populated.
Figure 2 with 1 supplement
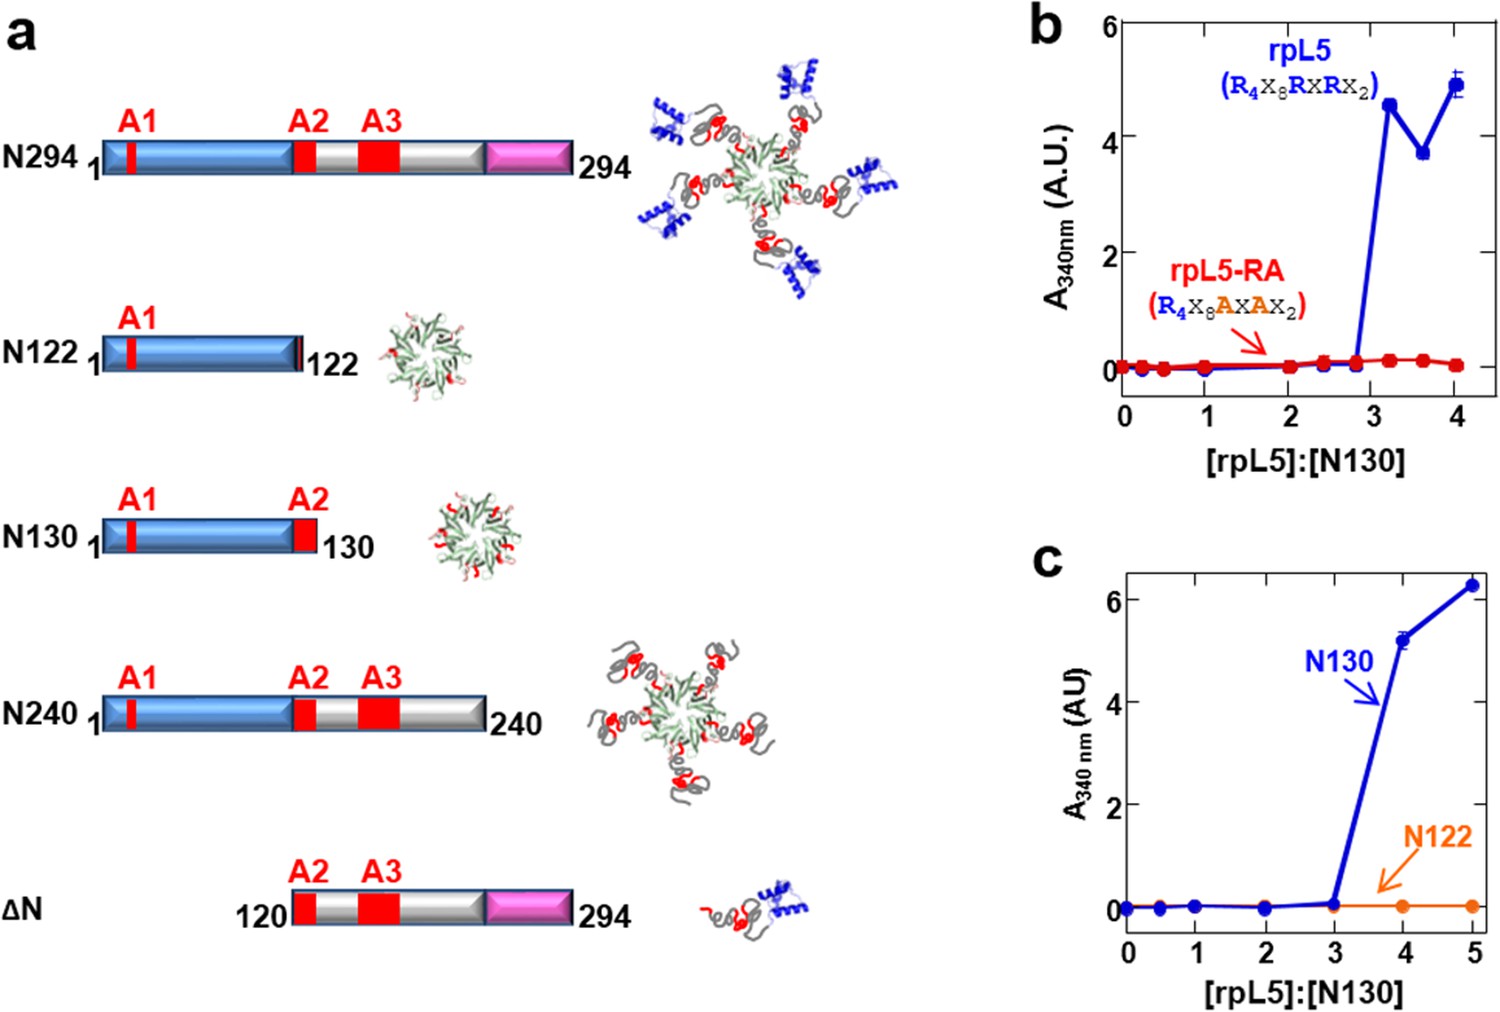
Multivalency within both the rpL5 peptide (of R-motifs) and N130 (or A tracts) is required for phase separation.
(a) Schematic representation of the NPM1 constructs used in this study; (b) Titrations of rpL5 (blue) or rpL5-RA peptide lacking the second R-motif (red), into 200 μM N130, monitored by light scattering at 340 nm; (c) Titrations of rpL5 peptide into N130 (blue) and N122 (orange).
Figure 2—figure supplement 1
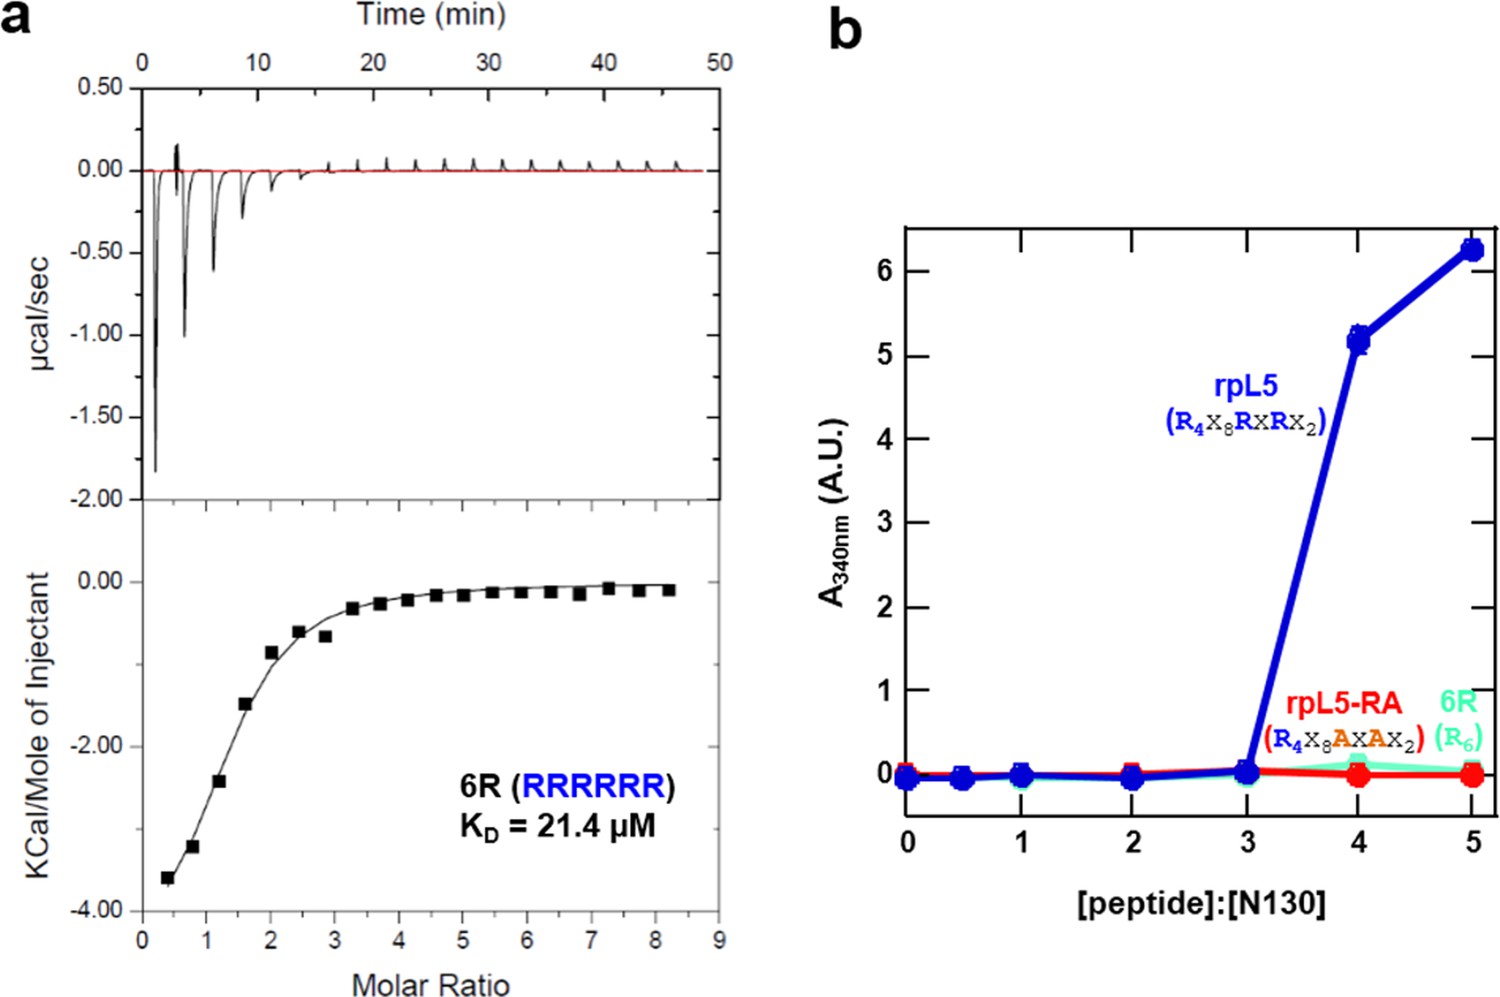
A monovalent peptide with similar affinity to rpL5 for binding N122 does not phase separate with N130.
(a) ITC curve of 6R peptide titrated into N122; (b) Light scattering assays of divalent rpL5 (blue), monovalent rpL5- RA (red) and monovalent, but tighter binding 6R (aqua).
Figure 3 with 1 supplement
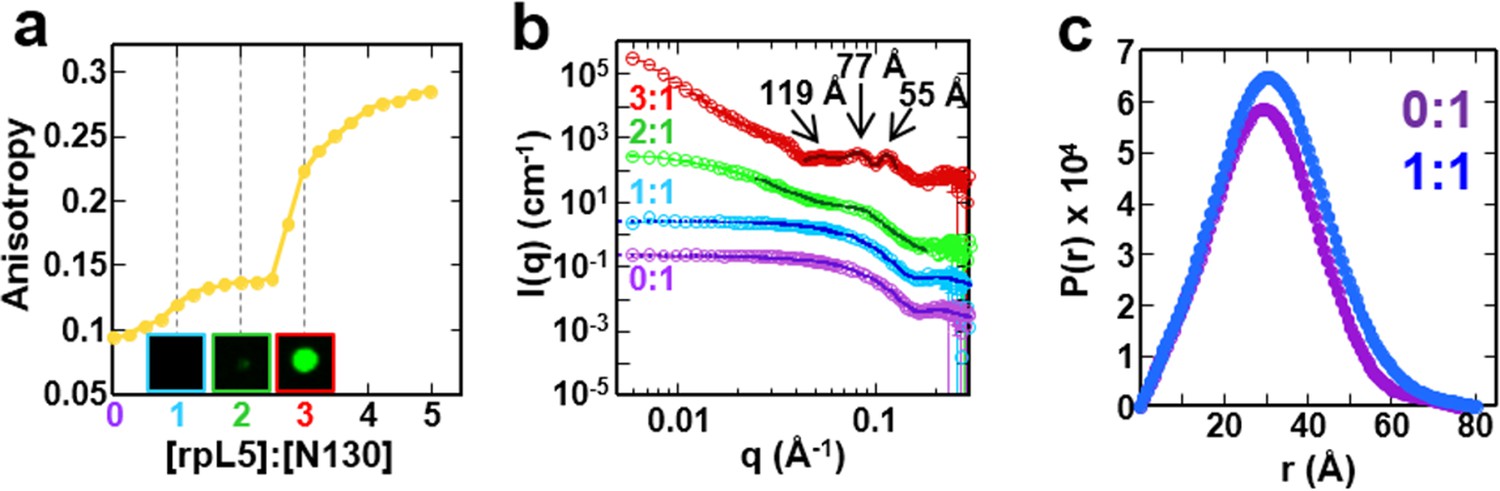
The liquid-like phase formed by rpL5 and N130 is characterized by molecular ordering and is accompanied by soluble, oligomeric intermediates.
(a) Fluorescence anisotropy of Alexa Fluor594-labeled N130 (at S125C within acidic tract A2; 1 μM) upon titration of the rpL5 peptide; the total [N130] was 200 μM. Insets: light microscopy images of the 1:1 (cyan box), 2:1 (green box) and 3:1 (red box) rpL5:N130 solutions. The same stoichiometry color coding is used in all panels. (b) SANS curves, I(q) versus q, for rpL5:N130 (200 μM) solutions at 0:1, 1:1, 2:1, and 3:1 stoichiometry. The curve for the 0:1 solution is on the absolute I(q) scale (cm-1) with the others shifted in 1, 2 and 4 decade increments for clarity. Fits (solid lines) of the curves to obtain Rg values (0:1 and 1:1 solutions) and correlation distances (2:1 and 3:1 solutions) are shown (See Analysis methods for details on curve fitting). (c) Pair-distribution, P(r), curves for 0:1 and 1:1 rpL5:N130 were calculated from the corresponding SANS curves (fits shown in Figure 3b). For apo N130, the Dmax ~ 78.65 Å with a resulting Rg = 23.04 ± 0.09 Å and I(0) = 0.2344 ± 0.0006 cm-1. From I(0) and using Eq. S1, the estimated molecular mass, M = 76 kDa, was determined; this mass is consistent with the expected five subunits within the pentamer (subunit M = 14.6 kDa). For 1: 1 rpL5:N130, the Dmax ~ 80.32 Å with a resulting Rg = 24.3 ± 0.1 Å and I(0) = 0.2744 ± 0.0009 cm-1. Here, I(0) yields M = 89 kDa, indicative of ~5 rpL5 (M = 2.2 kDa) molecules bound to N130.
Figure 3—figure supplement 1
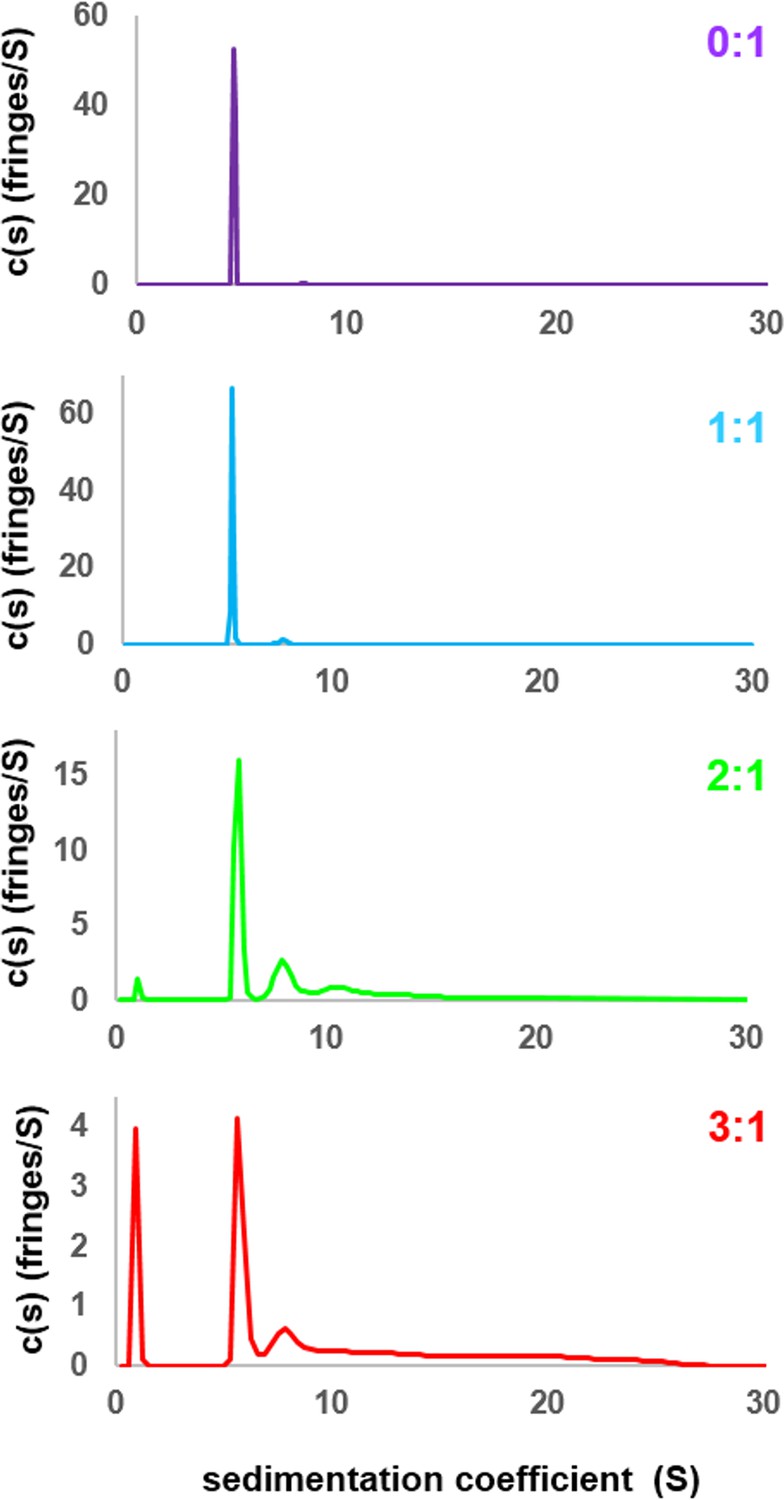
Sedimentation velocity analytical ultracentrifugation (SV-AUC) profiles for N130 titrated with rpL5.
SV-AUC profiles for apo N130 (purple), or N130 with rpL5 at 1:1 (light blue), 2:1 (green) and 3:1 (red) stoichiometric ratio (rpL5:N130).
Figure 4
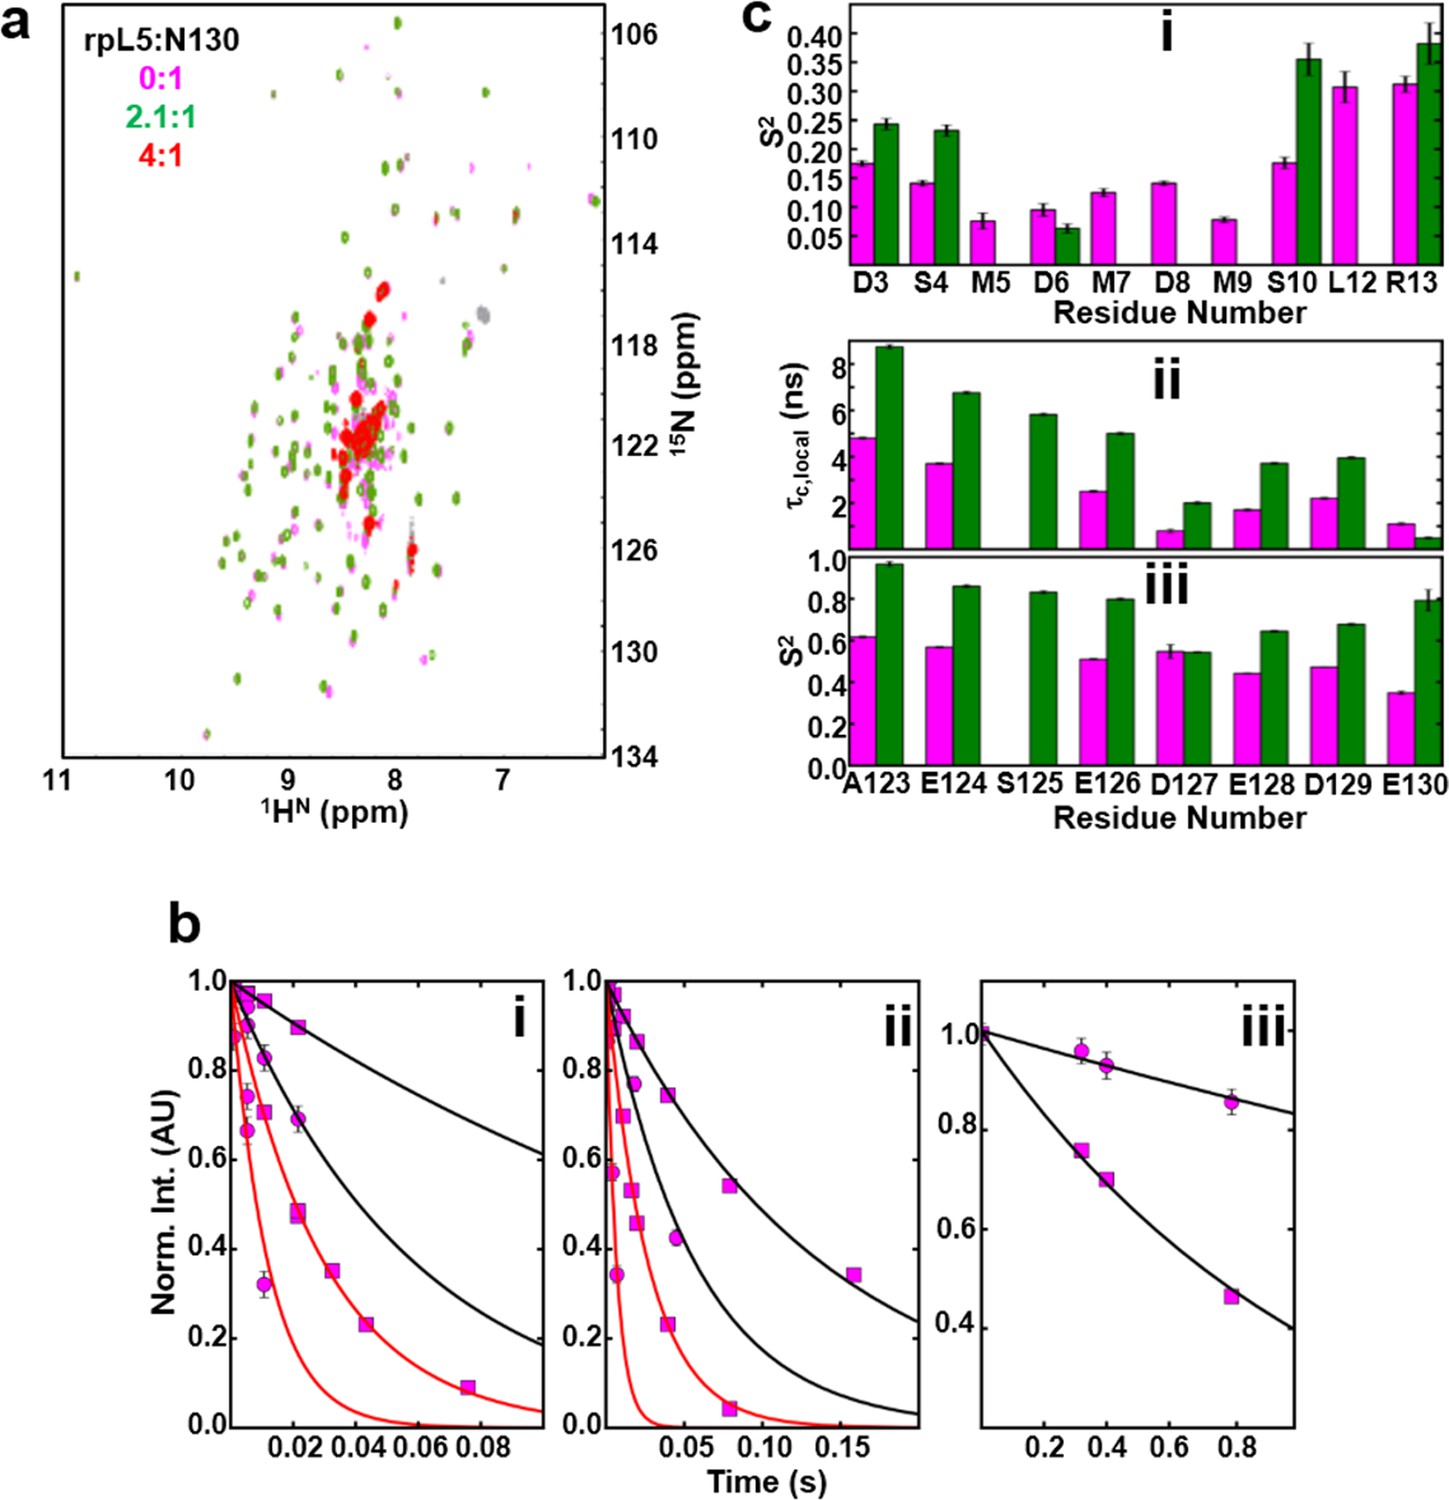
NMR chemical shift perturbations and amide backbone relaxation analysis of apo N130 and soluble complexes at 2.5:1 rpL5:N130 stoichiometry.
(a) 1H-15N TROSY-HSQC spectra of apo N130 (magenta), in a soluble complex with rpL5 (2.1:1 rpL5:N130; green) and in the phase separated state (4:1 rpL5:N130; red). (b) Examples of R2,β and R2,α peak intensity decay curves measured at 800 MHz (i) and 1000 MHz (ii), and R1 peak intensity decay curves measured at 800 MHz (iii) for free N130. In (i) and (ii), points and curves in black and red correspond to the R2,β and R2,α experiments, respectively. In (i)–(iii), circles and squares indicate data points for residues Tyr29 (within the folded pentamer core) and Glu121 (within the disordered A2 tract), respectively. Solid lines correspond to fits using a simple exponential decay model from which relaxation rates and intensities at zero time were extracted. (c) (i) Comparison of S2 values for the N-terminus for which data could be collected for apo N130 (magenta bars) and 2.5:1 rpL5:N130 (green bars). Comparison of c,local (ii) and S2 (iii) values for C-terminal residues in apo N130 (magenta bars) and 2.5:1 rpL5:N130 (green bars). S125 is overlapped in the apo N130 spectrum; therefore, under this condition, these analyses could not be performed.
Figure 5
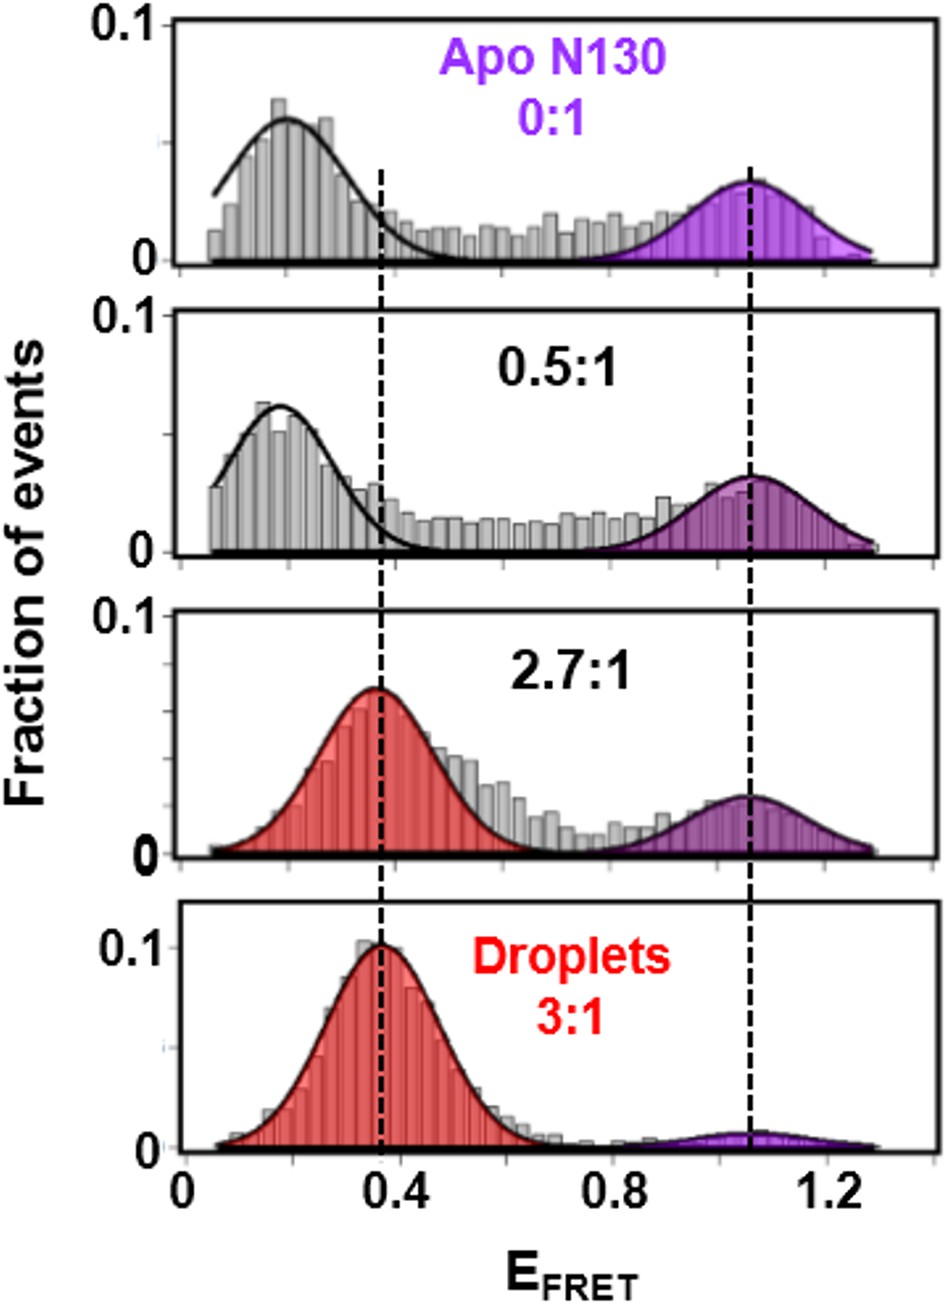
The A2 tract extends away from the folded core of N130 on the pathway to phase separation.
smFRET histograms for Alexa Fluor594/680-labeled N130Q15C/S125C (~100 pM; total [N130], 200 μM) at 0:1, 0.5:1, 2.7:1 and 3:1 (phase separated state) rpL5:N130 stoichiometry; the FRET events corresponding to conformational states with similar EFRET values are indicated by the shaded regions. The solid lines are Gaussian fits of the data, from which average EFRET values were determined.
Figure 6
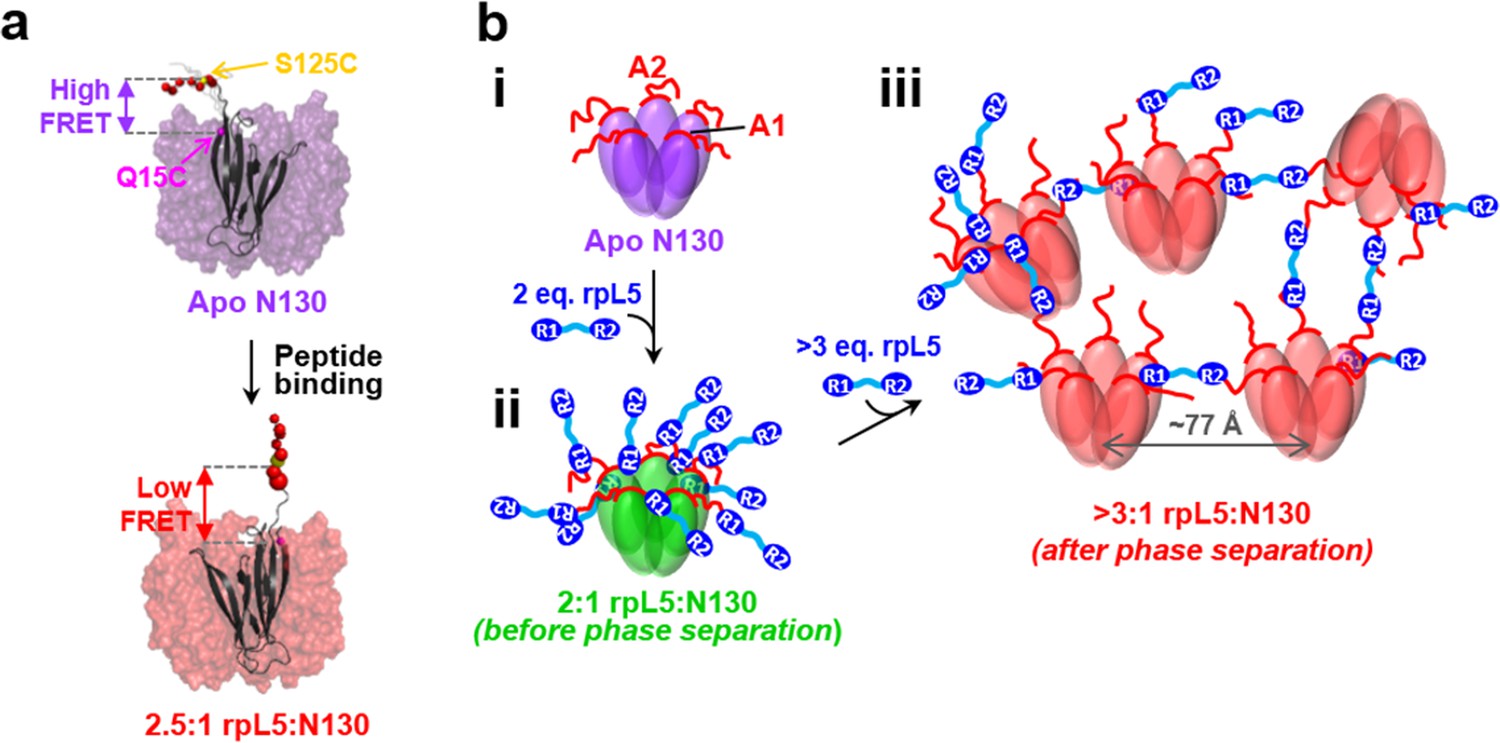
Schematic model of the structural rearrangements in N130 associated with liquid-liquid phase separation in the presence of the multivalent rpL5 peptide.
(a) Structural representation of results from NMR and smFRET that revealed dramatic changes in dynamics and spatial orientation of the A2 track of N130 upon rpL5 peptide binding: apo N130 (top) and N130 in complex with rpL5 (bottom). Residues within the A2 tract of N130 are shown as colored spheres with diameters proportional to the value for the 15N nucleus of amide group. The sites of fluorescent labeling, Q15C and S125C, are indicated as purple and yellow spheres, respectively (the spheres for Q15C do not encode dynamic information). In the apo state, A2 randomly samples relatively compact conformations, while in liquid-like droplets, these residues extend away from the N130 core. (b) Schematic representation of apo N130 (i) and the proposed structural model of phase separation. Upon saturation of the two principal binding sites within the A1 and A2 tracts on N130 (ii), bound rpL5 peptides extend toward and engage in weak interactions with neighboring N130 pentamers (iii), thus creating 3D, expandable cross-links. In (iii), only a subset of the possible inter-N130 pentamer crosslinks are shown for clarity. We suggest that one of the correlation distances observed using SANS (77 Å) corresponds to the inter-N130 pentamer spacing.
Figure 7

The length of the linker between R-motifs in the rpL5 peptide influences the molecular organization within rpL5:N130 liquid-like droplets.
(a) SANS curves, I(q) versus q, for 3:1 rpL5:N130 (red) and rpL5-2xLinker:N130 (orange) solutions; the N130 concentration for both was 200 μM. The curve for the droplets containing rpL5 2xLinker is displayed on absolute I(q) scale (cm-1) with the curve corresponding to rpL5 containing droplets shifted in 4 decade increments for clarity. Fits (solid lines) of the curves to obtain correlation distances are shown (See Analysis methods for details on curve fitting). Peak positions for the droplets with the rpL5-2xLinker correspond to correlation distances (d) of 63 Å & 100 Å whereas those observed with the wild-type rpL5 peptide correspond to d values of 56 Å, 79 Å & 119 Å. Inset: wide-field fluorescence microscopy (left) and DIC (right) images of droplets formed from the 3:1 rpL5-2xLinker:N130 solution. Scale bar = 10 μm.
Figure 8
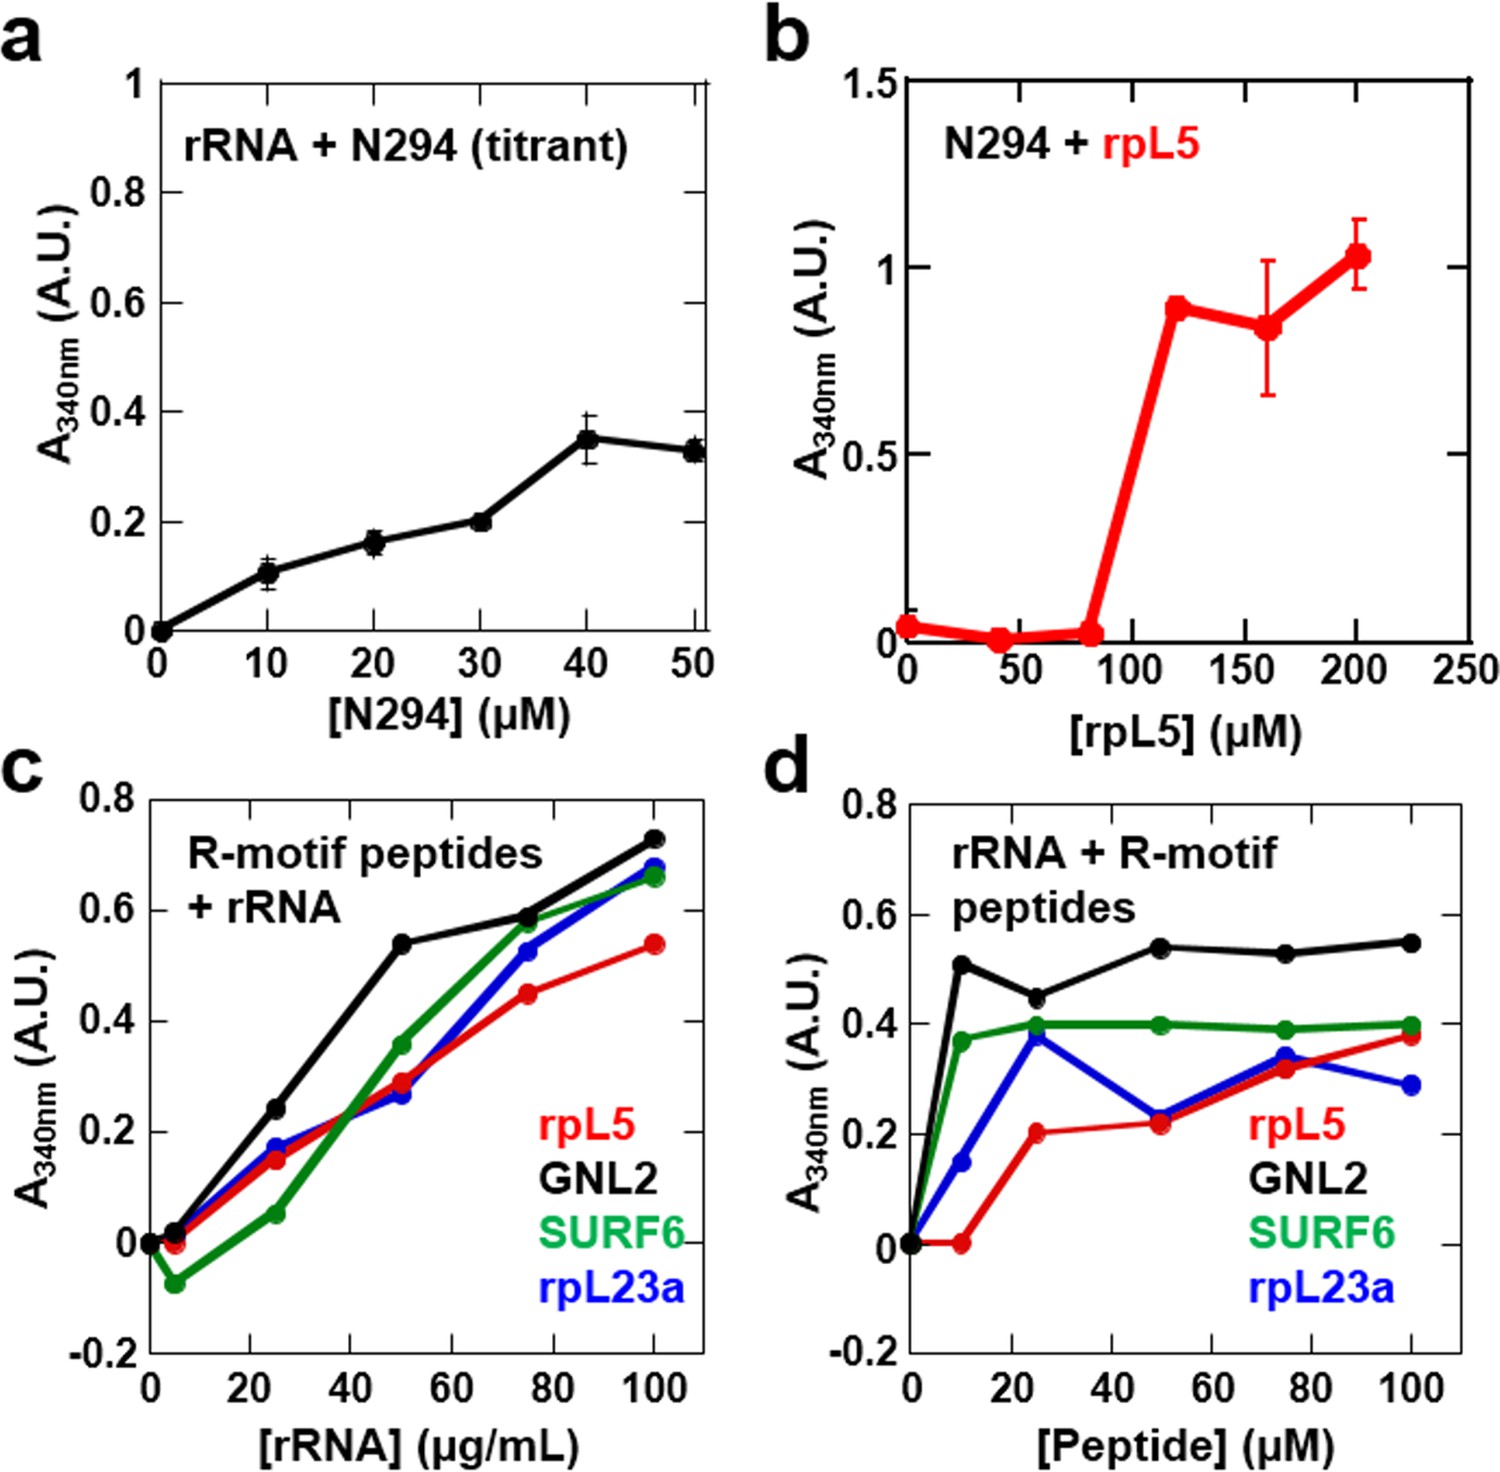
Phase separation by pairwise mixtures of NPM1 (N294) and molecules representing two fundamental components of the nucleolus, R-motif containing proteins (represented by R-motif peptides) and rRNA, as determined by light scattering assays.
Titration of (a) N294 into 50 μg/mL rRNA and (b) rpL5 into 40 μM N294; (c) Titrations of rRNA into 50 μM R-motif containing peptides (rpL5, GLN2, SURF6, and rpL23a). (d) Titrations of R-motif containing peptides into 50 μg/mL rRNA (as in c).
Figure 9

Multi-modal binding of NPM1 mediates formation of liquid-like droplets with both rRNA and rpL5 in vitro.
(a) Confocal microscopy images of droplets after 15 min incubation formed between 40 μM N294 and 50 μg/mL rRNA (Row 1), 40 μM N294 and 200 μM rpL5 (Row 2), 200 μM rpL5 and 50 μg/mL rRNA (Row 3) and 40 μM N294 and 50 μg/mL rRNA droplets treated with 40 μM rpL5, a concentration below the critical phase separation threshold for N294/rpL5 binary system (Row 4). rpL5 and N294 were labeled with Alexa Fluor594 and Alexa Fluor488, respectively. Scale bar = 10 μm; (b) Quantitation of droplet size over time for the samples presented in panel a; values plotted are the mean ± SD, n = 4 fields of view.
Figure 10
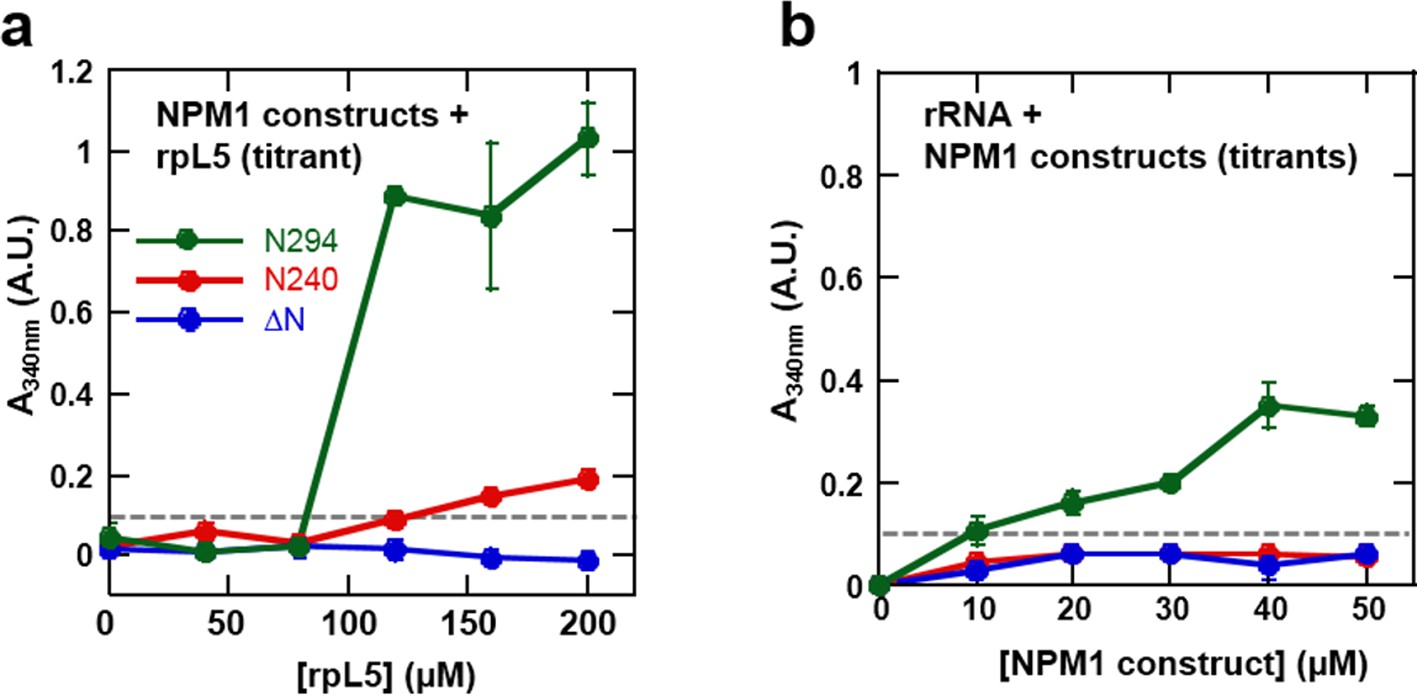
The OD and A tracts of NPM1 are required for phase separation with rpL5, while phase separation in the presence of rRNA requires both folded domains (OD & NBD).
Light scattering assays of (a) titrations of rpL5 peptide into 40 μM NPM1 and (b) titrations of NPM1 constructs into 50 μg/mL rRNA. Values plotted are the mean ± SD, n = 3 experiments. The dashed line at 0.1 AU indicates the threshold, above which visible turbidity and microscopic droplets can be detected.
Figure 11
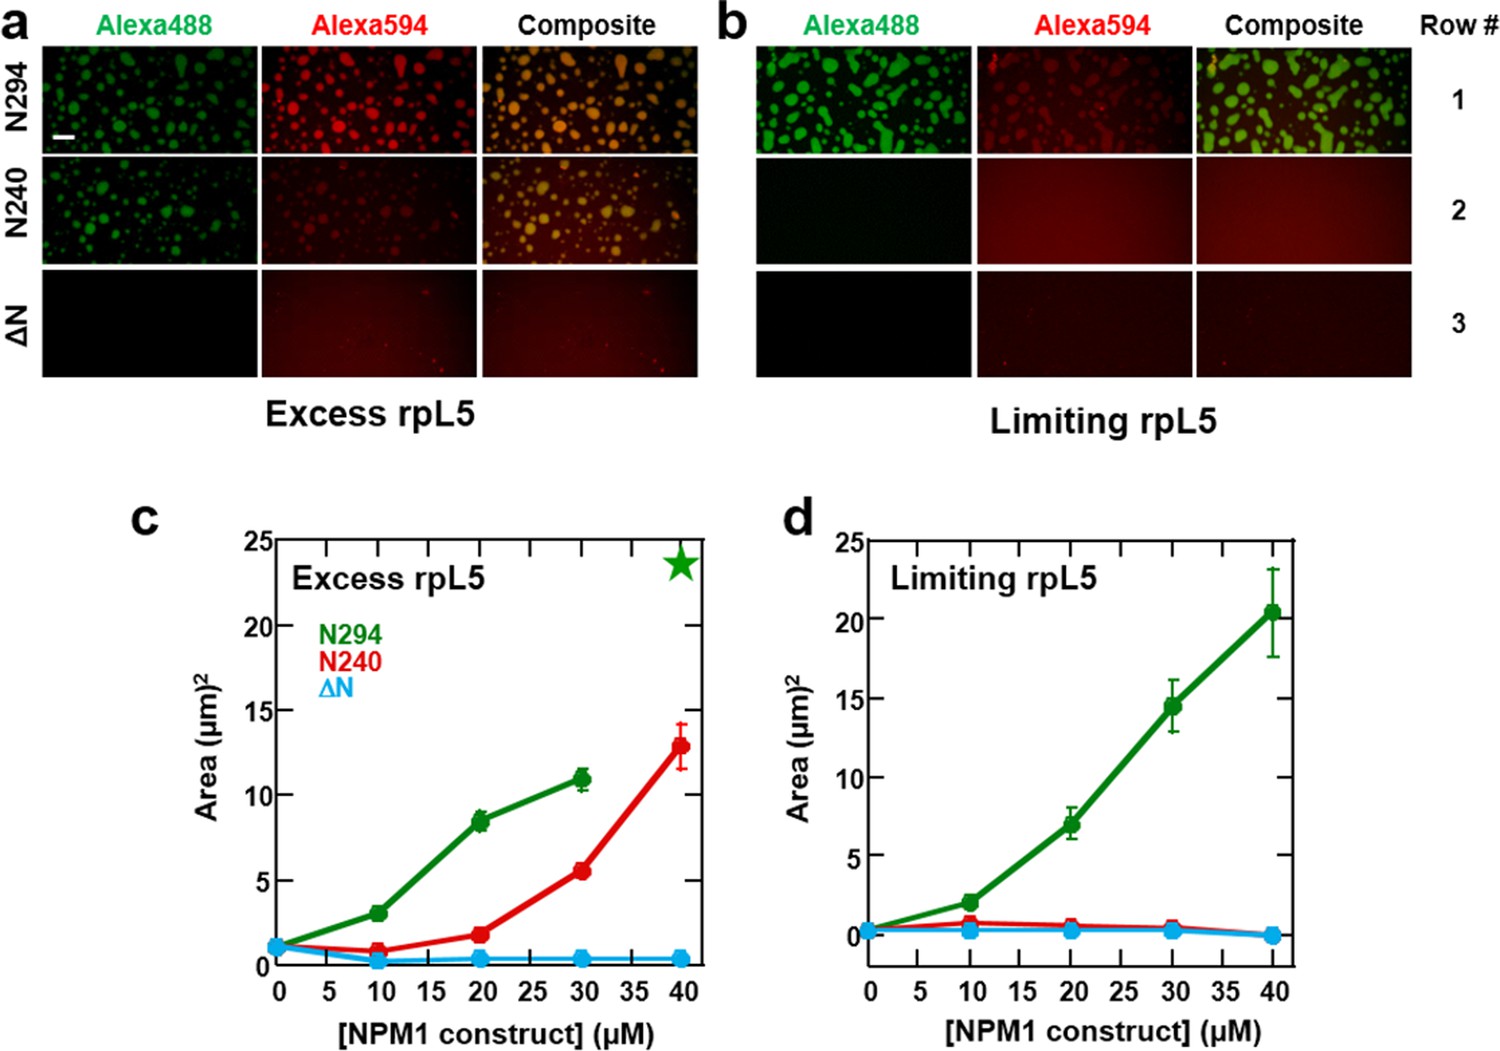
Both the OD and NBD of NPM1 are required for co-localization of rRNA and rpL5 within liquid-like droplets in vitro.
Confocal microscopic images 15 min after the addition of the specified NPM1 construct (30 μM) to preformed rpL5/rRNA puncta formed from 50 μg/mL rRNA and 200 μM rpL5 (a) and from 50 μg/mL rRNA and 50 μM rpL5 (b). Scale bar = 10 μm. Quantification of the growth of droplets formed through disassembly of rpL5/rRNA puncta upon addition of individual NPM1 constructs. (c) NPM1 constructs were titrated into puncta formed between 200 μM rpL5 and 50 μg/mL rRNA, where rpL5 is above the threshold for independent phase separation with NPM1. The star at 40 μM N294 indicates that the droplets experienced wetting on the slide surface and expanded above the maximum threshold of 100 μm2 set in the analysis; (d) NPM1 constructs titrated into puncta formed between 50 μM rpL5 and 50 μg/mL rRNA, where rpL5 is below the threshold for independent phase separation with NPM1.
Figure 12 with 2 supplements
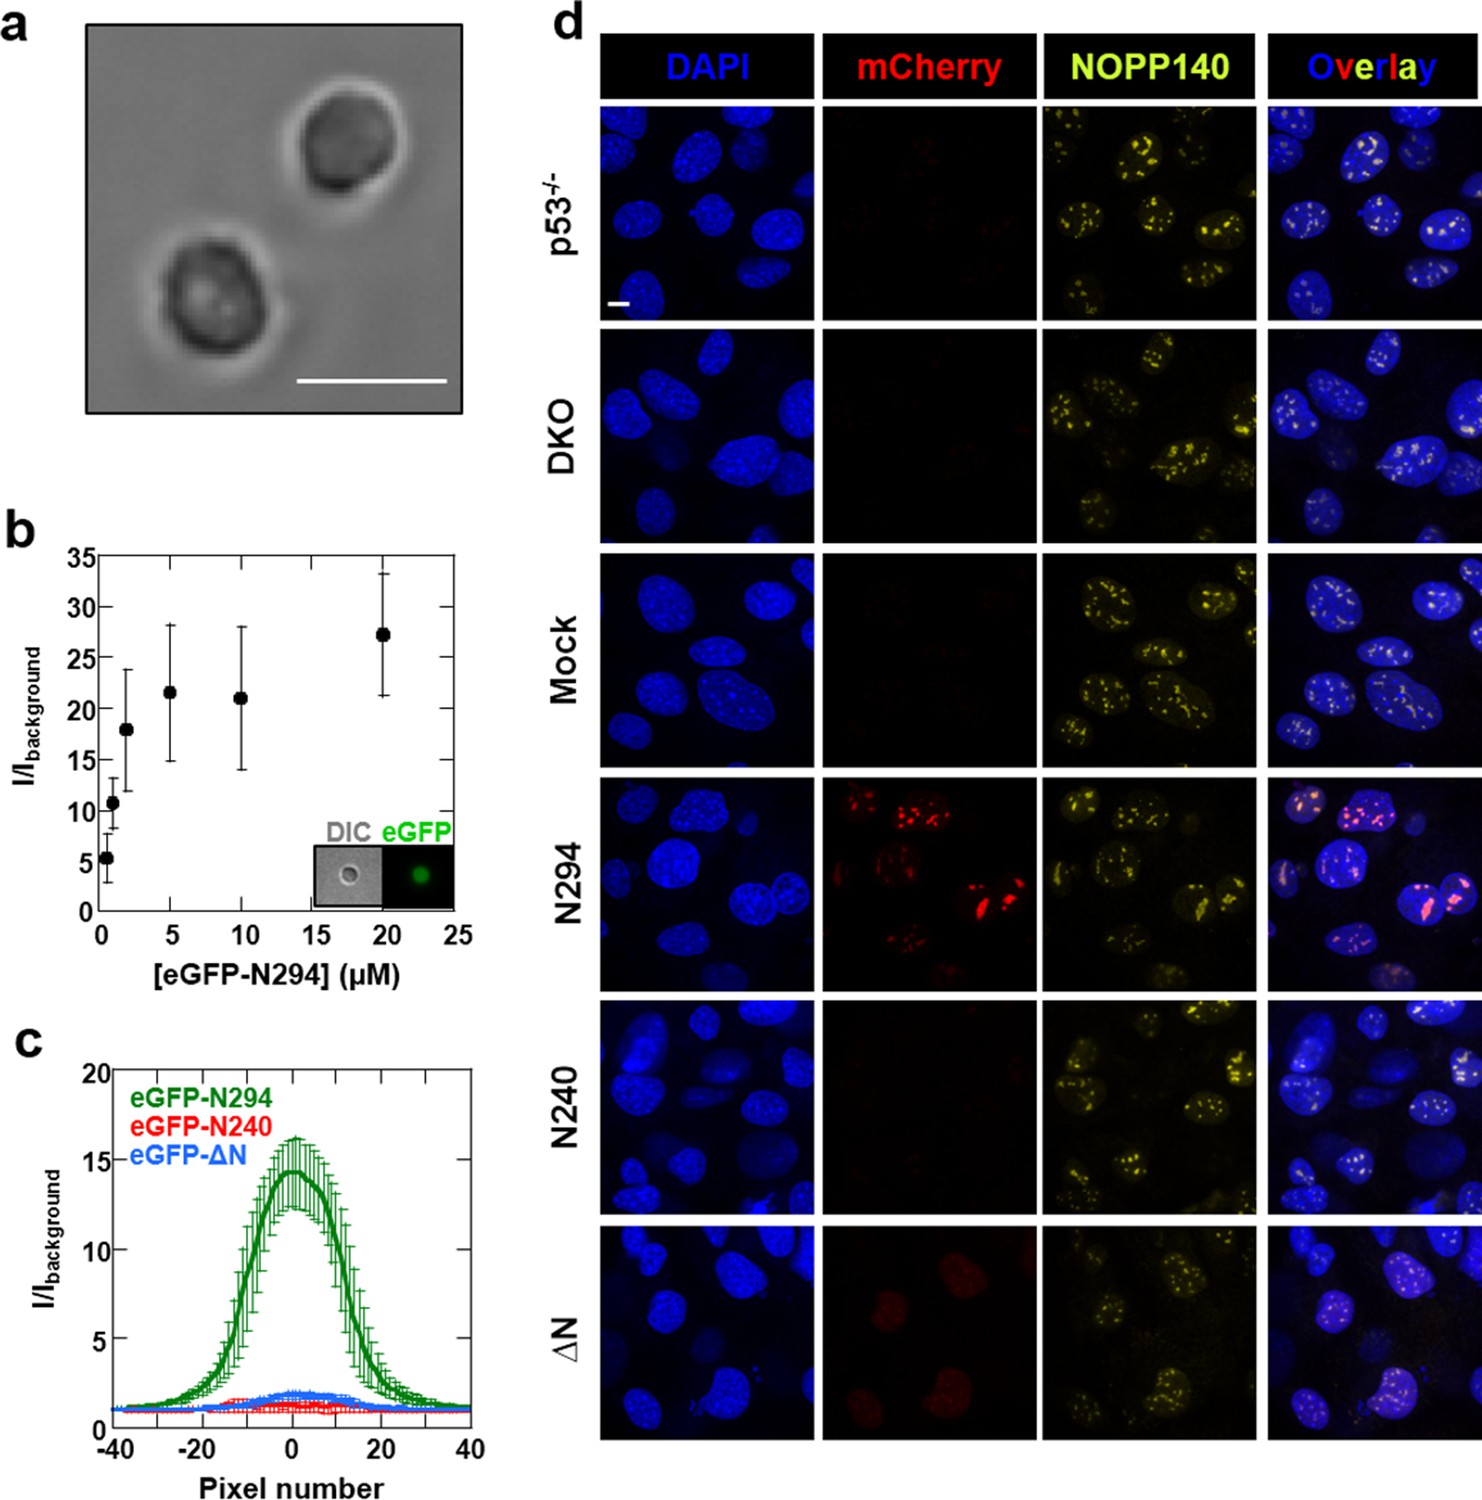
Synergistic activity of the OD and NBD are required for NPM1 incorporation in mammalian nucleoli.
(a) DIC image of isolated nucleoli; (b) Titrations of recombinant eGFP-N294 into purified nucleoli. Fluorescence intensity over background is quantified. (c) Fluorescence profile through sections of nucleoli treated with 100 μM recombinant eGFP-NPM1 constructs. Values in panels (b) and (c) represent mean ± SD, n = 20 nucleoli; (d) Fluorescence confocal microscopy images of MEF cell lines; DAPI was imaged to identify nuclei, mCherry to identify the NPM1 constructs, and a fluorescently-labeled antibody to NOPP140 to identify the GC of nucleoli. Scale bar = 5μm.
Figure 12—figure supplement 1
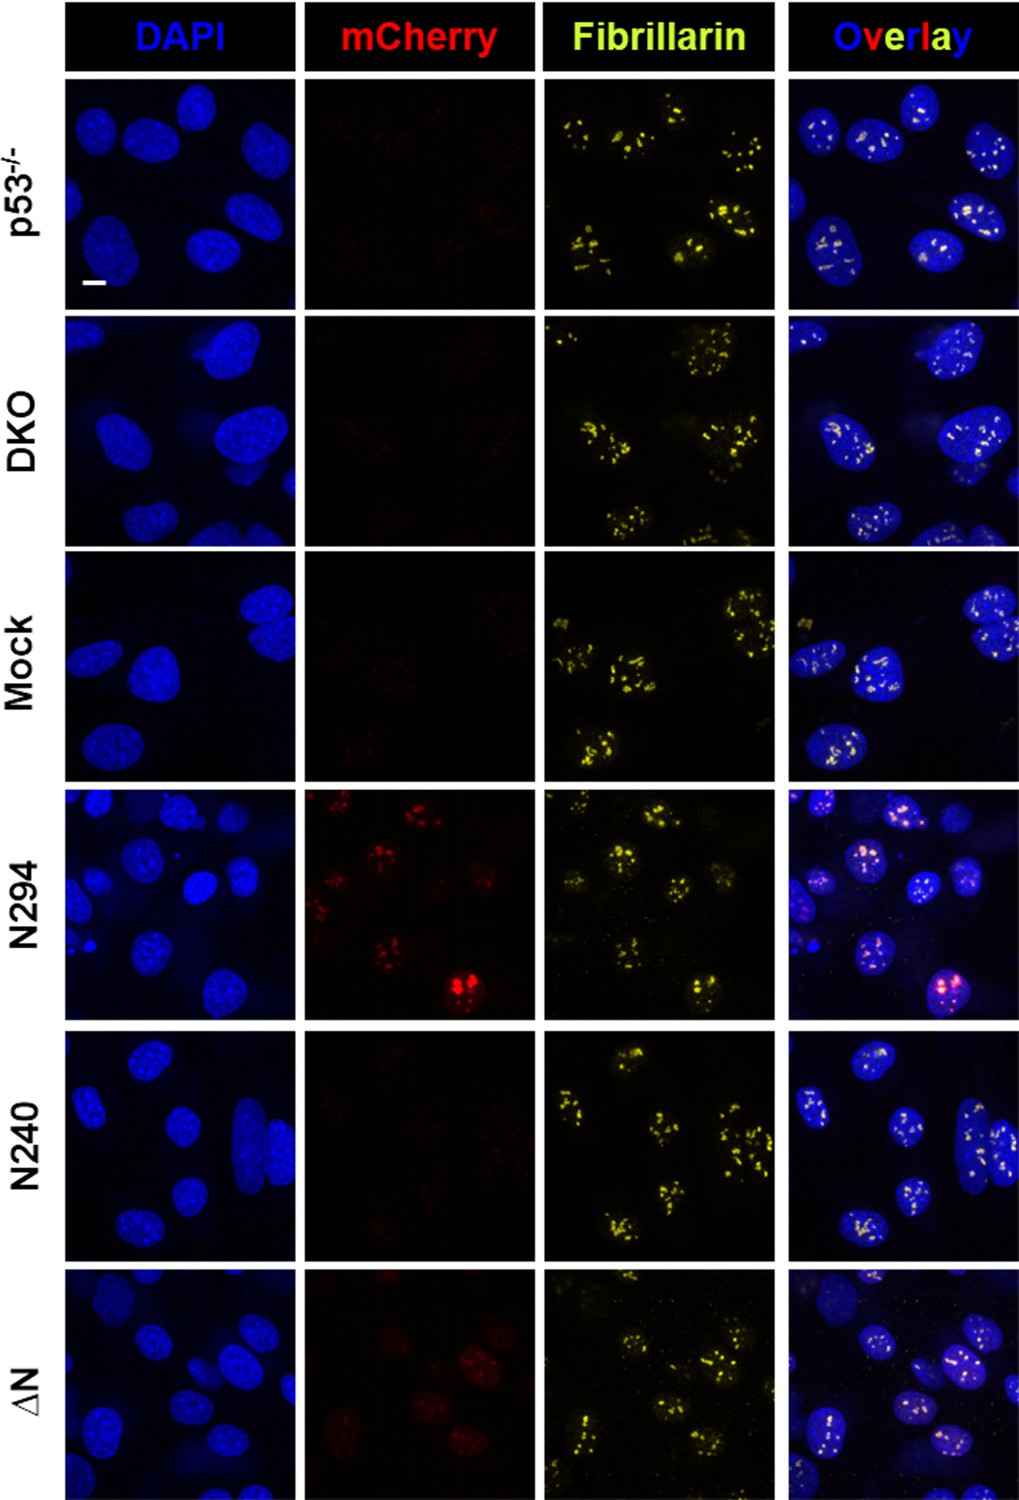
The multi-modal binding properties of the OD and NBD of NPM1 are required for localization within mammalian nucleoli.
Confocal fluorescence microscopy images of Trp53-/- and Npm1-/-/p53-/- (DKO) MEF cell lines, and DKO cell lines stably expressing mCherry-fused NPM1 constructs, stained with DAPI to visualize nuclei and with a fluorescent antibody for fibrillarin to visualize nucleoli. NPM1-expressing cells were also imaged for mCherry fluorescence. Scale bar = 5 μm.
Figure 12—figure supplement 2
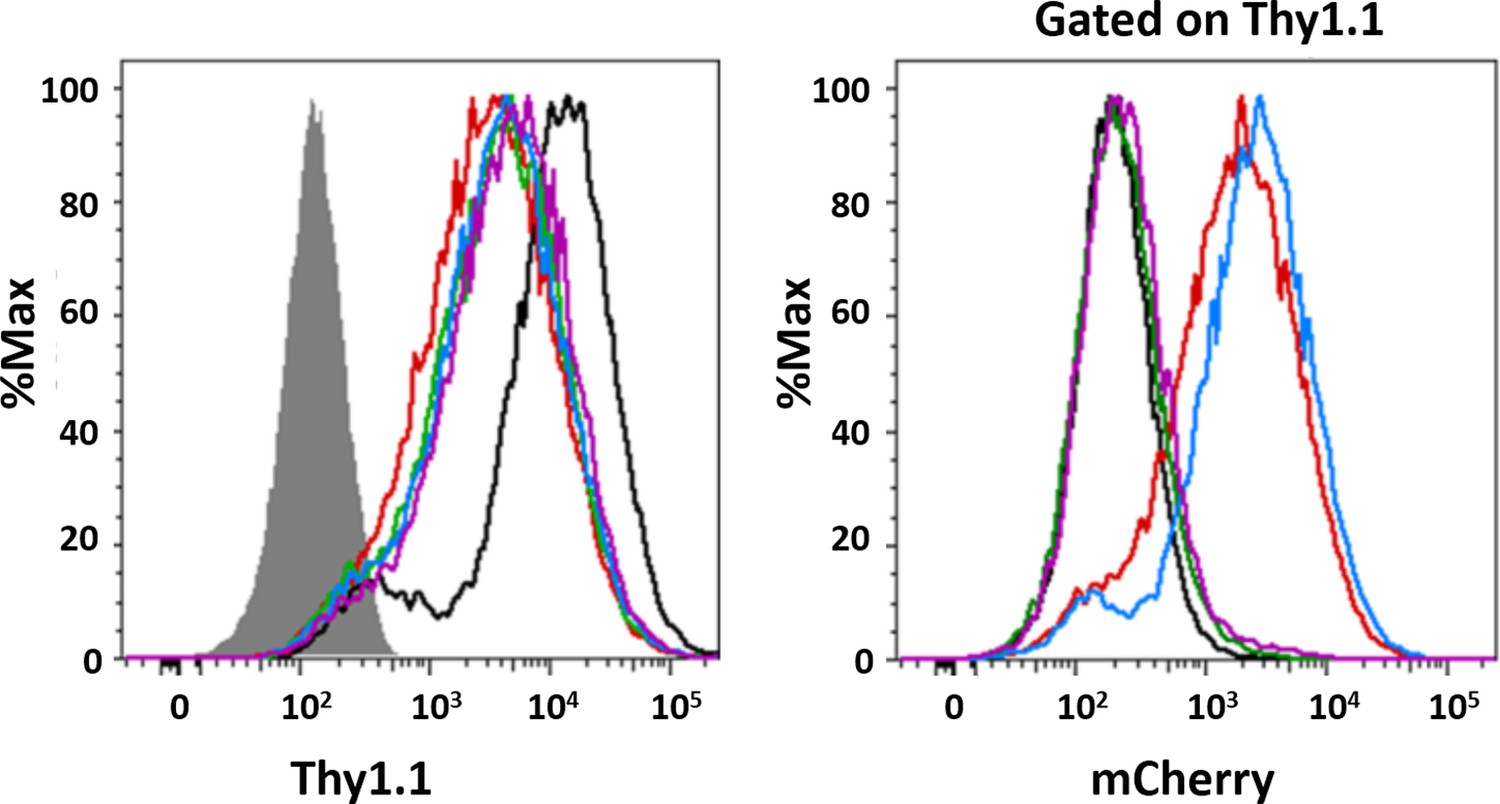
Flow cytometric analysis of transduced MEFs.
(a) Surface expression of Thy1.1 was analyzed in parental (filled histogram) and DKO MEFs transduced with empty vectors (mock; black curve) or those containing mCherry NPM1 variants: N294 (red), N240 (green) and ΔN (blue). (b) The expression of mCherry was determined in Thy1.1-expressing cells (right panel).
Videos
Video 1
In vitro droplets formed between 100 µM N130 and 500 µM rpL5. 1 µM N130 was labeled with AlexaFluor488.
https://doi.org/10.7554/eLife.13571.009
Video 2
In vitro droplets formed between 25 µM N130 and 70 µM GNL2. 1 µM N130 was labeled with AlexaFluor488.
https://doi.org/10.7554/eLife.13571.010
Video 3
In vitro droplets formed between 100 µM N130 and 200 µM SURF6. 1 µM N130 was labeled with AlexaFluor488.
https://doi.org/10.7554/eLife.13571.011
Video 4
In vitro droplets formed between 50 µM N130 and 80 µM rpL23. 1 µM N130 was labeled with AlexaFluor488.
https://doi.org/10.7554/eLife.13571.012Tables
Table 1
Amino acid sequences of the synthetic multivalent R-motif containing peptides.
| Peptide Name# | Peptide amino acid sequence |
|---|---|
| rpL5 | 21RRRREGKTDY10YARKRLV37 |
| GNL2 | 682RRRAVRQQRP10KKVGVRYYET20HNVKNRNR709 |
| SURF6 | 299RRAQRQRRWE10KRTAGVVEKM20QQRQDRRR326 |
| rpL23a | 47RRPKTLRLRR10QPKYPRKSAP20RR68 |
| rpL5-RA | 21RRRREGKTDY10YAAKALV37 |
| rpL5-2xLinker | RRRREGKTDY10YAEGKTDYYA20RKRLV |
-
#The peptides are referred to by the same name as the protein they originate from and the residue numbers of their N- and C-termini are indicated.
Table 2
Binding affinities for interactions between N122 (NPM1 residues 1–122, displaying only A1) and N130 (displaying both A1 and A2) and the multivalent R-motif-containing peptides, determined using isothermal titration calorimetry (ITC), at concentrations below the critical phase separation threshold.
| Peptide | N122 | N130 | ||
|---|---|---|---|---|
| N (sites) | KD (μM) | N (sites) | KD (μM) | |
| rpL5 | 0.63 ± 0.09 | 19.0 ± 2.7 | 2.18 ± 0.19 | 20.5 ± 5.0 |
| GNL2 | 0.66 ± 0.04 | 10.2 ± 1.3 | n.d.* | n.d.* |
| SURF6 | 0.55 ± 0.06 | 9.2 ± 0.5 | 1.4 ± 0.02 | 19.0 ± 0.8 |
| rpL23a | n.d.# | n.d.# | n.d.* | n.d.* |
| rpL5-RA | 1.0 ± 0.06 | 50.9 ± 3.18 | 0.84 ± 0.07 | 140.1 ± 9.29 |
-
* Not determined due to multiple, unresolved binding events
-
# Heat change was too weak for accurate data analysis
-
Average values from a minimum of three independent experiments are reported ± SD
Table 3
Results of sedimentation velocity analytical centrifugation analysis (SV-AUC) of N130 in the absence or presence of increasing concentrations of the rpL5 peptide.
| rpL5:N130 | mg/mla | s20 (Svedberg)b | s20,w (Svedberg)c | MW (kDa)d | f/f0 e |
|---|---|---|---|---|---|
| 0:1 | 2.76 | 4.63 (98.7%) | 4.82 | 88.9 | 1.53 |
| 7.90 (1.20%) | 8.22 | 198.0 | 1.53 | ||
| 1:1 | 3.09 | 5.23 (96.3%) | 5.44 | 99.3 | 1.46 |
| 7.63 (3.7%) | 7.94 | 175.0 | 1.46 | ||
| 2:1 (1-300 min) | 3.63 | 1.07 (2.6%) | 1.11 | 6.8 | 1.20 |
| 5.80 (48%) | 6.03 | 86.3 | 1.20 | ||
| 8.11 (23%) | 8.44 | 143.0 | 1.20 | ||
| 12.33 (25%) | 12.82 | 268.0 | 1.20 | ||
| 14-19 (7%) | 14-19 | 300-500 | 1.20 | ||
| 2:1 (100-300 min)f | 3.31 | 5.75 (56%) | 5.98 | 81.1 | 1.16 |
| 5.80 (25%) | 6.03 | 128.0 | 1.16 | ||
| 8.11 (17%) | 8.44 | 182.0 | 1.16 | ||
| 3:1 (1-300 min) | 2.01 | 0.95 (17%) | 0.98 | 7.4 | 1.43 |
| 5.80 (31%) | 6.00 | 112.0 | 1.43 | ||
| 10.32 (32%) | 10.73 | 266.0 | 1.43 | ||
| 14-27 (21%) | 14-27 | 500-850 | 1.43 | ||
| 3:1 (100-300 min)f | 1.29 | 1.18 (4%) | 1.22 | 1.1 | 1.49 |
| 5.73 (41%) | 5.96 | 117.0 | 1.49 | ||
| 7.41 (20%) | 7.71 | 173.0 | 1.49 | ||
| 9.17 (15%) | 9.54 | 238.0 | 1.49 | ||
| 11.33 (15%) | 11.79 | 266.0 | 1.49 |
-
a Total concentration in mg/ml.
-
b Sedimentation coefficient taken from the ordinate maximum of each peak in the best-fit c(s) distribution at 20 °C with percentage protein amount in parenthesis. Sedimentation coefficient (s-value) is a measure of the size and shape of a protein in a solution with a specific density and viscosity at a specific temperature.
-
c Standard sedimentation coefficient (s20,w-value) in water at 20 °C.
-
d Molar mass values (MW) taken from the c(s) distribution that was transformed to the c(M) distribution. The theoretical molar mass is in parenthesis.
-
e Best-fit weight-average frictional ratio values (f/f0)w taken from the c(s) distribution.
-
f Fit of the data in the 100-300 min sedimentation time frame, for the analysis of the lower MW rpL5:N130 complex intermediates. The MW cutoff of ~ 300 kDa corresponds to a tetramer of N130 pentamers.
Table 4
NMR-derived dissociation constant (KD) values determined by monitoring chemical shift perturbations of individual N130 nitrogen backbone resonances while titrating the rpL5 peptide.
| Residue | Structural context | KD (μM) |
|---|---|---|
| Met5 | N-terminus | 385 ± 108 |
| Asp6 | N-terminus | 116 ± 25 |
| Met7 | N-terminus | 142 ± 30 |
| Ser10 | N-terminus | 56 ± 13 |
| Leu12 | N-terminus | 10 ± 5 |
| Arg13 | N-terminus | 58 ± 13 |
| Gln15 | Core | 36 ± 10 |
| Tyr17 | Core | 19 ± 9 |
| Leu18 | Core | 205 ± 51 |
| Val33 | Core | 1041 ± 649 |
| Asp36 | A1 tract | 329 ± 93 |
| Glu37 | A1 tract | 1549 ± 1168 |
| Glu39 | A1 tract | 115 ± 37 |
| His40 | Core | 123 ± 23 |
| Leu42 | Core | 24 ± 9 |
| Ser43 | Core | 166 ± 38 |
| Ala64 | Core | 1227 ± 562 |
| Asn66 | Core | 1530 ± 958 |
| Tyr67 | Core | 245 ± 58 |
| Glu68 | Core | 147 ± 29 |
| Val74 | Core | 53 ± 14 |
| Phe92 | Core | 14 ± 6 |
| Glu93 | Core | 329 ± 78 |
| Ile94 | Core | 73 ± 17 |
| Thr95 | Core | 34 ± 9 |
| Leu116 | Core | 101 ± 24 |
| Val117 | Core | 61 ± 17 |
| Ala118 | Core | 35 ± 9 |
| Glu120 | A2 tract | 68 ± 16 |
| Glu121 | A2 tract | 101 ± 18 |
| Asp122 | A2 tract | 279 ± 76 |
| Ala123 | A2 tract | 182 ± 50 |
| Glu124 | A2 tract | 614 ± 410 |
| Glu126 | A2 tract | 576 ± 471 |
| Asp127 | A2 tract | 2162 ± 1612 |
| Glu130 | A2 tract | 4258 ± 1986 |
Table 5
NMR-derived dynamic parameters for monodisperse apo N130 and a 2.5:1 rpL5:N130 soluble complex.
| Apo N130 (N-terminus/A2 tract) | 2.5:1 rpL5:N130 (N-terminus/A2 tract) | |
|---|---|---|
| (ns) | --a / 2.10 ± 0.05 | --a / 4.56 ± 0.06 |
| 0.16 ± 0.01a / 0.44 ± 0.01 | 0.26 ± 0.02a / 0.76 ± 0.01 |
-
aDynamic parameters for the N-terminus were determined using a global value; thus, the only residue-specific motional parameter for residues within the N-terminus was (see Materials and Methods).
Additional files
-
Supplementary file 1
NPM1 binding proteins, their identified R-motifs and predicted NoLSs.
- https://doi.org/10.7554/eLife.13571.030
-
Supplementary file 2
GO term associations of NPM1 binding proteins.
- https://doi.org/10.7554/eLife.13571.031
-
Supplementary file 3
Multiple R-motifs identified within the human proteome.
- https://doi.org/10.7554/eLife.13571.032
Download links
A two-part list of links to download the article, or parts of the article, in various formats.
Downloads (link to download the article as PDF)
Open citations (links to open the citations from this article in various online reference manager services)
Cite this article (links to download the citations from this article in formats compatible with various reference manager tools)
Nucleophosmin integrates within the nucleolus via multi-modal interactions with proteins displaying R-rich linear motifs and rRNA
eLife 5:e13571.
https://doi.org/10.7554/eLife.13571


