The role of piriform associative connections in odor categorization
- Northwestern University Feinberg School of Medicine, United States
- École Normale Supérieure, France
- Northwestern University Weinberg College of Arts and Sciences, United States
Figures
Figure 1
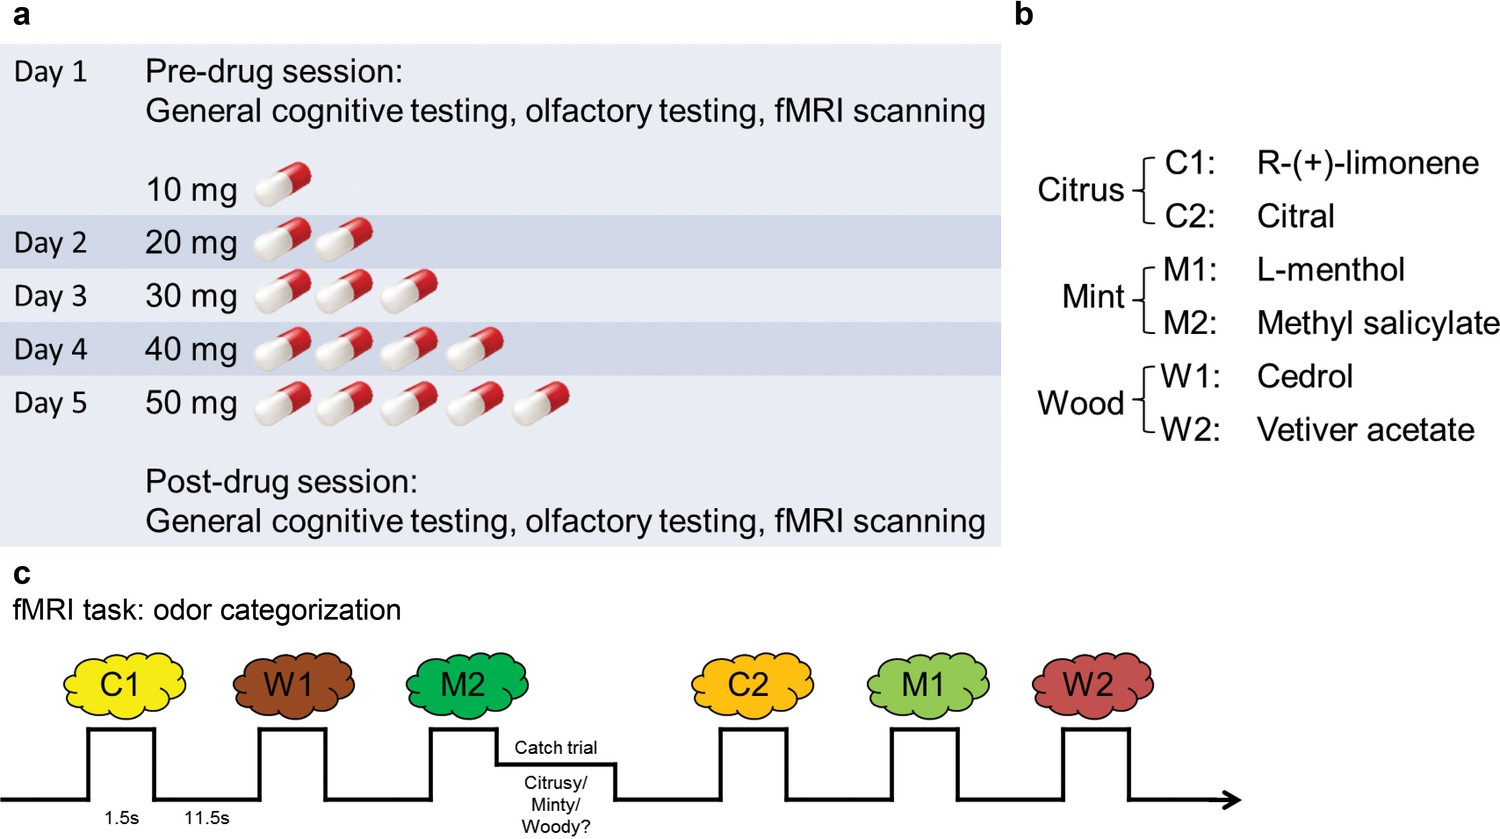
Experimental design.
(a) Timeline of the 5-d experiment involving pre- and post-drug test sessions and the drug administration schedule. (b) The six odorants included two stimuli for each of the three categories (citrus, mint, and wood). (c) Paradigm of the fMRI odor categorization experiment. Subjects were prompted to sniff when an odorant was presented. They were asked to focus on the quality of the odor. In 14% of the trials (designated as catch trials), after the odor presentation, a screen with the names of the three categories appeared and subjects indicated the category of the received odor with a mouse click.
Figure 2
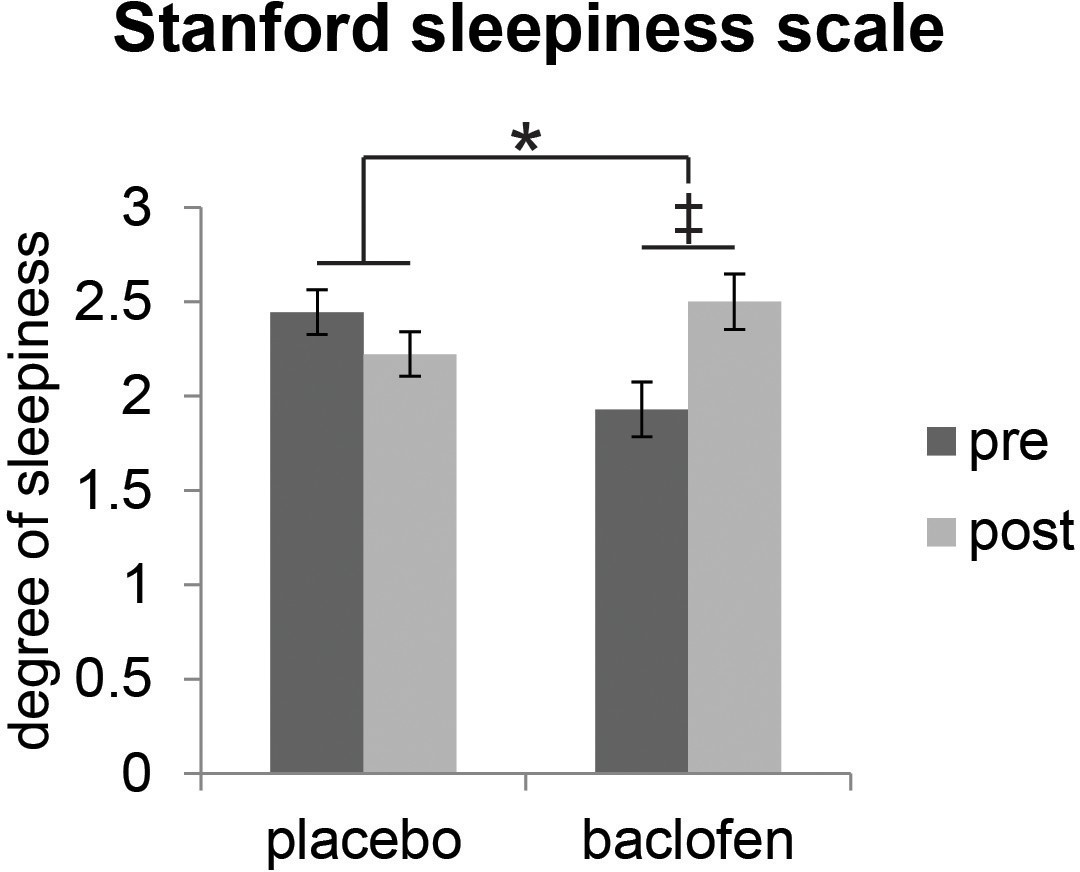
Effect of baclofen on subjective sleepiness.
Ratings from the Stanford Sleepiness Scale (1 = ‘wide awake’, 7 = ‘sleep onset soon’, mean ± within-subject s.e.m., placebo n = 18, baclofen n = 14) indicate that there was a significant interaction between drug groups (placebo vs. baclofen) and session (pre vs. post) (F1,30 = 4.57, P = 0.041; *P < 0.05). Post-hoc within-group comparisons showed no effect of session in placebo subjects (F1,17 = 0.88, P = 0.36), and a marginal effect of session in baclofen subjects (F1,13 = 3.85, ‡P = 0.072).
Figure 3

Subjects successfully classified odors into their relevant categories.
(a) Category descriptor ratings of the six odors (two citrus: C1, C2; two minty: M1, M2; two woody: W1, W2) from all subjects during the pre-drug session (mean ± within-subject s.e.m., n = 32). Repeated-measures ANOVA was conducted separately on each odor (** = P < 0.001). Subjects robustly classified the odors into the appropriate perceptual categories (C1: F1.86, 57.77 = 31.62; C2: F1.72, 53.40 = 74.58; M1: F1.92, 59.61 = 144.04; M2: F1.60, 49.46 = 373.79; W1: F1.82, 56.33 = 140.96; W2: F1.49, 46.10 = 166.84; all P’s < 0.001). (b) Average of category descriptor ratings across odors, sorted by within-category condition and across-category condition in pre- and post-drug sessions for placebo (n = 18) and baclofen (n = 14, mean ± within-subject s.e.m.) groups. (c) Pair-wise similarity ratings of within- and across-category odor pairs in pre- and post-drug sessions for placebo and baclofen groups (mean ± within-subject s.e.m.). (d) Fine odor discrimination between α- and β-pinene in pre- and post-drug sessions for placebo and baclofen groups (mean ± within-subject s.e.m.). (e) Dendrogram plots obtained from a cluster analysis of the average pair-wise similarity ratings for placebo and baclofen subjects during pre- and post-drug sessions showed that both groups sorted the six odors into three categories in both sessions. Shorter distance indicates greater similarity.
Figure 4
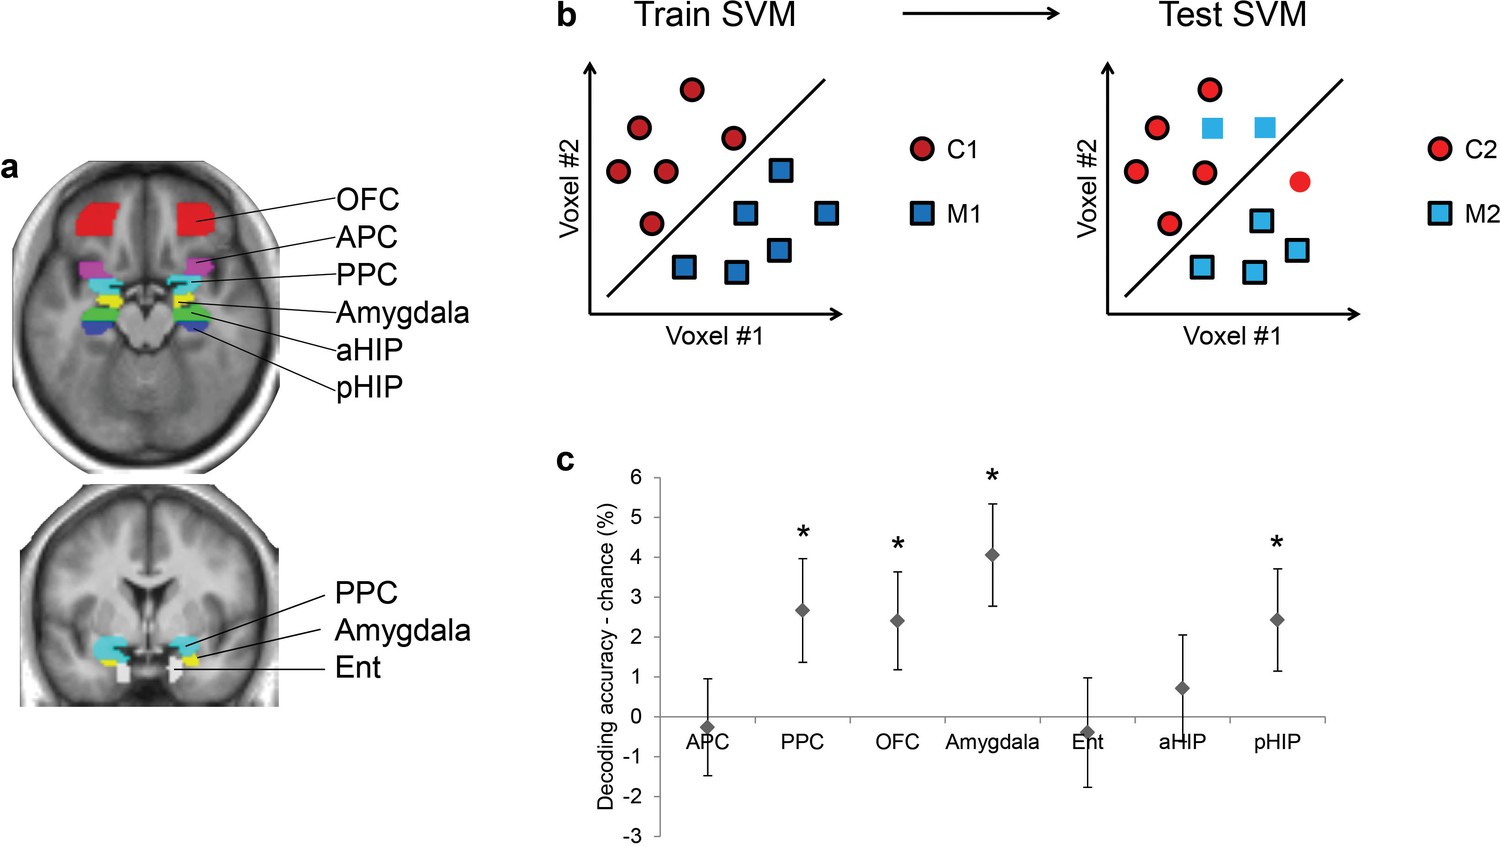
Ensemble pattern coding of odor category information at baseline (pre-baclofen session).
(a) Axial and coronal slices of the averaged, normalized T1-weighted structural scan from all subjects showing anatomically defined regions of interest. Odor-evoked ensemble patterns across all voxels within a given ROI were used in a two-step multivariate classification analysis. First, we trained a linear SVM on a training data-set (b, left panel) to separate two odors belonging to different categories. Second, odor category coding was assessed in an independent test data-set (b, right panel), specifically by testing how well the SVM classified the other pair of odors from the corresponding categories; here, cross-decoding is only successful if similar patterns code different odors of the same category. (c) Category decoding from all subjects during the pre-drug session showed that classification accuracy in PPC, OFC, amygdala, and pHIP significantly exceeded chance (mean ± between-subject s.e.m., n = 32, *P < 0.05, one-tailed).
Figure 5
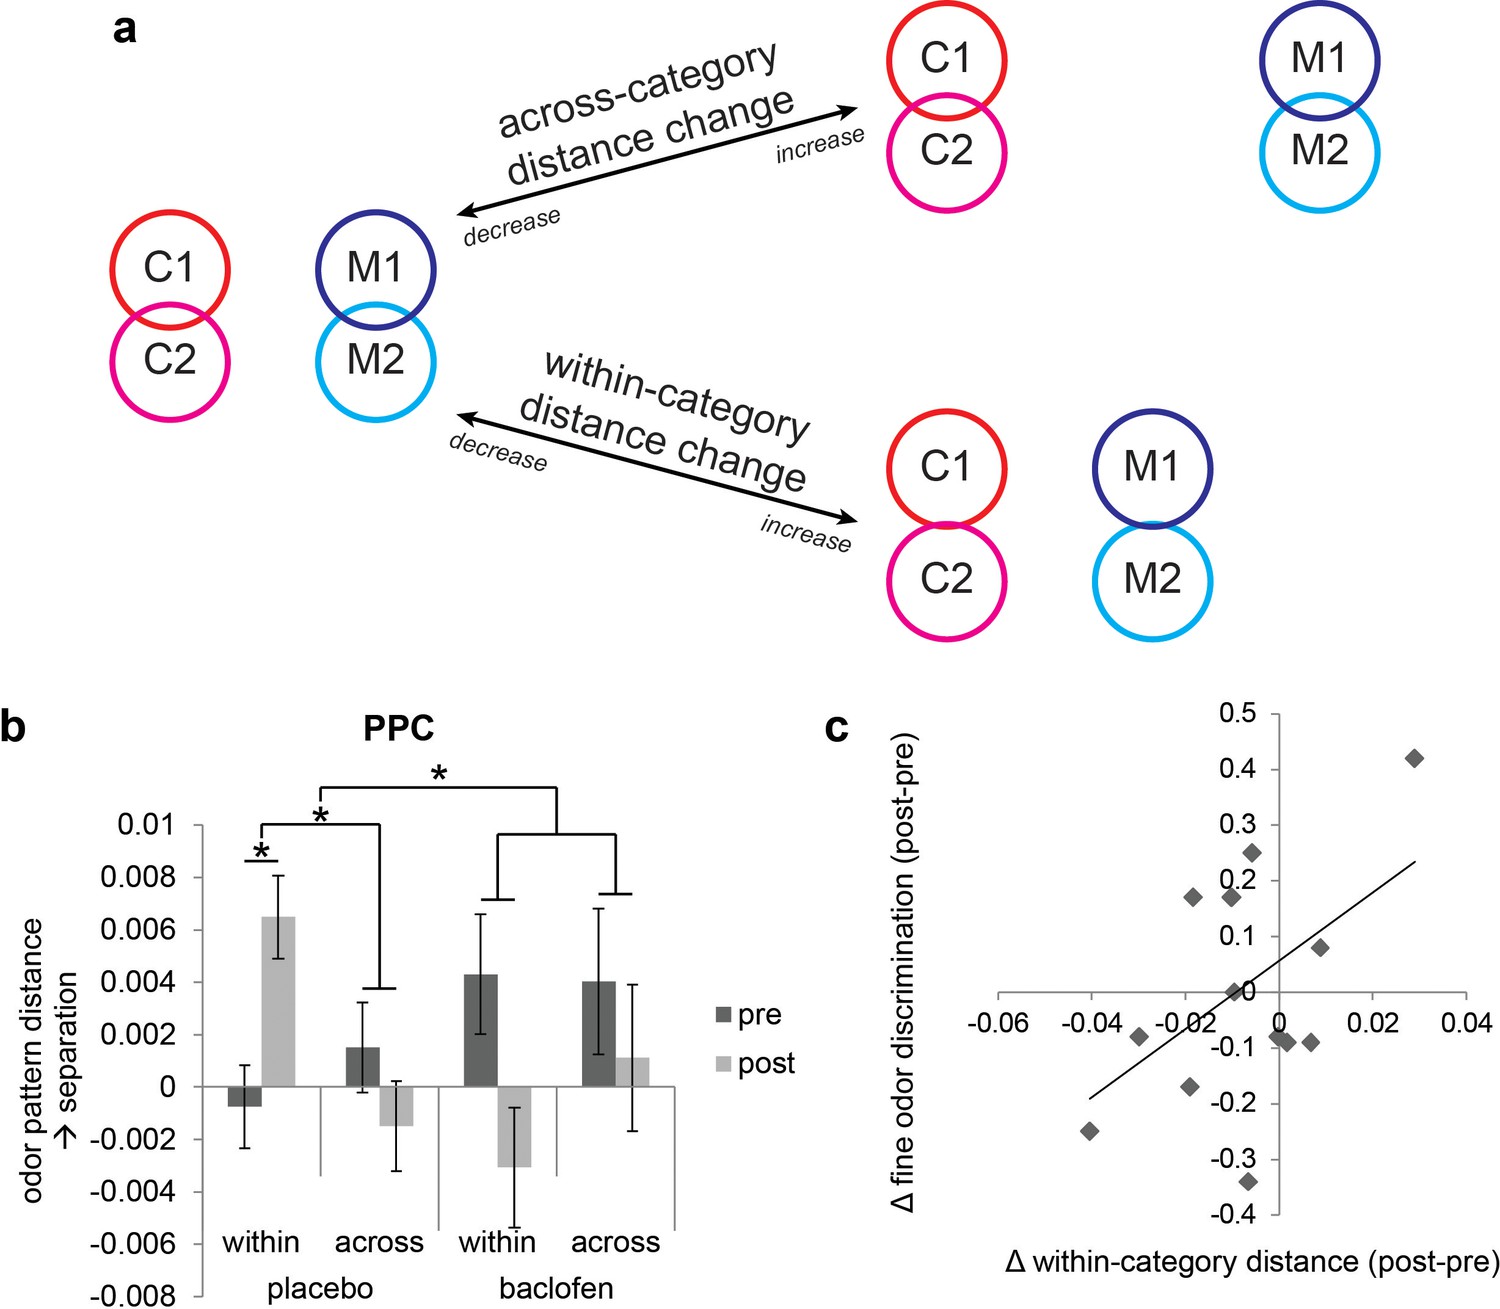
Baclofen effect on odor pattern changes in PPC.
(a) Schematic illustrating within-category and across-category relationships among categorically organized odors, and how changes of each distance parameter alter the categorical structure. Worse categorization emerges when within-category distances increase or when across-category distances decrease. Better categorization emerges when within-category distances decrease or when across-category distances increase. (b) Odor pattern distance in PPC in pre- and post-drug sessions, sorted by within-category and across-category distances, from placebo (n = 18) and baclofen (n = 14, mean ± within-subject s.e.m.) subjects. Placebo subjects showed increased within-category distances without across-category changes. There was no significant odor distance change in baclofen subjects. (c) A scatterplot showing the correlation between the magnitude of within-category odor pattern separation in PPC and behavioral changes in a fine odor-discrimination task, from pre- to post-drug session (ρ = 0.51, P = 0.031, n = 14, one-tailed). Each diamond represents one baclofen subject. *P<0.05.
Figure 6
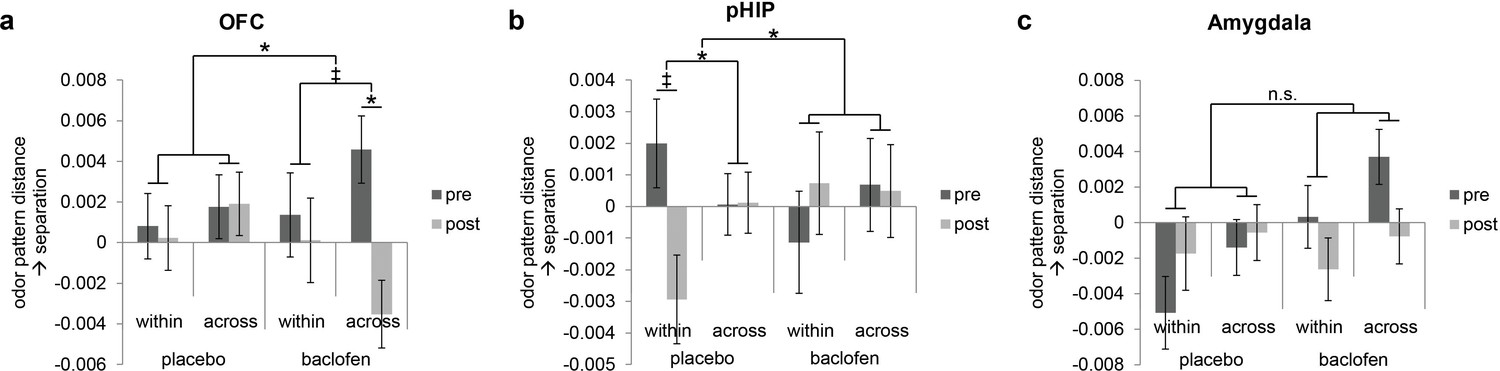
Baclofen effect on odor pattern changes in OFC and pHIP.
Odor pattern distances in (a) OFC, (b) pHIP, and (c) amygdala in pre- and post-drug sessions, sorted by within-category and across-category distances, for placebo (n = 18) and baclofen (n = 14, mean ± within-subject s.e.m.) subjects. (a) In the baclofen group, across-category distances in OFC decreased significantly without change in within-category distances, leading to disrupted categorical structure. There was no change in the placebo group. (b) In pHIP, the placebo group showed a trend decrease in within-category odor distances without change in across-category distances. There was no significant odor distance change in the baclofen group. (c) In amygdala there was no baclofen effect on the categorical representation of odors. ‡ P<0.1, *P<0.05.
Figure 7
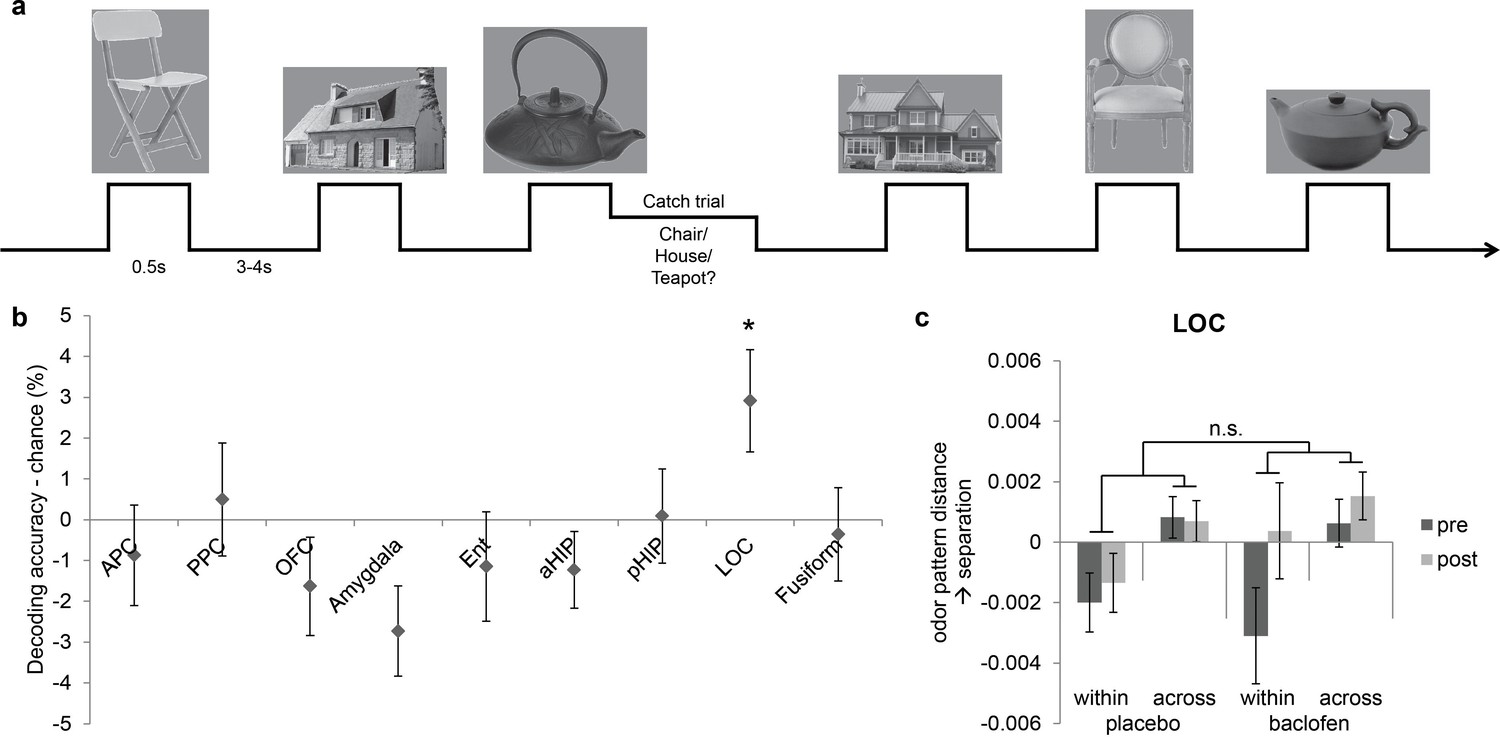
Visual control experiment.
(a) Paradigm of the fMRI visual categorization experiment. Subjects viewed six images belonging to three categories. On catch trials that occasionally followed image presentations, names of the three categories appeared on screen, and subjects indicated the category of the image with a mouse click. (b) Visual category decoding from all subjects during the pre-drug session showed that classification accuracy in LOC significantly exceeded chance (*P = 0.013, one-tailed). (c) The effect of baclofen on visual categorical representations in LOC was not significant (P = 0.50).
Tables
Table 1
Behavioral performance.
| Task | Placebo (n = 18) | Baclofen (n = 14) | P value of group × session interaction | ||
|---|---|---|---|---|---|
| Pre | Post | Pre | Post | ||
| MMSE | 29.89 ± 0.11 | 29.94 ± 0.06 | 29.93 ± 0.07 | 30.00 ± 0 | 0.86 |
| Digit span (forward) | 7.22 ± 0.22 | 7.72 ± 0.14 | 7.14 ± 0.31 | 7.43 ± 0.20 | 0.55 |
| Digit span (backward) | 6.00 ± 0.20 | 6.00 ± 0.29 | 5.57 ± 0.31 | 5.71 ± 0.27 | 0.69 |
| Trail making test B (s) | 48.32 ± 2.70 | 39.05 ± 2.01 | 57.62 ± 5.42 | 47.11 ± 5.67 | 0.85 |
| Stanford sleepiness scale | 2.44 ± 0.17 | 2.22 ± 0.21 | 1.93 ± 0.20 | 2.50 ± 0.33 | 0.041* |
| Sniffin’ Sticks (odor detection threshold) | 7.08 ± 0.84 | 9.65 ± 1.06 | 7.82 ± 0.95 | 8.57 ± 1.01 | 0.22 |
| UPSIT (odor identification) | 36.28 ± 0.61 | 36.00 ± 0.56 | 34.57 ± 0.49 | 33.79 ± 0.63 | 0.55 |
| α- vs. β-pinene triangle test (fine odor discrimination) | 0.66 ± 0.05 | 0.72 ± 0.05 | 0.72 ± 0.05 | 0.73 ± 0.07 | 0.45 |
| Odor intensity ratings | 4.00 ± 0.32 | 4.13 ± 0.31 | 3.05 ± 0.18 | 2.91 ± 0.28 | 0.39 |
| Odor pleasantness ratings | 5.43 ± 0.16 | 5.63 ± 0.16 | 5.64 ± 0.13 | 5.63 ± 0.16 | 0.12 |
| Odor category descriptor ratings (within – across) | 7.47 ± 0.44 | 7.49 ± 0.36 | 7.44 ± 0.46 | 7.78 ± 0.34 | 0.59 |
| Odor pairwise similarity ratings (within – across) | 4.16 ± 0.60 | 5.14 ± 0.55 | 3.93 ± 0.32 | 4.53 ± 0.44 | 0.59 |
| Odor categorization catch trial accuracy | 0.87 ± 0.04 | 0.89 ± 0.03 | 0.81 ± 0.04 | 0.81 ± 0.04 | 0.80 |
| Odor categorization catch trial RT (s) | 3.29 ± 0.23 | 2.85 ± 0.15 | 3.89 ± 0.38 | 3.48 ± 0.34 | 0.93 |
| Visual categorization catch trial accuracy | 0.97 ± 0.01 (n = 14) | 0.99 ± 0.004 | 0.97 ± 0.01 (n = 11) | 0.96 ± 0.01 | 0.21 |
| Visual categorization catch trial RT (s) | 0.42 ± 0.02 | 0.40 ± 0.03 | 0.44 ± 0.04 | 0.52 ± 0.06 | 0.25 |
-
Data are shown for cognitive and olfactory tests, as well as for behavioral performance in fMRI experiments from placebo and baclofen groups in pre- and post-drug sessions. Scores are presented as mean ± s.e.m. P values reported are for the interaction effects between group and session, based on a 2-way ANOVA, with one between-group ‘drug’ factor (placebo/baclofen) and one within-subject ‘session’ factor (pre/post). *P < 0.05.
Download links
A two-part list of links to download the article, or parts of the article, in various formats.
Downloads (link to download the article as PDF)
Open citations (links to open the citations from this article in various online reference manager services)
Cite this article (links to download the citations from this article in formats compatible with various reference manager tools)
The role of piriform associative connections in odor categorization
eLife 5:e13732.
https://doi.org/10.7554/eLife.13732


