Distinct roles of visual, parietal, and frontal motor cortices in memory-guided sensorimotor decisions
- Massachusetts Institute of Technology, United States
- University of California, Santa Barbara, United States
Figures
Figure 1 with 3 supplements
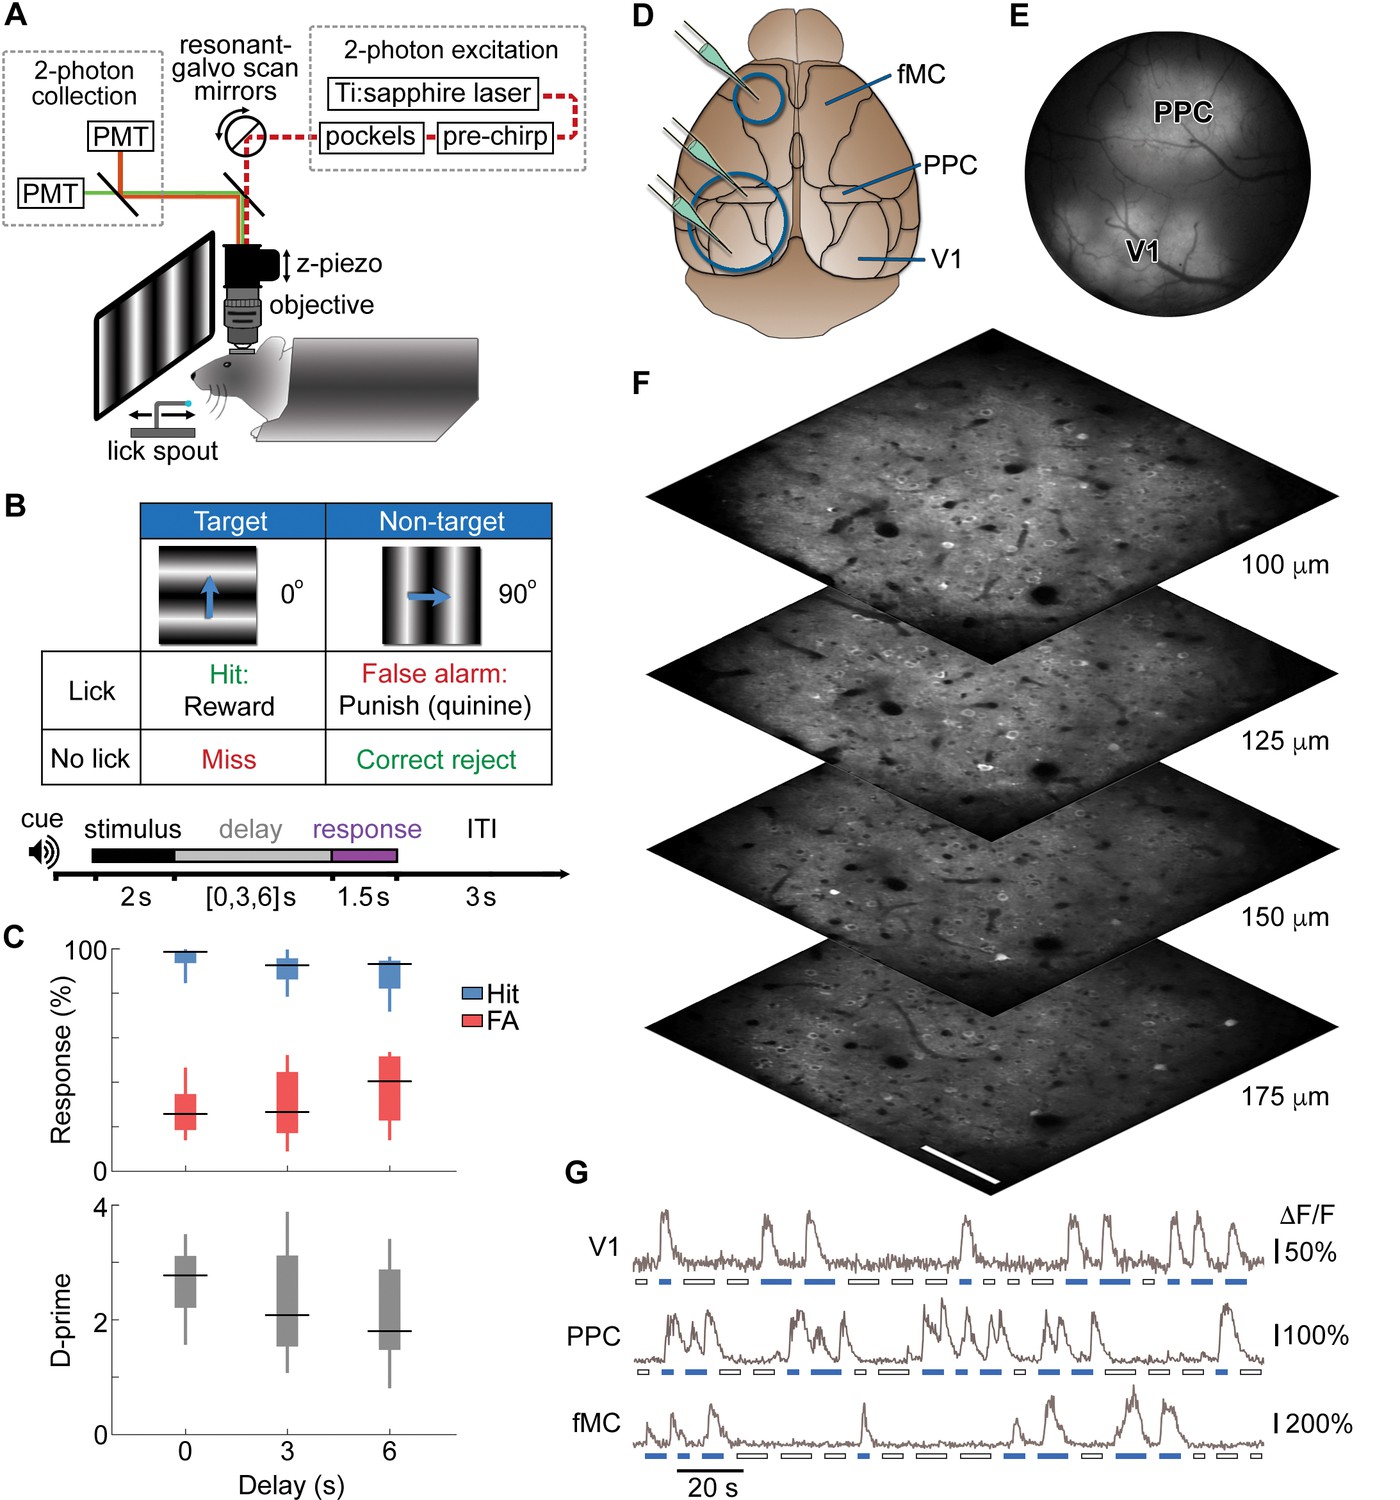
Calcium imaging during a memory-guided task.
(A) Experimental setup for 2-photon imaging in head-fixed mice performing a memory-guided visual discrimination task. The mode-locked infrared laser (dotted red line) was raster scanned at a high rate using resonant-galvo scan mirrors, which were synchronized to a z-piezo to allow volumetric imaging. A retractable lick spout was used to restrict the timing of behavioral responses to a specific epoch of the task. (B) Contingency table (top) and trial structure of the memory-guided visual discrimination task (bottom). Licks to the target orientation were rewarded with water, whereas licks to the non-target orientation were punished with quinine. Trials consisted of stimulus, delay, and response epochs, and the retractable spout was within reach only during the response epoch. Trials of three different delays (0, 3, or 6 s) were randomly interleaved. (C) Average behavioral performance (n = 8 mice across 80 sessions). Top, Response rate for target stimuli (hit rate; blue) and non-target stimuli (false alarm rate; red). Bottom, D-prime for delays of 0–6 s; performance is significantly above chance for all delays (p < 10–9, t-test). (D) Location of cranial windows (blue circles) and AAV-GCaMP6s injections (green pipettes) in primary visual cortex (V1), posterior parietal cortex (PPC), and frontal motor cortex (fMC). Schematic modified from Allen Brain Atlas (http://www.brain-map.org). (E) Example wide-field epifluorescence image of GCaMP6s expression in both V1 and PPC (window diameter, 4 mm). (F) Four imaging planes (25 µm apart) within V1 acquired at a stack rate of 5 Hz using a resonance scanner synchronized with a Z-piezo. Images were collected at 2x zoom for clarity. Scale bar, 100 µm. (G) Sample raw ∆F/F traces from V1, PPC, and fMC during interleaved target (blue bars) and non-target (white bars) trials of varying delay duration.
Figure 1—figure supplement 1
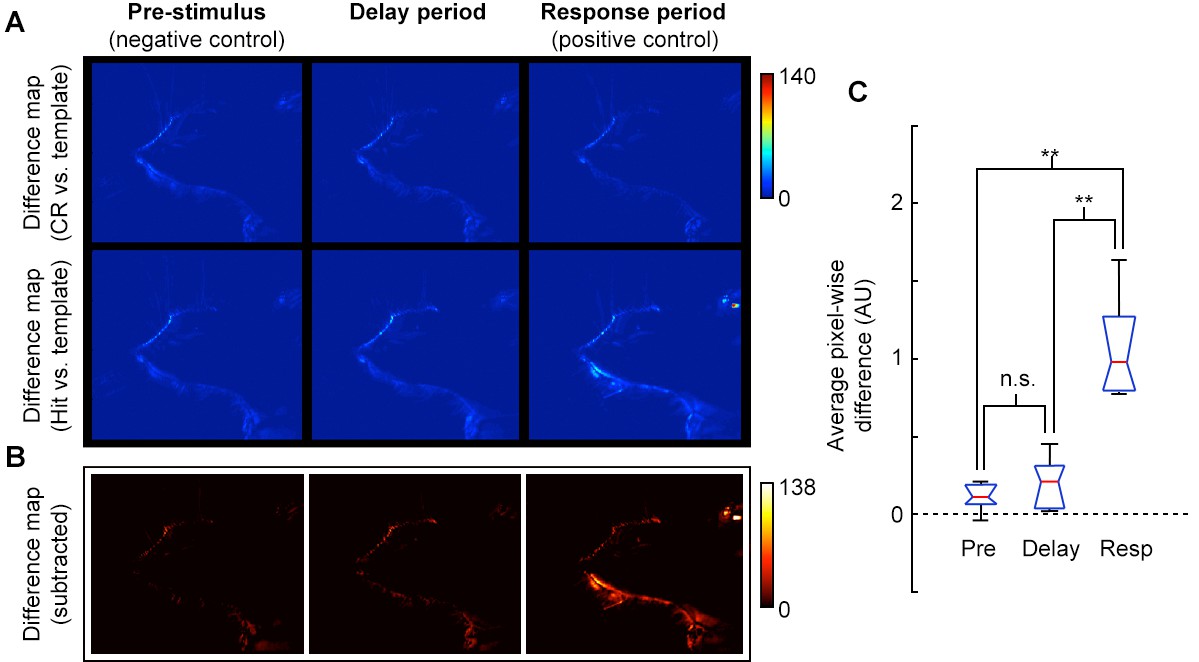
Video analysis of movement during delay period.
(A) Pixel-wise absolute difference map between CR template (average of CR frames) and individual CR frames (top row) or Hit frames (bottom) for pre-stimulus, delay, and response epochs of task. Movements relative to the template will appear as bright spots on the difference map. (B) Absolute difference of CR-template difference map (A, top row) from Hit-template difference map (A, bottom row) to reveal pixels that changed during Hit trials. Movement or postural adjustments during Hit trials will appear as hot spots on the difference map (e.g., see hot spots near the mouth, eye, and ear for Response epoch). (C) Box plot (red, median; blue, quartile; black, range) of average pixel-wise differences for pre-stimulus epoch (Pre), delay epoch (Delay) and response epoch (Resp) across sessions. The average pixel-wise difference during the Delay epoch was not significantly different from the Pre epoch, (p = 0.39), but both Pre and Delay were significantly different from the Response epoch (p = 0.005 and p = 0.009, respectively; t-test; n = 5 sessions, consisting of 3040 frames from 41 trials across 3 mice; all mice at plateau performance levels).
Figure 1—figure supplement 2

Large-scale volume imaging of neural activity.
(A) Image stack showing pixel-wise orientation tuning (color) for four planes in V1 imaged at a stack rate of 5 Hz (scale bar, 150 μm). Similarly tuned neurons (same colors) are spatially intermixed, as has previously been observed in rodents. (B) Normalized ΔF/F traces for 695 active neurons selected from the image stack in a showing average response (6 repeats) to a presentation of drifting gratings (bottom; 4 s on, 4 s off, 30 degree increments). Neurons have been sorted by orientation preference. Note that most neurons respond both to a preferred orientation and direction and to the opposite direction, but not the orthogonal orientation. (C) Histogram of OSI showing the majority of active V1 neurons exhibit orientation selectivity. Orientation selectivity was calculated as OSI = (Rpref- Rorth)/(Rpref + Rorth), where Rpref is the integrated response at the preferred orientation (θpref), and Rorth is the integrated response at the orthogonal (θpref + p/2) orientation.
Figure 1—figure supplement 3
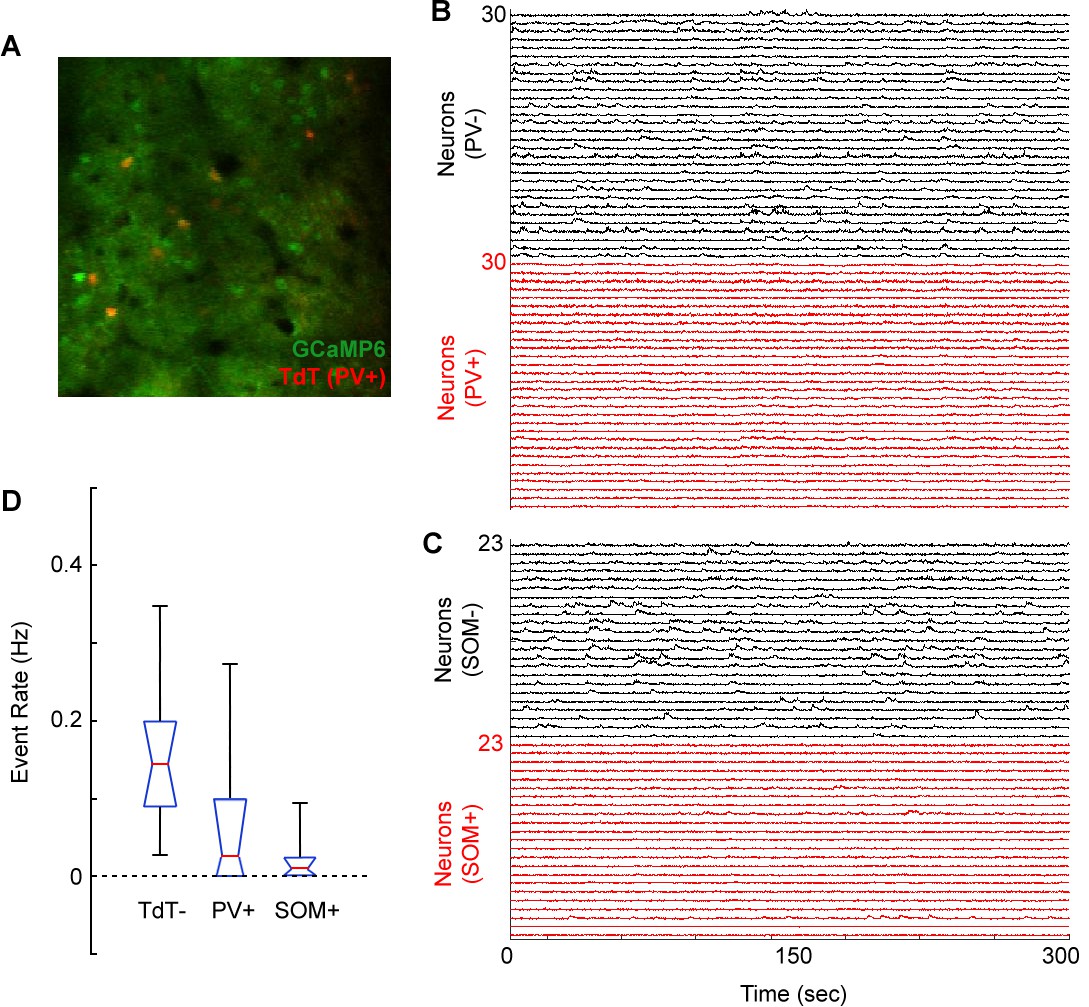
Weak calcium responses in identified cortical interneurons during volume scanning.
(A) Merged image showing GCaMP6s expression (Green) and tdTomato expression (red) in a PV-Cre X Floxed-tdTomato mouse in region V1. (B) Normalized ΔF/F traces for 30 tdTomato-negative (putative excitatory) neurons and 30 tdTomato-positive (PV+) neurons imaged in a PV-Cre X Floxed-tdTomato mouse. (C) Normalized ΔF/F traces for 23 tdTomato-negative (putative excitatory) neurons and 23 tdTomato-positive (SOM+) neurons imaged in a SOM-Cre X Floxed-tdTomato mouse. (D) Box plot (red, median; blue, quartile; black, range) of event rate (Hz) for tdTomato-negative (putative excitatory), PV+, and SOM+ neurons over the course of 5 min of visual stimulation (random gratings). Events were coded as sustained transients >2 standard deviations above baseline.
Figure 2 with 1 supplement
Single neurons exhibit heterogeneous trial-evoked responses.
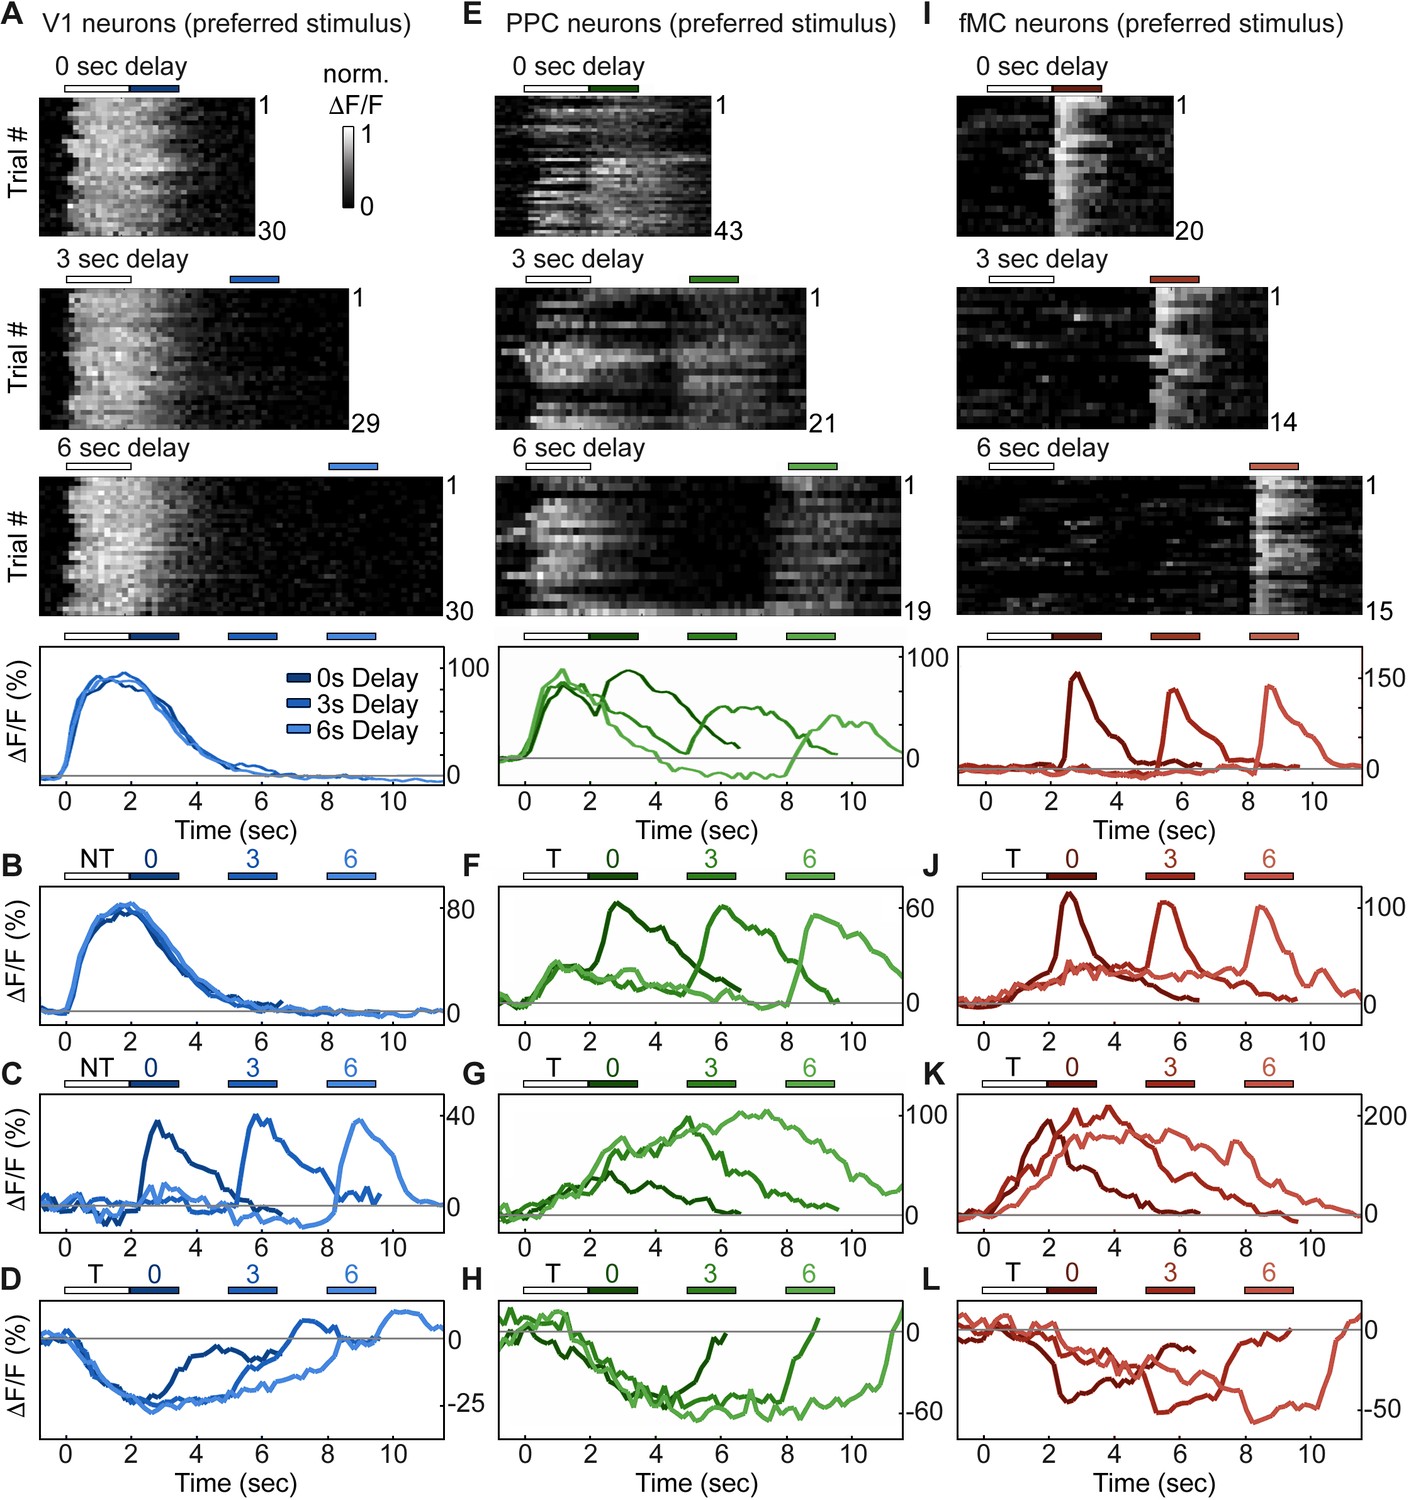
(A) Trial-to-trial and average responses from a single V1 neuron. Top three plots, stacked single-trial ∆F/F responses to the preferred stimulus (correct trials only), grouped into 0-, 3-, and 6-second delay trials. The neuron is active during the stimulus for all three delays. Colored bars above plots indicate time of visual stimulus (white) and spout extension (blue, shade indicates delay period). Bottom plot, overlay of mean ∆F/F responses during 0-, 3-, and 6-s delay trials. Shade of average traces indicates delay period (dark blue, 0-s delay; medium blue, 3-s delay, light blue, 6-s delay). Additional V1 example neurons exhibiting activity during the stimulus period (B), response period (C), or suppressed activity throughout the delay period (D). Color shade indicates delay as in (A). (E) Same as (A) but for a PPC neuron. This neuron is active during both stimulus and response period. Colored bars above plots indicate time of visual stimulus (white) and spout extension (green, shade indicates delay period). Bottom plot, overlay of mean ∆F/F responses during 0-, 3-, and 6-s delay trials. Shade of average traces indicates delay period (dark green, 0-s delay; medium green, 3-s delay, light green, 6-s delay). Additional PPC example neurons exhibiting activity during the stimulus and response period (F), sustained activity during the delay period (G), or suppressed activity throughout the delay period (H). Color shade indicates delay as in (E). (I) Same as (A) but for a fMC neuron. This neuron is active during the response period. Colored bars above plots indicate time of visual stimulus (white) and spout extension (red, shade indicates delay period). Bottom plot, overlay of mean ∆F/F responses during 0-, 3-, and 6-s delay trials. Shade of average traces indicates delay period (dark red, 0-s delay; medium red, 3-s delay, light red, 6-s delay). Additional fMC example neurons exhibiting activity during the delay and response period (J), during only the delay period (K), or suppressed activity throughout the delay period (L). Color shade indicates delay as in (I).
Figure 2—figure supplement 1
Electrophysiological recordings of enhanced and suppressed neurons in V1.
(A) Trial-to-trial and average responses from a single V1 neuron exhibiting enhanced spiking activity to the preferred stimulus. Top three plots, spike raster plots showing responses during the preferred stimulus (correct trials only), grouped into 0-, 3-, and 6-second delay trials. The neuron is active during the stimulus for all three delays. Colored bars above plots indicate time of visual stimulus (white) and spout extension (blue, shade indicates delay period). Bottom plot, overlay of mean ∆F/F responses during 0-, 3-, and 6-s delay trials. Shade of average traces indicates delay period (dark blue, 0-s delay; medium blue, 3-s delay, light blue, 6-s delay). (B) A second example V1 neuron showing enhanced spiking activity to the preferred stimulus; shading as in (A). (C) Trial-to-trial and average responses for a V1 neuron showing suppressed spiking activity to both stimuli. Bars and shading as in (A). (D) A second example V1 neuron showing suppressed spiking activity to both stimuli; shading as in (A).
Figure 3 with 3 supplements
Clustering reveals distinct response types distributed between regions.
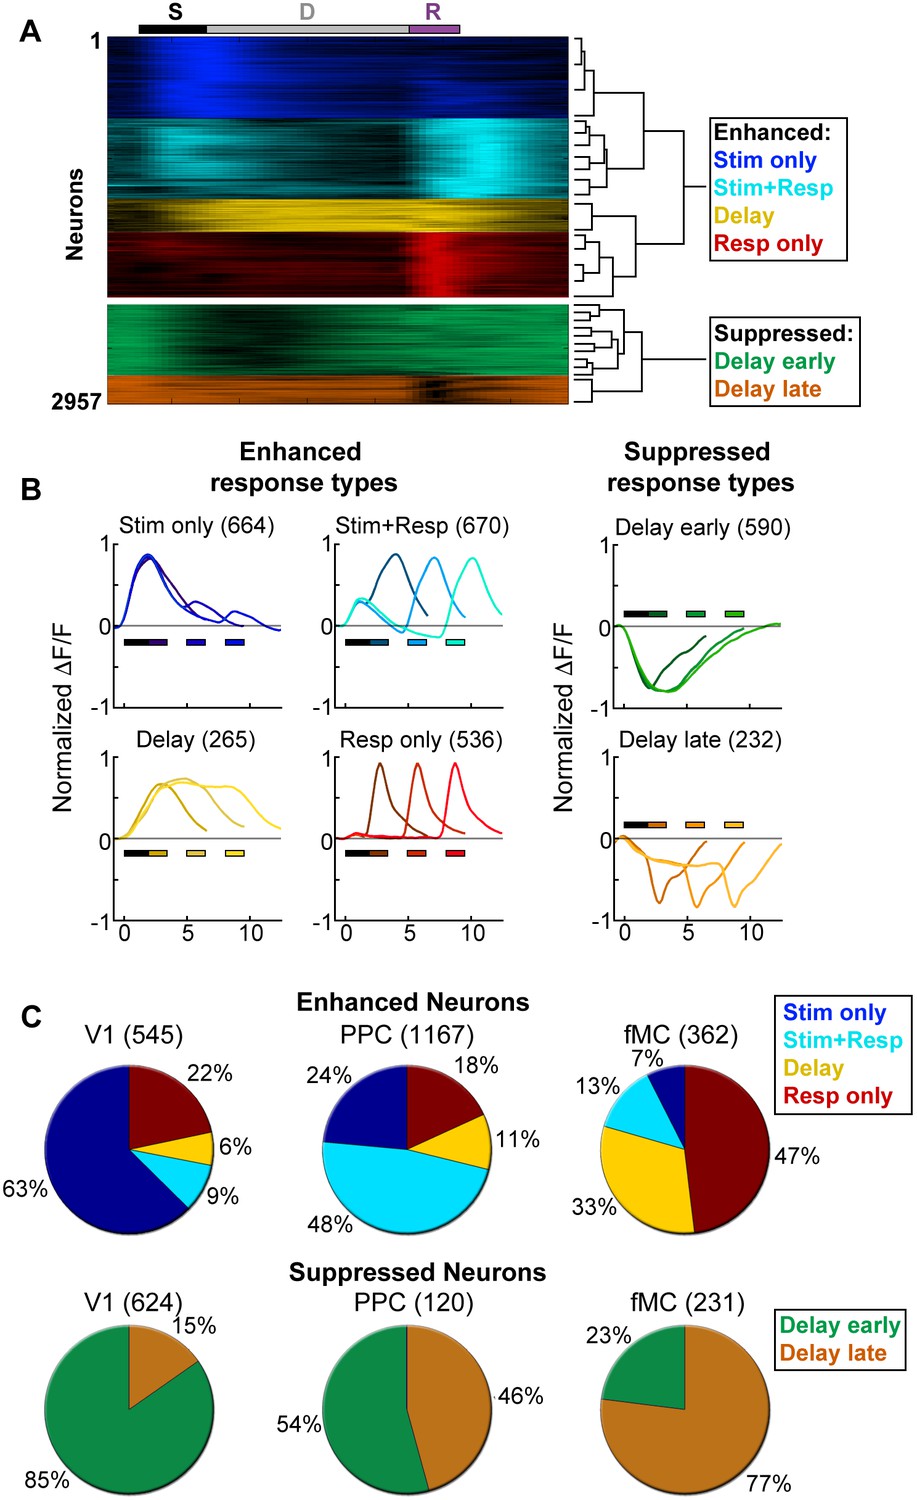
Hierarchical clustering was performed on the first 20 principal components (explaining >98% of the variance), revealing six separable clusters. Further cluster division resulted in separation of very similar response types. (A) Normalized calcium response to the preferred stimulus (correct trials only) of each neuron for the 6 s delay condition, separated by cluster identity (color indicates cluster). Bars at top of plot indicate time of visual stimulus (white), delay (grey), and spout extension (purple). Right inset shows a dendrogram resulting from the hierarchical clustering procedure and cluster names. (B) Average normalized response of each cluster for all delay durations, separated by enhanced and suppressed clusters. Titles indicate the name of the response type cluster and the number of neurons included. Response color indicates cluster identity. Colored bars indicate time of visual stimulus (white) and spout extension (color indicates cluster, shade indicates delay duration). (C) Proportion of neurons in V1 (n = 1169), PPC (n = 1287) and fMC (n = 593) of each response class.
Figure 3—figure supplement 1
Example V1 neuron responses.
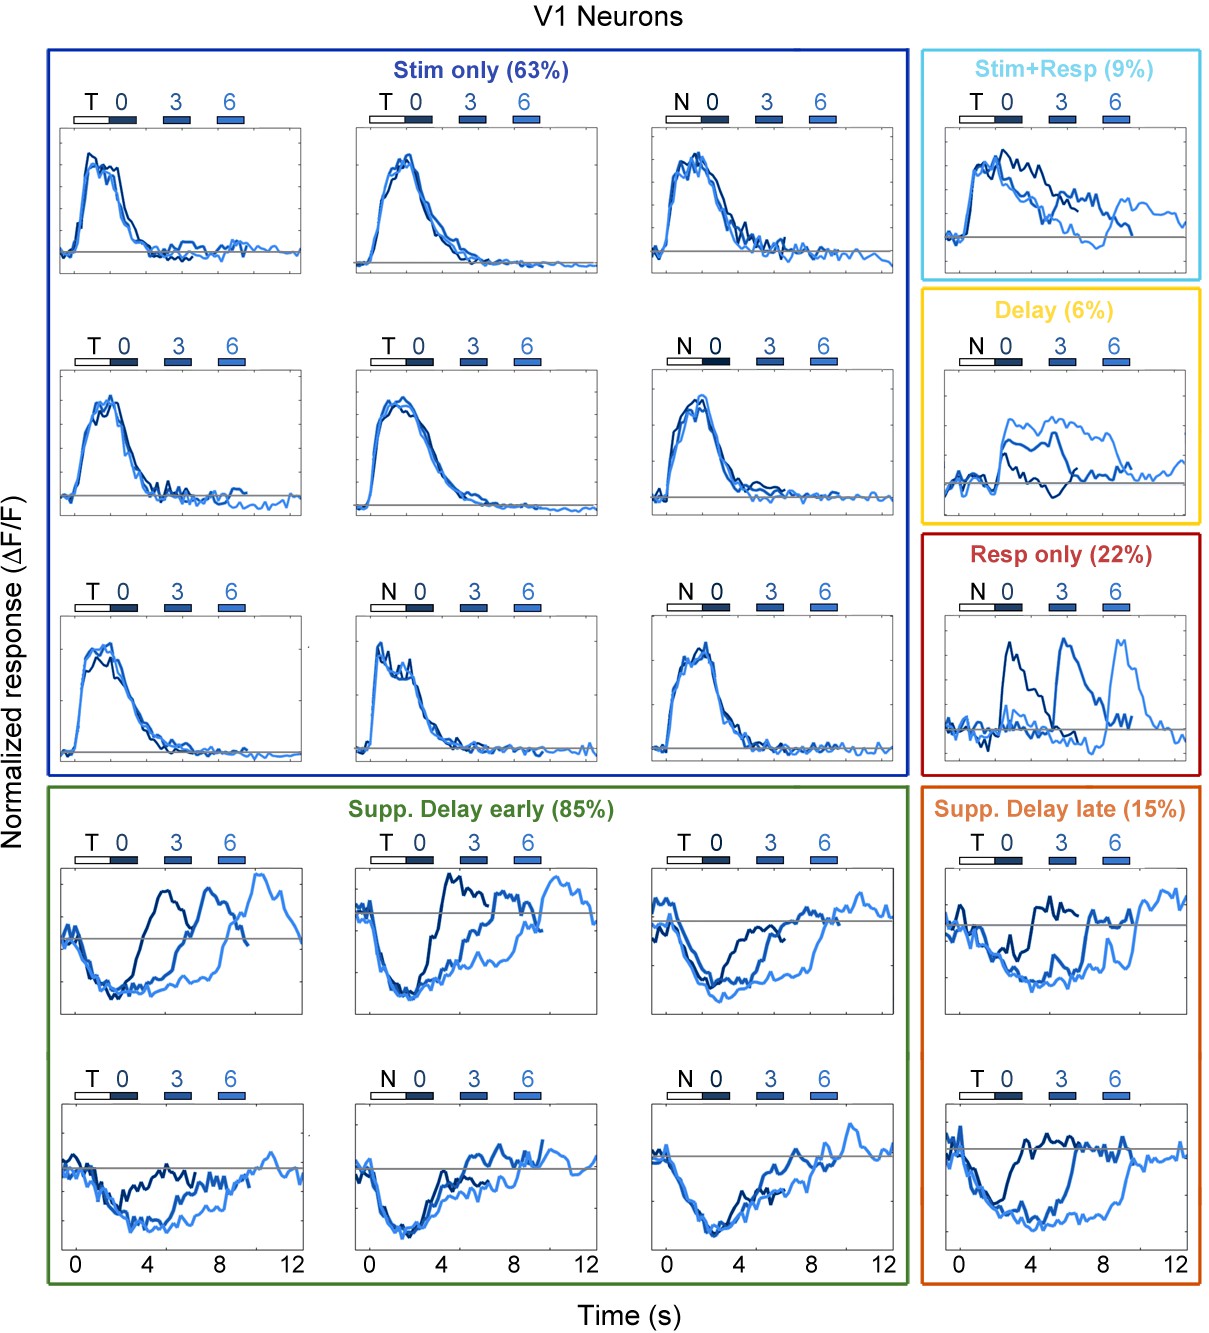
Average responses (normalized ΔF/F) for 20 V1 neurons during the sensorimotor decision task. Neurons are sorted by response class indicated by color-coded boxes (Stim only, dark blue; Stim+Resp, cyan; Delay, yellow; Resp only, red; Supp. Delay early, green; Supp. Delay late, orange; see Figure 3). The white bar indicates stimulus presentation (T: target, N: non-target), and the blue bars indicate the response period for 0 s (dark blue), 3 s (medium blue), and 6 s (light blue) trials. Average responses are color coded in the same manner, with lighter shade indicating a longer delay. Neuron response types were chosen to be roughly proportional of the entire population of V1 neurons (Figure 3).
Figure 3—figure supplement 2
Example PPC neuron responses.
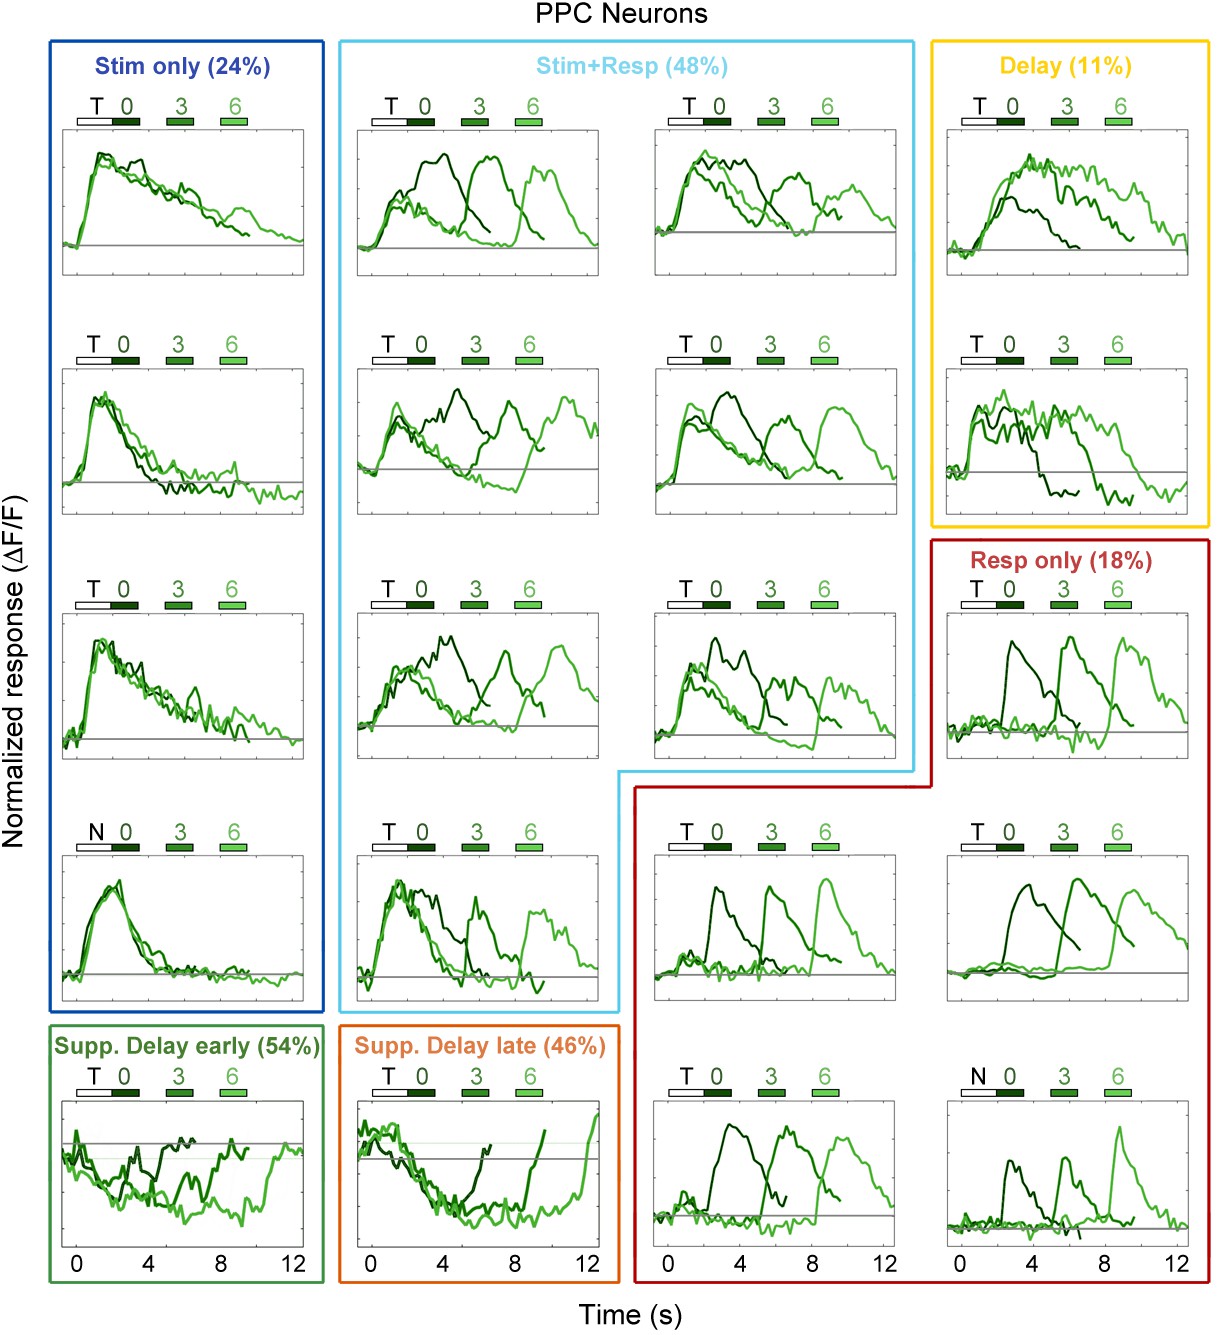
Average responses (normalized ΔF/F) for 20 PPC neurons during the sensorimotor decision task. Neurons are sorted by response class indicated by color-coded boxes (Stim only, dark blue; Stim+Resp, cyan; Delay, yellow; Resp only, red; Supp. Delay early, green; Supp. Delay late, orange; see Figure 3). The white bar indicates stimulus presentation (T: target, N: non-target), and the blue bars indicate the response period for 0 s (dark green), 3 s (medium green), and 6 s (light green) trials. Average responses are color coded in the same manner, with lighter shade indicating a longer delay. Neuron response types were chosen to be roughly proportional of the entire population of PPC neurons (Figure 3).
Figure 3—figure supplement 3
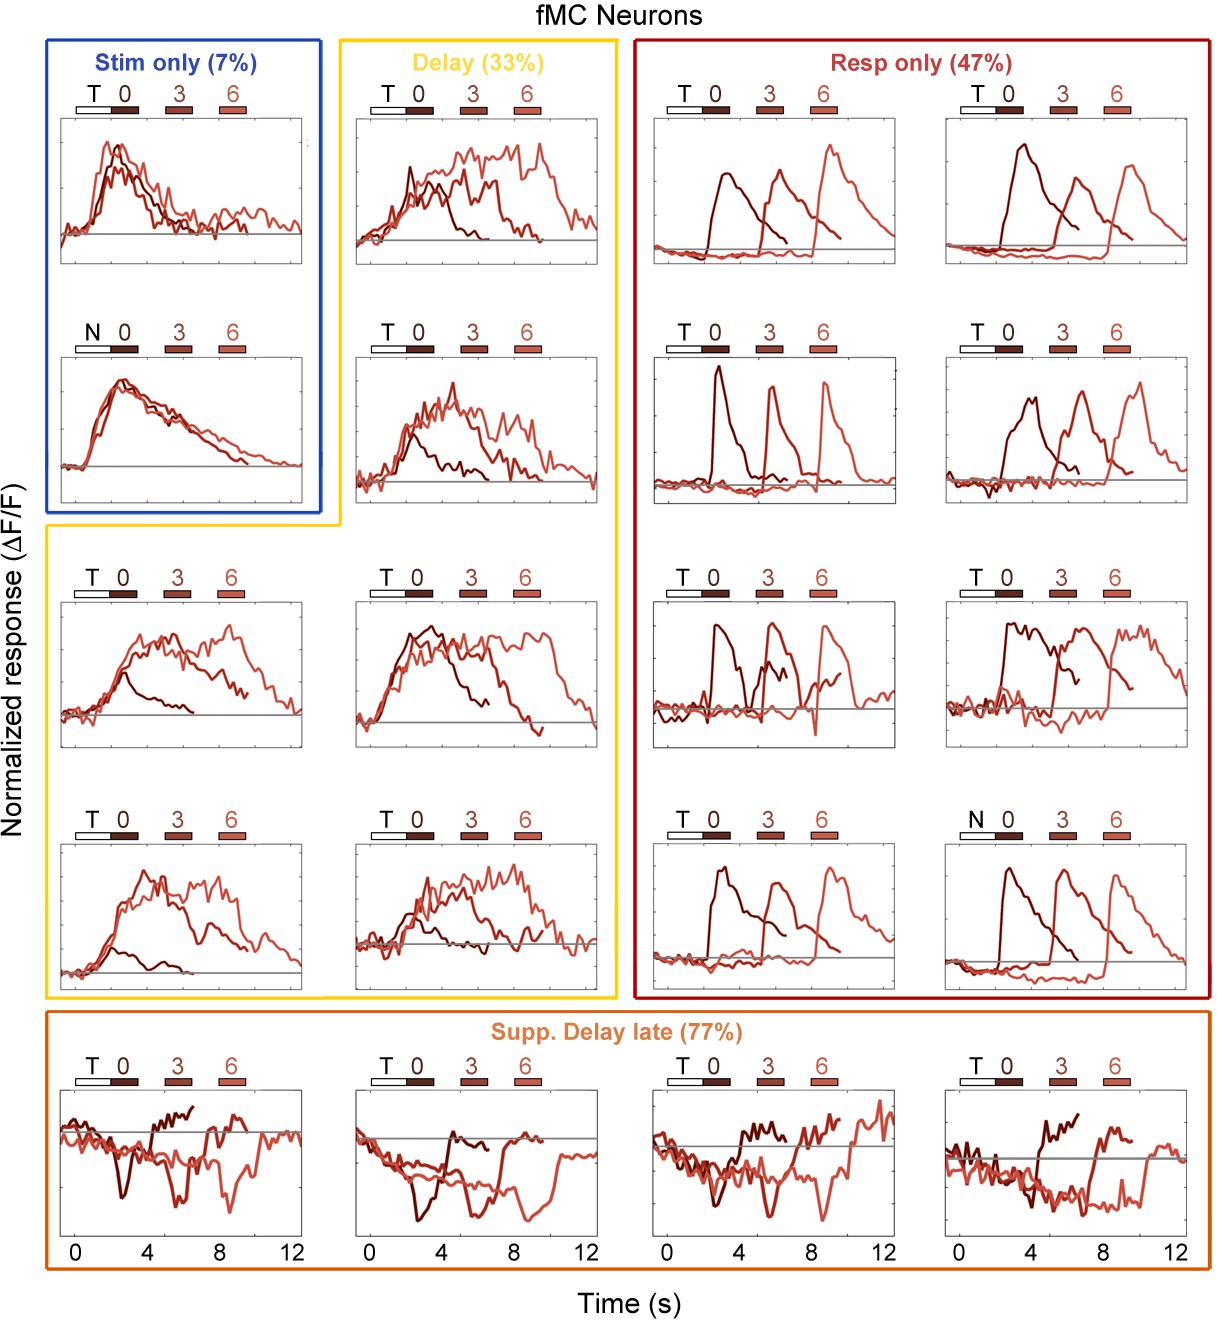
Example fMC neuron responses.
Average responses (normalized ΔF/F) for 20 fMC neurons during the sensorimotor decision task. Neurons are sorted by response class indicated by color-coded boxes (Stim only, dark blue; Stim+Resp, cyan; Delay, yellow; Resp only, red; Supp. Delay early, green; Supp. Delay late, orange; see Figure 3). The white bar indicates stimulus presentation (T: target, N: non-target), and the blue bars indicate the response period for 0 s (dark red), 3 s (medium red), and 6 s (light red) trials. Average responses are color coded in the same manner, with lighter shade indicating a longer delay. Neuron response types were chosen to be roughly proportional of the entire population of fMC neurons (Figure 3).
Figure 4
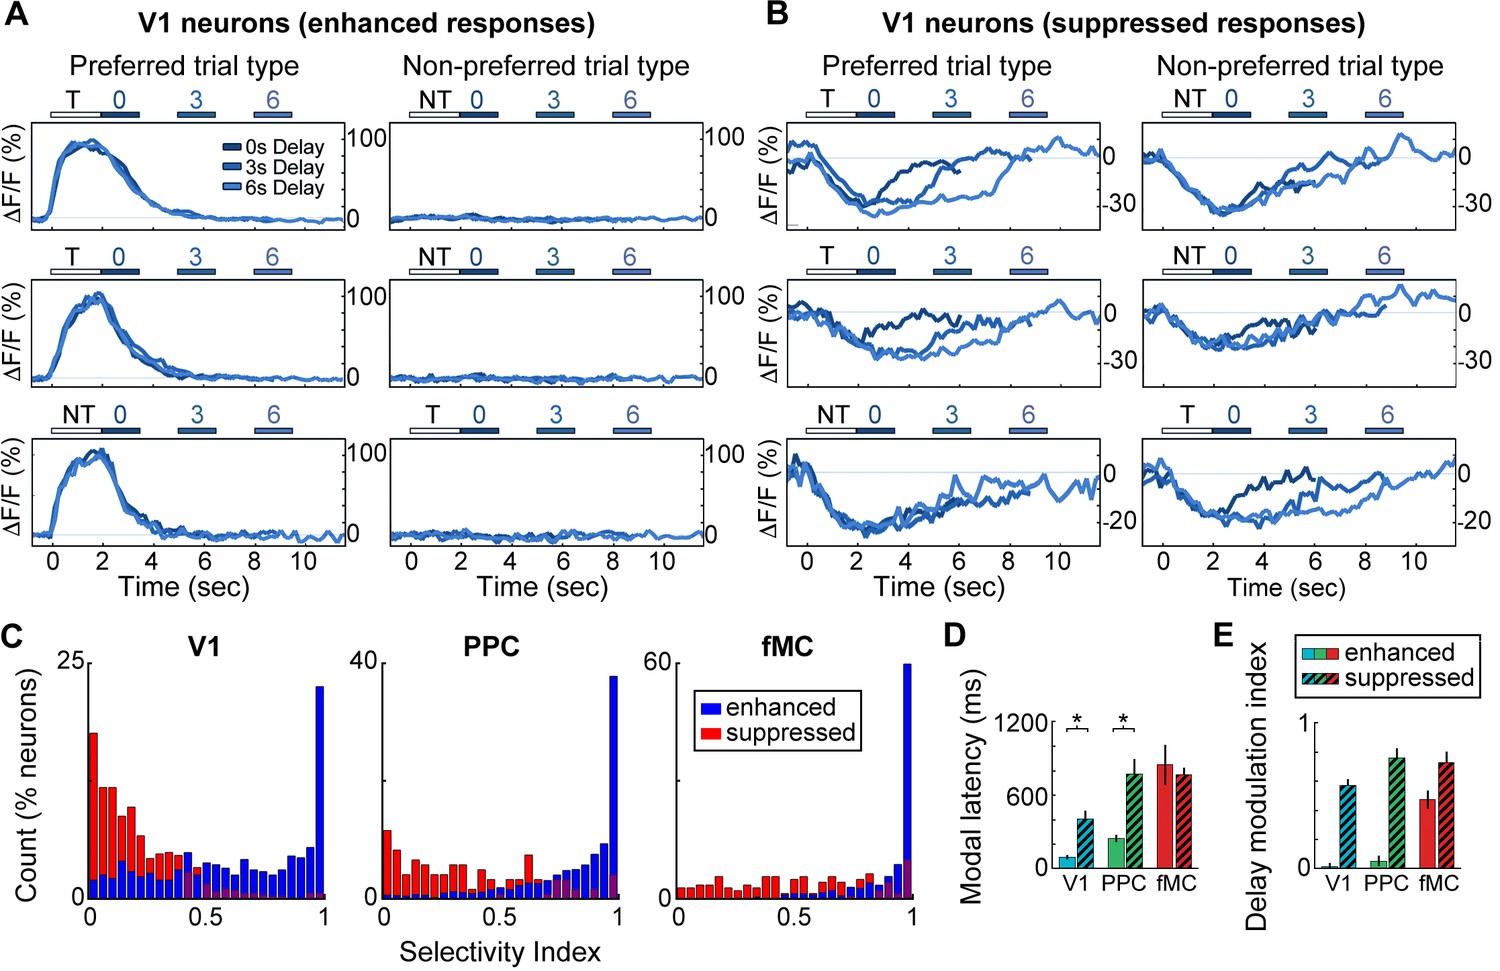
Neurons with suppressed activity are much less selective than neurons with enhanced activity.
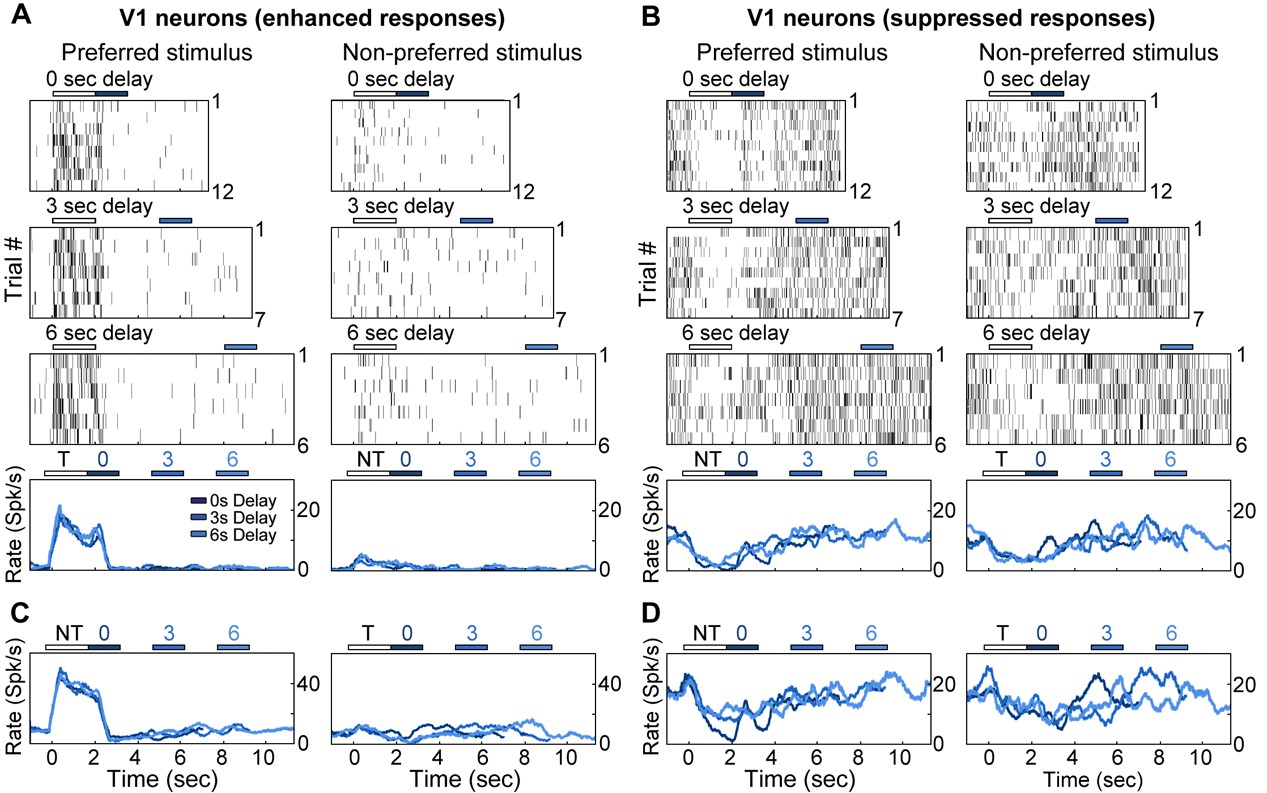
(A) Three example V1 neurons (top, middle, bottom) with enhanced task-driven activity. Responses shown for preferred stimulus (left) and non-preferred stimulus (right), including only correct trials. Each plot shows an overlay of the mean ∆F/F responses during 0-, 3-, and 6-s delay trials. Colored bars above plots indicate time of visual stimulus (white; T, target stimulus; NT, non-target stimulus) and spout extension (blue, shade indicates delay period). Shade of average traces indicates delay period (dark blue, 0-s delay; medium blue, 3-s delay, light blue, 6-s delay). (B) Three example V1 neurons (top, middle, bottom) with suppressed task-driven activity. Responses shown for preferred stimulus (left) and non-preferred stimulus (right), including only correct trials. Color shade indicates delay as in (A). (C) Histograms of selectivity index for enhanced (blue) and suppressed (red) neurons for each of the three regions (V1, left; PPC, middle; fMC, right). (D) Modal latency for enhanced (solid) and suppressed (hashed) neurons for each of the three regions (V1, blue; PPC, green; fMC, red). Latencies for enhanced and suppressed populations differ in V1 and PPC, but not fMC. (E) Delay modulation index for enhanced (solid) and suppressed (hashed) neurons for each of the three regions (V1, blue; PPC, green; fMC, red). The delay modulation increases for enhanced neurons from V1 to PPC to fMC, but is high in all three regions for suppressed neurons. Wilcoxon signed-rank test with Bonferroni correction used for all statistical tests. For bar plots, bars indicate mean ± bootstrap-estimated S.E.M.
Figure 5 with 1 supplement
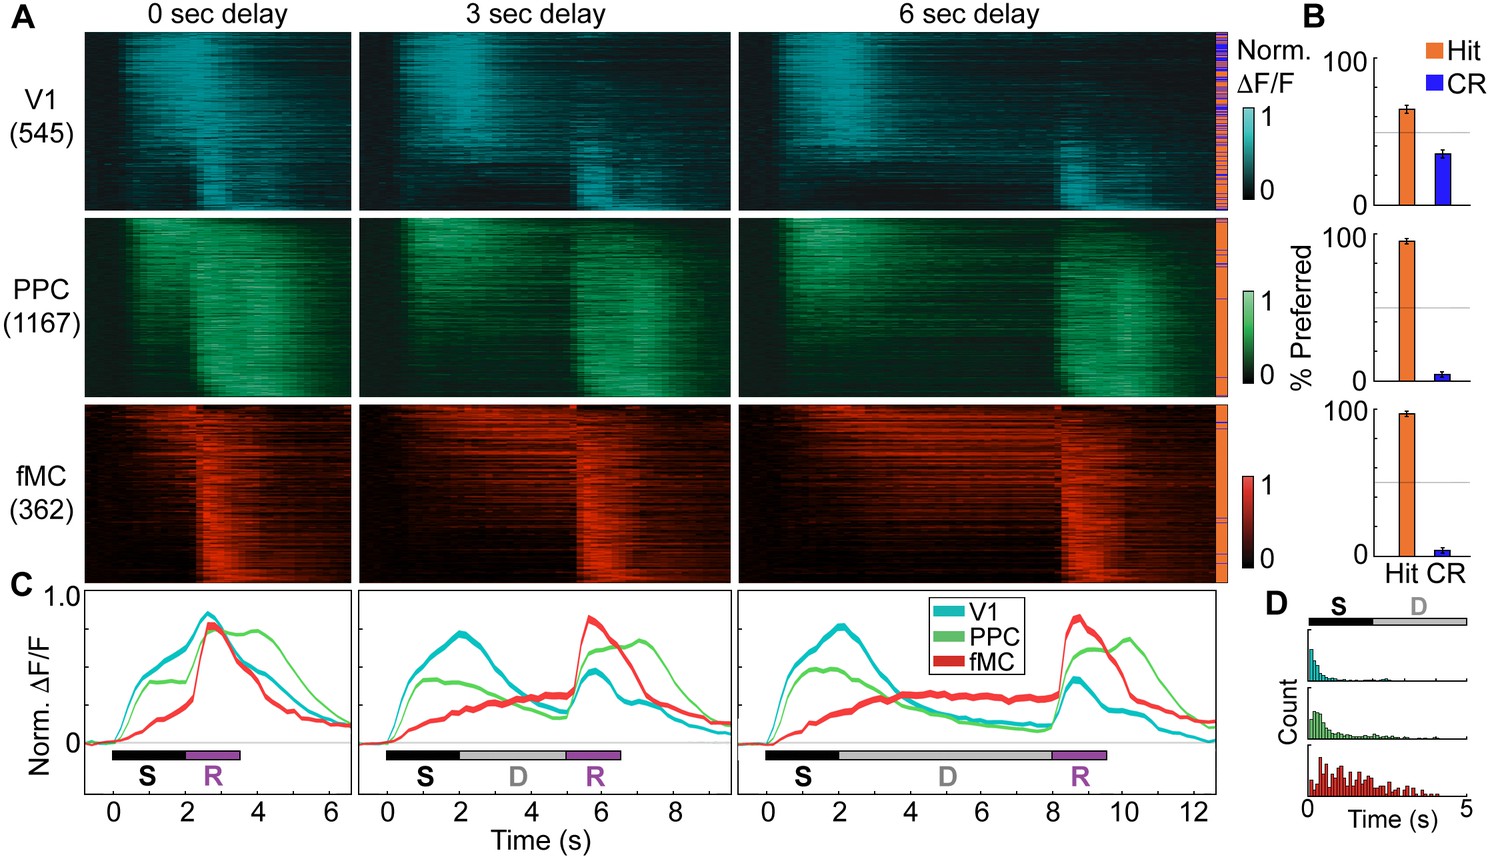
Distinct population dynamics in regions V1, PPC, and fMC.
(A) Normalized preferred calcium responses of all significantly responsive neurons showing enhanced responses (pooled across all 8 mice) in V1 (top, n = 545), PPC (middle, n = 1167) and fMC (bottom, n = 362), across all three delay durations (0-, 3-, 6-s; left, middle, and right, respectively). Only correct trials were included. For each neuron, traces were normalized to the peak of each cell’s trial-averaged response (colorbar on right inset). For each area, neurons were sorted by the time of the peak response. Sidebar indicates preferred trial for each neuron (Hit, orange; CR, blue). (B) Proportion of task-responsive neurons in each brain region that preferred Hit (orange) vs. Correct reject (CR, blue) trials. There was a strong bias for neurons in PPC and fMC to toward hit trials. (C) Mean population response of each brain region (V1, blue; PPC, green; fMC; red), across the three delay durations (line boundaries indicate mean ± bootstrap-estimated s.e.m.). Colored bars indicate the times of visual stimulus (white), delay (gray), and spout extension (purple). (D) Histogram of latency to the significant response of each brain region (only neurons with significant responses during stimulus or delay epochs considered). The population of single neuron latencies in V1 significantly precedes PPC, which in turn precedes fMC, for all delays (p < 10–9, all comparisons, Wilcoxon rank sum test). Color indicates region (V1, blue; PPC, green; fMC; red).
Figure 5—figure supplement 1
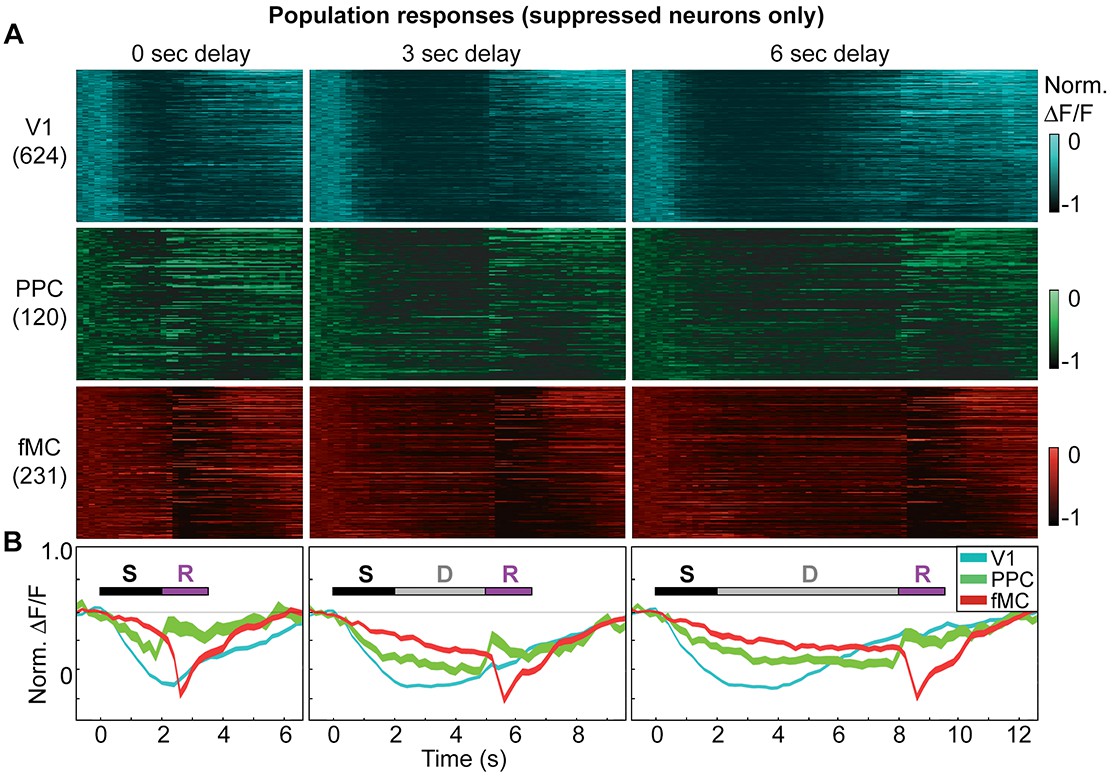
Suppressed population responses in regions V1, PPC, and fMC.
(A) Normalized preferred calcium responses of all significantly responsive neurons showing suppressed responses (pooled across all 8 mice) in V1 (top, n = 624), PPC (middle, n = 120) and fMC (bottom, n = 231), across all three delay durations (0-, 3-, 6-s; left, middle, and right, respectively). Only correct trials were included. For each neuron, traces were normalized to the trough of each cell’s trial-averaged response (color bar on right inset). For each area, neurons were sorted by the time of the lowest response. (B) Mean population response of each brain region (V1, blue; PPC, green; fMC; red), across the three delay durations (line boundaries indicate mean ± bootstrap-estimated S.E.M.). Colored bars indicate the times of visual stimulus (white), delay (gray), and spout extension (purple).
Figure 6

Error responses and population coding of task variables.
(A) Responses of all target-preferring neurons (6-s delay trials only) in all three regions (V1: top, blue; PPC: middle, green; fMC: bottom, red) to correct target trials (Hit, middle), error trials with the same stimulus but different response (Miss, left), and error trials with the same response but different stimulus (False alarm, right). Color bars indicate normalized ΔF/F (0 to 1). (B) Ideal observer performance (area under the receiver operator characteristic, auROC) in estimating the stimulus identity (target, non-target) based only on the neural activity of significantly enhanced neurons in V1 (left), PPC (middle), and fMC (right), including randomly sampled correct and error trials). Line shading indicates neuron population size used for the decoding (dark to light blue: n = 1 to 100 neurons; see legend). (C) Ideal observer performance in estimating the behavioral choice (lick, no-lick) based only on the neural activity of significantly enhanced neurons in V1 (left), PPC (middle), and fMC (right), including randomly sampled correct and error trials). Line shading indicates neuron population size used for the decoding (dark to light red: n = 1 to 100 neurons). (D) Re-plot of stimulus identity and behavioral choice decoding performance for n = 100 neurons, with line boundaries indicating mean ± bootstrap-estimated S.E.M. Dotted lines indicate upper 95% confidence interval for 1000 permutations with shuffled labels.
Figure 7 with 1 supplement
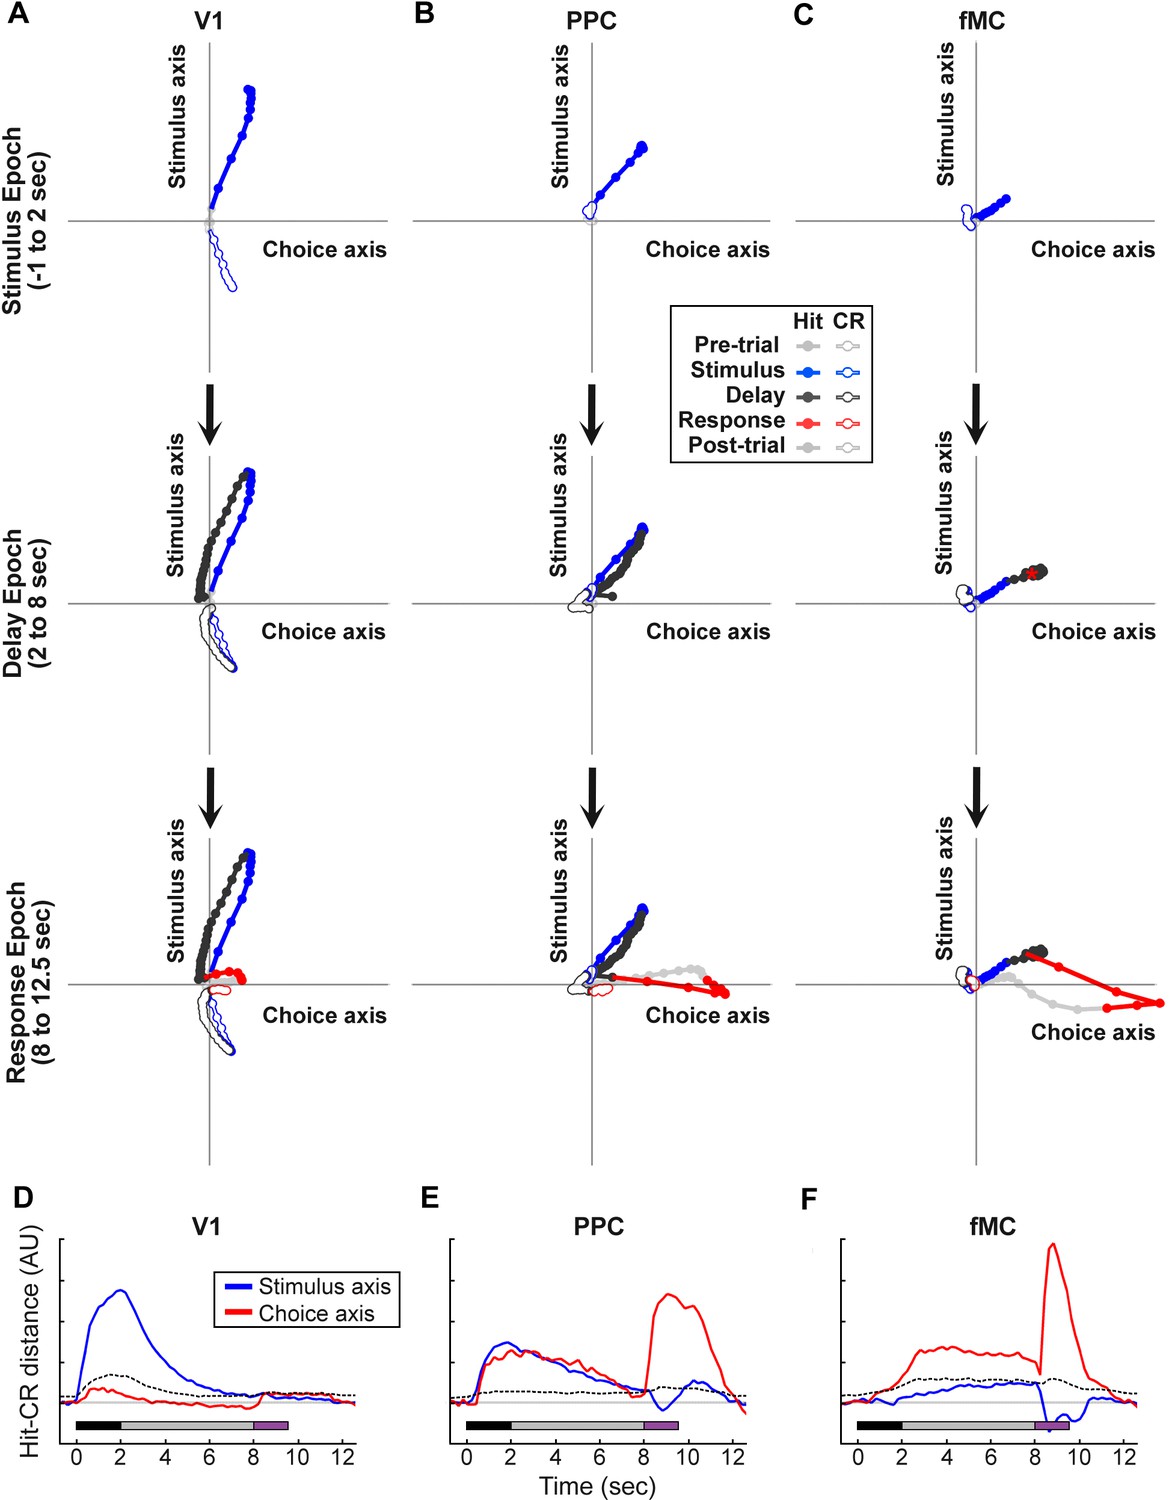
Dynamics of population responses in each region during sensorimotor decision task.
Population responses were mapped onto a reduced dimensional space in which each axis corresponds to a task variable (stimulus identity, behavioral choice). The axes were defined by performing a regression on the principal components of the population responses for each region. (A) Hit and Correct reject (CR) response trajectories in V1 as a function of time throughout the trial. Top, during the stimulus presentation, Hit and CR trajectories diverge along the stimulus axis. Middle, during the delay period, both trajectories return to baseline. Bottom, during the response, there is a small divergence between Hit and CR trajectories along the choice axis. (B) Hit and Correct reject (CR) response trajectories in PPC as a function of time throughout the trial. Top, during the stimulus presentation, Hit and CR trajectories diverge along both the stimulus and choice axes. Most of the divergence comes from the movement of the Hit trajectory, as the CR trajectory remains close to baseline (likely due to the small number of neurons responding to non-target stimuli). Middle, during the delay period, the Hit trajectory mostly returns to baseline. Bottom, during the response, there is a second divergence between Hit and CR trajectories along the choice axis. (C) Hit and Correct reject (CR) response trajectories in fMC as a function of time throughout the trial. Top, during the stimulus presentation, Hit and CR trajectories diverge along the choice axis. As in PPC, the CR trajectory remains close to baseline. Middle, during the delay period the Hit and CR trajectories remain separated along the choice axis, suggesting sustained encoding of choice-related information (red asterisk, location of Hit trajectory at end of delay period). Bottom, during the response, there is a further divergence between Hit and CR trajectories along the choice axis. (D) The distance between the Hit and CR trajectories along the stimulus identity (blue) and behavioral choice (red) axes for region V1. This measurement is a proxy for population encoding of stimulus identity and behavioral choice (compare to Figure 6D, left). Dotted lines indicate upper 95% confidence interval for 1000 permutations with shuffled labels. (E,F) Same as (D) for regions PPC and fMC, respectively (compare to Figure 6D, middle and right).
Figure 7—figure supplement 1
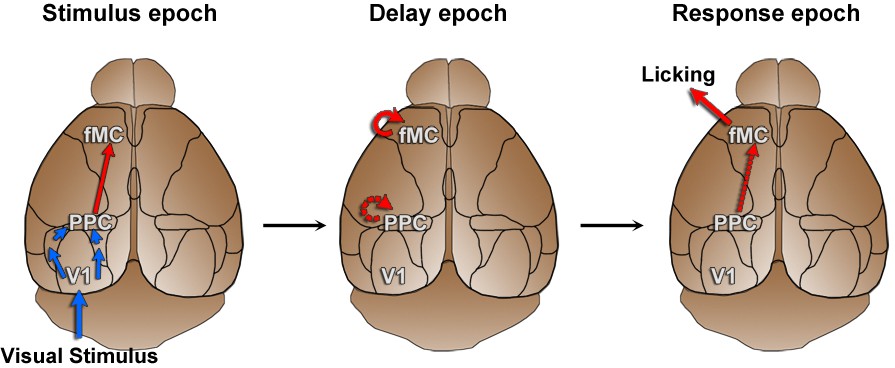
Working hypothesis of information propagation.
Based on imaging results (Figure 5) and population analyses (Figure 6, Figure 7), we developed a working hypothesis of information propagation during the sensorimotor decision task. During the stimulus epoch (left), stimulus identity (blue) is encoded by V1 and PPC, while behavioral choice (red) is encoded by PPC and fMC. Note that although there are direct inputs from V1 to PPC and PPC to fMC, there may be intermediate connections as well. During the delay epoch (middle), coding of stimulus identity fades while coding of behavioral choice is actively maintained in fMC (and possibly PPC). During the response epoch, the stored choice information leads to the execution of the motor action within fMC (and possibly V1 and PPC).
Figure 8 with 1 supplement
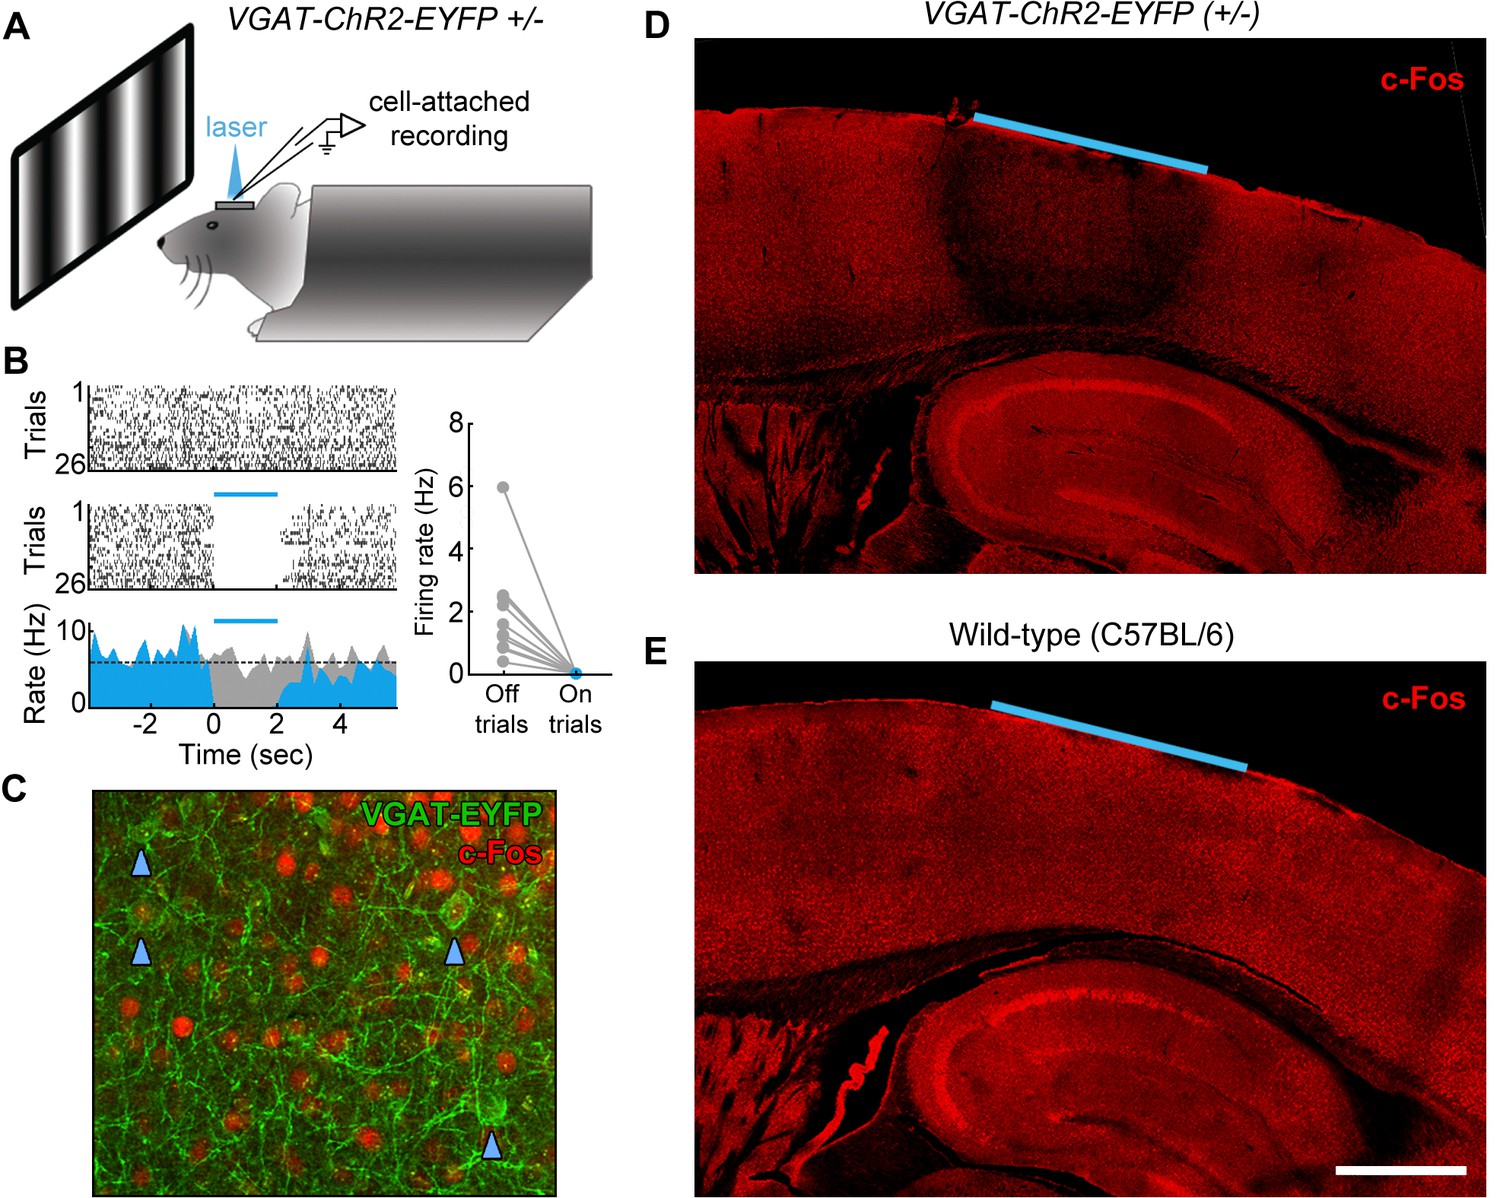
Characterization of photoinhibition in VGAT-ChR2-EYFP mice.
(A) Schematic of cell-attached recording set-up to test the effect of blue light on regular spiking neurons in VGAT-ChR2-EYFP mice. (B) Response of example layer 5 regular spiking neuron with high baseline firing rate on interleaved laser off (top) and laser on (bottom) trials. Blue light completely silences neural activity during all trials (bottom). Complete silencing was observed for all regular spiking neurons recorded (right, n = 10 neurons). (C) Cortical slice from VGAT-ChR2-EYFP mouse showing constitutive c-Fos expression (red) in putative excitatory (EYFP-negative) neural somata. Note that c-Fos expresses at low levels in inhibitory interneurons (EYFP-positive; blue arrowheads). (D) Laser stimulation in VGAT-ChR2-EYFP mice dramatically reduces c-Fos expression (red) in a local region underneath the cranial window. Reduction of c-Fos spreads farthest in middle layers, but is generally limited to a few hundred microns from the window edge. Reduction of c-Fos was not observed in subcortical regions. The light blue line indicates window location (2 mm diameter window). (E) Identical laser stimulation in wild-type mice does not affect c-Fos expression (red) underneath the cranial window. The light blue line indicates window location (2 mm diameter window). Scale bar, 1 mm.
Figure 8—figure supplement 1

Photoinhibition control experiments.
(A) Bilateral V1 laser stimulation in VGAT-ChR2-EYFP and control (wild-type) mice during the stimulus epoch of a 0 s delay version of the task. (B,C) Bilateral laser stimulation significantly impairs behavior in a VGAT-ChR2-EYFP mouse, causing performance to fall near chance levels (Δd’ = -1.41, p = 0.002, n = 6 sessions). Laser stimulation has no effect on performance for a wild-type control mouse (Δd’ = +0.14, p = 0.27, n = 8 sessions). (D) To ensure that laser stimulation does not exert effects on performance lasting beyond the laser stimulation period, we investigated the effect of laser stimulation during a 2 s period immediately prior to visual stimulus onset in a VGAT-ChR2-EYFP mouse. (E,F) Laser stimulation during the 2 s prior to the stimulus epoch had no significant effect on performance (Δd’ = -0.15, p = 0.51, n = 8 sessions) compared to laser stimulation during the stimulus period for the same mouse (Δd’ = -1.93, p = 0.003, n = 8 sessions). Paired t-tests used for all statistical tests.
Figure 9 with 1 supplement
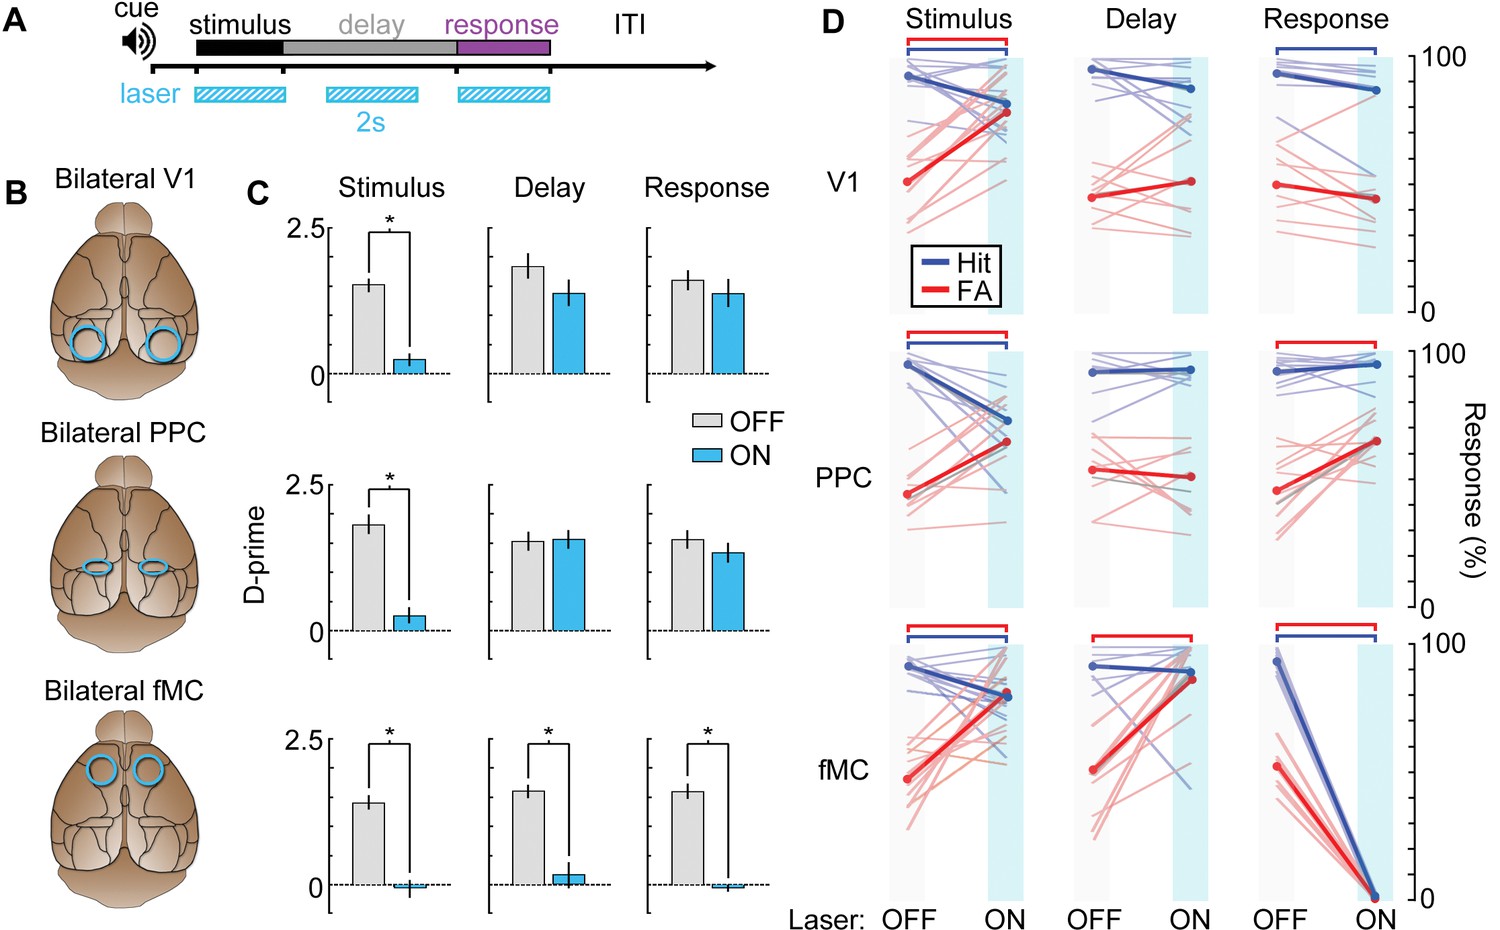
Photoinhibition of specific cortical regions during task performance.
(A) Continuous blue light stimulation (473 nm, 2 s) was applied on interleaved trials during either the stimulus, delay, or response epochs of the task. (B) Glass windows were implanted bilaterally over V1 (top), PPC (middle) or fMC (bottom) of VGAT-ChR2-YFP mice. Superficial blue light stimulation silences activity in nearby pyramidal cells (Figure 6), effectively silencing the exposed region. (C) Behavioral performance (d-prime) during interleaved laser OFF and ON trials for each brain region and trial epoch. Photoinhibition of V1 (top row) or PPC (middle row) significantly disrupts behavioral performance only when applied during the stimulus period (left column), whereas photoinhibition of fMC (bottom row) during any epoch of the task significantly decreases d-prime (*p < 0.05, t-test with Bonferroni correction). (D) Effect of laser stimulation on hit rate (blue) and false alarm rate (red). Lightly colored lines represent individual behavioral sessions. Colored bars at the top indicate statistical significance for each group (p < 0.05, t-test with Bonferroni correction). For all plots, error bars indicate ± S.E.M.
Figure 9—figure supplement 1
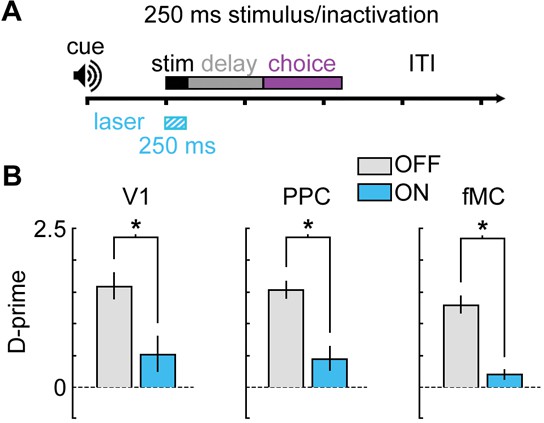
Bilateral photoinactivation during brief (250 ms) visual stimuli.
(A) Mice were trained on a version of the task with a brief (250 ms) visual stimulus, followed by a 1 s delay. Pre-stimulus period (1 s), response period (1.5 s), and ITI (3 s) were unchanged from the standard task. Laser was on for 250 ms during the stimulus. (B) Performance was significantly impaired for V1 (Δd’ = -1.08, p = 0.048, n = 5 sessions), PPC (Δd’ = -1.09, p = 0.009, n = 6 sessions), and fMC (Δd’ = -1.08, p = 0.003, n = 5 sessions).
Videos
Video 1
Example video of a mouse performing the memory-guided visual discrimination task.
Task epoch (stimulus, delay, choice), stimulus identity (target, non-target), and trial types (hit, correct reject) are annotated.
Video 2
Example video of volume imaging of GCaMP6s-labelled neurons in V1 (spontaneous activity).
Each frame is 850 × 850 μm, with 20 μm separation between frames in the Z-dimension. Display speed is 10x real time.
Download links
A two-part list of links to download the article, or parts of the article, in various formats.
Downloads (link to download the article as PDF)
Open citations (links to open the citations from this article in various online reference manager services)
Cite this article (links to download the citations from this article in formats compatible with various reference manager tools)
Distinct roles of visual, parietal, and frontal motor cortices in memory-guided sensorimotor decisions
eLife 5:e13764.
https://doi.org/10.7554/eLife.13764


