Selective sorting and destruction of mitochondrial membrane proteins in aged yeast
- Fred Hutchinson Cancer Research Center, United States
- University of Utah School of Medicine, United States
Figures
Figure 1
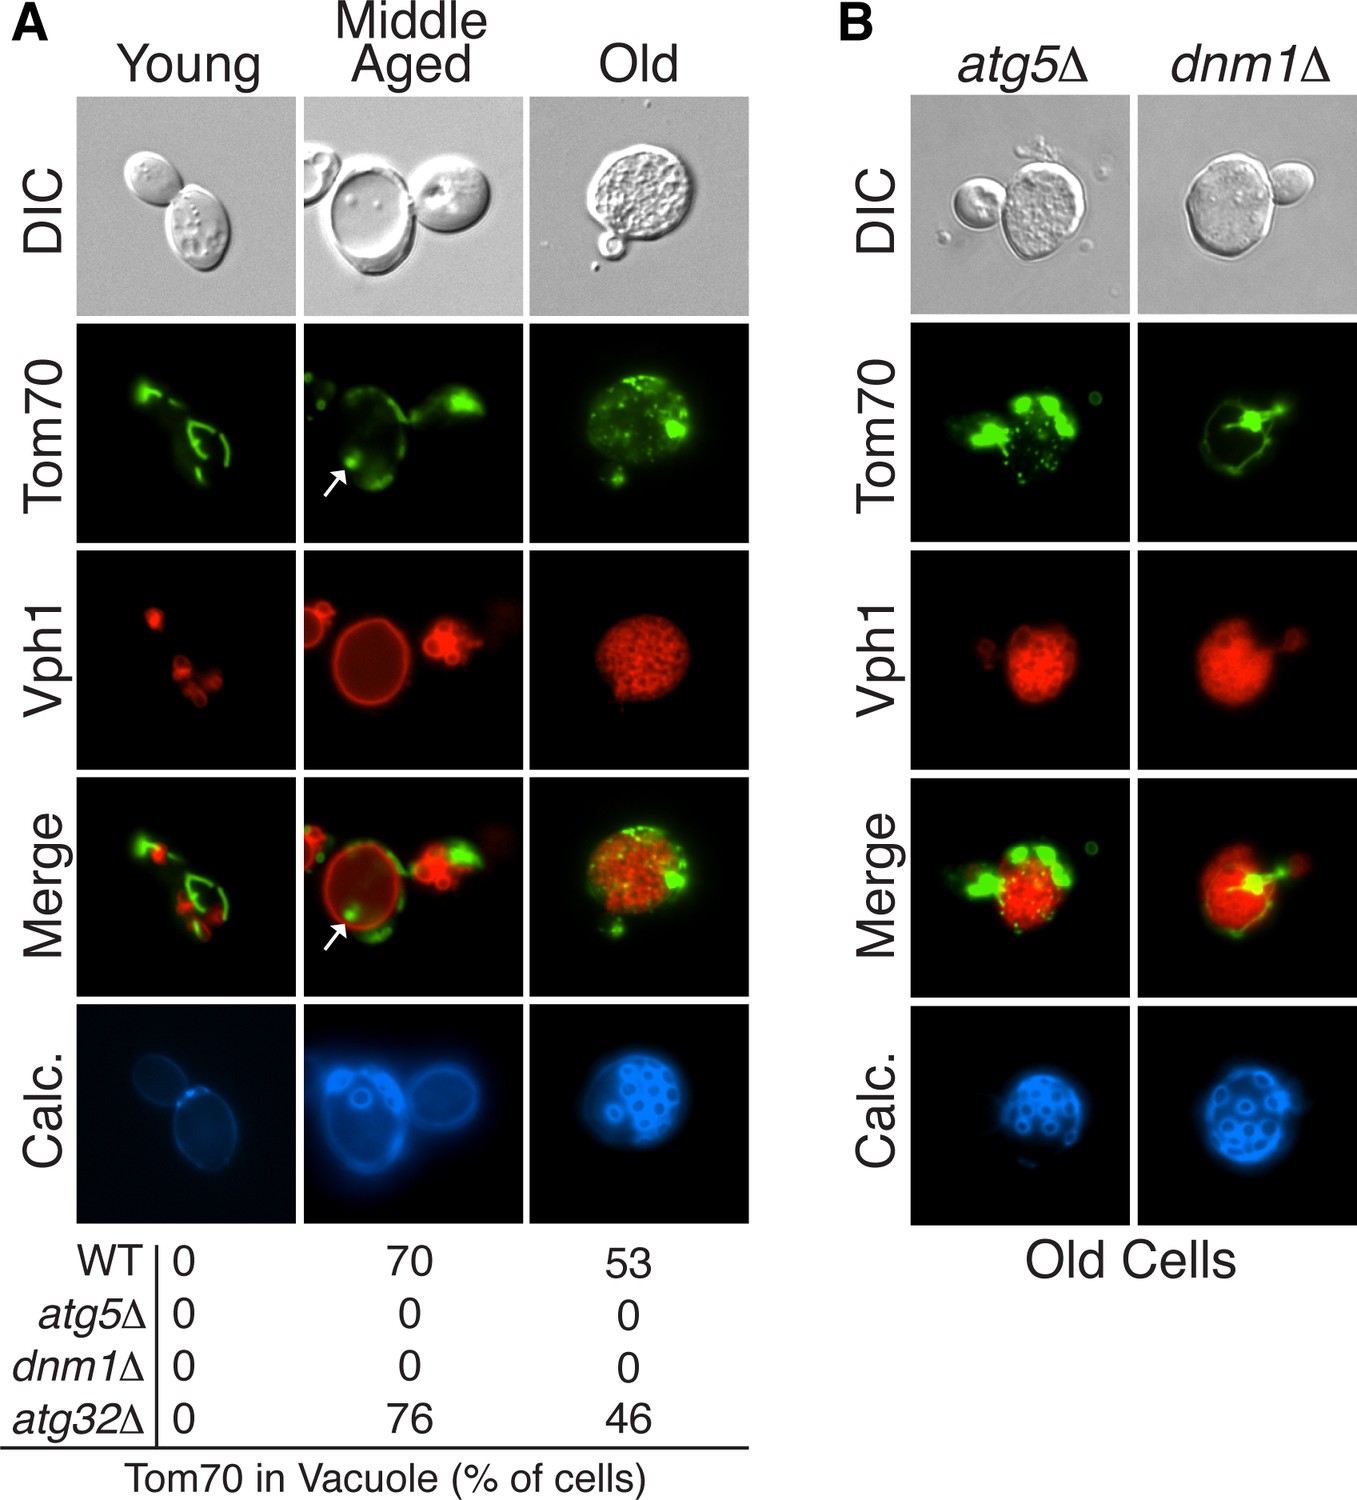
Mitochondrial proteins are degraded by autophagy in aged cells.
(A) Tom70-GFP is degraded in the vacuole by autophagy in middle-aged cells. Wild-type (WT) and the indicated mutant cells expressing Tom70-GFP and the vacuole marker Vph1-mCherry were aged and visualized by fluorescence microscopy. Images depict wild-type cells, and the presence of Tom70-GFP in the vacuole (white arrow) of young, middle-aged, and old cells was scored for each strain. All strains including wild type are PEP4-deficient (pep4△). N = 30. In all figures, young cells have undergone 0–3 divisions, middle-aged cells 7–12 divisions, and old cells >17 divisions. Divisions are scored by counting bud scars visualized with calcolfuor (Calc). (B) Representative images of old ATG5- (atg5△) and DNM1-deficient (dnm1△) cells from (A) with fragmented vacuole morphology.
Figure 2 with 1 supplement
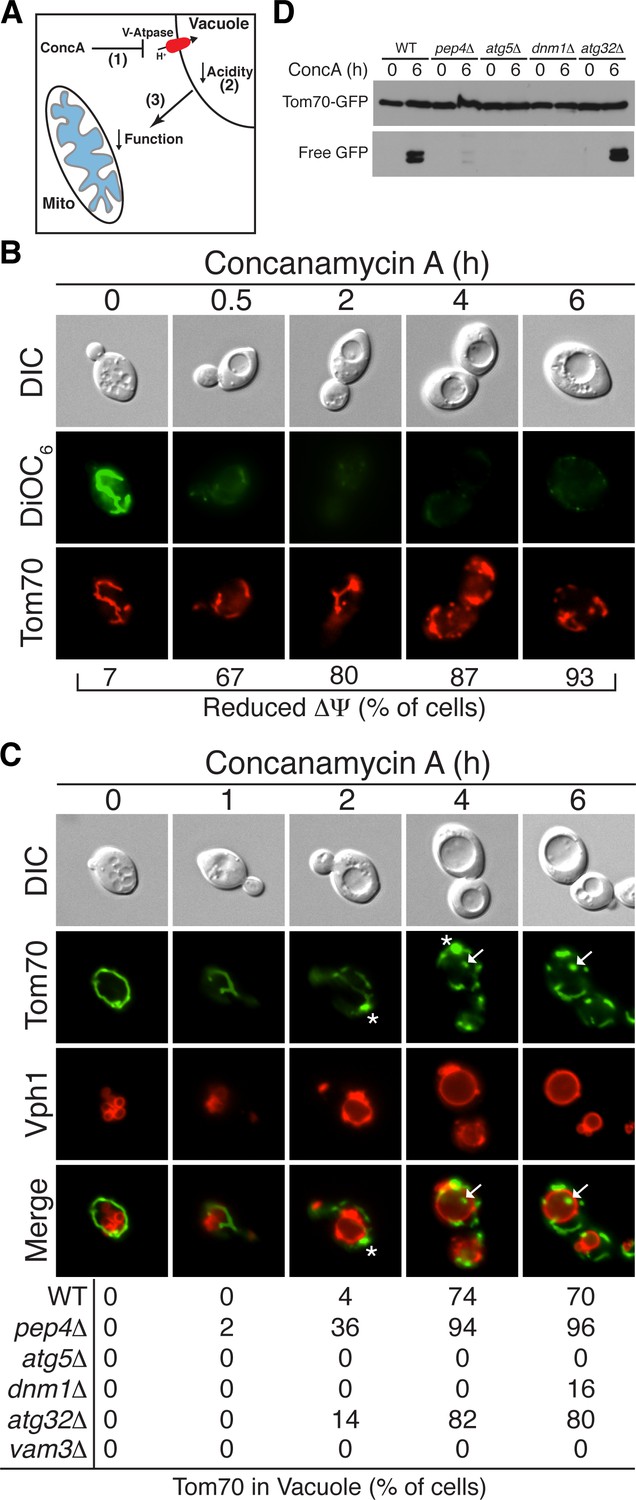
Loss of vacuole function triggers mitochondrial protein degradation.
(A) Schematic illustration showing that loss of vacuolar acidity (2) through aging or concanamycin A (conc A)-mediated inhibition of the Vacuolar H+-ATPase (1) leads to loss of mitochondrial function (3) through an unknown mechanism. (B) Loss of vacuolar acidity causes rapid mitochondrial depolarization. Wild-type cells expressing Tom70-mCherry were treated with concanamycin A for the indicated time (hr) and stained with DiOC6 as an indicator of △Ψ. N = 30. (C) Loss of vacuolar acidity activates autophagy-dependent Tom70-GFP degradation. Wild-type (WT) and the indicated mutant cells expressing Tom70-GFP and Vph1-mCherry were treated with concanamycin A for the indicated time (hr). The presence of Tom70-GFP in the vacuole (white arrow) was scored for each strain and time point. N = 50. * indicates MDC. (D) Tom70-GFP was monitored for autophagy-dependent degradation using a GFP-cleavage assay in wild-type (WT) and the indicated mutant cells treated with concanamycin A (ConcA) for the indicated time (hr). Whole-cell extracts from the treated cells were subjected to immunoblot analysis with anti-GFP antibody. The use of conc A as an inducer potentially limited the amount of GFP cleavage in the vacuole. Consequently, the exposure time of the free GFP immunoblot is 20 times longer than the exposure of the immunoblot with full length Tom70-GFP.
Figure 2—figure supplement 1
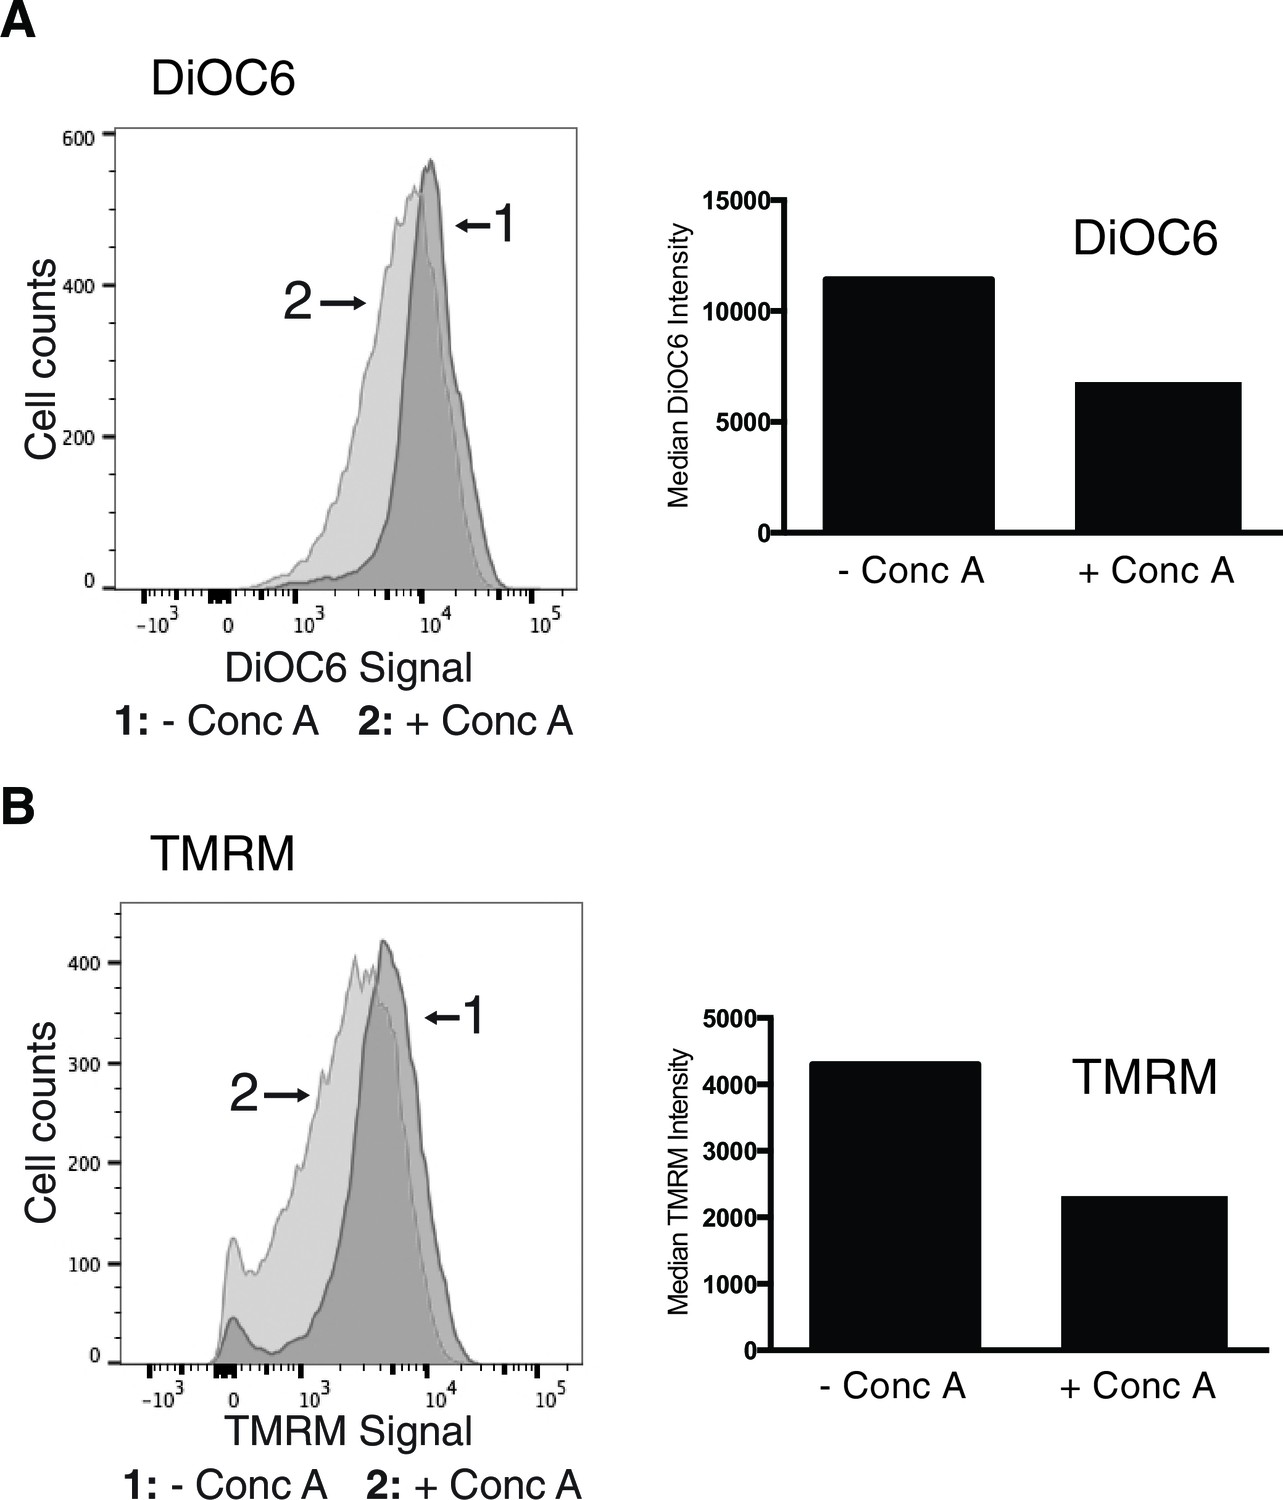
Concanamycin a treatment causes loss of mitochondrial membrane potential.
Loss of vacuolar acidity causes mitochondrial depolarization. Wild-type cells were treated with concanamycin A for 4 hr, stained with mitochondrial membrane potential fluorescent dyes DiOC6 (A) or TMRM (B), and analyzed by flow cytometry. FACS profiles and bar graphs showing median fluorescence intensity are shown for each stain. N > 10,000 cells for each.
Figure 3
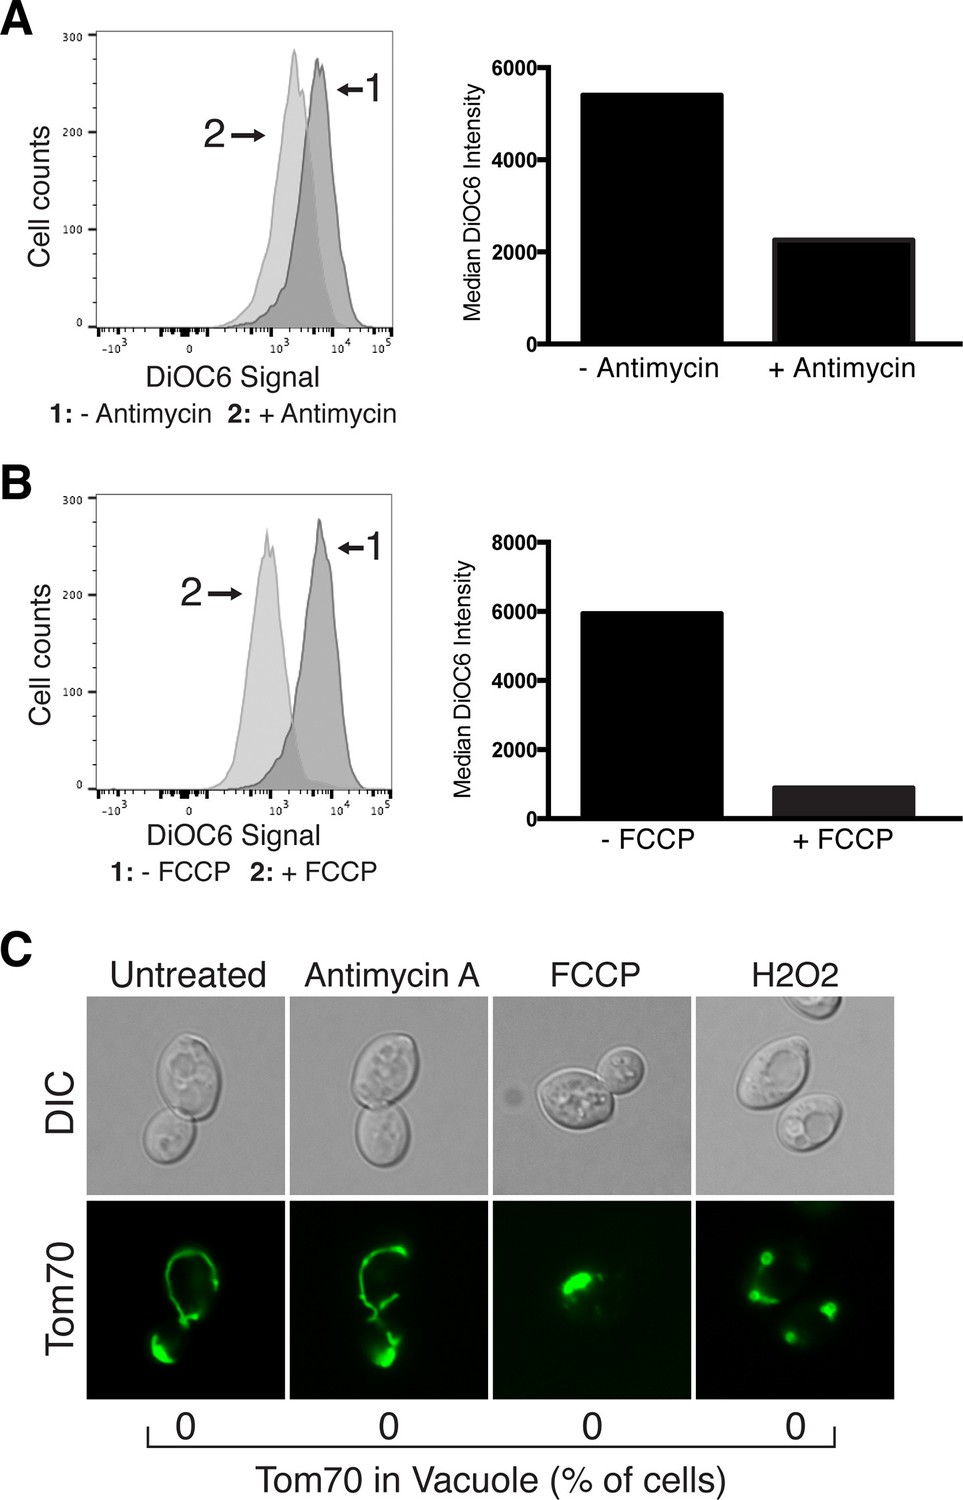
Mitochondrial protein degradation is not triggered by loss of mitochondrial membrane potential or oxidative stress.
Antimycin A and FCCP cause mitochondrial depolarization. Wild-type cells were treated with Antimycin A (A) or FCCP (B) for 4 hr, stained with the mitochondrial membrane potential fluorescent dye DiOC6, and analyzed by flow cytometry. FACS profiles and bar graphs showing median fluorescence intensity are shown for each treatment. N > 10,000 cells for each. (C) Loss of mitochondrial membrane potential or oxidative stress does not activate autophagy-dependent Tom70-GFP degradation. Wild-type cells expressing Tom70-GFP were treated with the indicated compound for 4 hr. The presence of Tom70-GFP in the vacuole was scored for each strain and time point. N = 50. Representative images showing mitochondrial aggregation and fragmentation in FCCP and hydrogen peroxide (H2O2) treated cells are shown.
Figure 4 with 2 supplements
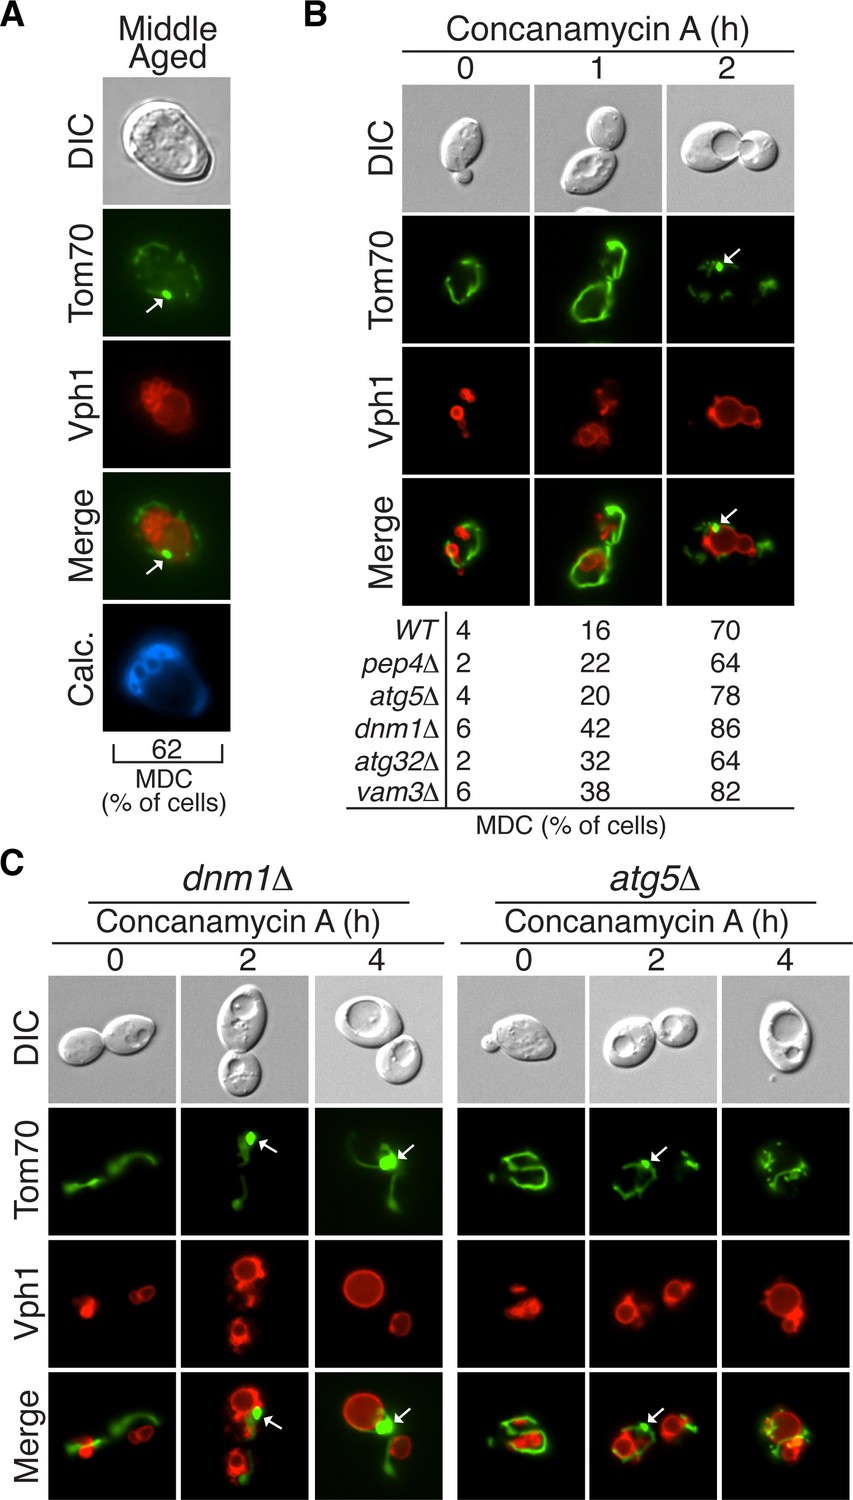
The mitochondrial-Derived compartment (MDC) is an intermediate step in mitochondrial protein degradation.
(A) Aging induces MDC formation. Middle-aged cells expressing Tom70-GFP and Vph1-mCherry were scored by fluorescence microscopy for the presence of mitochondrial-derived compartment (MDC) structures (white arrow). N = 30. (B) Loss of vacuolar acidity triggers MDC formation. Wild-type (WT) and the indicated mutant cells expressing Tom70-GFP and Vph1-mCherry were treated with concanamycin A for the indicated time (hr). The presence of MDCs (white arrow) was scored for each strain and time point. N = 50. (C) Mitochondrial fission, but not autophagy, is required for MDC release. Representative images of MDCs (white arrow) in DNM1- (dnm1△) and ATG5-deficient (atg5△) cells from (B).
Figure 4—figure supplement 1
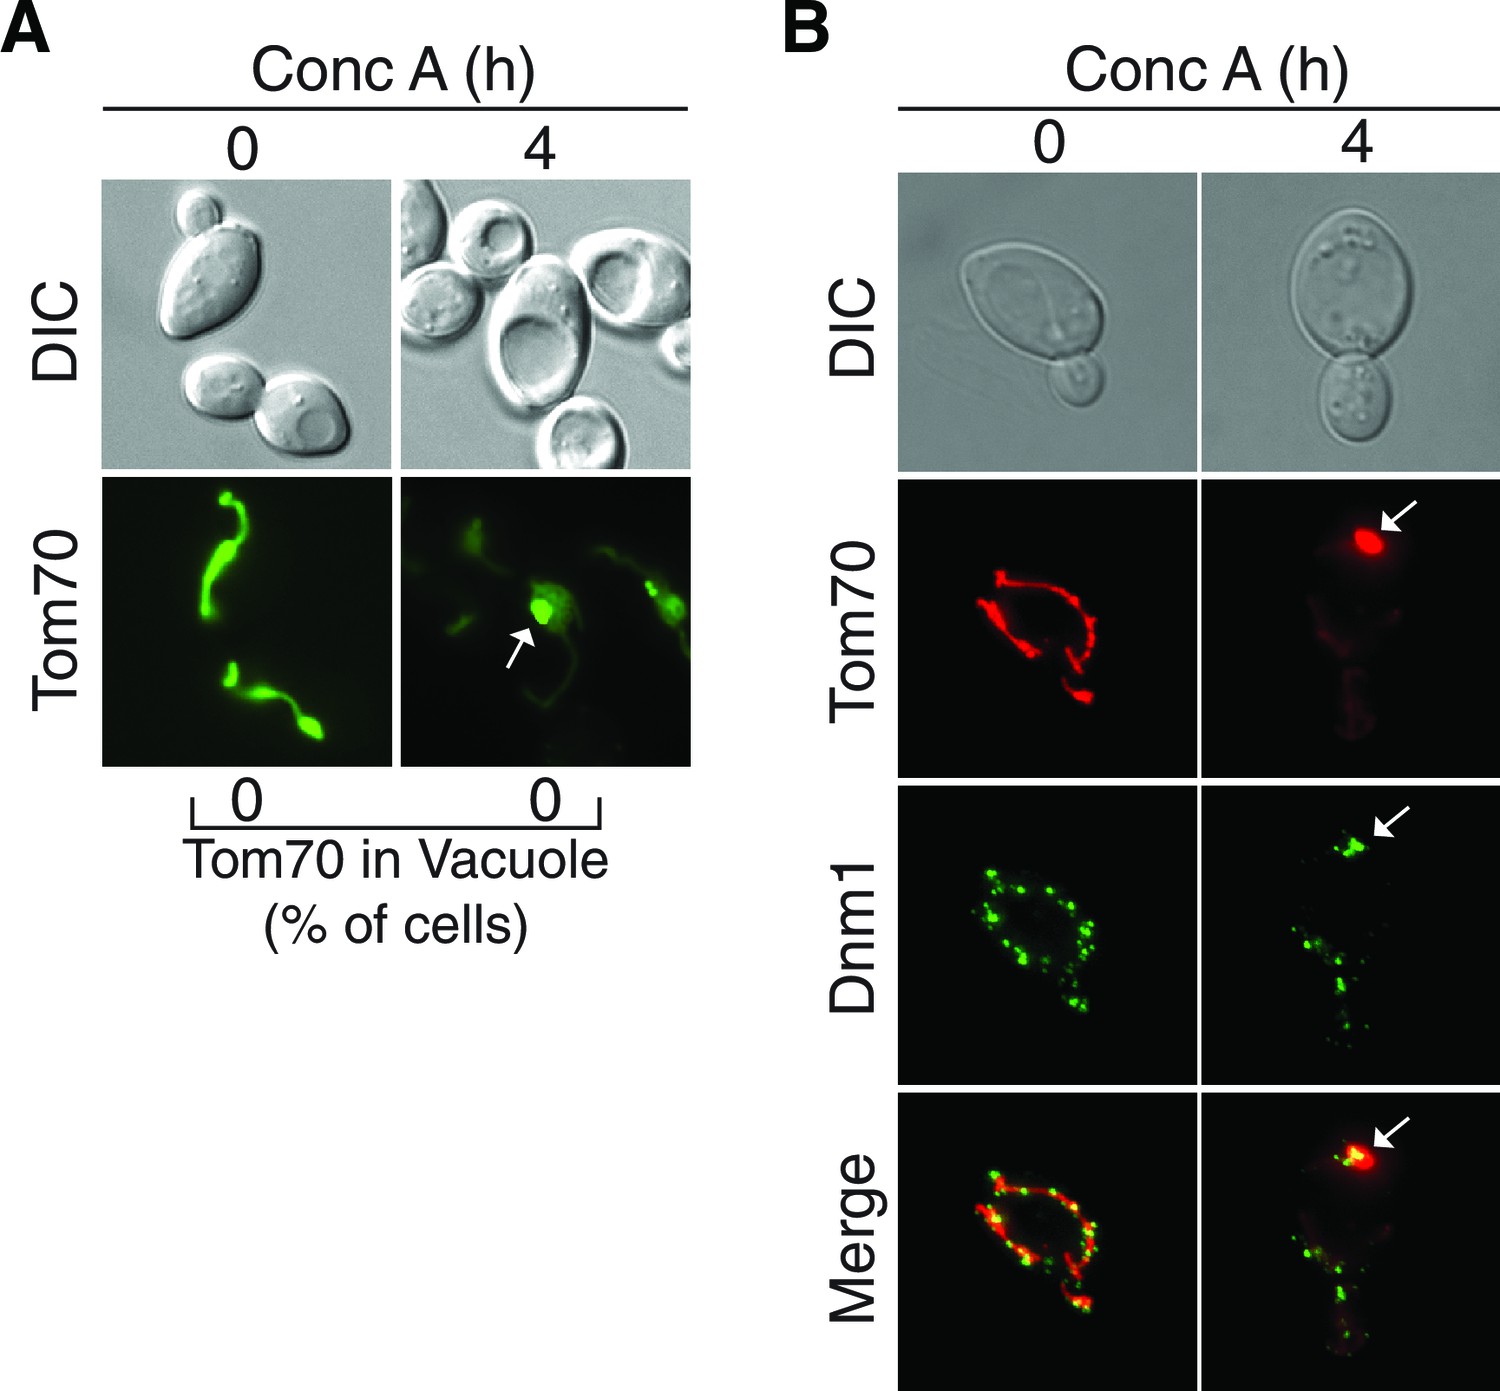
Further support for the role of fission proteins in MDC release from the mitochondria.
(A) The fission protein Fis1 is required for MDC release from mitochondria. fis1△ cells expressing Tom70-GFP were treated with concanamycin A for the indicated time (h). The presence of Tom70-GFP in the vacuole was scored. N = 50. Representative images of untreated and treated cells are shown. White arrow indicates MDC. 82% of 4 hr treated cells had an MDC. (B) Dnm1-GFP foci localize at or around the MDC. Representative maximum intensity projection images showing colocalization of Dnm1-GFP foci with MDCs (marked with Tom70-mCherry) in wild-type cells treated with concanamycin A for the indicated time (h). White arrow indicates MDC with nearby Dnm1-GFP foci. 88% of cells exhibit this colocalization phenotype. N = 50.
Figure 4—figure supplement 2

Further support for the role of autophagy in Tom70-GFP degradation.
MDCs localize near the pre-autophagosomal structure (PAS) prior to vacuole entry. Representative maximum intensity projection images showing colocalization of PAS marker GFP-Atg8 with MDCs (marked with Tom70-mCherry) in wild-type cells treated with concanamycin A for the indicated time (hr). White arrow indicates an MDC in close proximity to PAS on the vacuole surface. 68% of cells exhibit this colocalization phenotype. N = 50.
Figure 5 with 1 supplement
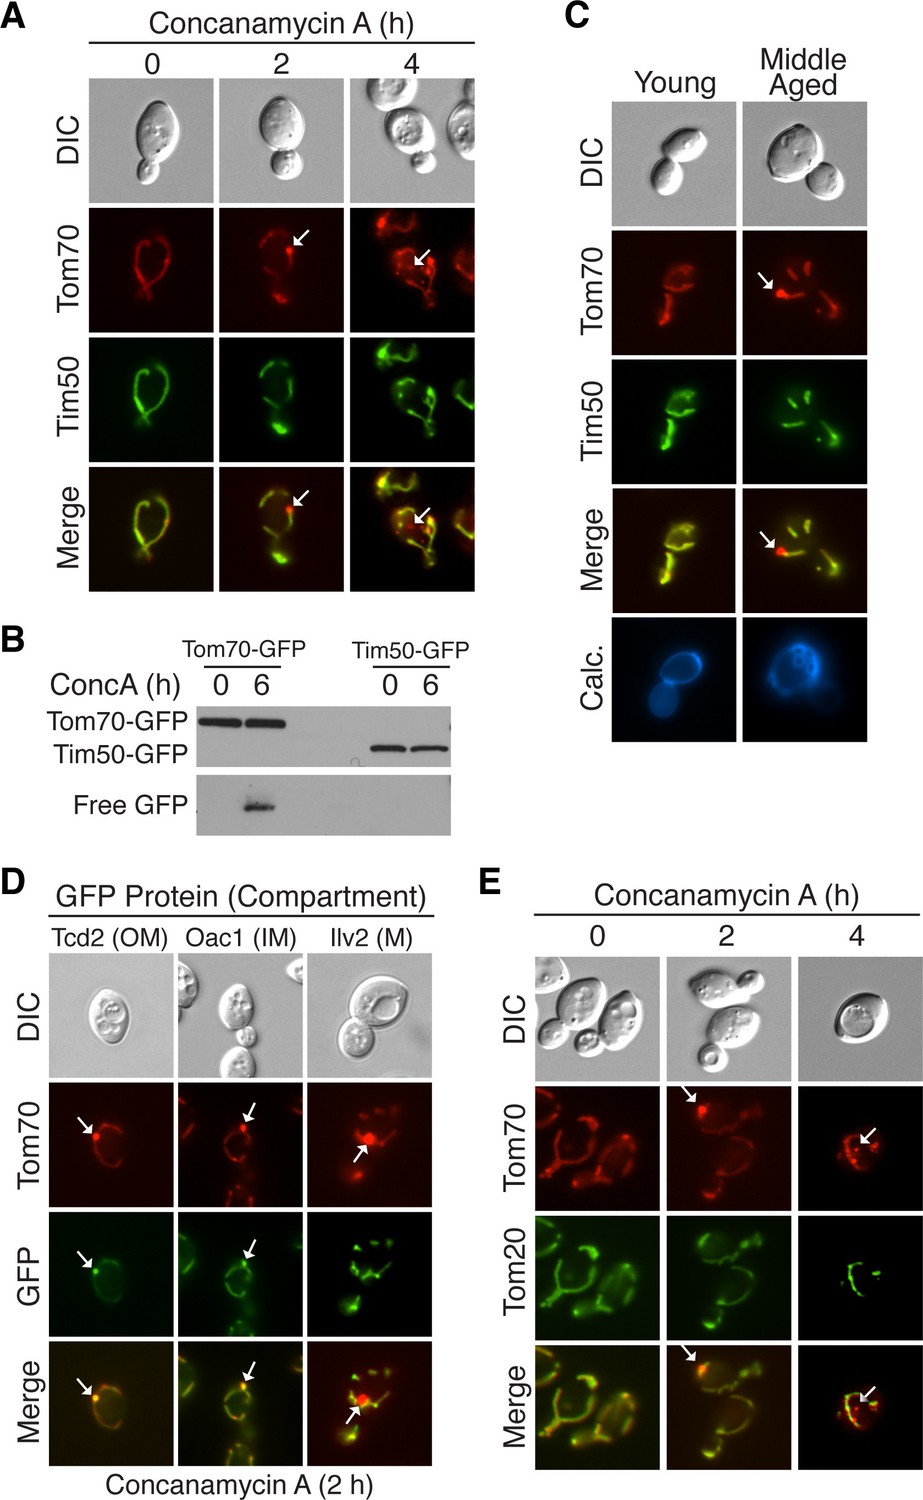
Select mitochondrial proteins are incorporated into MDCs.
(A) The inner mitochondrial membrane protein Tim50 is excluded from MDC-dependent degradation. Wild-type cells expressing Tom70-mCherry and Tim50-GFP were treated with concanamycin A for the indicated time and representative images showing Tim50 exclusion from the MDC (2 hr, white arrow) and vacuole (4 hr, white arrow) are shown. 100% of cells show this phenotype of Tim50 exclusion. N = 50. (B) Tom70-GFP and Tim50-GFP were monitored for autophagy-dependent degradation using a GFP-cleavage assay in wild-type (WT) cells expressing either Tom70-GFP or Tim50-GFP treated with concanamycin A (ConcA) for the indicated time (hr). Whole-cell extracts from the treated cells were subjected to immunoblot analysis with anti-GFP antibody. As in Figure 2D, the use of conc A as an inducer limited the amount of GFP cleavage in the vacuole. Consequently, the exposure time of the free GFP immunoblot is ~20 times longer than the exposure of the immunoblot with full-length GFP-tagged proteins. (C) Tim50 is excluded from MDCs in middle-aged cells. Wild-type cells expressing Tom70-mCherry and Tim50-GFP were aged and representative images showing Tim50 exclusion from the MDC (white arrow) are shown. 100% of cells show this phenotype of Tim50 exclusion. N = 30. (D) Mitochondrial outer membrane proteins and inner membrane carrier proteins localize to MDCs. Wild-type cells expressing Tom70-mCherry and the indicated C-terminal GFP fusion proteins were treated with concanamycin A for 2 hr and protein inclusion in MDCs (white arrows) was assessed. GFP-tagged marker proteins represent mitochondrial outer membrane (OM), inner membrane carrier proteins (IM), and matrix proteins (M). 100% of cells show the phenotypes in the representative images. N = 50. (E) Tom20 is excluded from MDCs. Wild-type cells expressing Tom70-mCherry and Tom20-GFP were treated with concanamycin A for the indicated time and representative images showing Tom20 exclusion from the MDC (2 hr, white arrow) and vacuole (4 hr, white arrow) are shown. 100% of cells show this phenotype of Tom20 exclusion. N = 50.
Figure 5—figure supplement 1
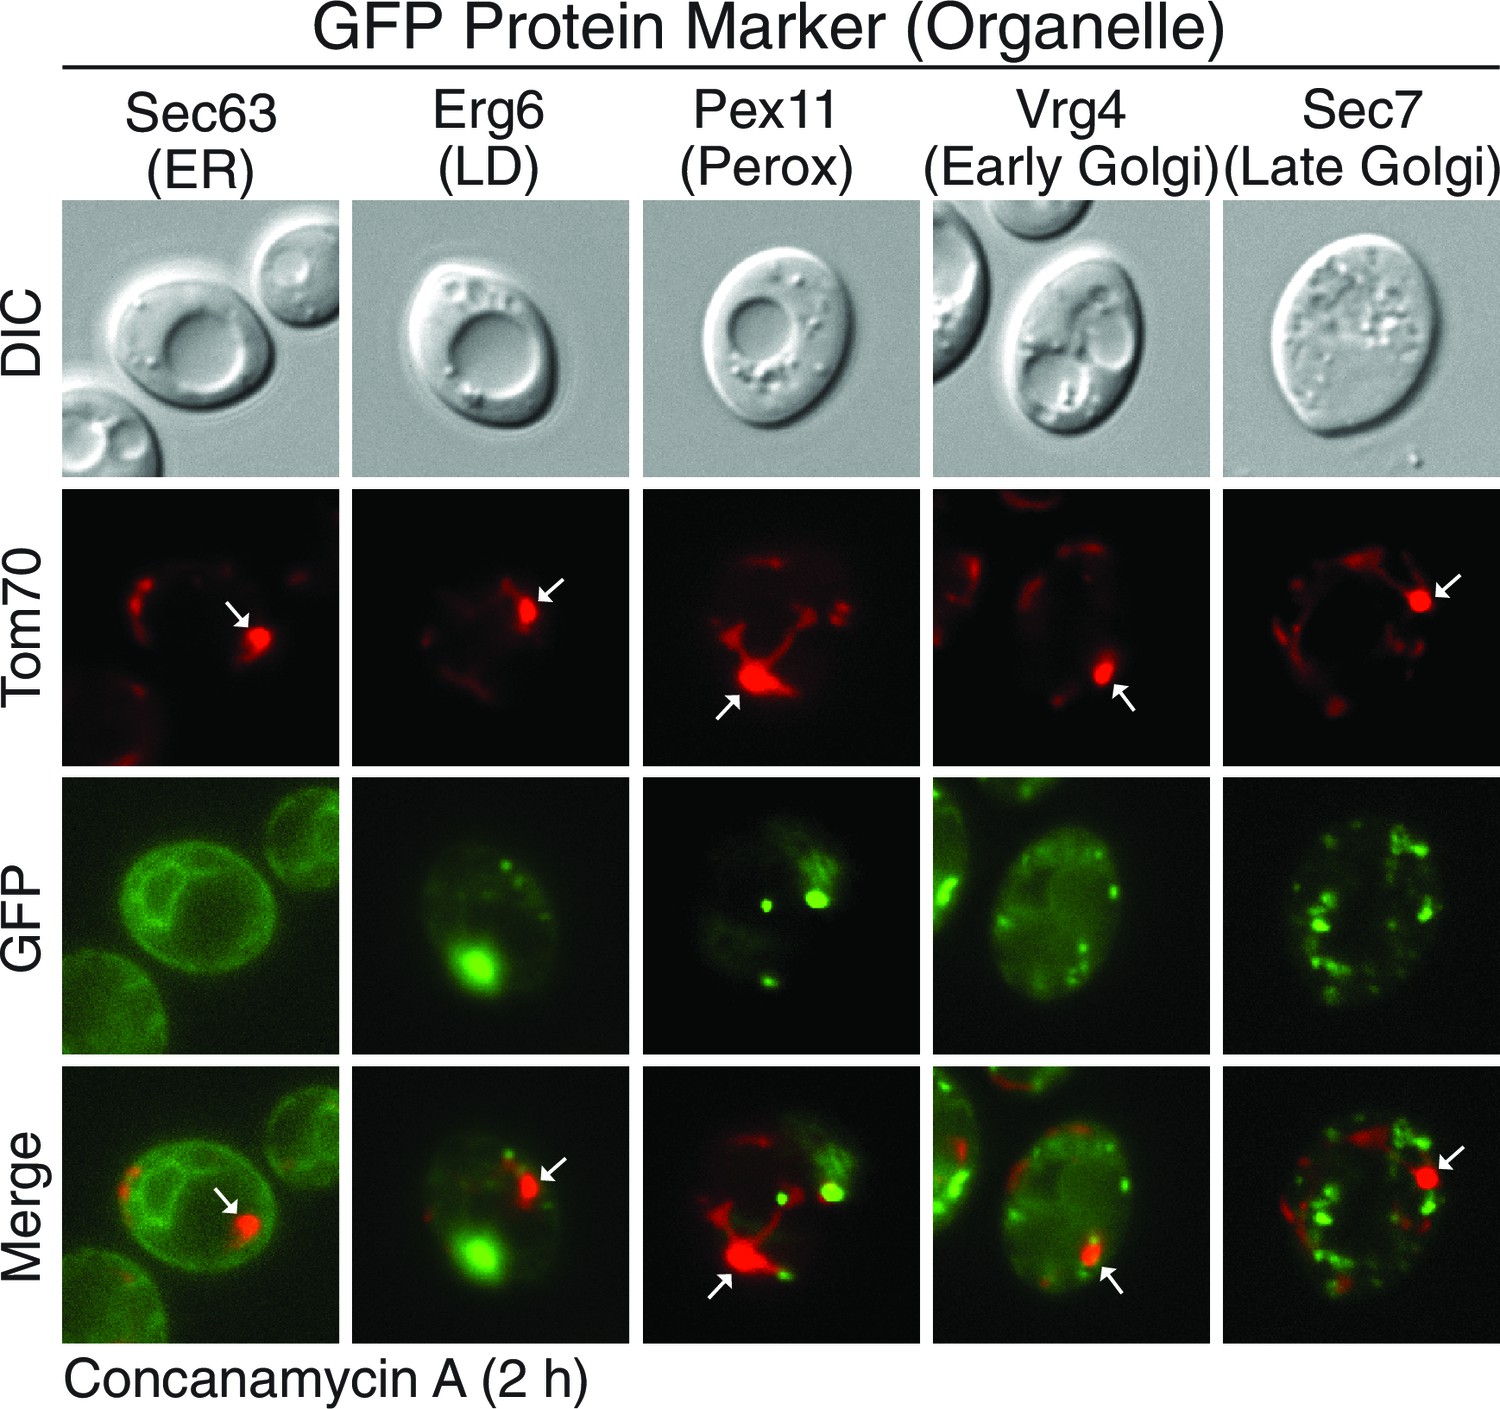
MDCs do not contain other major organelles.
Marker proteins of other major organelles do not localize to MDCs. Wild-type cells expressing Tom70-mCherry and the indicated GFP-tagged organelle marker protein were treated with concanamycin A for 2 hr and representative images showing GFP exclusion from the MDC (white arrow) are shown. Organelle marker proteins are Sec63 for endoplasmic reticulum (ER), Erg6 for lipid droplets (LD), Pex11 for peroxisomes (perox), Vrg4 for early golgi, and Sec7 for late golgi.
Figure 6
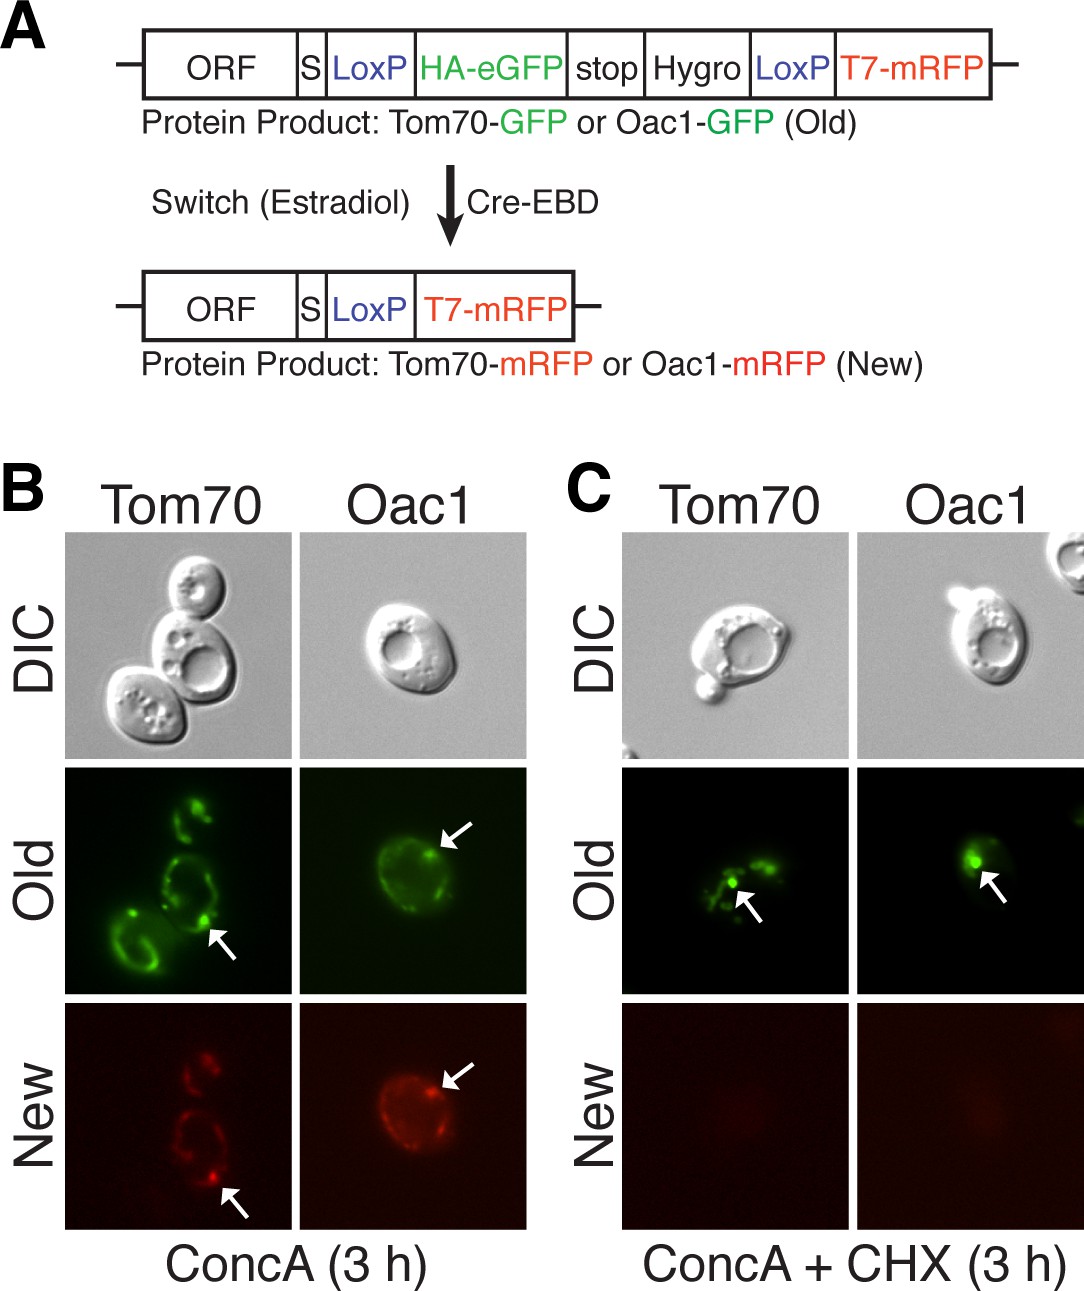
MDCs sequester preexisting mitochondrial proteins.
(A) Schematic of the recombination induced tag exchange (RITE) system. In untreated cells, the RITE-tagged ORF is expressed with a C-terminal HA-GFP fusion (old protein). Treatment with estradiol induces Cre-EBD dependent recombination between LoxP sites creating a new C-terminal T7-mRFP fusion (new protein). (B) Preexisting protein is incorporated into MDCs. Cells expressing either RITE-tagged Tom70 or Oac1 were treated with estradiol and concanamycin A simultaneously for 3 hr to induce epitope tag exchange and MDC formation. Cells were visualized with fluorescence microscopy for the presence of preexisting (old) or newly synthesized (new) protein in the MDC (white arrows). 100% of the cells show the represented phenotype. N= 50. (C) MDCs (white arrows) form in the absence of new protein synthesis. Cells expressing RITE-tagged Tom70 or Oac1 were treated as in (B) with the addition of cycloheximide to inhibit synthesis of new T7-RFP tagged proteins. 100% of the cells show the represented phenotype. N= 50.
Figure 7 with 1 supplement

The mitochondrial import receptors Tom70 and Tom71 are required for MDC formation.
(A) The MDC substrate Cox7 localizes to mitochondria lacking TOM70 and 71. Wild-type (WT) and the indicated mutant strains expressing the inner membrane protein Cox7-GFP were visualized by fluorescence microscopy. (B) Tom70 and 71 are required for vacuole delivery of Cox7-GFP. Quantification of Cox7-GFP in vacuoles of wild-type (WT) and the indicated mutant strains treated with concanamycin A (conc A) for 4 hr. Data represents percentage of cells with Cox7-GFP in the vacuole. Error bars represent standard deviation of 3 replicates. N = 100 for each replicate. (C) Tom70 and 71 are required for MDC formation. Quantification of Cox7-GFP containing MDCs in fission deficient strains lacking the indicated genes treated with concanamycin A (conc A) for 2 hr. Data represents percentage of cells with Cox7-GFP in MDCs. Error bars represent standard deviation of 3 replicates. N = 100 per replicate. (D) Failure to form MDC exacerbates membrane potential loss. Median fluorescence intensity of mitochondrial dye TMRM in wild-type (WT) and the indicated mutant strains treated with and without conc A for 4 hr as measured by flow cytometry. Median fluorescence intensity of a population of cells is presented as a percentage of the WT untreated sample (which is set at 100). N > 20,000 cells. Error bars represent standard deviation of three independent replicates. **p<0.01, ***p<0.001, multiple comparison one-way anova test. (E) Model of the MDC pathway. Loss of vacuole function caused by aging or other mechanisms produces an unknown signal (Step 1) that triggers MDC formation (Step 2). Select mitochondrial inner and outer membrane proteins are incorporated into MDCs, which are subsequently released from mitochondria by the fission GTPase Dnm1 (Step 3). MDCs are then engulfed by autophagosomes (Step 4), and delivered to the vacuole for degradation by autophagy (Step 5). It is currently not clear if the mitochondrial inner membrane (dashed line) is incorporated into MDCs.
Figure 7—figure supplement 1

Further support for the role of Tom70 and 71 in MDC formation.
(A) Cox7-GFP functions as an MDC substrate. Wild-type cells expressing Tom70-mCherry and Cox7-GFP were treated with concanamycin A for 2 hr and representative images showing Cox7 and Tom70 in an MDC (white arrow) are shown. (B) Cox7-GFP gets delivered to the vacuole upon concanamycin A treatment. Wild-type cells expressing Tom70-mCherry and Cox7-GFP were treated with concanamycin A for the indicated time and representative images showing Cox7 and Tom70 within autophagosomes in the vacuole (white arrow) are shown. (C) Representative FACS profiles of wild-type (WT) and the indicated mutant strains grown in the absence or presence of concanamycin A for 4 hr. The median fluorescence intensity of these plots (plus two others not shown here) is presented in Figure 7D. (D) An alternative representation of the data from (C).
Videos
Video 1
3D reconstruction of mitochondria and vacuoles in old wild-type cells.
A representative 3D reconstruction of an old wild-type cell with the same characteristics as those depicted in Figure 1A showing small mitochondrial vesicle-like fragments (green, marked with Tom70-GFP) outside of the severely fragmented vacuole (red, marked with Vph1-mCherry). To permit visualization of the vacuole lumen, the vacuole isosurface rendering becomes 60% transparent in the middle of the movie. Budscars (blue, calcofluor) at the beginning of the movie indicate the cell’s old age.
Video 2
3D reconstruction of mitochondria and vacuoles in old atg5△ cells.
A representative 3D reconstruction of an old atg5△ cell with the same characteristics as those depicted in Figure 1B showing small mitochondrial vesicle-like fragments (green, marked with Tom70-GFP) outside of the severely fragmented vacuole (red, marked with Vph1-mCherry). To permit visualization of the vacuole lumen, the vacuole isosurface rendering becomes 60% transparent in the middle of the movie. Budscars (blue, calcofluor) at the beginning of the movie indicate the cell’s old age.
Video 3
3D reconstruction of mitochondria and vacuoles in old dnm1△ cells.
A representative 3D reconstruction of an old dnm1△ cell with the same characteristics as those depicted in Figure 1B showing the presence of mitochondria (green, marked with Tom70-GFP), but the absence of small mitochondrial vesicle-like fragments outside of the severely fragmented vacuole (red, marked with Vph1-mCherry). To permit visualization of the vacuole lumen, the vacuole isosurface rendering becomes 60% transparent in the middle of the movie. Budscars (blue, calcofluor) at the beginning of the movie indicate the cell’s old age.
Tables
Table 1
MDC Substrates.
| Gene | ORF | Mitochondrial Localizationa |
|---|---|---|
| NCA2 | YPR155C | Outer membrane |
| ALO1 | YML086C | Outer membrane |
| UBP16 | YPL072W | Outer membrane |
| MFB1 | YDR219C | Outer membrane |
| TCD2 | YKL027W | Outer membrane |
| TCD1 | YHR003C | Outer membrane |
| MCY1 | YGR012w | Outer membrane |
| MSP1 | YGR028W | Outer membrane |
| TOM70 | YNL121C | Outer membrane |
| TOM71 | YHR117W | Outer membrane |
| YPR098C | Outer membrane | |
| OM14 | YBR230C | Outer membrane |
| SEN15 | YMR059W | Outer membrane |
| PTH2 | YBL057C | Outer membrane |
| MCP1 | YOR228C | Outer membrane |
| SCM4 | YGR049W | Outer membrane |
| MIR1b | YJR077C | Inner membrane |
| CTP1b | YBR291C | Inner membrane |
| DIC1b | YLR348C | Inner membrane |
| OAC1b | YKL120W | Inner membrane |
| MTM1b | YGR257C | Inner membrane |
| YMC2b | YBR104W | Inner membrane |
| YHM2b | YMR241W | Inner membrane |
| COX7 | YMR256C | Inner membrane |
| YML007C-A | Unknown | |
| ECM19 | YLR390W | Unknown |
-
a, Localization information obtained from SGD (www.yeastgenome.org)
-
b, Mitochondrial carrier protein family member
Additional files
-
Supplementary file 1
Complete results of MDC screen.
- https://doi.org/10.7554/eLife.13943.019
-
Supplementary file 2
Yeast strains used in this study.
- https://doi.org/10.7554/eLife.13943.020
-
Supplementary file 3
Oligos used in this study.
- https://doi.org/10.7554/eLife.13943.021
Download links
A two-part list of links to download the article, or parts of the article, in various formats.
Downloads (link to download the article as PDF)
Open citations (links to open the citations from this article in various online reference manager services)
Cite this article (links to download the citations from this article in formats compatible with various reference manager tools)
Selective sorting and destruction of mitochondrial membrane proteins in aged yeast
eLife 5:e13943.
https://doi.org/10.7554/eLife.13943


