Epidermal RAF prevents allergic skin disease
- Max F. Perutz Laboratories, University of Vienna, Austria
- IRCCS Istituto di Ricerche Farmacologiche "Mario Negri", Italy
- Università degli Studi di Milano, Italy
Figures
Figure 1 with 1 supplement
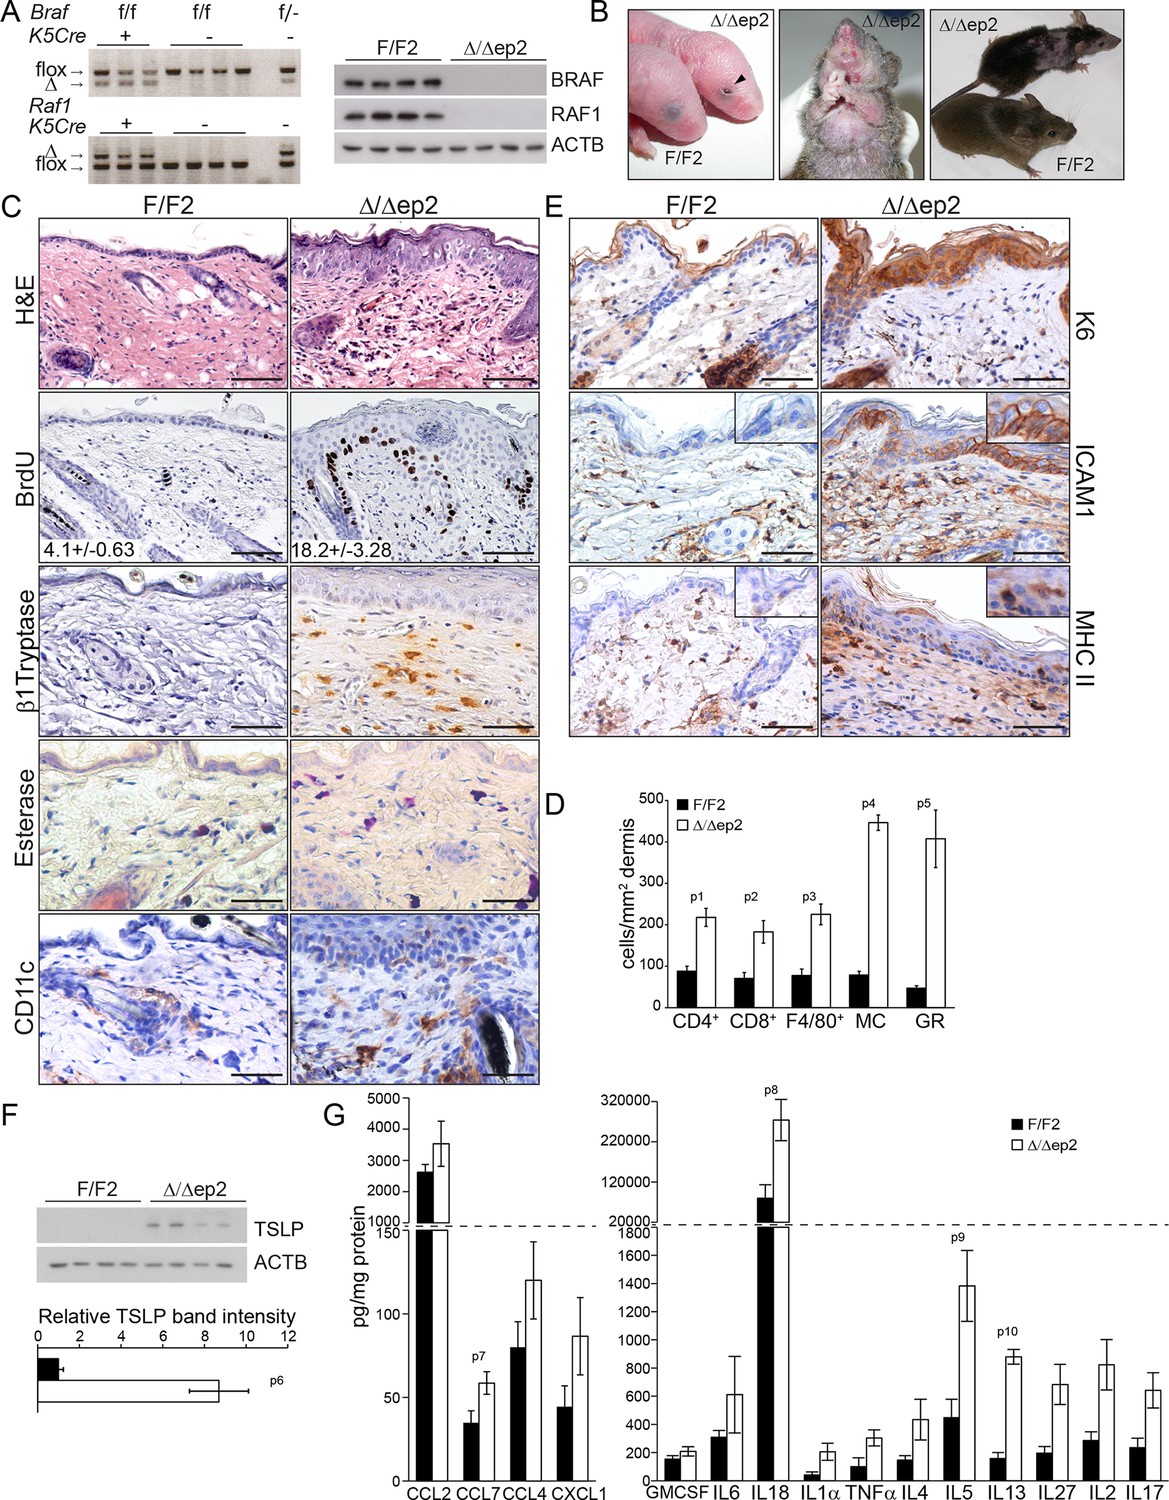
Compound deletion of BRAF and RAF1 in the epidermis leads to severe skin inflammation in adult mice.
(A) BRAF and RAF1 are efficiently deleted in epidermal cells as shown by PCR analysis of tail tissue and immunoblotting of epidermal lysates isolated from 3 weeks old F/F2 and Δ/Δep2 (n = 4). ACTB is shown as a loading control. (B) Macroscopic appearance of newborn and adult F/F2 and Δ/Δep2 mice. Arrowhead highlights the open eye phenotype of Δ/Δep2 pups. (C) Hematoxylin/eosin (H and E) staining shows epidermal thickening and dermal inflammatory infiltrates in Δ/Δep2 mice. BrdU incorporation confirms hyperproliferation in the basal layer of Δ/Δep2 epidermis. The numbers in the inset represent BrdU+ cells/mm2 of epidermis (n = 5–7, mean ± SEM). Infiltrating cells: activated mast cells (β1 Tryptase+), granulocytes (esterase+), dendritic cells (CD11c+). (D) Quantification of the infiltrating cells: T cells (CD4+ and CD8+), macrophages (F4/80+), total mast cells (MC, toluidine blue+), granulocytes (GR, esterase+). (E) Increased expression of K6, ICAM1, and MHC II in Δ/Δep2 keratinocytes/epidermis. Representative images (C, E) and quantification (D) of 5–7 individual couples. Scale bars, 50 µm. (F) Inflammatory chemokines and cytokines in epidermal lysates (n = 3–4). TSLP levels were determined by immunoblotting and quantified by Image J. ACTB served as a loading control. The results were normalized by arbitrarily setting one of the F/F2 samples as 1 and plotted as mean ± SEM. Data represent mean ± SEM. p = 0.011, p1 = 0.001, p2 = 0.007, p3 = 0.001, p4 = 3.06E-6, p5 = 1.37E-4, p6 = 0.002, p7 = 0.049, p8 = 0.042, p9 = 0.046 and p10 = 0.001.
Figure 1—figure supplement 1
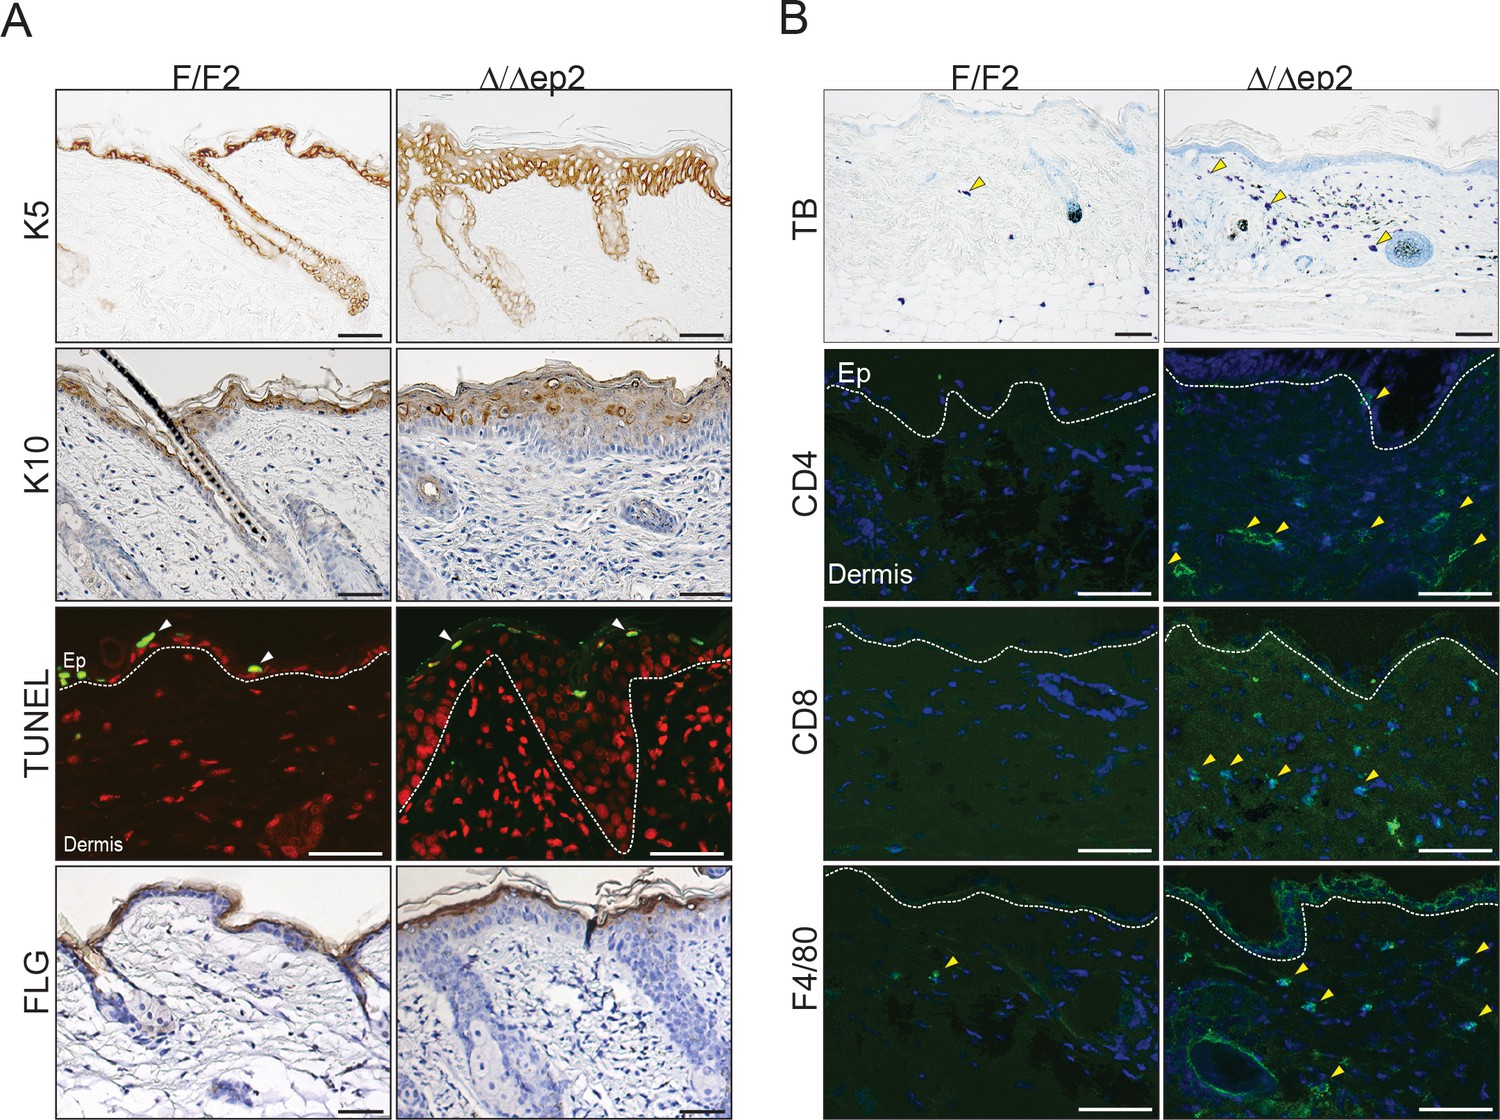
Local inflammation in adult mice lacking BRAF and RAF1 in the epidermis.
(A) Immunohistochemical analysis of epidermal differentiation (K5, K10 and FLG (filaggrin)) and apoptosis (TUNEL+). (B) Skin sections of adult F/F2 and △/△ep2 mice showing dermal infiltration: total mast cells (toluidine blue, TB+), macrophages (F4/80+) and T cells (CD4+ and CD8+). Arrows indicate positive cells. Quantification is shown in Figure 1D (n = 5–7). Scale bars, 50 µm.
Figure 2

Inflammatory response in adult Δ/Δep2 animals.
(A) The body weight of Δ/Δep2 mice is significantly reduced compared to their littermates (n = 5). The data was analyzed by two-way analysis of variance (ANOVA) test. (B) Increased spleen/body weight ratio and increased numbers of splenic Mac1+Gr1+ cells in adult Δ/Δep2 animals (n = 4–5). (C) Enlarged lymph nodes and and activated T, B, and dendritic cells in adult Δ/Δep2 (n = 4–8). T cells (CD4+ or CD8+) and B cells (B220+) activation was determined by costaining with CD69; activated dendritic cells were identified as CD11c+ and MHC IIhi or CD80+. (D) Circulating blood cells and plasma levels of chemokines and IgE antibodies in adult mice (n = 6–8). Data represent mean ± SEM. p1 = 0.0002, p2 = 0.023, p3 = 0.002, p4 = 0.002, p5 = 9.83E-8, p6 = 6.31E-7, p7 = 2.91E-7, p8 = 0.004, p9 = 0.001, p10 = 0.008, p11 = 0.011, p12 = 0.046, p13 = 0.050, p14 = 3.65E-4 and p15 = 0.001.
Figure 3 with 1 supplement
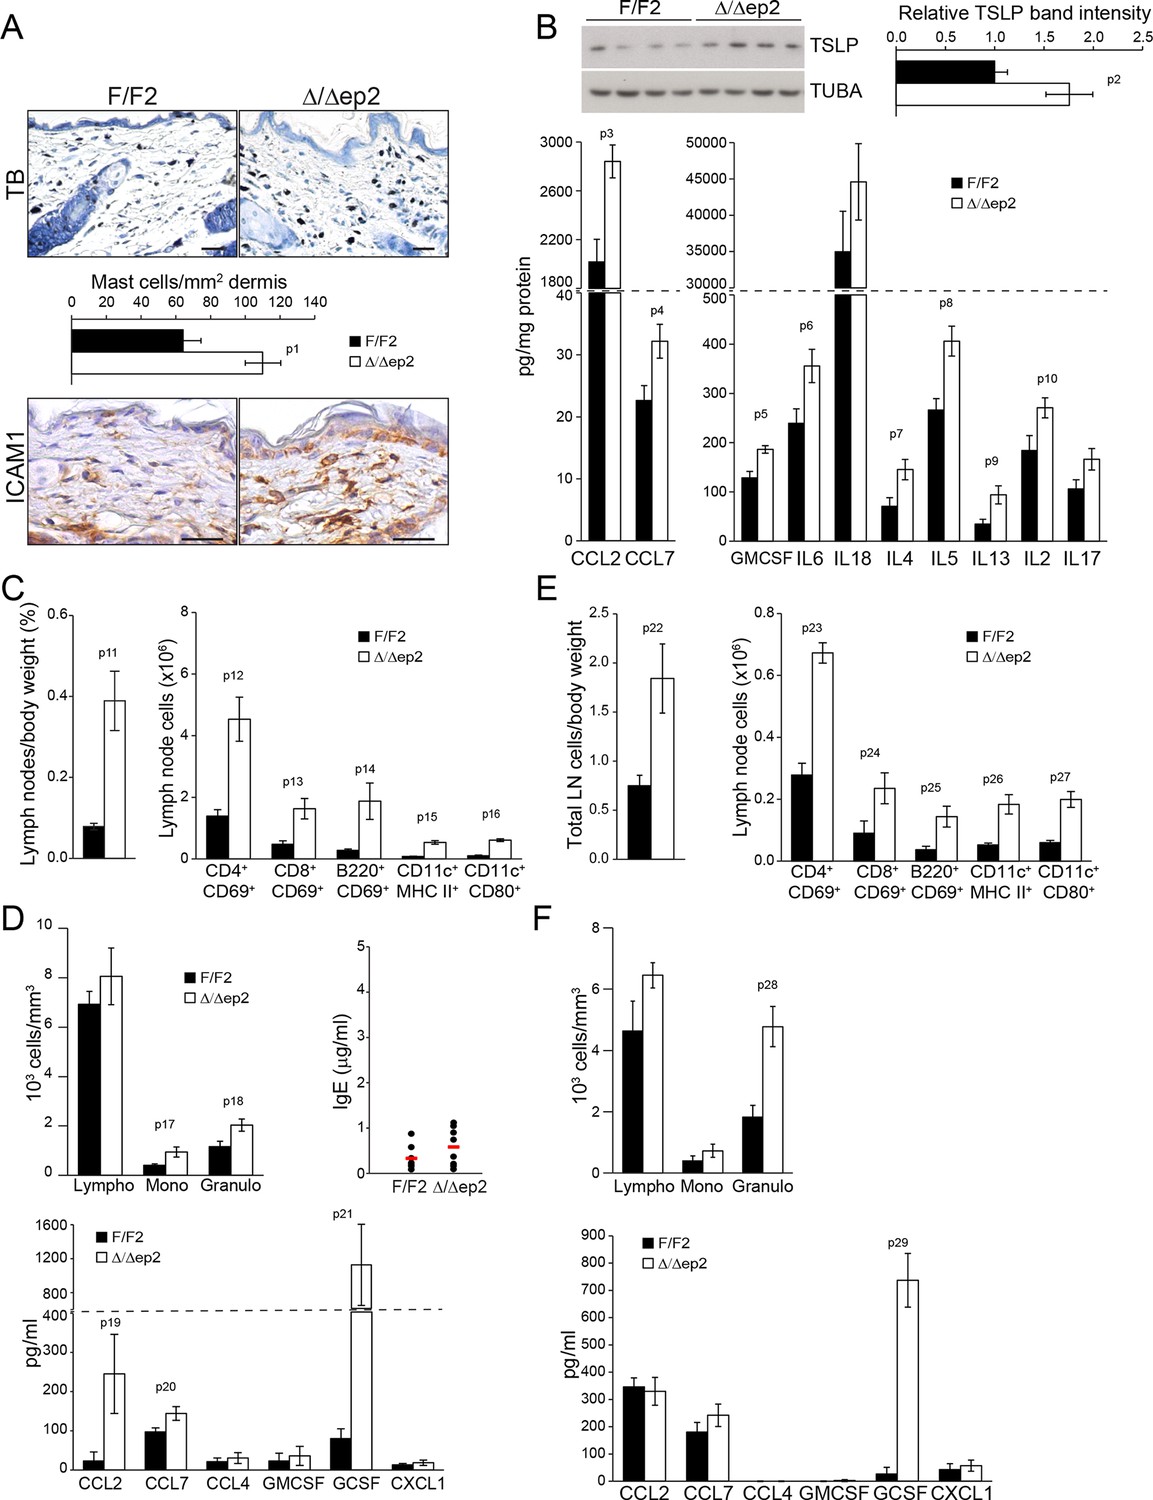
Local and systemic inflammatory phenotype in young Δ/Δep2 animals.
(A) Local inflammation in 3 weeks old Δ/Δep2 animals. Total mast cells (toluidine blue staining, TB; quantified in the plot, n = 4–5) and ICAM1 staining. Scale bars, 25 µm. (B) Inflammatory chemokines and cytokines in epidermal lysates (n = 4–5). TSLP levels were determined by immunoblotting and quantified and analyzed as in Figure 1F. TUBA served as a loading control. (C, D) Systemic inflammatory parameters in 3 weeks old mice. (C) Lymph node size and composition (n = 4). (D) Circulating blood cells (n = 8) and plasma concentration of IgE (n = 8) and chemokines (n = 9). (E, F) Systemic inflammatory parameters in 10 days old mice. (E) Lymph node size and composition (n = 4–10). (F) Hemogram showing elevated amounts of granulocytes (upper panel, n = 4–7) and plasma chemokine levels showing increased GCSF (n = 4). Data represent mean ± SEM. p1 = 0.016, p2 = 0.041, p3 = 0.013, p4 = 0.040, p5 = 0.013, p6 = 0.032, p7 = 0.026, p8 = 0.007, p9 = 0.029, p10 = 0.048, p11 = 0.015, p12 = 0.018, p13 = 0.033, p14 = 0.036, p15 = 3.00E-04, p16 = 3.88E-05, p17 = 0.026, p18 = 0.021, p19 = 0.048, p20 = 0.034, p21 = 0.042, p22 = 0.008, p23 = 0.001, p24 = 0.018, p25 = 0.005, p26 = 0.001, p27 = 0.001, p28 = 0.011 and p29 = 0.014.
Figure 3—figure supplement 1
Local and systemic response in 3 weeks old △/△ep2 animals.
(A) Eyelid inflammation in 3 weeks old △/△ep2 animals. Skin architecture (H&E), proliferation rate (percentage of BrdU+ cells in the epidermis), mast cells activation (β1 Tryptase+), granulocytes (esterase+) and dendritic cell (CD11c+) numbers are indistinguishable in 3 weeks old F/F2 and △/△ep2 littermates. Quantifications of the proliferating cells and granulocytes are shown in the insets (n = 3). (B) Three weeks old △/△ep2 epidermis does not express the activation markers K6 and MHC II. Scale bars, 25 µm. (C) Inflammatory chemokines and cytokines in 3 weeks old epidermal lysates (n = 5). (D) Normal spleen size and composition in 3 weeks old △/△ep2 mice (n = 4–6). Data represent mean ± SEM.
Figure 4 with 1 supplement
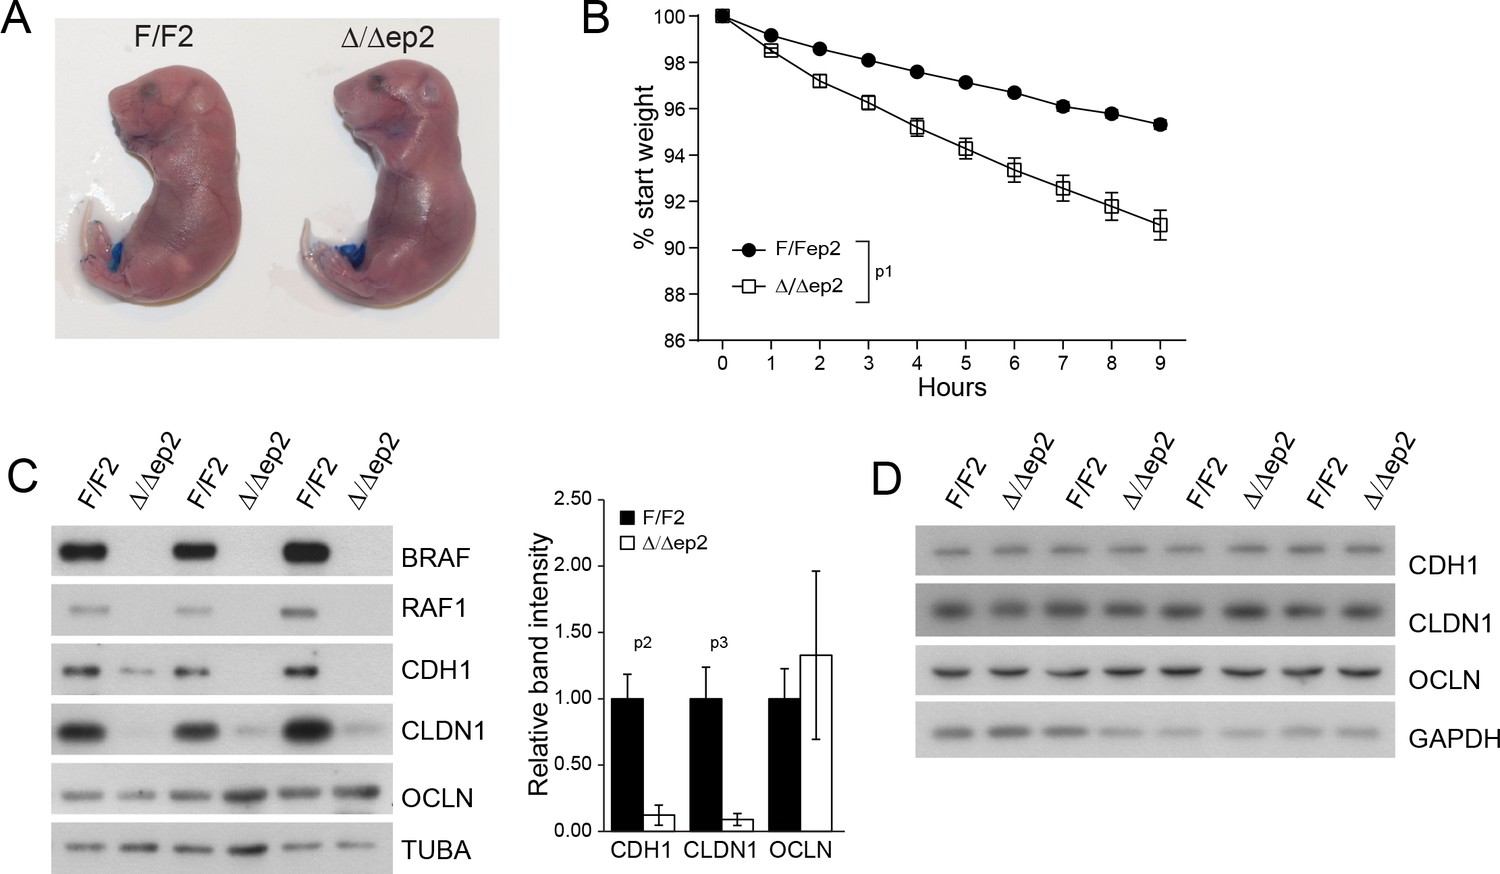
Transient inside-outside barrier defects in Δ/Δep2 animals.
(A) Intact outside-in barrier function (determined by toluidine blue penetration of the stratum corneum) in E19.5-day-old Δ/Δep2 embryos compared to controls (n = 6). Representative pictures; two independent experiments were performed with identical results. (B) Increased water loss in the Δ/Δep2 E18.5 embryos as demonstrated by weight analysis. Results are displayed as percentage of initial weight (n = 41 for F/F2 and n = 11 for Δ/Δep2). The data was analyzed by two-way analysis of variance (ANOVA) test. (C, D) Immunoblot analysis of CDH1, CLDN1 and OCLN expression in epidermal lysates of 3 days old (C, n = 3; quantification shown in the plot, performed as in Figure 1F) or 3 weeks old Δ/Δep2 animals. TUBA and GAPDH are shown as loading controls. Data represent mean ± SEM. p1 = 0.0001, p2 = 0.028, p3 = 0.020.
Figure 4—figure supplement 1
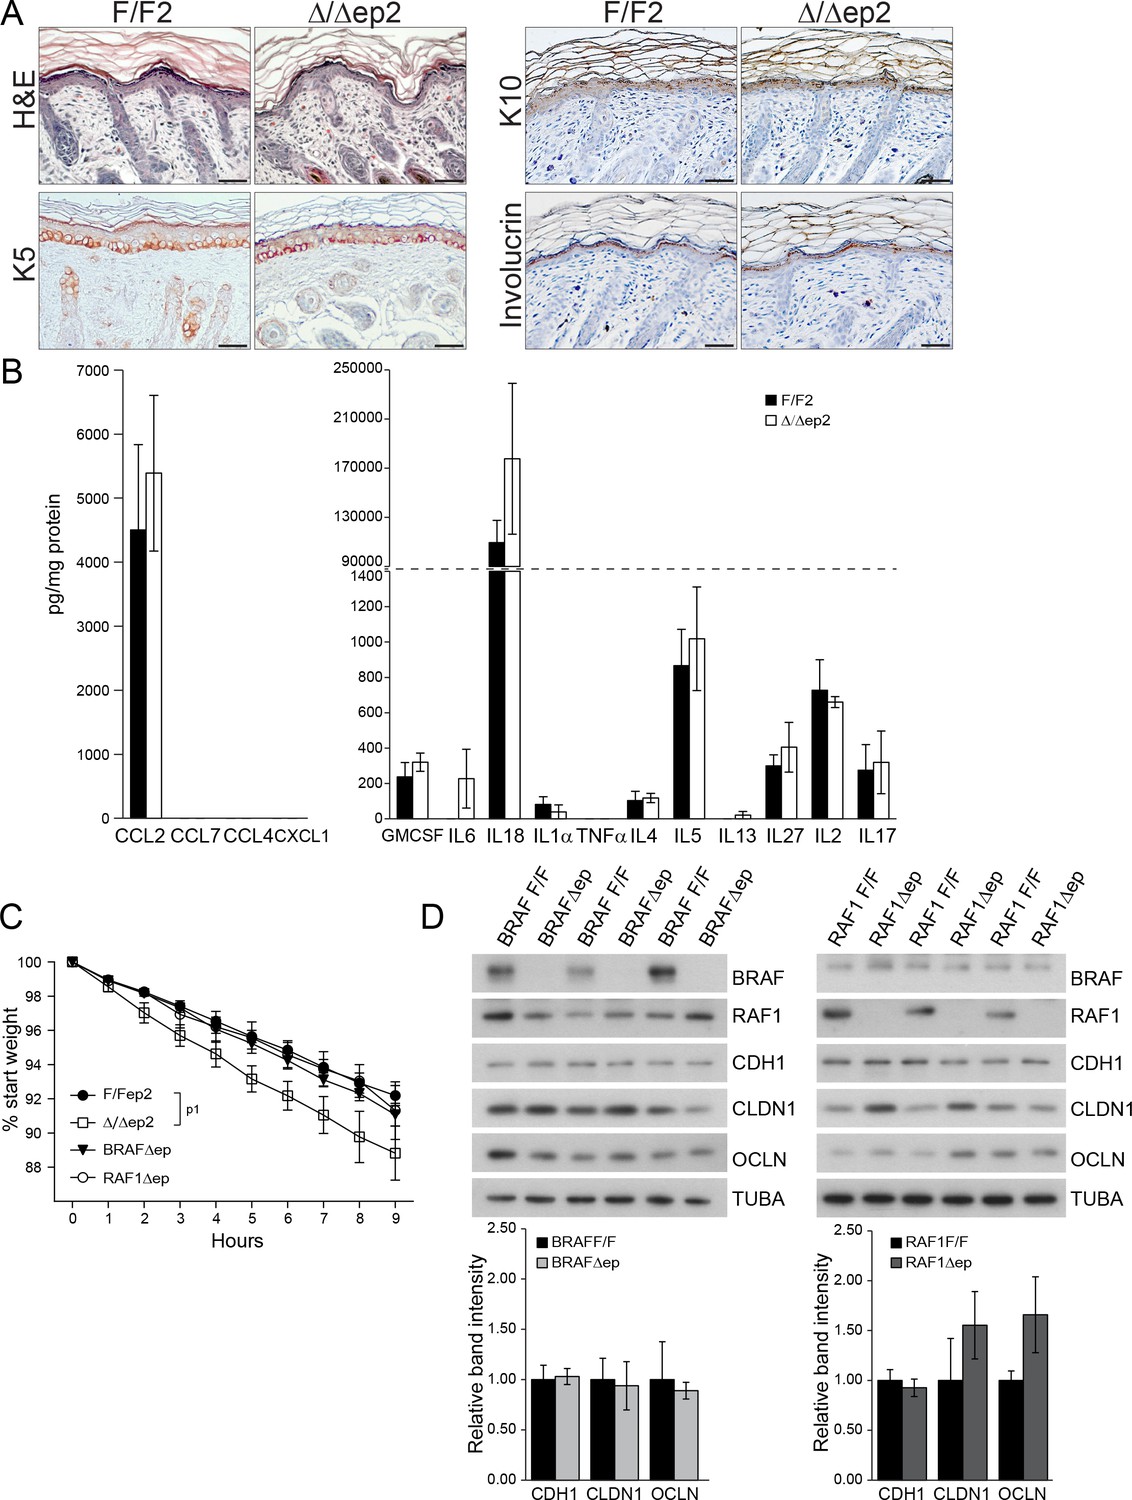
Skin architecture and inflammatory factors in 3 days old F/F2 and △/△ep2 animals.
(A) Similar skin architecture in F/F2 and △/△ep2 pups based on H and E staining and on the analysis of differentiation markers (K5, K10 and involucrin). Scale bars, 50 µm. (B) Inflammatory chemokines and cytokines in epidermal lysates (n = 3). (C) Transepidermal water loss as determined by body weight analysis in E18.5 embryos lacking either BRAF (BRAFΔ/Δep) or RAF1 (RAF1Δ/Δep) in the epidermis (n = 10 for F/F2, n = 4 for Δ/Δep2, n = 3 for BRAFΔ/Δep and n = 6 for RAF1Δ/Δep). The data was analyzed by two-way analysis of variance (ANOVA) test. (D) Expression levels of tight junction proteins in the epidermis of P3 BRAFΔ/Δep or RAF1Δ/Δep pups quantified and plotted as in Figure 1F (n = 3). TUBA is used as a loading control. Data represent mean ± SEM. p1 = 0.0442.
Figure 5 with 1 supplement
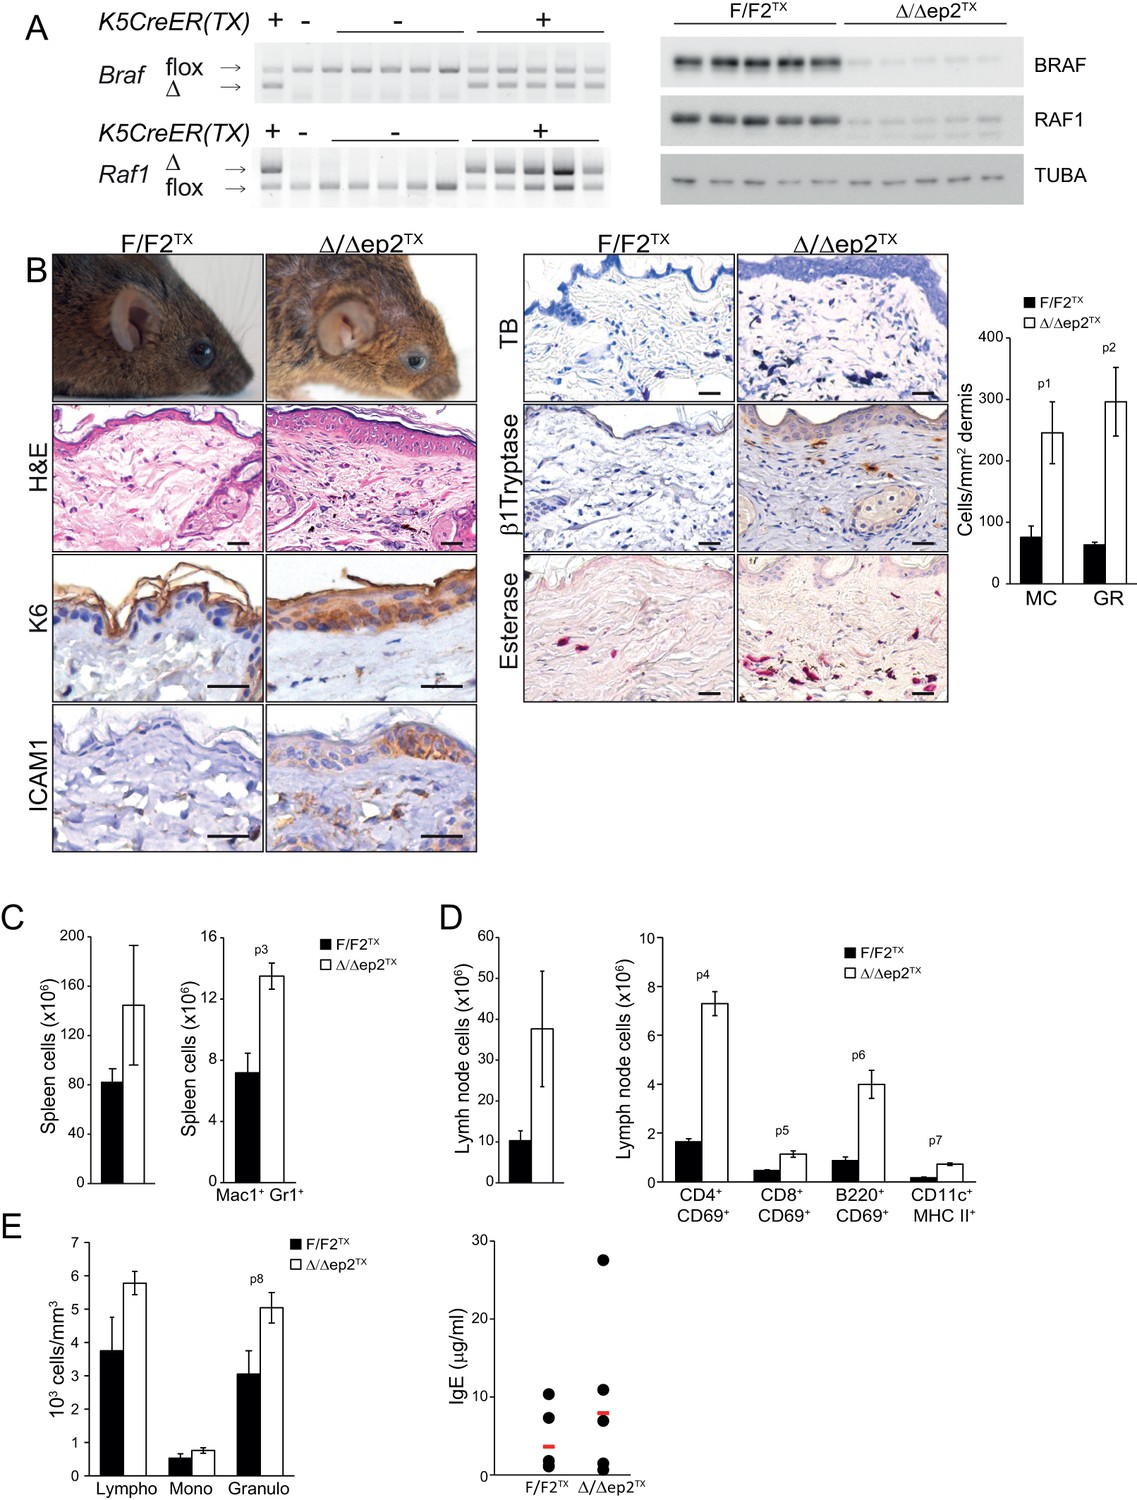
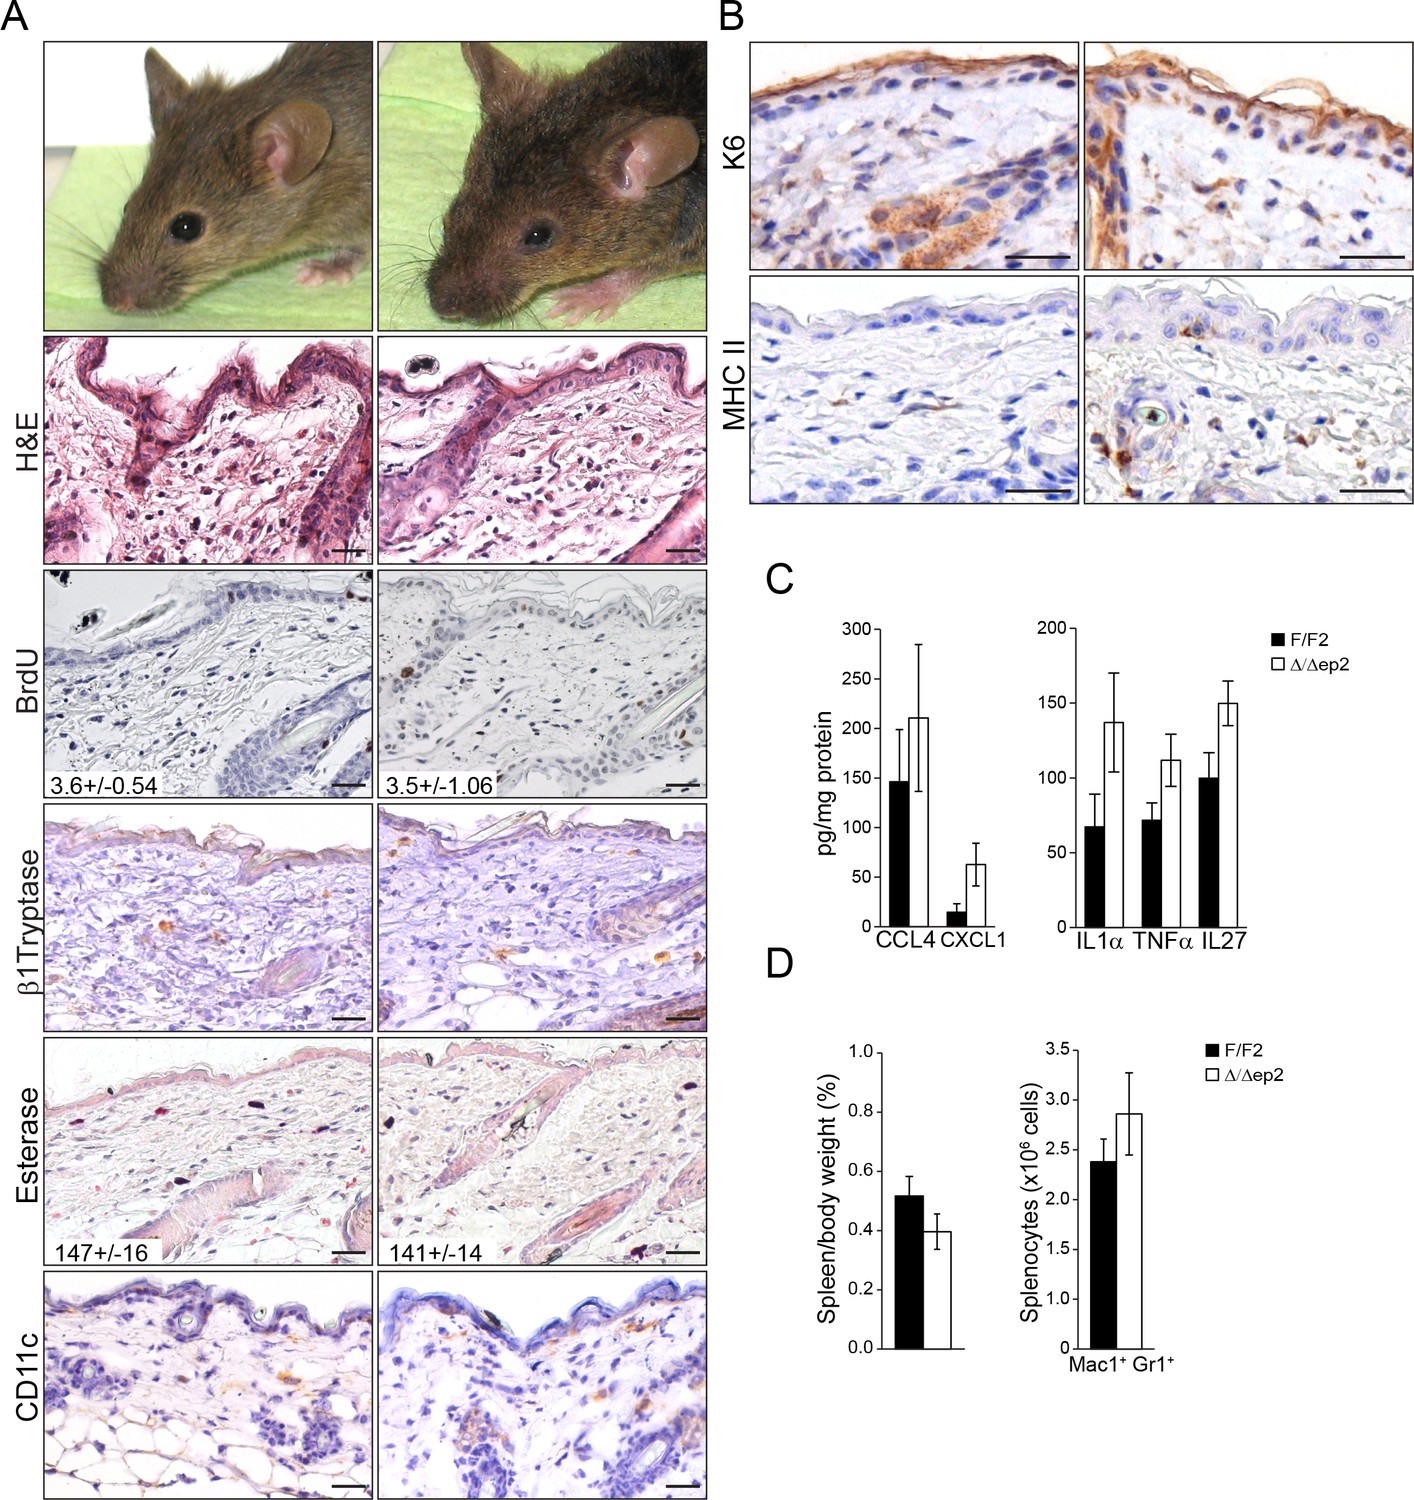
Local and systemic inflammation in Δ/Δep2TX mice.
(A) PCR analysis of tail tissue (left) and immunoblot analysis of epidermal lysates obtained from Δ/Δep2TX animals. (B) Macroscopic appearance of Δ/Δep2TX mice and histological analysis of H&E sections. Scale bars, 25 µm. Infiltrating cells: mast cells (MC; TB+), activated mast cells (β1 Tryptase+; modest), granulocytes (GR; esterase+). The plot shows a quantification of the histological analysis. (C) Mild splenomegaly with increased numbers of Mac1+Gr1+ cells in Δ/Δep2TX animals. (D) Activated T cells, B cells and dendritic cells in the lymph nodes of Δ/Δep2TX animals. (E) Mild lymphocytosis and significantly elevated granulocyte numbers in Δ/Δep2TX mice. The right panel shows comparable IgE plasma levels in control and Δ/Δep2TX animals. Data are plotted as mean ± SEM (n = 5; p1 = 0.034, p2 = 0.014, p3 = 0.005, p4 = 2.63E-4, p5 = 0.001, p6 = 0.001, p7 = 0.019 and p8 = 0.042).
Figure 5—figure supplement 1
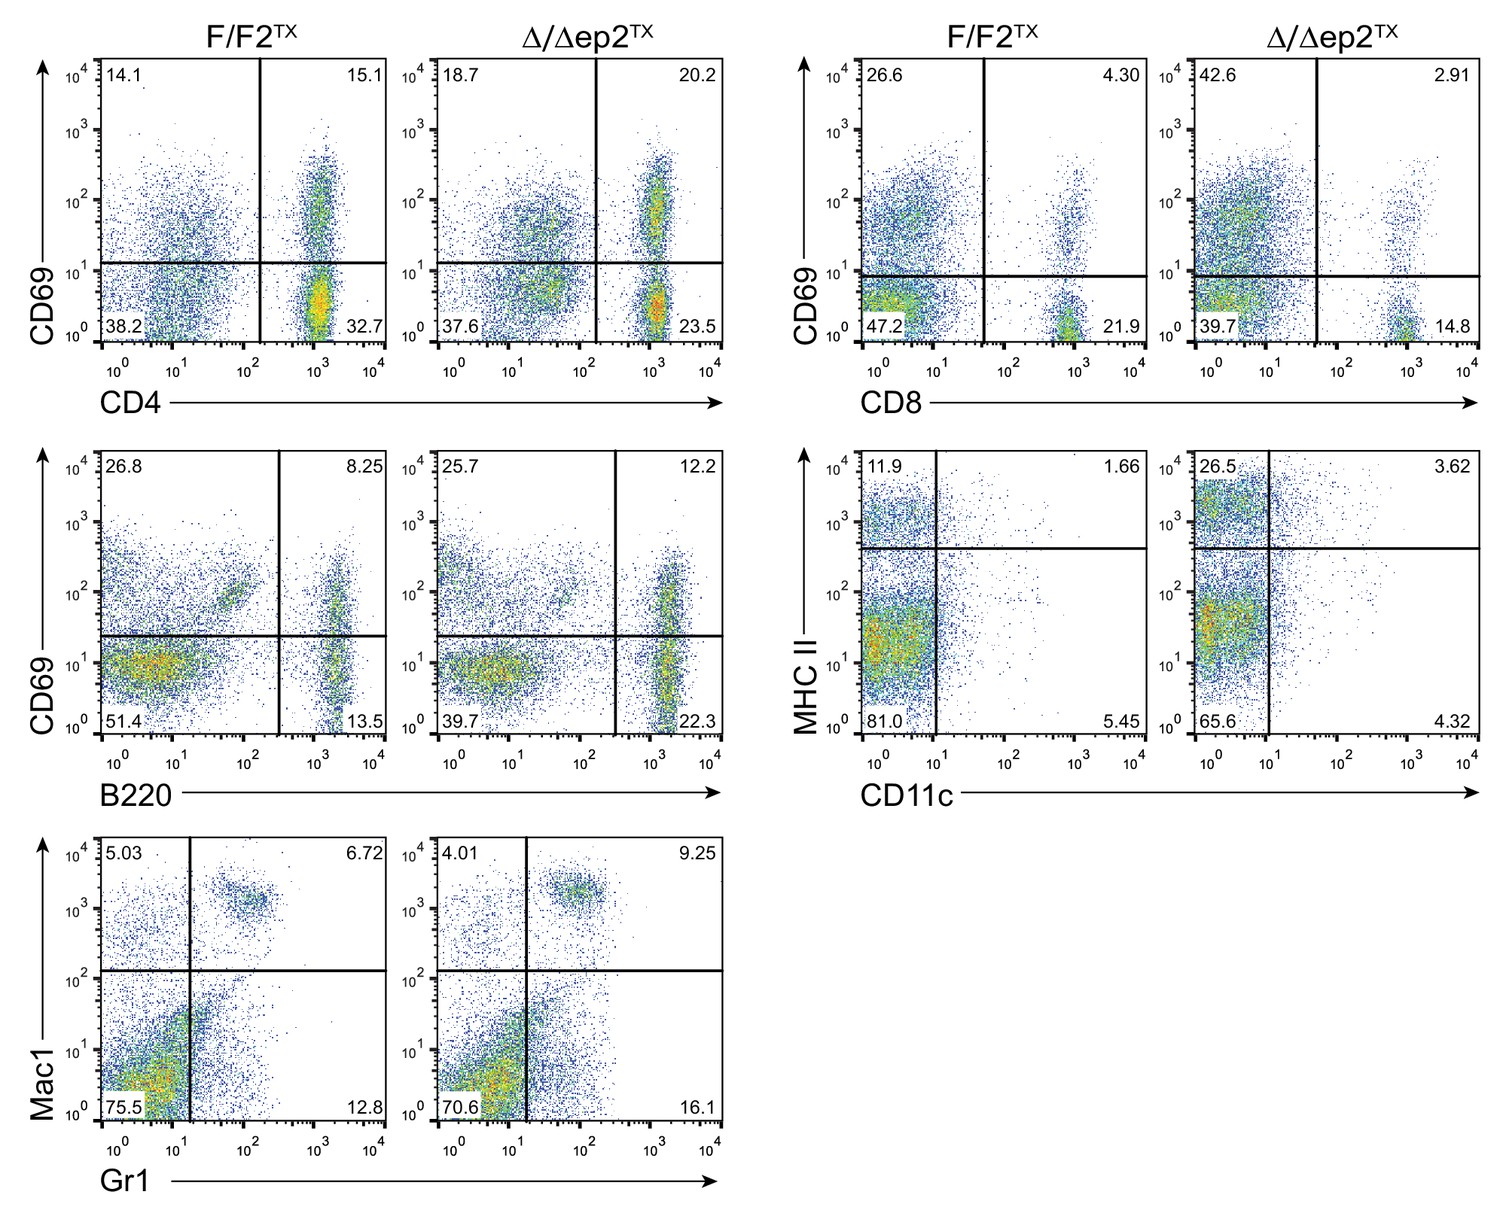
Representative FACS analysis of lymph node and spleen cells isolated from adult F/F2TX Δ/Δep2TX animals.
The percentage of activated lymphocytes in lymph nodes was assessed by combining lineage specific markers (CD4 and CD8 for T lymphocytes; B220 for B lymphocytes) with the activation marker CD69. Activated dendriditic cells were identified by staining with CD11c and MHC II antibodies. Myeloid cells in the spleen were analyzed by staining with Mac1 and Gr1 antibodies. The percentage of single and double positive cells is indicated.
Figure 6
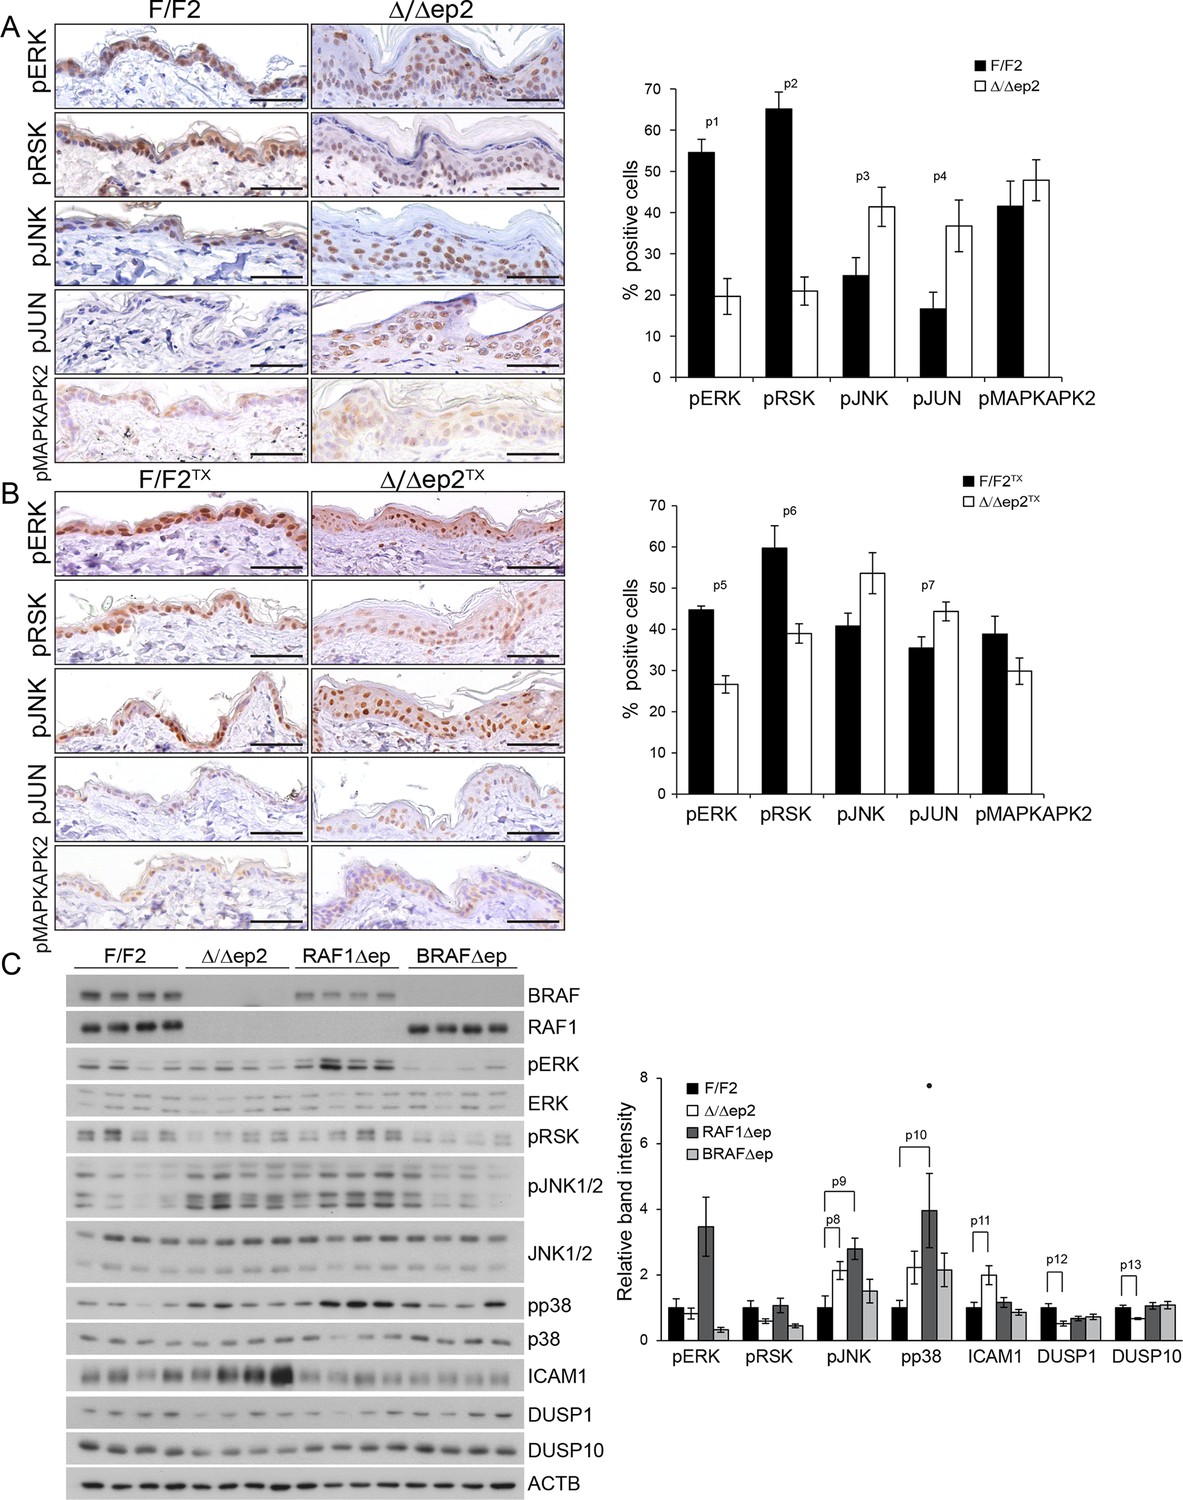
Molecular consequences of BRAF/RAF1 deletion in primary keratinocytes and epidermis.
(A, B) Immunohistochemical analysis of pERK and pJNK, their downstream targets pRSK and pJUN, and the p38 downstream target pMAPKAPK2 in adult F/F2 and Δ/Δep2 (A), and F/F2TX Δ/Δep2TX epidermis (B). Scale bars, 50 µm. The plots on the right show the percentage of positive cells in the epidermis (n = 4–5). (C) Immunoblot analysis of MAPK signaling in 3 weeks old epidermal lysates (n = 4), quantified as in Figure 1F. ACTB is shown as a loading control. Phosphorylation is expressed as the ratio between the signals obtained obtained with the phosphospecific antibody and with the protein-specific antibody. In both cases, the data are normalized to one of the F/F2 samples, which was arbitrarily set as 1. Data are plotted as mean ± SEM. p1 = 2.73E-4, p2 = 4.15E-5, p3 = 0.042, p4 = 0.031, p5 = 0.001, p6 = 0.023, p7 = 0.038, p8 = 0.049, p9 = 0.010, p10 = 0.030, p11 = 0.033, p12 = 0.023 and p13 = 0.018.
Figure 7 with 1 supplement

MEK/ERK inhibition in RAF1Δep animals phenocopies the Δ/Δep2 phenotype.
RAF1Δep animals were treated with a MEK inhibitor (MEKi; trametinib, daily by gavage for 32 days). (A) Immunoblot of epidermal lysates showing the effect of MEKi on the phosphorylation and expression of the indicated proteins. GAPDH is shown as a loading control. (B) Macroscopic appearance (top panels) and histological analysis of vehicle versus MEKi-treated animals. Mast cells (TB+) and activated mast cells (β1 Tryptase+) are quantified in the plots on the left. Scale bars 25 μm. (C) Inflammatory chemokines and cytokines in epidermal lysates of MEKi treated-mice. TSLP levels were determined by immunoblotting and quantified and analyzed as in Figure 1F. ACTB served as a loading control. (D) Increased numbers of splenic Mac1+ Gr1+ cells and of activated T cells, B cells and dendritic cells in the lymph nodes of MEKi-treated RAF1Δep animals. (E) Mild monocytosis and granulocytosis in MEKi-treated RAF1Δep animals and elevated amount of plasma IgE. Data represent mean ± SEM (n = 3; p1 = 0.002, p2 = 0.017, p3 = 0.003, p4 = 0.025, p5 = 0.041, p6 = 0.022, p7 = 0.023, p8 = 0.029, p9 = 0.010, p10 = 0.032, p11 = 0.044, p12 = 0.053, p13 = 0.015, p14 = 0.001, p15 = 0.031, p16 = 0.049, p17 = 0.026, p18 = 0.038, p19 = 0.015, p20 = 0.001, p21 = 0.005, p22 = 0.002, p23 = 0.033, p24 = 0.006, p25 = 0.039, p26 = 0.025, p27 = 0.004, p28 = 0.020, p29 = 0.027 and p30 = 0.028).
Figure 7—figure supplement 1
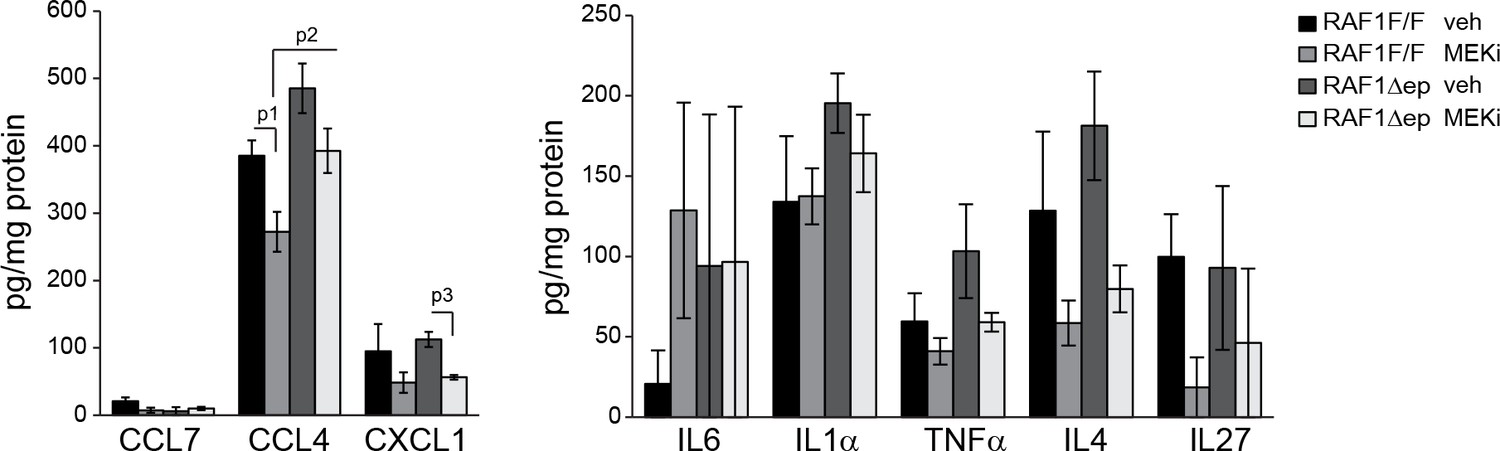
Epidermal chemokine and cytokine levels in MEKi treated mice.
Inflammatory chemokines and cytokines in epidermal lysates of vehicle or MEKi treated mice. Data represents mean ± SEM (n = 3; p1 = 0.043, p2 = 0.054 and p3 = 0.029).
Figure 8 with 2 supplements
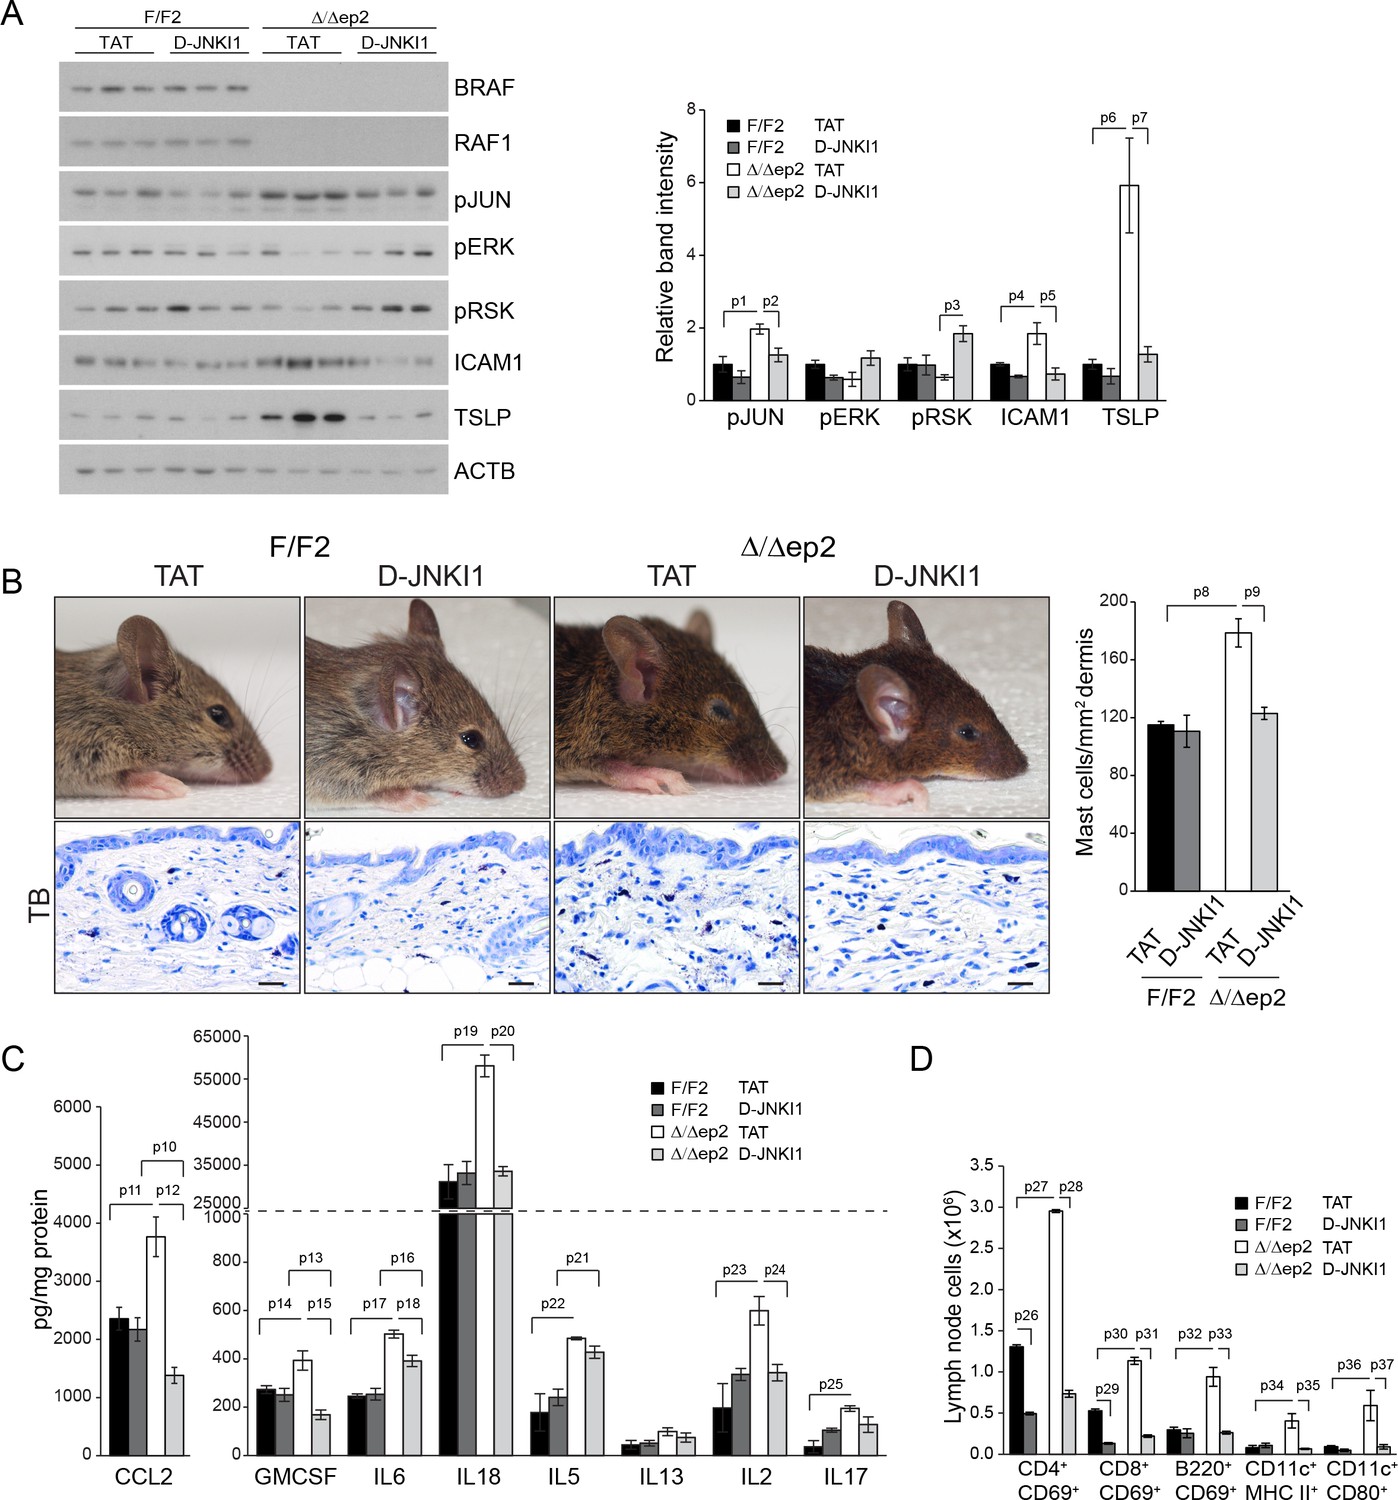
D-JNKI1 treatment rescues inflammation in Δ/Δep2 mice.
Mice were treated with D-JNKI1 or TAT peptide (22 mg/kg i.p. at 10 days of age) and analyzed after 12 days (A) D-JNKI1 treatment prevents disease onset in Δ/Δep2 mice. Immunoblot of epidermal lysates showing the effect of D-JNKI1 on the phosphorylation and expression of the indicated proteins, quantified as in Figure 1F. ACTB is shown as a loading control. (B–D) Decreased eyelid inflammation, mast cells infiltration (B; TB+; quantified in the plot on the right), epidermal chemokine/cytokine levels (C) and activated T cells, B cells and dendritic cells in lymph nodes (D) in D-JNKI1-treated Δ/Δep2 mice. Scale bars, 25 µm. Data represent mean ± SEM (n = 3–5; p1 = 0.026, p2 = 0.042, p3 = 0.022, p4 = 0.048, p5 = 0.044, p6 = 0.020, p7 = 0.025, p8 = 0.018, p9 = 0.016, p10 = 0.014, p11 = 0.023, p12 = 0.011, p13 = 0.039, p14 = 0.049, p15 = 0.015, p16 = 0.003, p17 = 1.70E-4, p18 = 0.008, p19 = 0.008, p20 = 0.004, p21 = 0.003, p22 = 0.017, p23 = 0.026, p24 = 0.027, p25 = 0.005, p26 = 2.13E-6, p27 = 4.50E-8, p28 = 1.39E-5, p29 = 0.001, p30 = 0.001, p31 = 0.001, p32 = 0.023, p33 = 2.35E-4, p34 = 0.050, p35 = 0.002, p36 = 0.050 and p37 = 0.012).
Figure 8—figure supplement 1
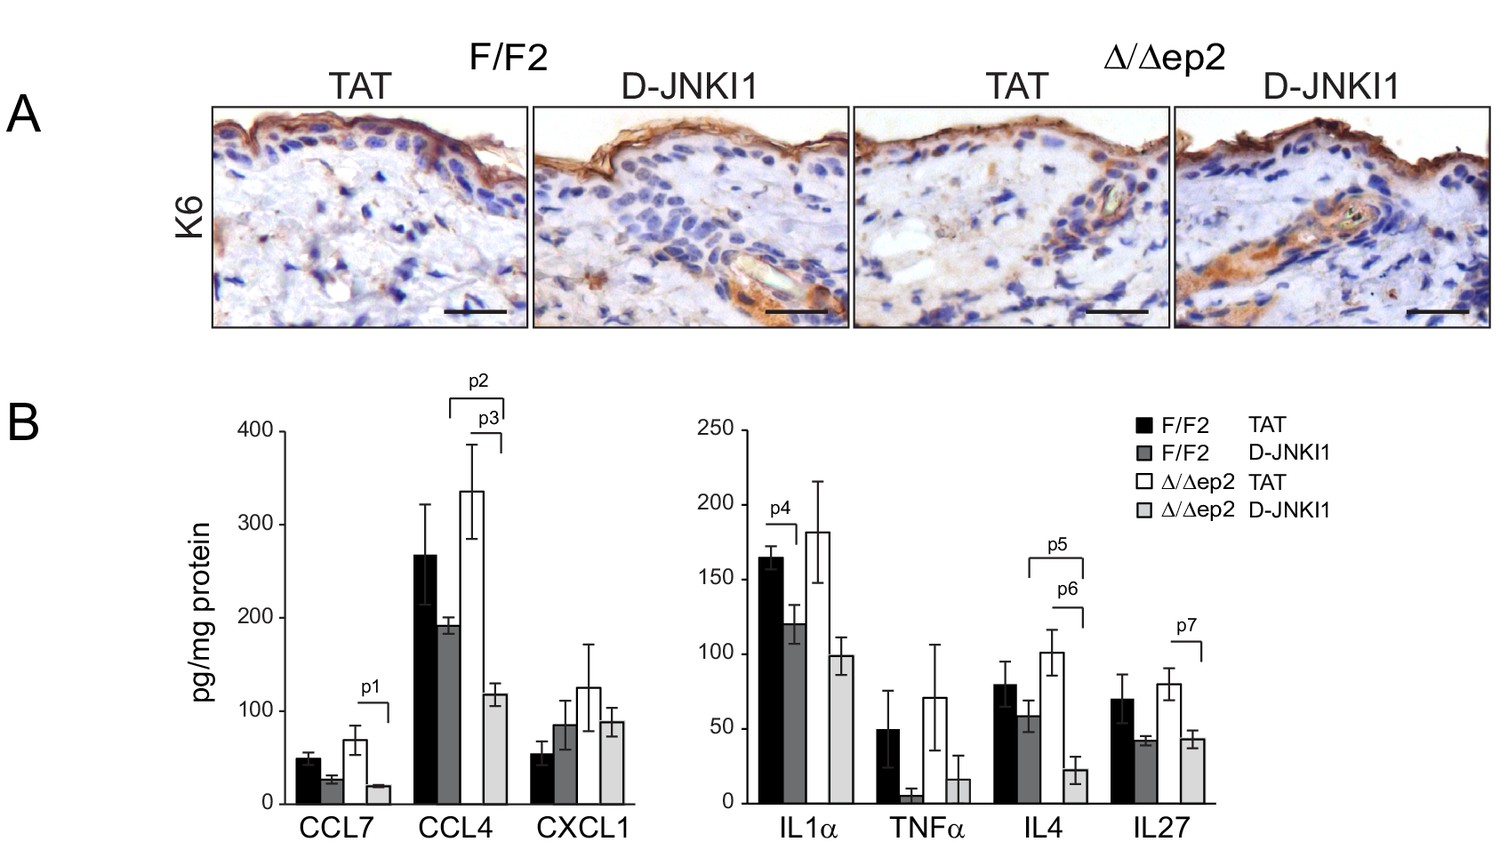
K6 expression and epidermal chemokine and cytokine levels in D-JNKI1-treated mice.
(A) K6 expression is indistinguishable in TAT or D-JNKI1 treated F/F2 and △/△ep2 littermates. Scale bars, 25 µm. (B) Inflammatory chemokines and cytokines in epidermal lysates of TAT or D-JNKI1-treated mice. Data represent mean ± SEM (n = 3–5; p1 = 0.005, p2 = 0.001, p3 = 0.043, p4 = 0.026, p5 = 0.032, p6 = 0.016 and p7 = 0.051).
Figure 8—figure supplement 2
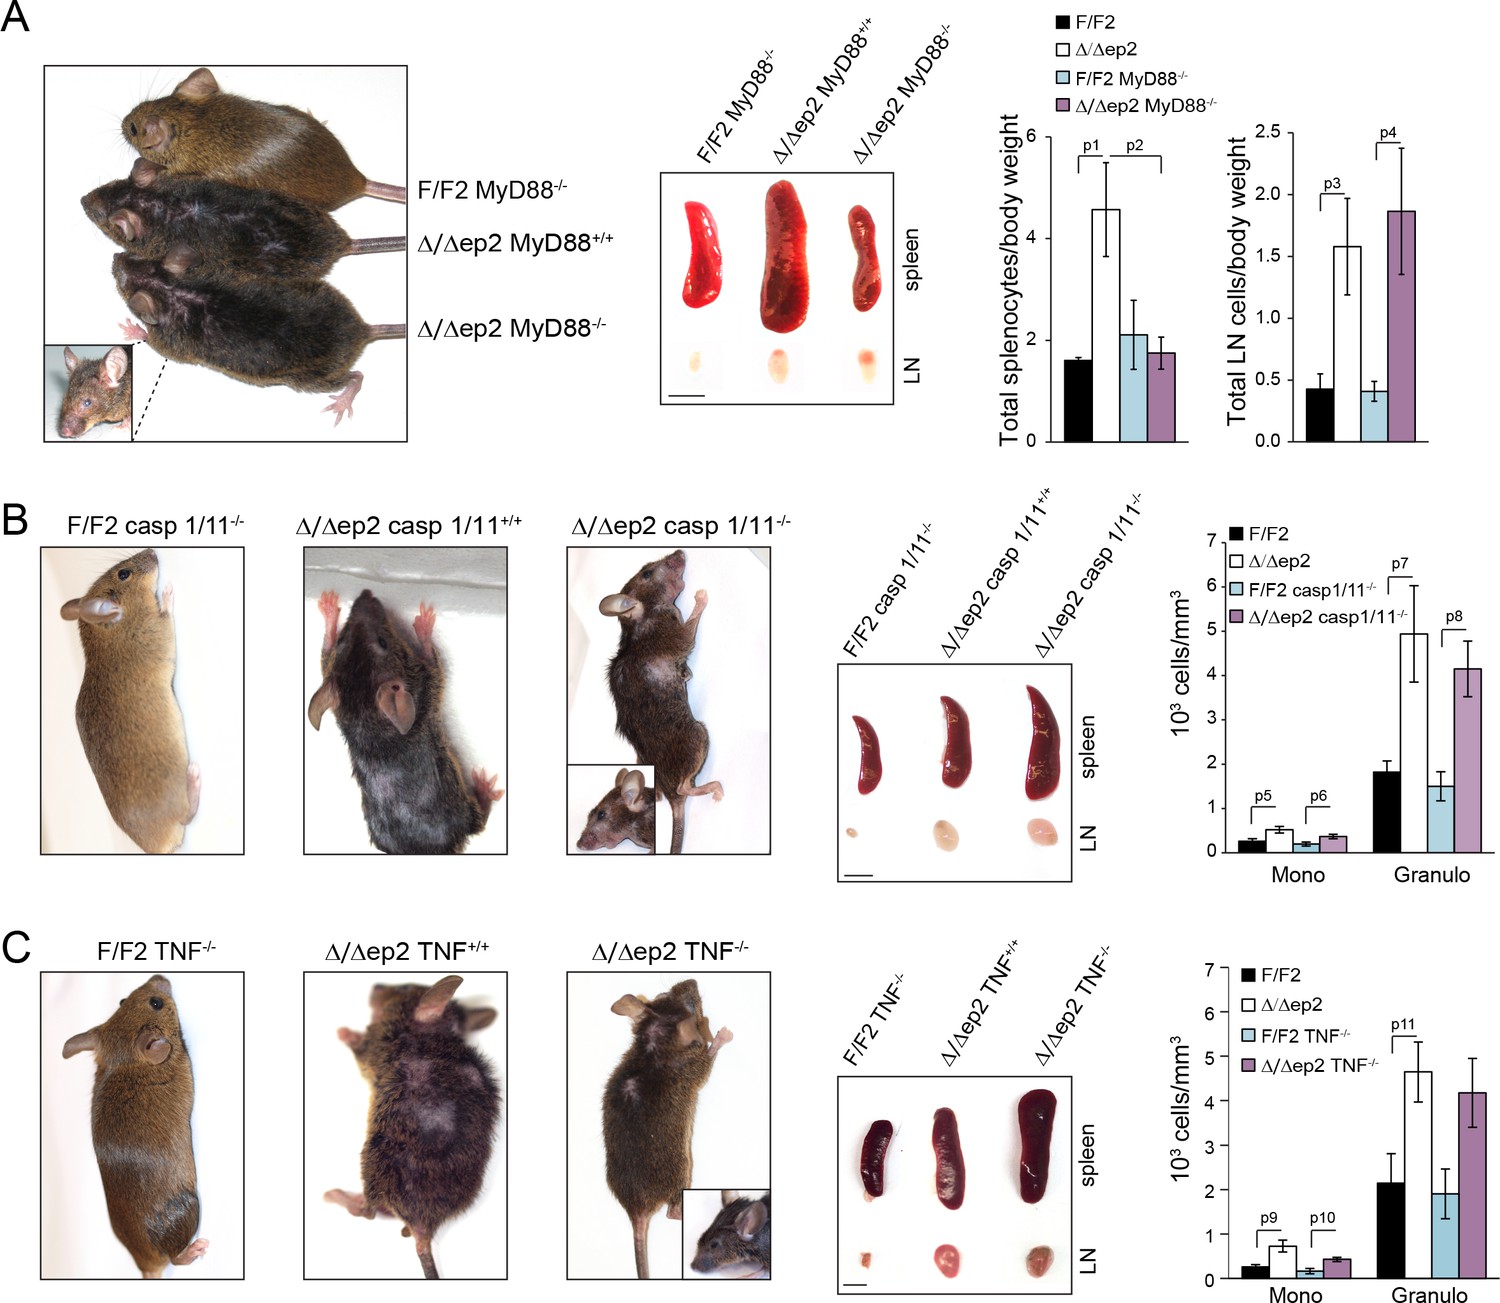
The inflammatory phenotype of Δ/Δep2 mice is not rescued by MyD88, caspase 1/11, or TNF knockout.
Macroscopic appearance, spleen and lymph node size and circulating blood cell analysis are shown for the indicated genotypes (A–C). (A) Representative pictures of 4 month old Δ/Δep2, Δ/Δep2 MyD88-/- and control animals. Plots on the right represent the ratio between total splenocytes or lymph node cell numbers and body weight (n = 3–4). (B) Representative pictures and hemogram of 4 month old Δ/Δep2, Δ/Δep2 caspase 1/11-/- and control animals (n = 5–6). (C) Representative pictures and hemogram of 4 month old Δ/Δep2, Δ/Δep2 TNF-/- and control animals (n = 4–5). The macroscopic appearance of at least ten mice per genotype was monitored. Data represent mean ± SEM. p1 = 0.041, p2 = 0.052, p3 = 0.024, p4 = 0.023, p5 = 0.026, p6 = 0.034, p7 = 0.023, p8 = 0.007, p9 = 0.031, p10 = 0.011, and p11 = 0.034.
Figure 9 with 1 supplement
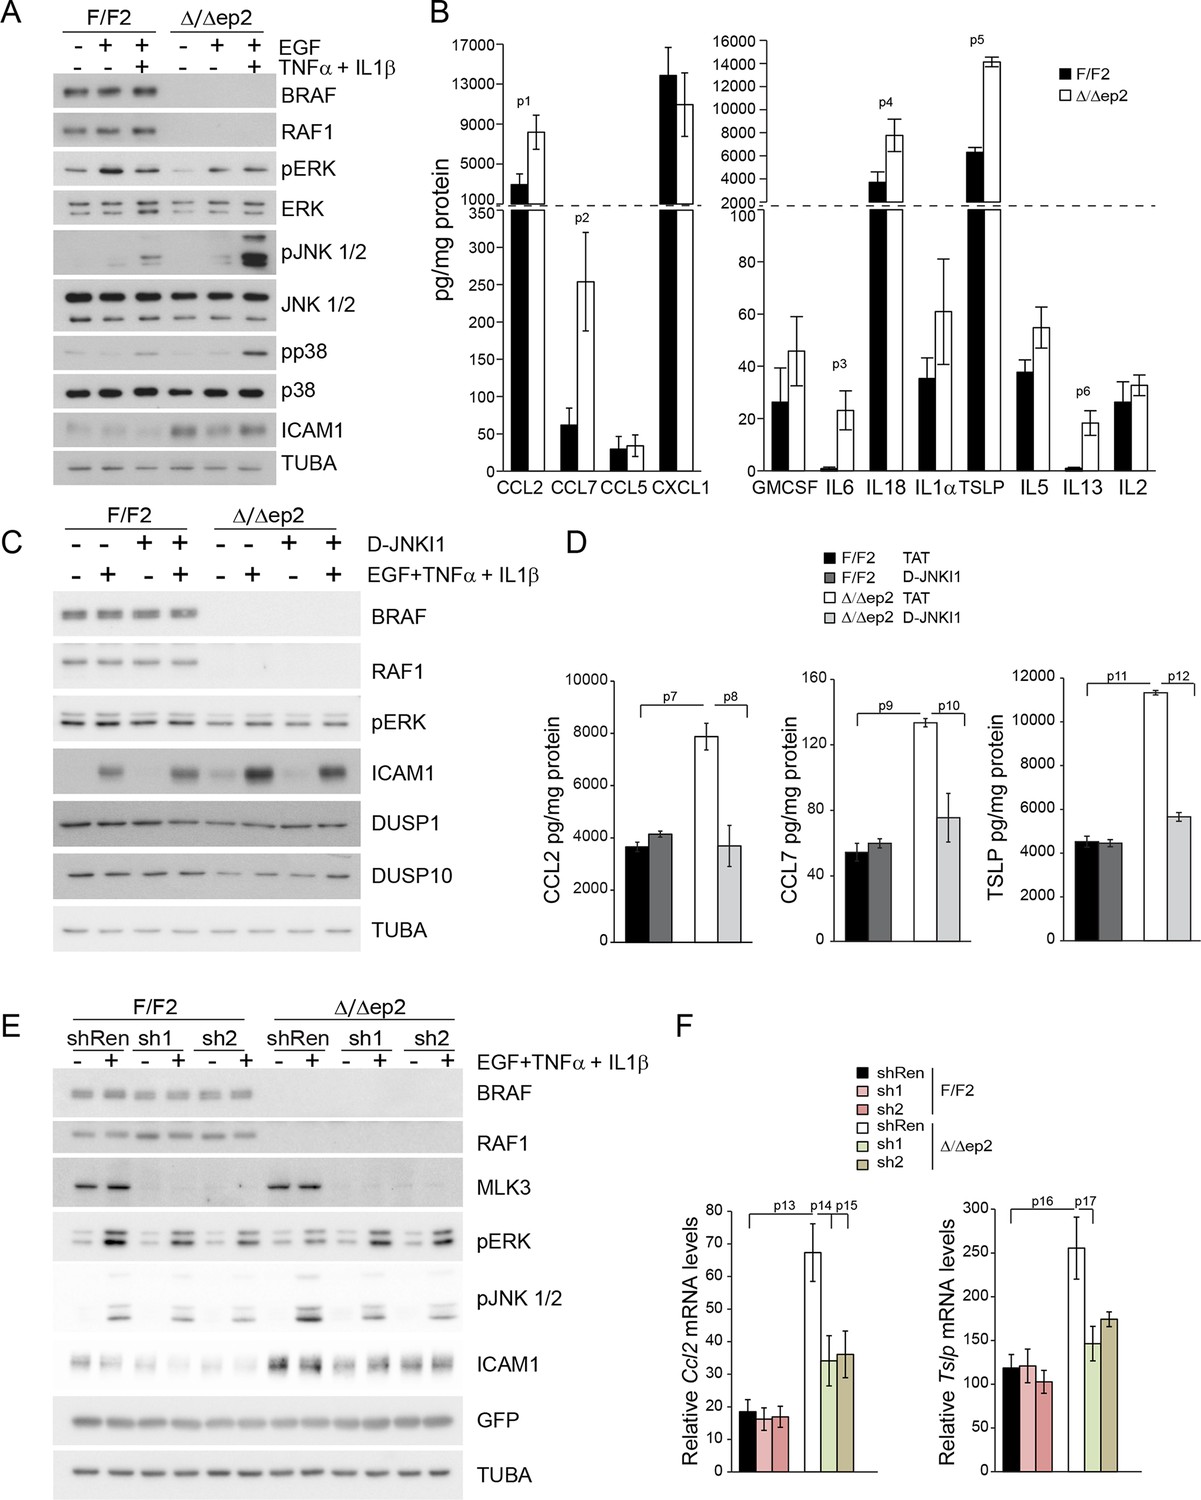
Increased stress kinase signaling and JNK pathway-dependent cytokine and chemokine production by primary keratinocytes lacking BRAF and RAF1.
(A) Reduced ERK phosphorylation and increased JNK/p38 activation in primary Δ/Δep2 keratinocytes stimulated with EGF and/or TNFα and IL1β for 15 min. (B) Increased cytokine and chemokine production in primary Δ/Δep2 keratinocytes treated with EGF, TNFα and IL1β for 24 hr. Cytokine and chemokine production was determined by multiplex analysis, except for TSLP which was quantified by ELISA. Data represent mean ± SEM of 3–5 biological replicates. (C–D) Cells were pretreated with D-JNKI1 inhibitors prior to stimulation with EGF, TNFα and IL1β for 15 min (C) or 24 hr (D). Data represent the mean ± SEM of technical replicates (n = 3). (E–F) Effect of shRNA-mediated Mlk3 silencing on ERK and JNK phosphorylation and ICAM1 expression (E; stimulation with EGF, TNFα and IL1β for 15 min) and on the expression of Ccl2 and Tslp mRNA (F; stimulation with EGF, TNFα and IL1β for 24 hr) by F/F2 and Δ/Δep2 keratinocytes. shRen, shRNA targeting Renilla, used as a control; sh1 and sh2, targeting Mlk3, binding sites nucleotide 2266–2285 and 2383–2402, respectively. The shRNAs were encoded by lentiviral vectors coexpressing GFP. GFP immunoblots are shown to confirm similar levels of infection in all samples. Data represent mean ± SEM of 4 biological replicates. Each keratinocyte culture represents a pool of three mice. Immunoblots are representative of three independent experiments. p1 = 0.041, p2 = 0.040, p3 = 1.89E-4, p4 = 0.018, p5 = 0.046, p6 = 0.020, p7 = 0.008, p8 = 0.016, p9 = 0.001, p10 = 0.018, p11 = 3.23E-4, p12 = 1.47E-4, p13 = 0.007, p14 = 0.03, p15 = 0.035, p16 = 0.023 and p17 = 0.046.
Figure 9—figure supplement 1
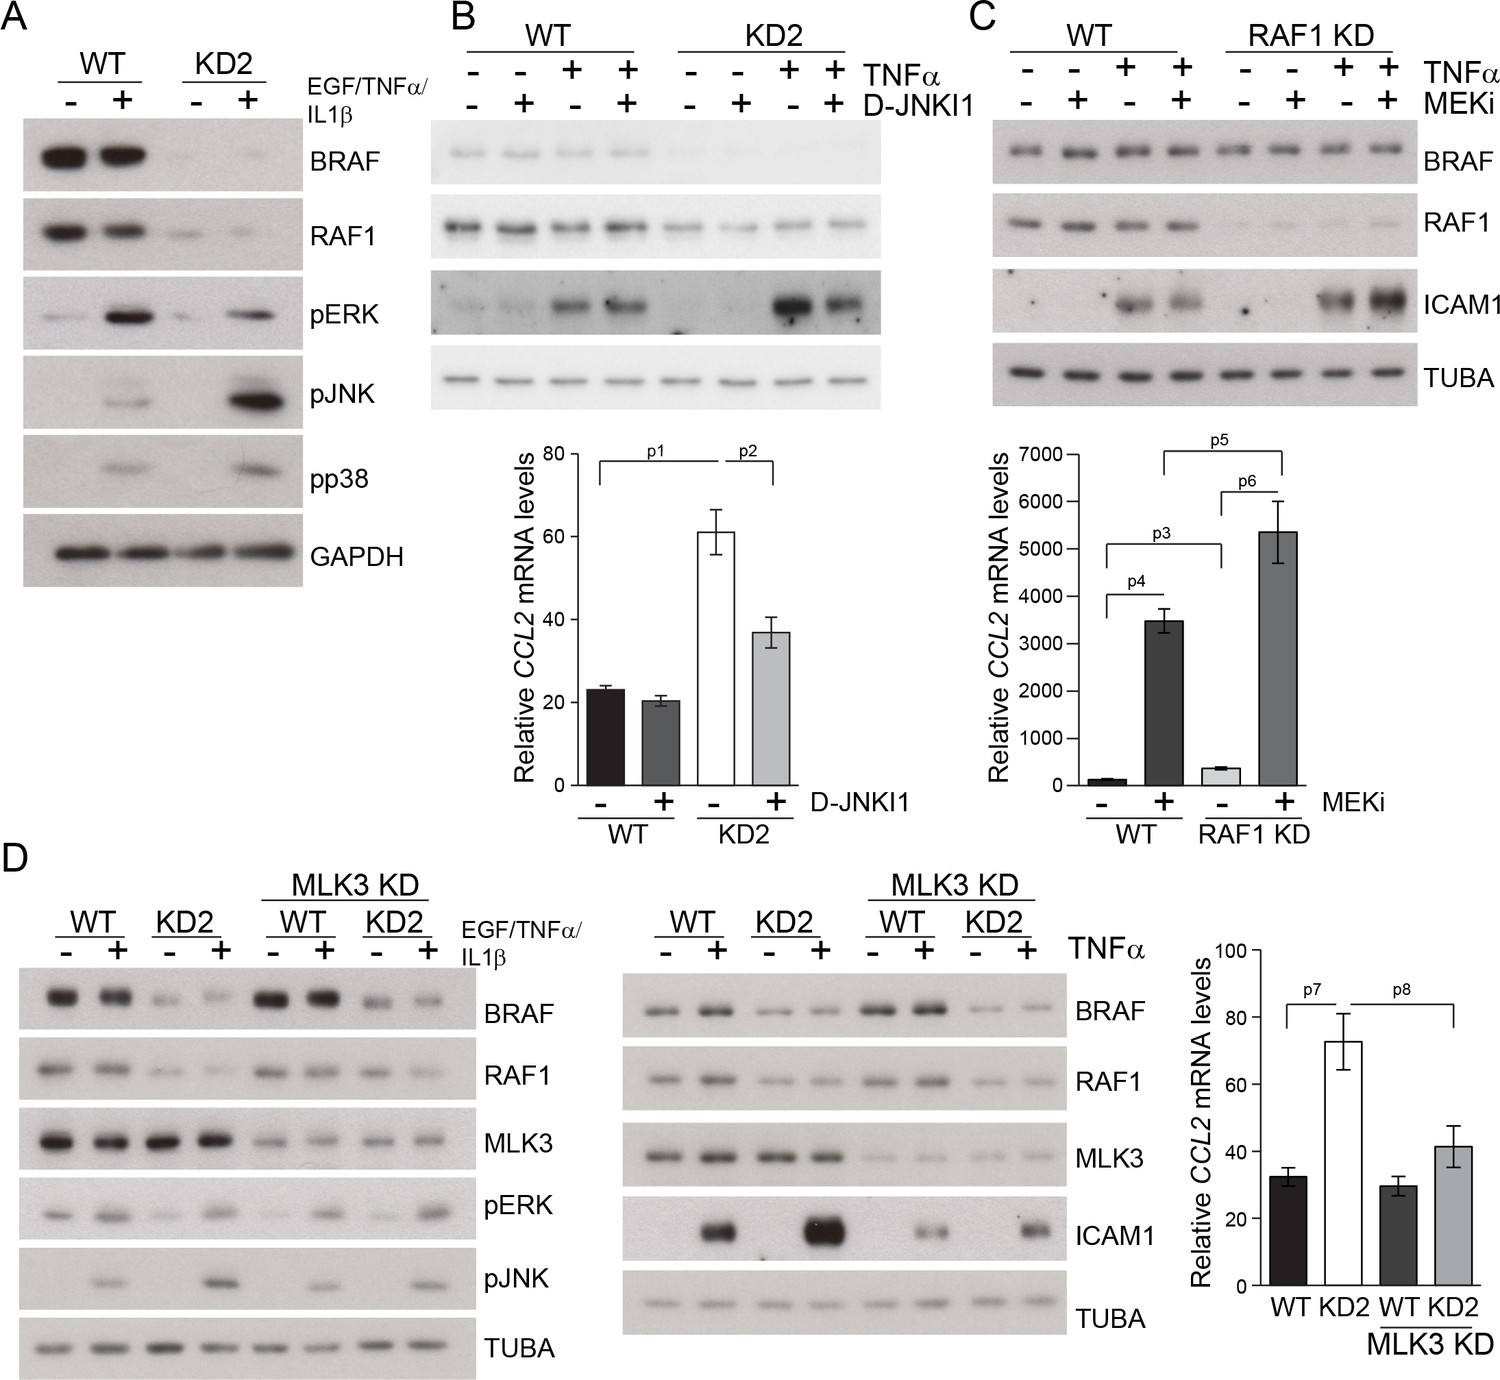
Compound knockdown (KD2) of BRAF and RAF1 induce the expression of inflammation markers by HaCat cells in a MLK3/JNK-dependent manner.
(A) Reduced ERK and increased JNK/p38 activation in BRAF and RAF1 knockdown (KD2) HaCat cells stimulated with EGF, TNFα and IL1β for 15 min. (B) D-JNKI1 reduces ICAM1 and CCL2 (n = 4) expression in KD2 cells treated with TNFα. (C) MEKi induces ICAM1 and CCL2 (n = 3) expression in RAF1KD cells treated with TNFα. In (B–C), ICAM1 expression was measured after a 3 hr, CCL2 expression after a 24 hr treatment with TNFα. (D) Effect of MLK3 silencing on ERK and JNK phosphorylation in WT and KD2 cells stimulated as in (A). MLK3 was silenced using a pool of oligonucleotides targeting the following regions: 686–704; 1489–1507; 2122–2138; and 2348–2366. MLK3 KD cells stimulated as in (B–C) show a decrease in JNK activation, ICAM1 and CCL2 (n = 7) expression. Immunoblots are representative of three independent experiments. qPCR data represent mean ± SEM of three independent experiments run in duplicates (p1 = 4.62E-4, p2 = 0.013, p3 = 0.050, p4 = 8.60E-8, p5 = 0.050, p6 = 0.001, p7 = 0.001 and p8 = 0.012).
Figure 10
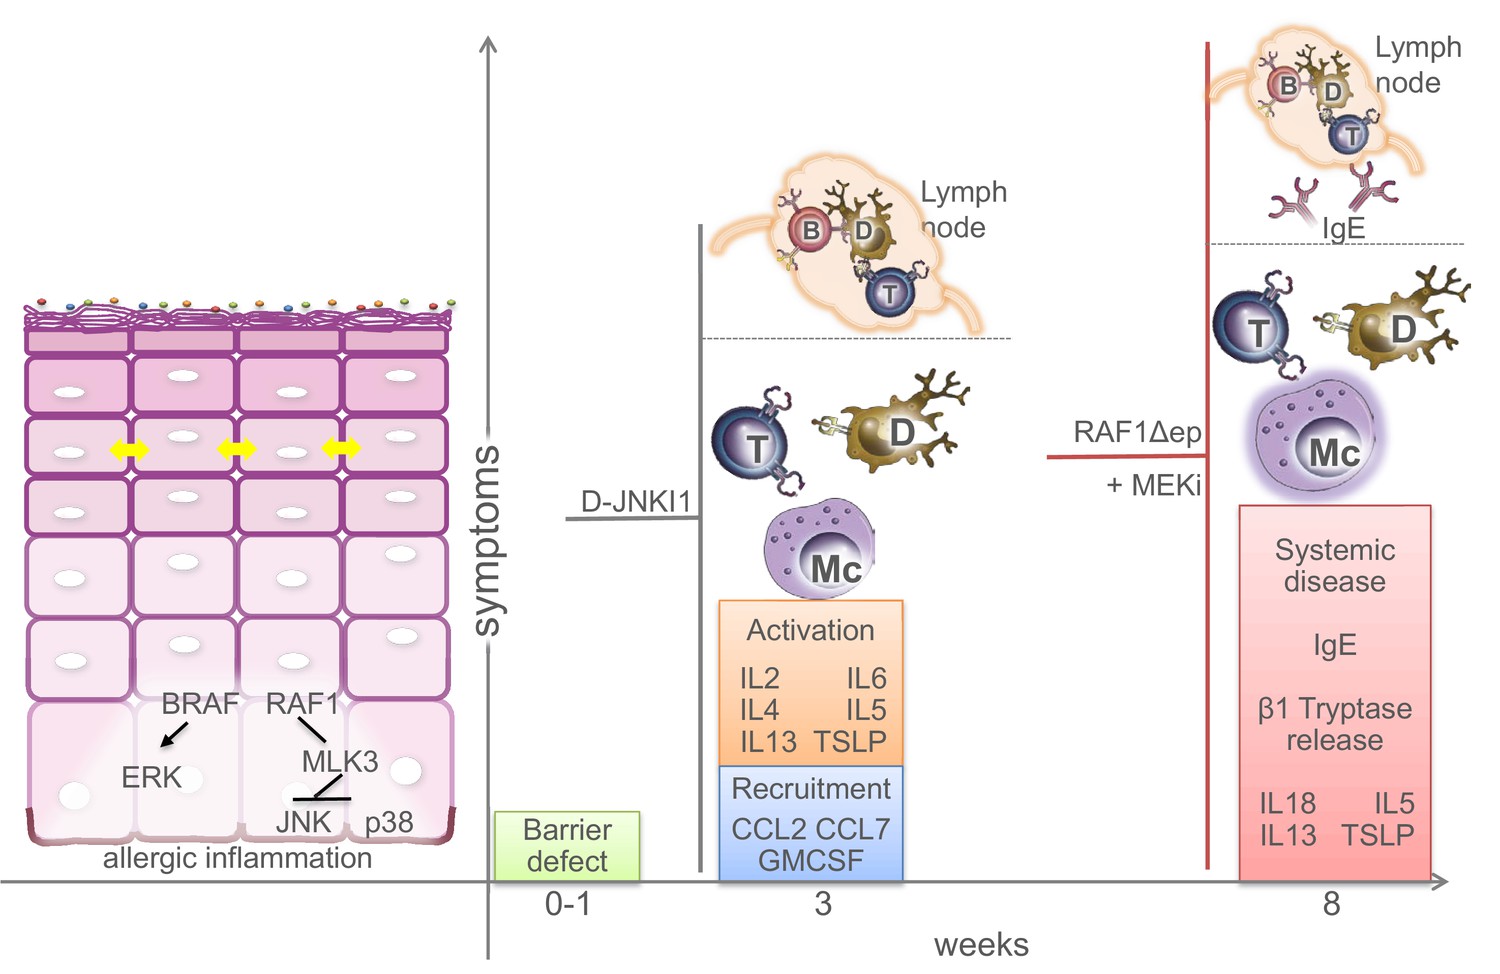
Molecular and physiological defects in mice lacking BRAF and RAF1 in the epidermis.
Compound BRAF/RAF1 ablation in keratinocytes induces an imbalance in MAPK signaling, resulting in low ERK, high JNK activation. This causes early inside-outside barrier defects accompanied by reduced CDN1 expression (yellow arrows), followed by a breakdown of the immunological barrier and local as well as systemic allergic inflammation akin to atopic dermatitis, characterized by the presence of Th2 cytokines in the epidermis. The phenotype can be prevented by inhibiting the JNK pathway in Δ/Δep2 animals and cells, and phenocopied by inhibiting the ERK pathway in Raf1Δ/Δep animals. Systemic effects (lymph node involvement, circulating IgEs) are separated from local effect by a dashed line. B (B cells), T (T cells), Mc (Mast cells), D (dendritic cells).
Download links
A two-part list of links to download the article, or parts of the article, in various formats.
Downloads (link to download the article as PDF)
Open citations (links to open the citations from this article in various online reference manager services)
Cite this article (links to download the citations from this article in formats compatible with various reference manager tools)
Epidermal RAF prevents allergic skin disease
eLife 5:e14012.
https://doi.org/10.7554/eLife.14012


