A novel biosensor to study cAMP dynamics in cilia and flagella
- Center of Advanced European Studies and Research, Germany
- Universitätsklinikum Münster, Germany
Figures
Figure 1
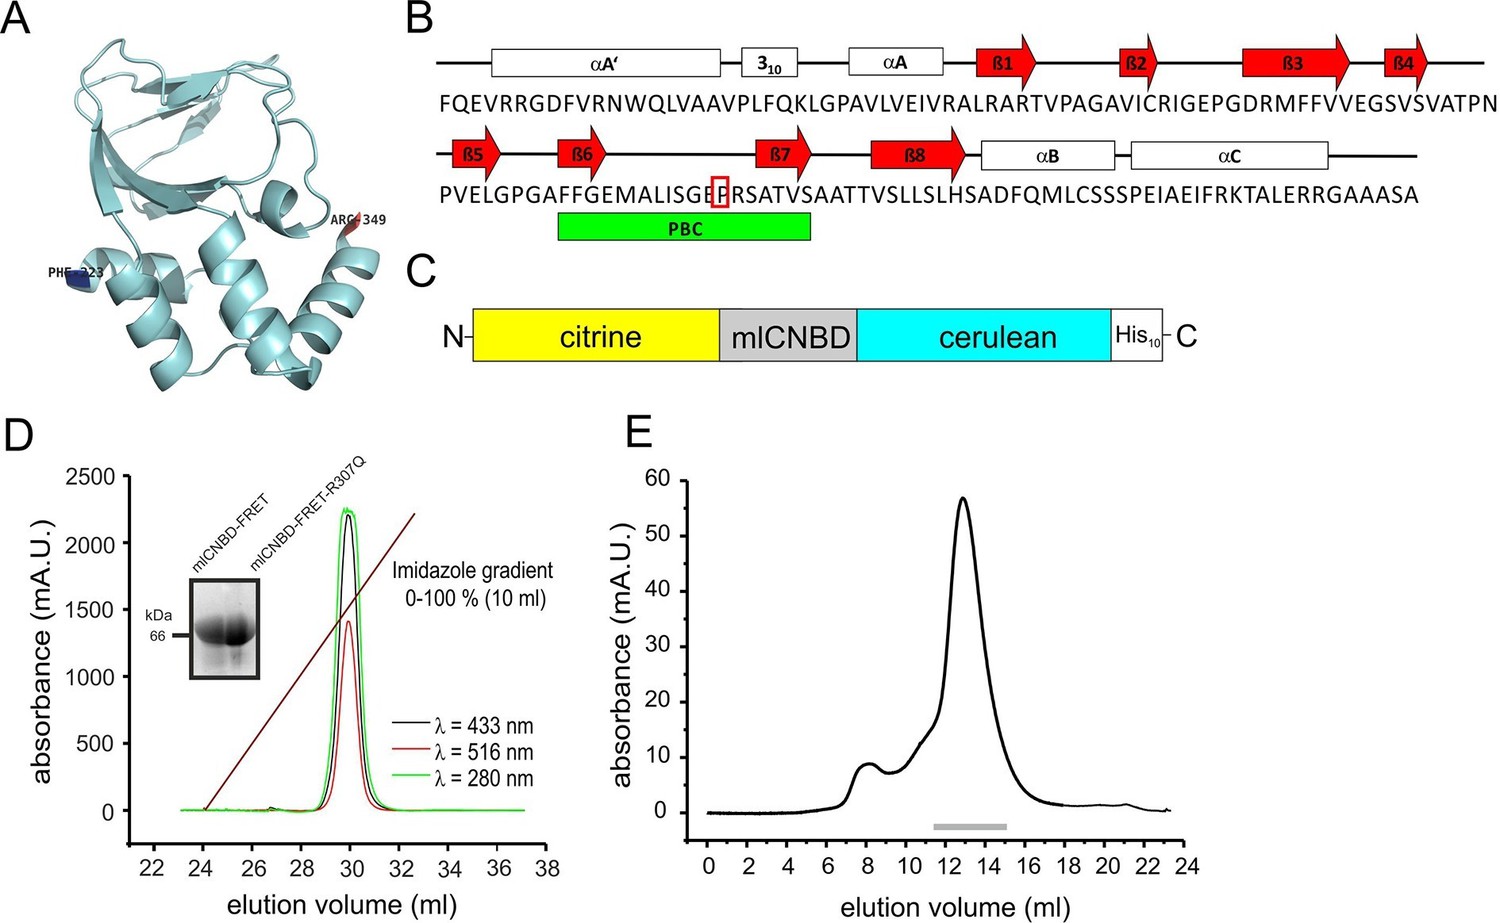
Generation and purification of mlCNBD-FRET.
(A) Ribbon presentation of a single mlCNBD according to (Schünke et al., 2011). The first (Phe223) and the last amino acid (Arg349) are indicated. (B) Structural features of mlCNBD. Alpha helices (αA-C), beta rolls (β1–8), and the phosphate binding-cassette (PBC) are indicated. The arginine (R) crucial for cAMP-binding is boxed. (C) The mlCNBD-FRET biosensor. The sensor has been generated by fusing citrine and cerulean to the N- and C-terminus of mlCNBD, respectively. For purification, a His10 tag has been added to the C-terminus. (D) Purification of mlCNBD-FRET via cobalt immobilized-metal affinity chromatography. Representative elution profile for mlCNBD-FRET using a linear imidazole gradient. The absorption has been recorded at three different wavelengths (280 nm: protein, green; 433 nm: cerulean, black; 516 nm: citrine, red). The inset shows a representative Western blot for the purified mlCNBD-FRET and mlCNBD-FRET-R307Q protein, stained with an anti-His antibody. (E) Size-exclusion chromatography of the purified mlCNBD-FRET protein. Representative elution profile. The protein eluted in a main peak at 67 kDa (peak maximum), close to the expected molecular mass of 70.9 kDa. A minor peak was observed that eluted earlier and represents the void volume. Fractions indicated by the grey line have been used for analysis.
Figure 2
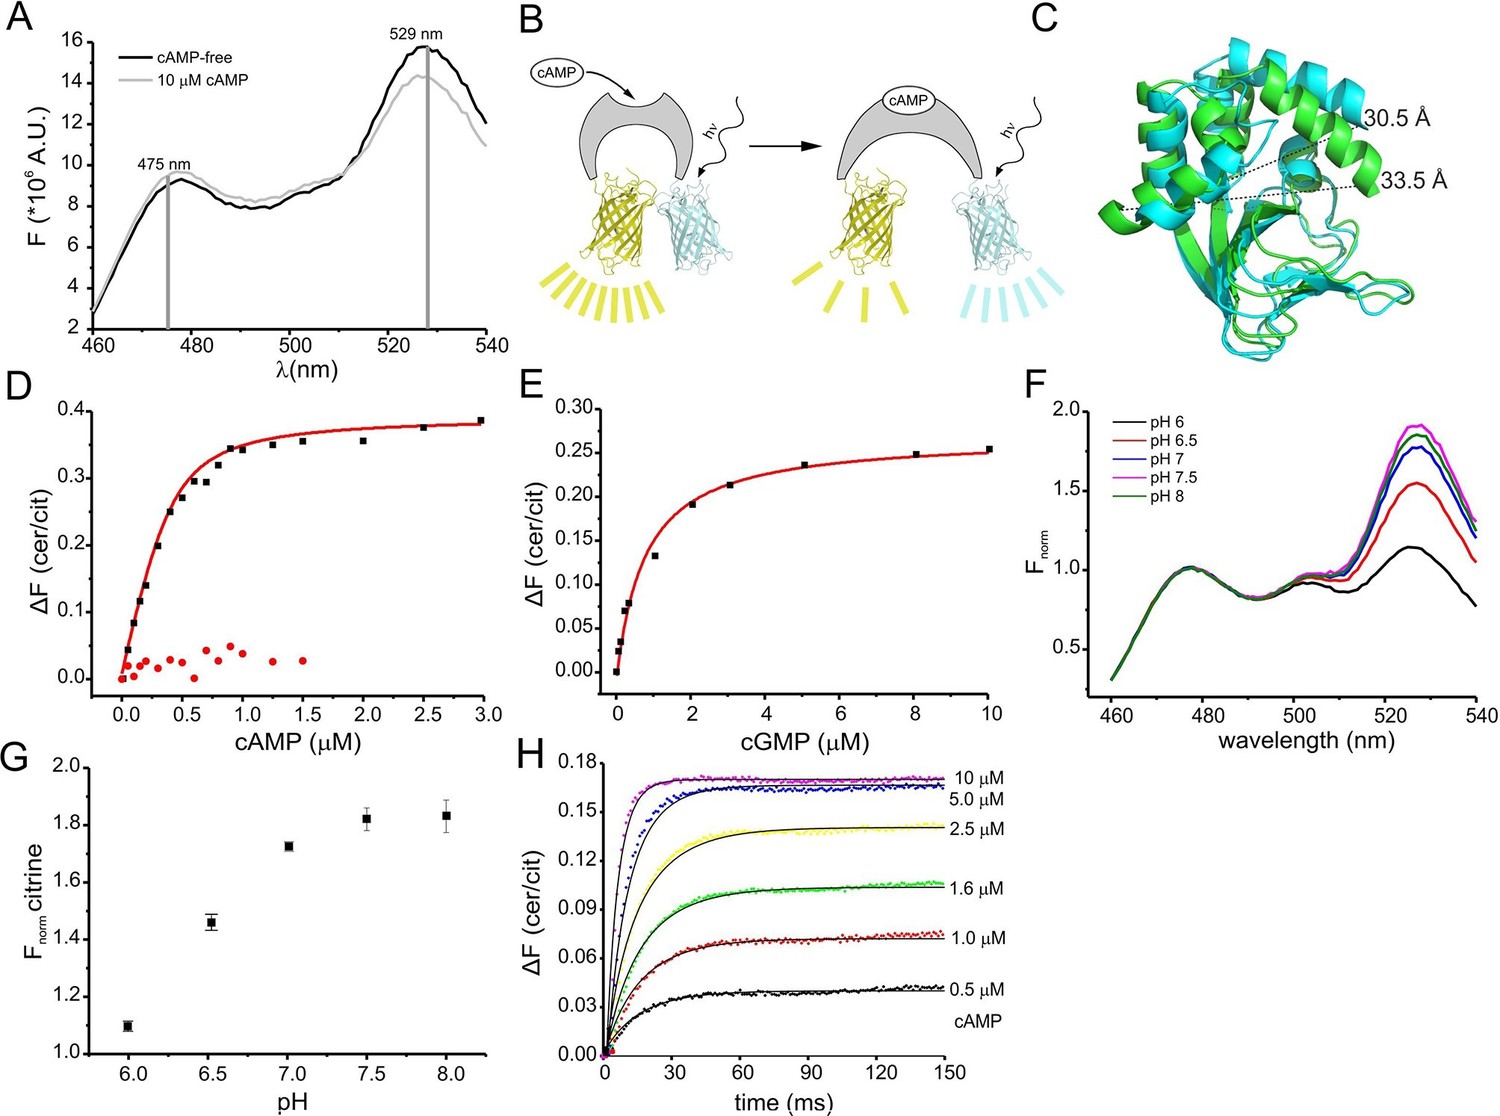
Characterization of the purified mlCNBD-FRET.
(A) Fluorescence spectra of mlCNBD-FRET at 430 nm excitation before (black) and after addition of 10 μM cAMP (grey). (B) Schematic representation of the structural changes evoked by cAMP upon binding, FRET becomes smaller, indicating that cerulean and citrine move further apart. (C) Structural changes occurring after cAMP binding. The cAMP-free structure is shown in blue, the cAMP-bound structure is shown in green. Distances are presented in Ångstrom. (D) Binding of cAMP to mlCNBD-FRET (black) determined by fluorescence spectroscopy. Representative experiments showing an increase in the baseline-corrected cerulean/citrine emission ratio (△F) of mlCNBD-FRET (430 nm excitation) after cAMP binding. Data have been fitted using a single binding-site model (red line) (Cukkemane et al., 2007). As a control, mlCNBD-FRET-R307Q (red dots) has been used. Measurements have been performed using 1 μM protein. (E) Representative experiments showing an increase of △F of mlCNBD-FRET (430 nm excitation) after cGMP binding. Data has been fitted (see (D), red line). Measurements have been performed using 1 μM protein. (F) Normalized fluorescence spectra of mlCNBD-FRET (430 nm excitation) at different pH conditions. Spectra were normalized to the cerulean emission at 471 nm. (G) Normalized FRET (430 nm excitation, 529 nm emission) at different pH values. Data have been taken from measurements shown in (F) and are presented as mean ± S.D.; n = 3. (H) Kinetics of cAMP binding to mlCNBD-FRET measured using the stopped-flow technique. Different cAMP concentrations (in µM: 0.5, 1, 1.6, 2.5, 5, and 10) were mixed with the purified mlCNBD-FRET protein (2.5 μM) and the change in FRET was measured over time. Solid lines represent a global fit of a one-step model (see materials and methods) with the following parameters: kon = 2.6 *107 M-1s-1 and koff = 12.8 s-1.
Figure 3 with 1 supplement
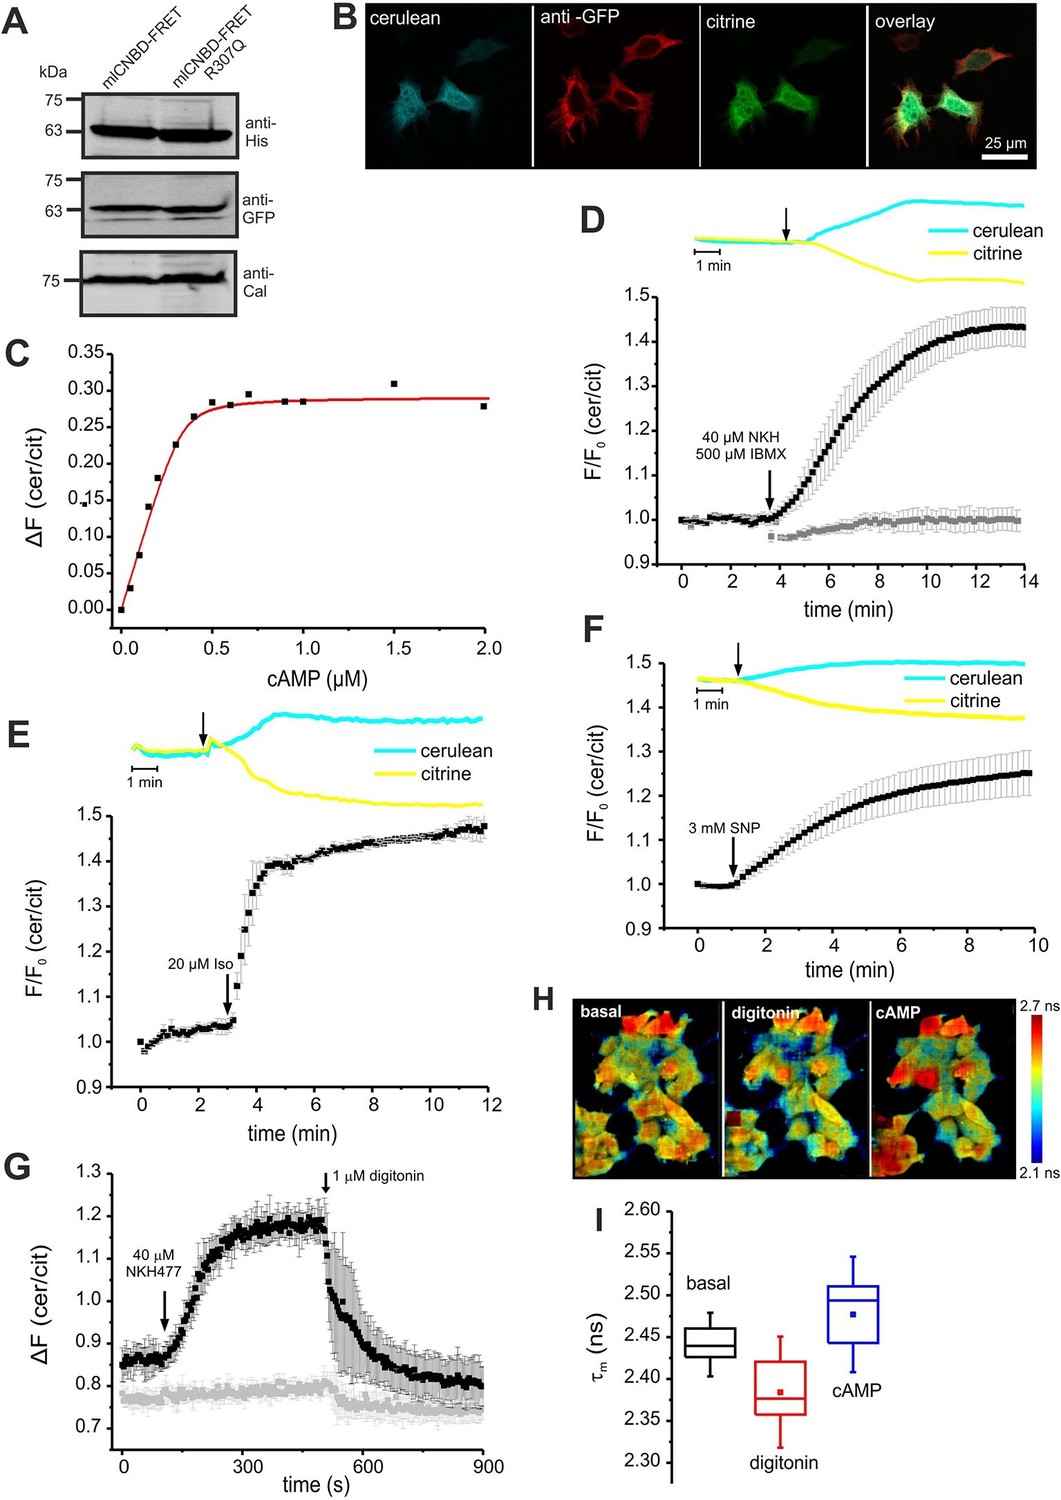
Characterization of mlCNBD-FRET in HEK293 cells.
(A). Representative Western blot using total protein lysates from mlCNBD-FRET and mlCNBD-FRET-R307Q-expressing cells, stained with an anti-His and an anti-GFP antibody. Calnexin (Cal) has been used as a loading control. (B) Immunocytochemistry. HEK293 cells expressing mlCNBD-FRET (cerulean: blue, citrine: green) have been labeled with an anti-GFP antibody and a fluorescent secondary antibody (red). Scale bar 25 µm. (C) Ligand binding of cAMP to mlCNBD-FRET in HEK293 cells determined by fluorescence spectroscopy. Representative experiment showing an increase of the baseline-corrected cerulean/citrine emission ratio ΔF of mlCNBD-FRET (430 nm excitation) at different cAMP concentrations. Cells have been permeabilized with 20 μM digitonin before addition of cAMP. Data have been fitted using a single binding-site model (red line) (Cukkemane et al., 2007). (D) Changes in FRET in HEK293 cells expressing mlCNBD-FRET after stimulation with 40 μM NKH477/500 μM IBMX. FRET has been measured by fluorescence microscopy. Representative traces of raw data are shown above. HEK293 cells expressing mlCNBD-FRET-R307Q (grey) have been used as a control. Data are presented as mean ± S.D. (mlCNBD-FRET: n = 31; mlCNBD-FRETR307Q: n = 3). (E) Changes in FRET in HEK293 cells expressing mlCNBD-FRET after stimulation with 2 μM isoproterenol. Representative traces for the raw data are shown above. Data are presented as mean ± S.D.; n = 9. (F) Changes in FRET in HEK293 cells expressing mlCNBD-FRET after stimulation with 3 mM SNP. Representative traces for the raw data are shown above. Data are presented as mean ± S.D.; n = 36. (G) Changes in FRET in HEK293 cells expressing mlCNBD-FRET (black) or mlCNBD-FRET-R307Q (grey) after stimulation with 40 μM NKH477. After reaching a steady-state, cells have been permeabilized using 1 μM digitonin. FRET has been measured using spectrofluorometer. Data are presented as mean ± S.D.; n = 3. (H) Changes in cerulean fluorescence lifetime using FLIM. HEK293 cells expressing mlCNBD-FRET were imaged under basal conditions, after addition of 20 μM digitonin, and the following addition of 5 μM cAMP. The cerulean fluorescence decay was recorded and fitted with a bi-exponential decay to calculate the lifetime. Data are presented as mean ± S.D. Representative images are shown using a look-up table ranging from 2.1 ns (blue) to 2.7 ns (red). (I) Mean values of the two lifetimes averaged over different regions of interest in part (H); n = 8 for each condition.
Figure 3—figure supplement 1

Characterisation of mlCNBD-FRET in HEK293 cells.
(A) Calibration of mlCNBD-FRET in HEK293 cells. FRET was measured in a cuvette in a spectrofluorometer under basal conditions (ES), after permeabilization with 20 μM digitonin, and the following addition of increasing cAMP concentrations (in nM). According to the null-point calibration method, the difference in FRET ratio of the treated samples to the basal condition was determined and used to determine the basal cAMP concentration. (B) Changes in FRET in HEK293 cells expressing mlCNBD-FRET after stimulation with 40 μM NKH477/500 μM IBMX (black). FRET has been measured using spectrofluorometer. Data are presented as mean ± S.D. DMSO (0.13%, red) has been used as a control; n = 3 for each condition. (C) Similar to part (B) after stimulation with 2 μM isoproterenol (black). (D) Similar to part (B) for stimulation with 3 mM SNP (black). (E) Change in the cerulean fluorescence lifetime measured using Fluorescence Lifetime Spectroscopy (FLS). Cells have been permeabilized with 20 μM digitonin followed by addition of cAMP. The cerulean fluorescence decay was recorded and fitted with a bi-exponential decay to calculate the lifetime. The mean of the two lifetimes was calculated and averaged over n = 3 experiments. (F) Changes in FRET in HEK293 cells expressing mlCNBD-FRET after stimulation with different concentrations of NKH477. The FRET ratio has been calculated when reaching a maximum and normalized to the baseline ratio. Data is shown as mean ± S.D.; n = 4. (G) Changes in FRET in HEK293 cells expressing mlCNBD-FRET after alternatingly stimulating with 500 nM isoproterenol (black) followed by a wash-out with ES. As a control, cells were stimulated with buffer only (red). Data is shown as mean ± S.D.; n = 3.
Figure 4
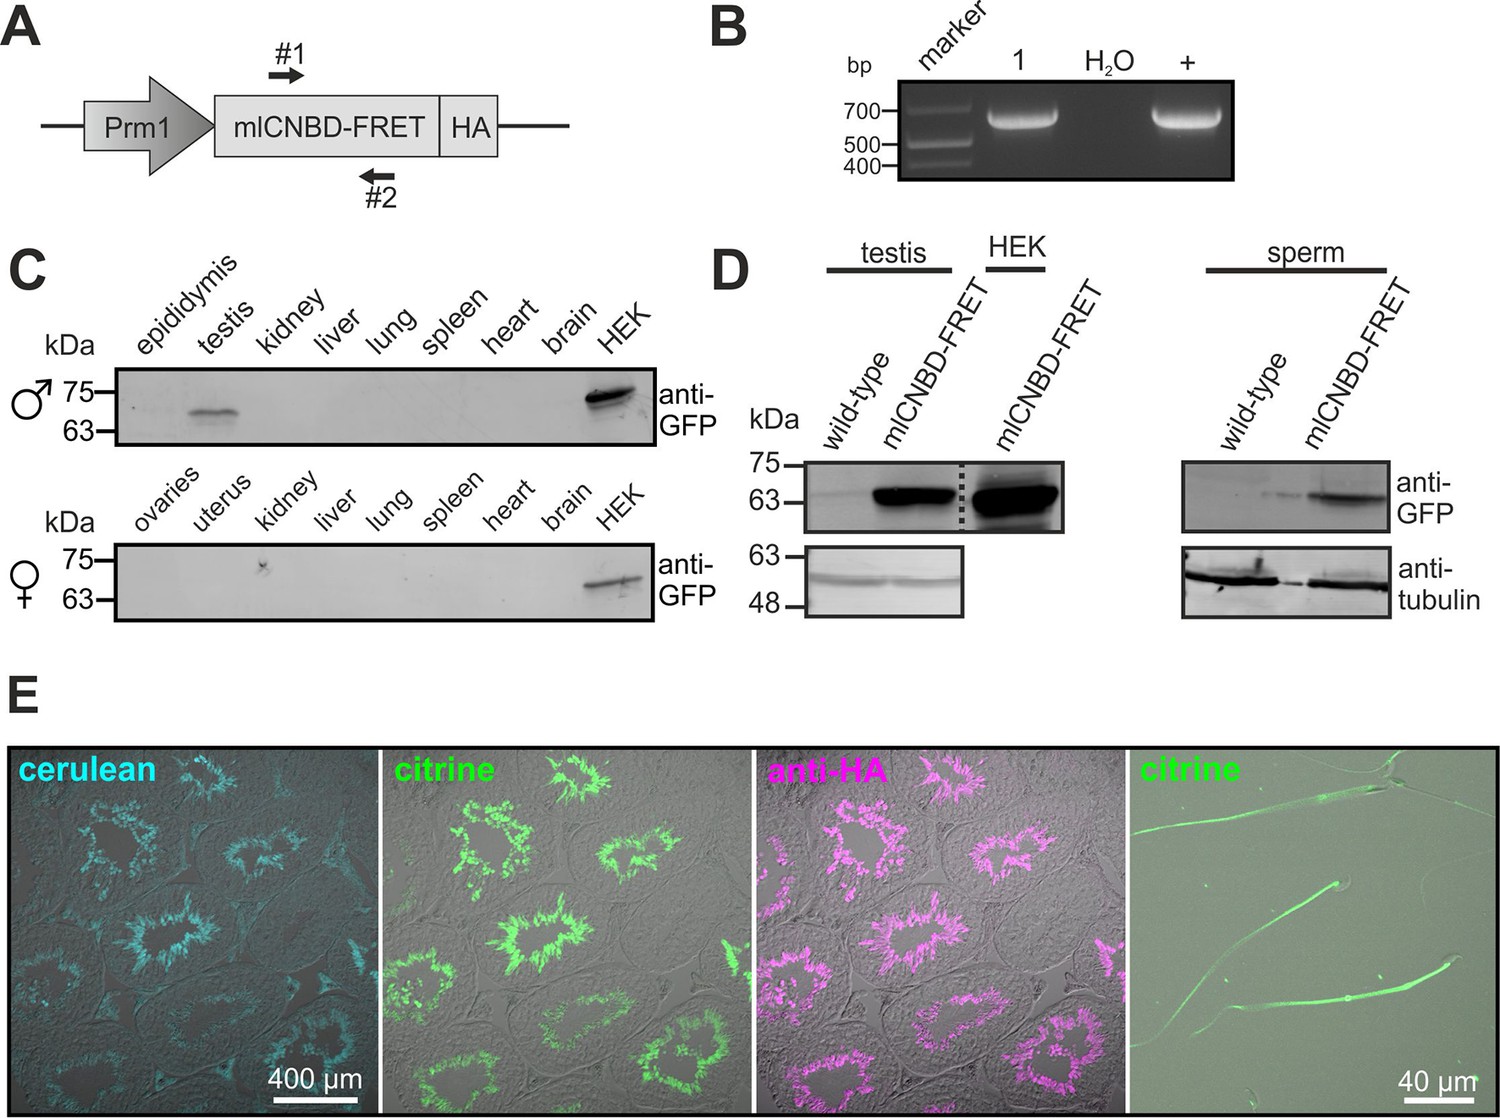
Generation of a Prm1-mlCNBD-FRET transgenic mouse line.
(A) Scheme of the Prm1-mlCNBD-FRET targeting vector. Expression of hemagglutinin(HA)-tagged mlCNBD-FRET is driven by the Protamine 1 promoter (Prm1); arrows indicate the position of genotyping primers (#1, 2). (B) Genotyping by PCR. In Prm1-mlCNBD-FRET mice, a 653 bp fragment is amplified (1). The targeting vector served as a positive control (+). (C) Western blot analysis of mlCNBD-FRET expression in lysates from different tissues from a transgenic male and a female. Lysates from HEK293 cells expressing mlCNBD-FRET served as positive control. Proteins have been labeled using an anti-GFP antibody. (D) Western blot analysis of mlCNBD-FRET expression in testis and sperm lysates from a wild-type and a transgenic male. Lysates from HEK cells expressing mlCNBD-FRET served as positive control. Proteins have been labeled using an anti-GFP antibody; tubulin has been used as a loading control. (E) Immunohistochemical analysis of mlCNBD-FRET expression in testis and sperm. Cryosections of mouse testis were probed with anti-HA antibody and fluorescent secondary antibody (purple); the fluorescence for cerulean (blue) or citrine (green) is also shown.
-
Figure 4—source data 1
Fertility parameters of mlCNBD-FRET transgenic males.
For matings, heterozygous males have been crossed with wild-type females. All data are represented as mean ± S.D., n numbers are indicated.
- https://doi.org/10.7554/eLife.14052.008
Figure 5 with 1 supplement
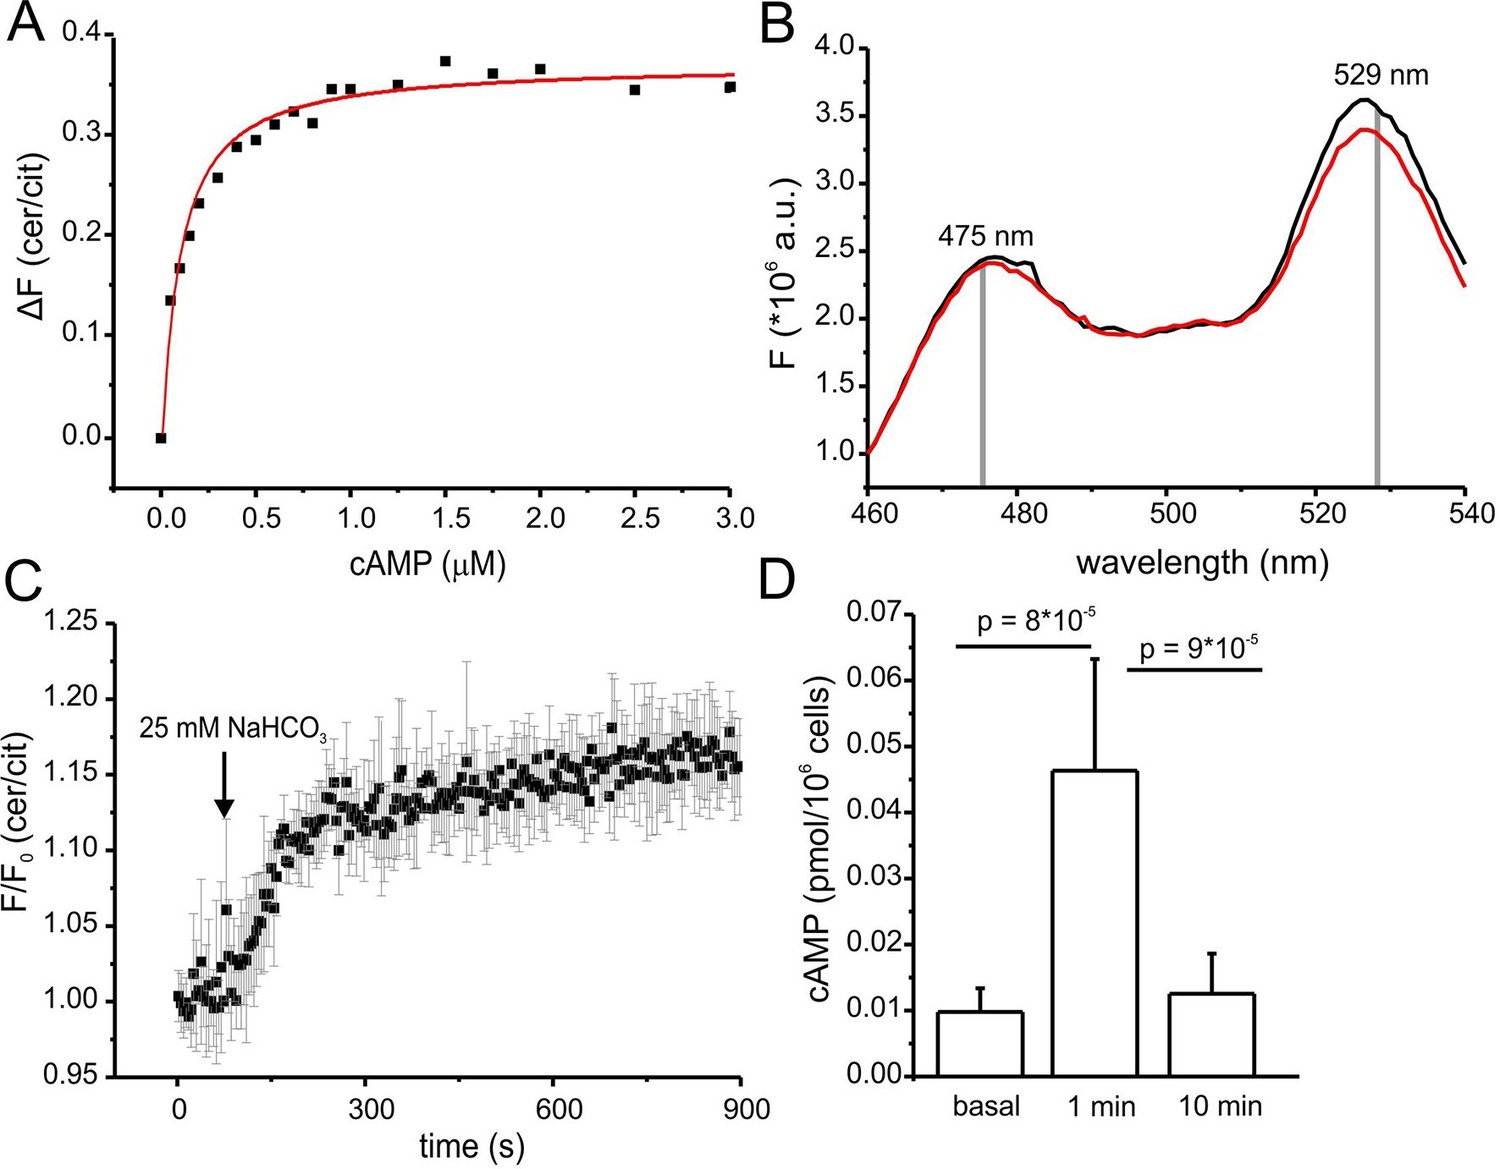
Characterization of cAMP dynamics in sperm.
(A) Ligand binding of cAMP to mlCNBD-FRET in mouse sperm determined by fluorescence spectroscopy. Representative experiment showing an increase in the baseline-corrected cerulean/citrine emission ratio (△F) of mlCNBD-FRET (430 nm excitation) after cAMP binding. Cells have been permeabilized with digitonin before addition of cAMP. Data have been fitted using a single binding-site model (red line) (Cukkemane et al., 2007); n = 7. (B) Fluorescence spectra of mlCNBD-FRET at 430 nm excitation before (black) and after stimulation for 5 min with 25 mM bicarbonate (red). (C) Changes in FRET after stimulation of a mlCNBD-FRET sperm with 25 mM bicarbonate. Sperm have been kept in 2 mM Ca2+ buffer. FRET has been measured using a spectrofluorometer. Data is shown as mean ± S.D.; n = 3. (D) Total cAMP content. Sperm have been stimulated with 25 mM bicarbonate for 1 or 10 min and the total cAMP content has been determined using an immunoassay. The p values according to Students t-test are indicated. Data are shown as mean ± S.D.; n = 4.
-
Figure 5—source data 1
Characteristics of mlCNBD-FRET.
Binding affinities and the cerulean lifetime are shown as mean ± S.D.; n numbers are indicated.
- https://doi.org/10.7554/eLife.14052.010
-
Figure 5—source data 2
Characteristics of other cAMP biosensors.
- https://doi.org/10.7554/eLife.14052.011
Figure 5—figure supplement 1
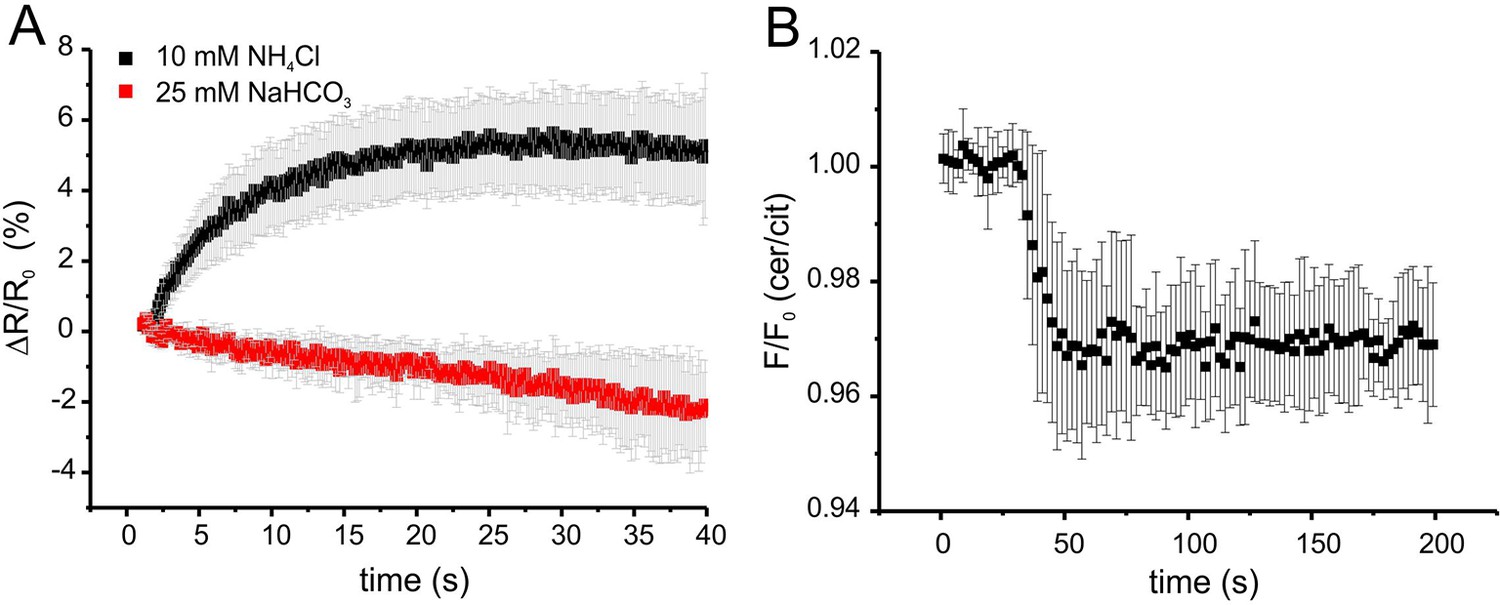
Characterisation of mlCNBD-FRET in mouse sperm.
(A) Changes in pHi in wild-type sperm. Wild-type sperm have been loaded with BCECF and changes in pHi, after stimulation with 10 mM NH4Cl or 25 mM bicarbonate, have been measured using the stopped-flow technique. Data are shown as mean ± 95% CI (confidence interval); n = 4. (B) Changes in FRET ratio of mlCNBD-FRET sperm after stimulation with 25 mM NH4Cl. Data is shown as mean ± S.D.; n = 8.
Figure 6
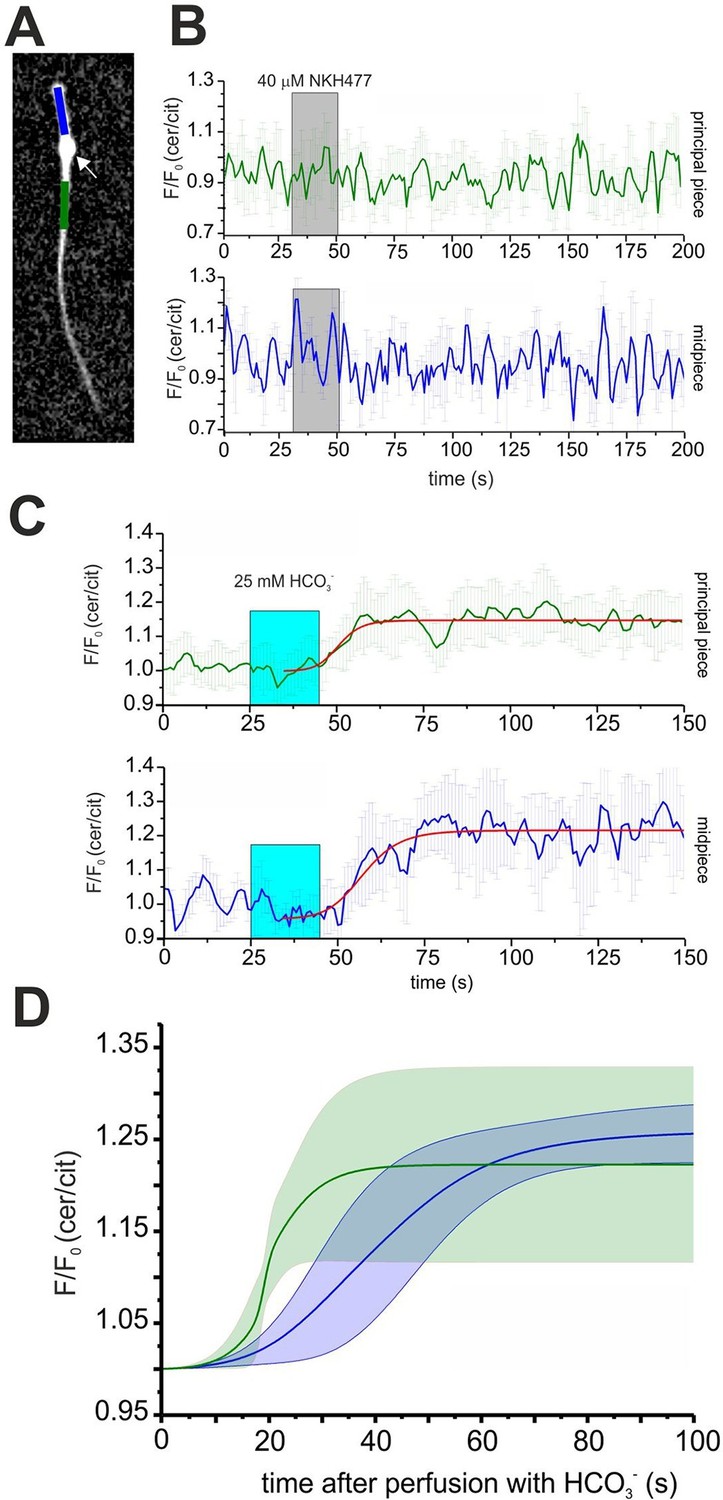
Spatio-temporal cAMP dynamics in the sperm flagellum.
(A) cAMP dynamics was analyzed in a region 20 µm in length in the midpiece (blue) and principal piece (green) of freely beating sperm. The cytoplasmic droplet is indicated with an arrow. (B) Changes in FRET after stimulation with 40 μM NKH477. The perfusion with NKH477 is indicated with a grey box. Data for a representative cell are shown as mean ± S.D. in the midpiece (blue) and principal piece (green). (C) Changes in FRET after stimulation with 25 mM bicarbonate. The perfusion with bicarbonate is indicated with a blue box. Individual traces have been fitted using logistic regression (Origin 9) (red line). (D) Average of the fitted data presented in (C). The blue and green line represent the mean value for the midpiece and principal piece, respectively (n = 7). The blue and green areas represent the corresponding S.D.
Figure 7
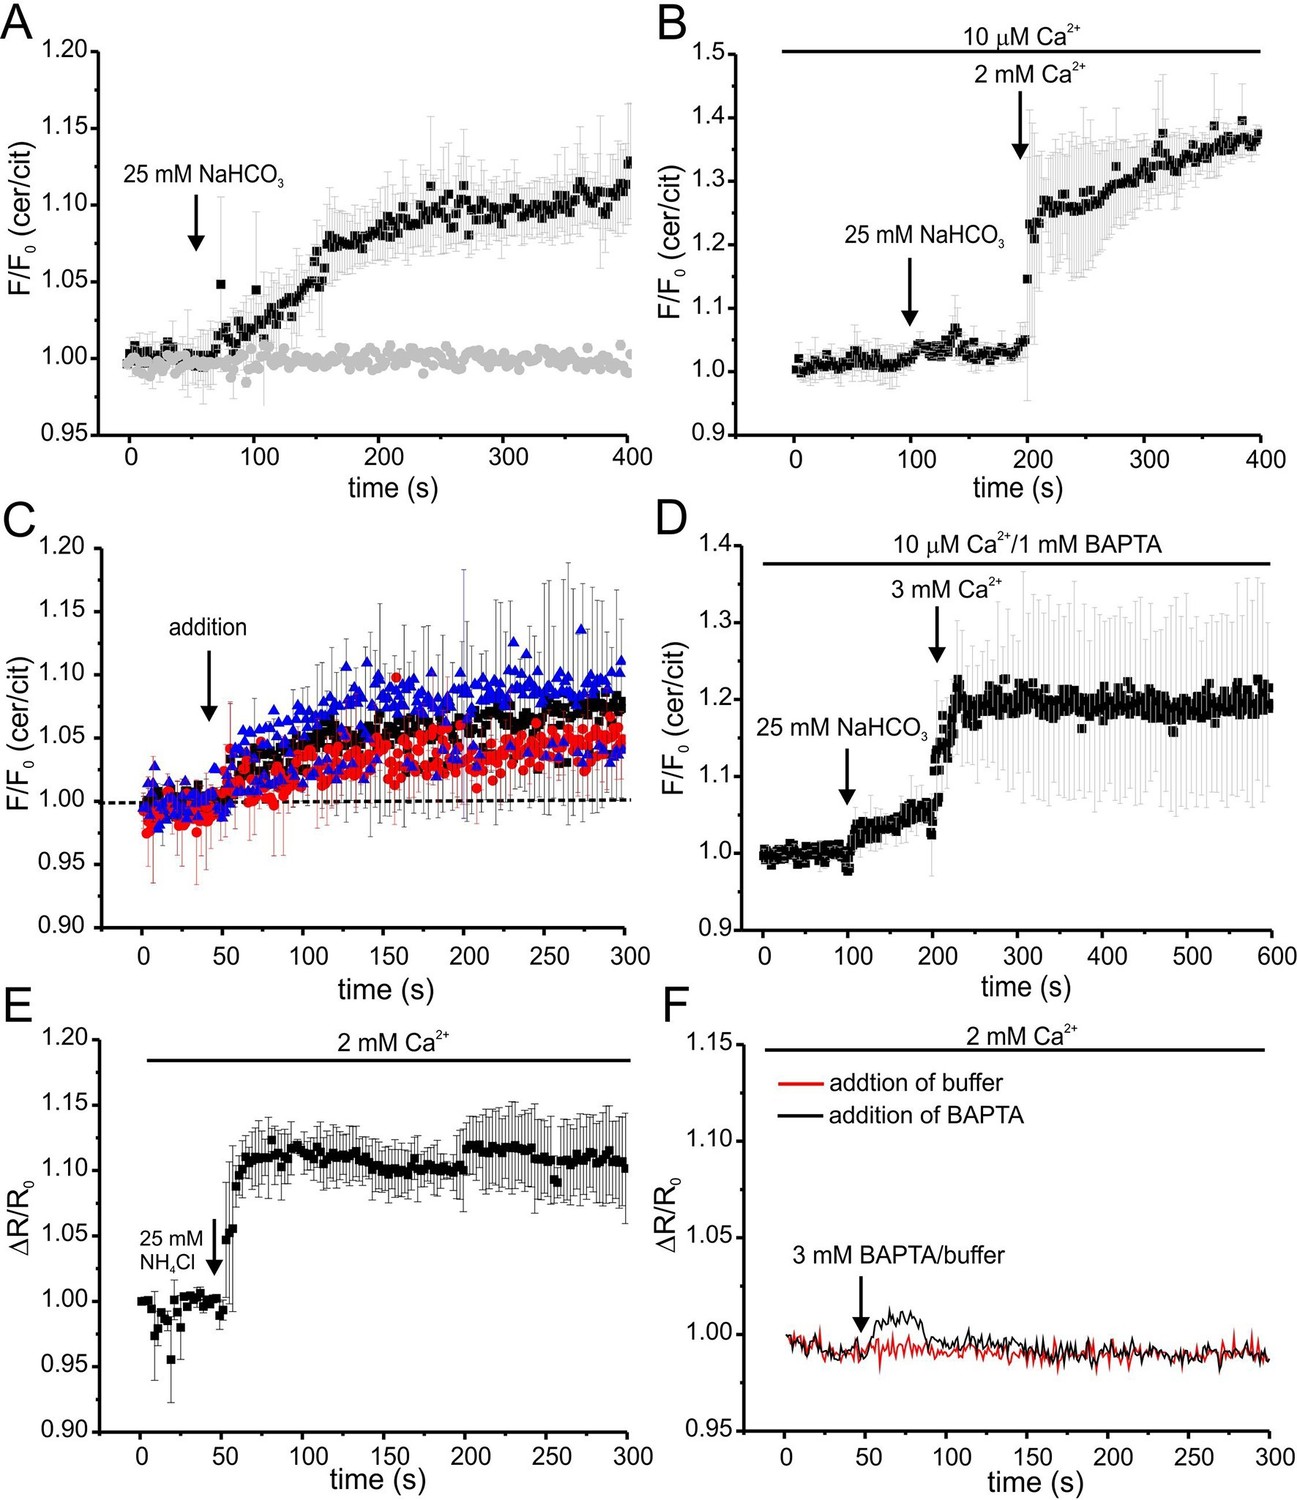
Ca2+ regulation of cAMP dynamics in sperm.
(A) Changes in FRET after stimulation of mlCNBD-FRET sperm with 25 mM bicarbonate. Sperm have been either kept in 2 mM (black) or 10 μM (grey) Ca2+ buffer. FRET has been measured using a spectrofluorometer; n = 3 for each condition. (B) Changes in FRET after stimulation of a mlCNBD-FRET sperm kept 10 μM Ca2+ buffer with 25 mM bicarbonate, followed by addition of 2 mM Ca2+ (final concentration); n = 3. (C) Changes in FRET of mlCNBD-FRET sperm kept in 2 mM Ca2+ buffer after the addition of 2 mM BAPTA (final: 20 μM Ca2+, black), kept in 10 μM Ca2+ buffer after the addition of 1 mM BAPTA (final: 2.2 nM Ca2+, red), or kept in 2 mM Ca2+ buffer after the addition of 3 mM BAPTA (final: 443 nM Ca2+, blue). Arrow indicates the addition of Ca2+or BAPTA, the dotted line indicates the baseline; n = 4 for each condition. (D) Changes in FRET of mlCNBD-FRET sperm kept in 10 μM Ca2+/1 mM BAPTA after addition of bicarbonate followed by 3 mM Ca2+ (final: 2 mM Ca2+). Data is shown as mean ± S.D; n = 4. (E) Changes in pHi of wild-type sperm kept in 2 mM Ca2+ buffer after addition of 25 mM NH4Cl. Data is shown as mean ± S.D.; n = 3. (F) Changes in pHi of wild-type sperm kept in 2 mM Ca2+ buffer after addition of 3 mM BAPTA (final: 443 nM Ca2+, black) or buffer (red) as a control. Data represents the mean of n = 3.
Figure 8
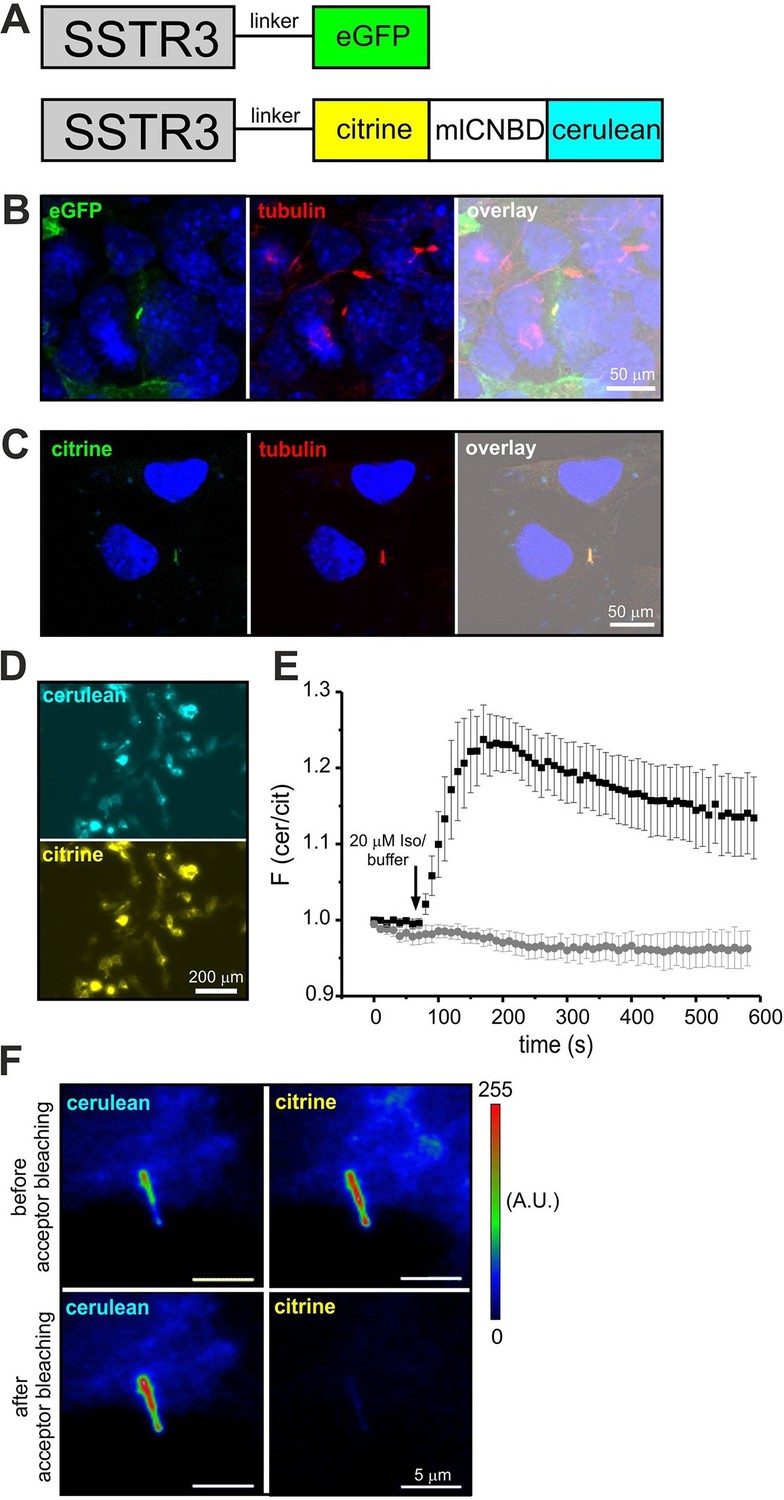
Targeting mlCNBD-FRET to primary cilia.
(A) Strategy to target a protein to cilia. The somatostatin receptor 3 (SSTR3) has been fused to green fluorescent protein (eGFP) or mlCNBD-FRET. (B) Expression of eGFP in primary cilia of IMCD3 cells. An anti-acetylated tubulin antibody has been used as a marker for primary cilia. DNA has been labeled using DAPI. Scale bar is indicated. (C) Expression of mlCNBD-FRET in primary cilia of IMCD3 cells. Citrine fluorescence indicates the expression of mlCNBD-FRET. An anti-acetylated tubulin antibody has been used as a marker for primary cilia. DNA has been labeled using DAPI. Scale bar is indicated. (D) Representative image for HEK293 cells expressing SSTR3-mlCNBD-FRET. (E) Changes in FRET in HEK293 cells expressing SSTR3-mlCNBD-FRET (see D) after stimulation with 20 μM isoproterenol (black) or buffer only (grey). FRET has been measured using fluorescence microscopy. Data are presented as mean ± S.D.; n = 9 for each condition. (F) Acceptor photobleaching. The citrine (acceptor) fluorescence of mlCNBD-FRET in IMCD3 cells was bleached for 2 min with a mercury lamp using a 510/20 nm filter. A representative image is shown. The cerulean emission was recorded before and after acceptor photobleaching. Relative fluorescence intensities are color-coded from low (blue) to high (red). Scale bars are indicated.
Download links
A two-part list of links to download the article, or parts of the article, in various formats.
Downloads (link to download the article as PDF)
Open citations (links to open the citations from this article in various online reference manager services)
Cite this article (links to download the citations from this article in formats compatible with various reference manager tools)
A novel biosensor to study cAMP dynamics in cilia and flagella
eLife 5:e14052.
https://doi.org/10.7554/eLife.14052


