A physical model describing the interaction of nuclear transport receptors with FG nucleoporin domain assemblies
- CIC biomaGUNE, Spain
- University College London, United Kingdom
- Bar-Ilan University, Israel
- Max Planck Institute for Biophysical Chemistry, Germany
- Medical Research Council Laboratory of Molecular Biology, United Kingdom
- University of Osnabrück, Germany
- University Grenoble Alpes - CNRS, France
- Max-Planck-Institute for Intelligent Systems, Germany
Figures
Figure 1 with 5 supplements
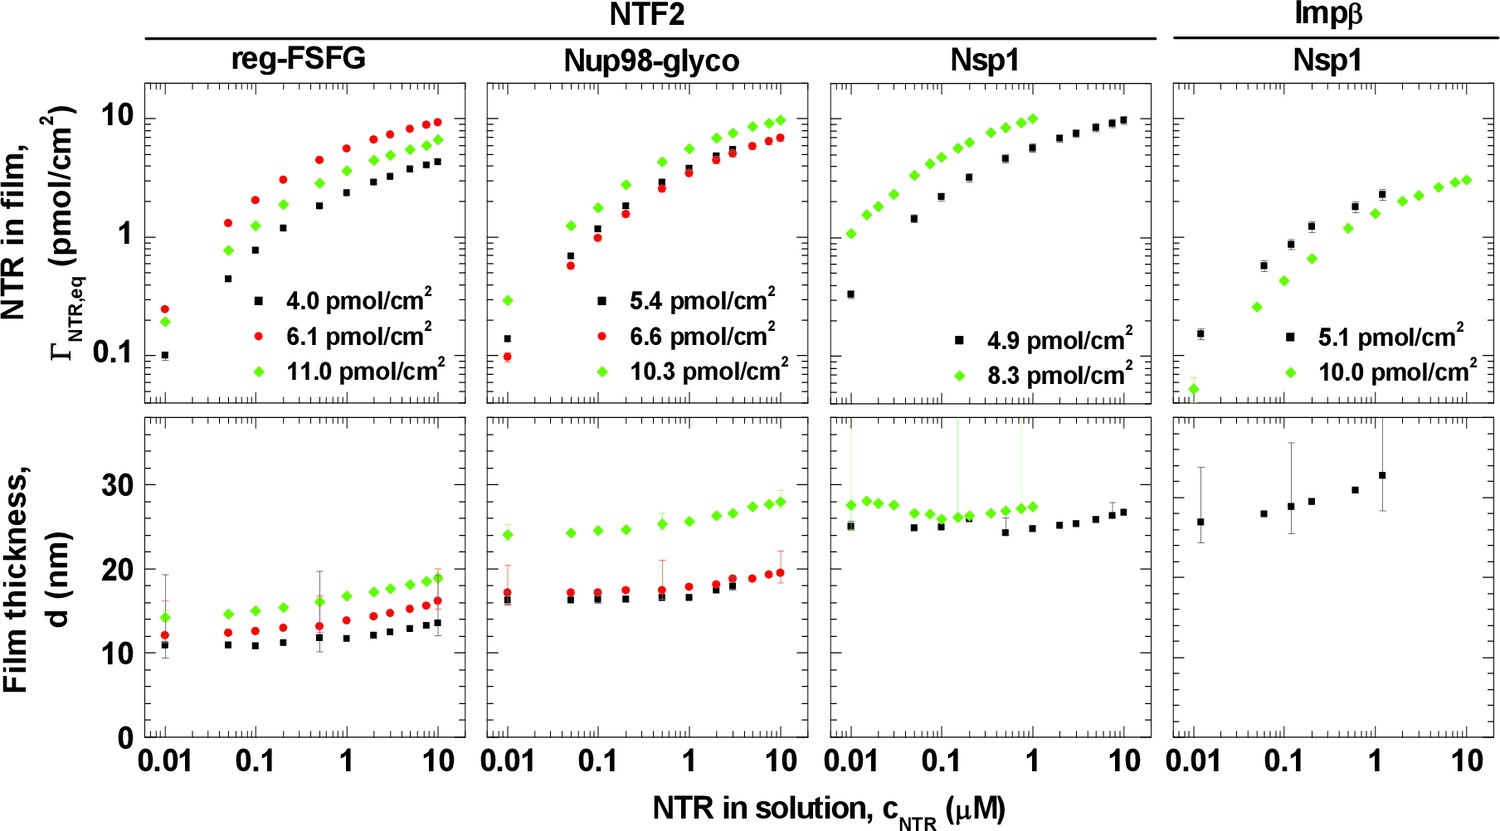
Isotherms of NTR binding (top row, log-log presentation) and FG domain film thickness evolution (bottom row, lin-log presentation) for NTF2 and Impβ binding to different FG domains (see labels at top) at selected FG domain grafting densities (visualized by distinct symbols and colors).
Error bars are shown for all data points in the binding isotherms, and for three selected data points (indicating the trends) per curve in the thickness isotherms. The data for Impβ binding to the 10.0 pmol/cm2 Nsp1 film were reproduced from Eisele et al. (2010); this data was acquired with Nsp1 carrying a His tag at the opposite end (N-terminus) compared to the other Nsp1 data in this study, in a separate SE measurement and no simultaneously recorded thickness data are available. Full experimental details are available in ‘Materials and methods’ and Figure 1—figure supplements 1–5; tabulated results are available in Figure 1—source data 1.
-
Figure 1—source data 1
Tables of data shown in Figure 1.
- https://doi.org/10.7554/eLife.14119.006
Figure 1—figure supplement 1
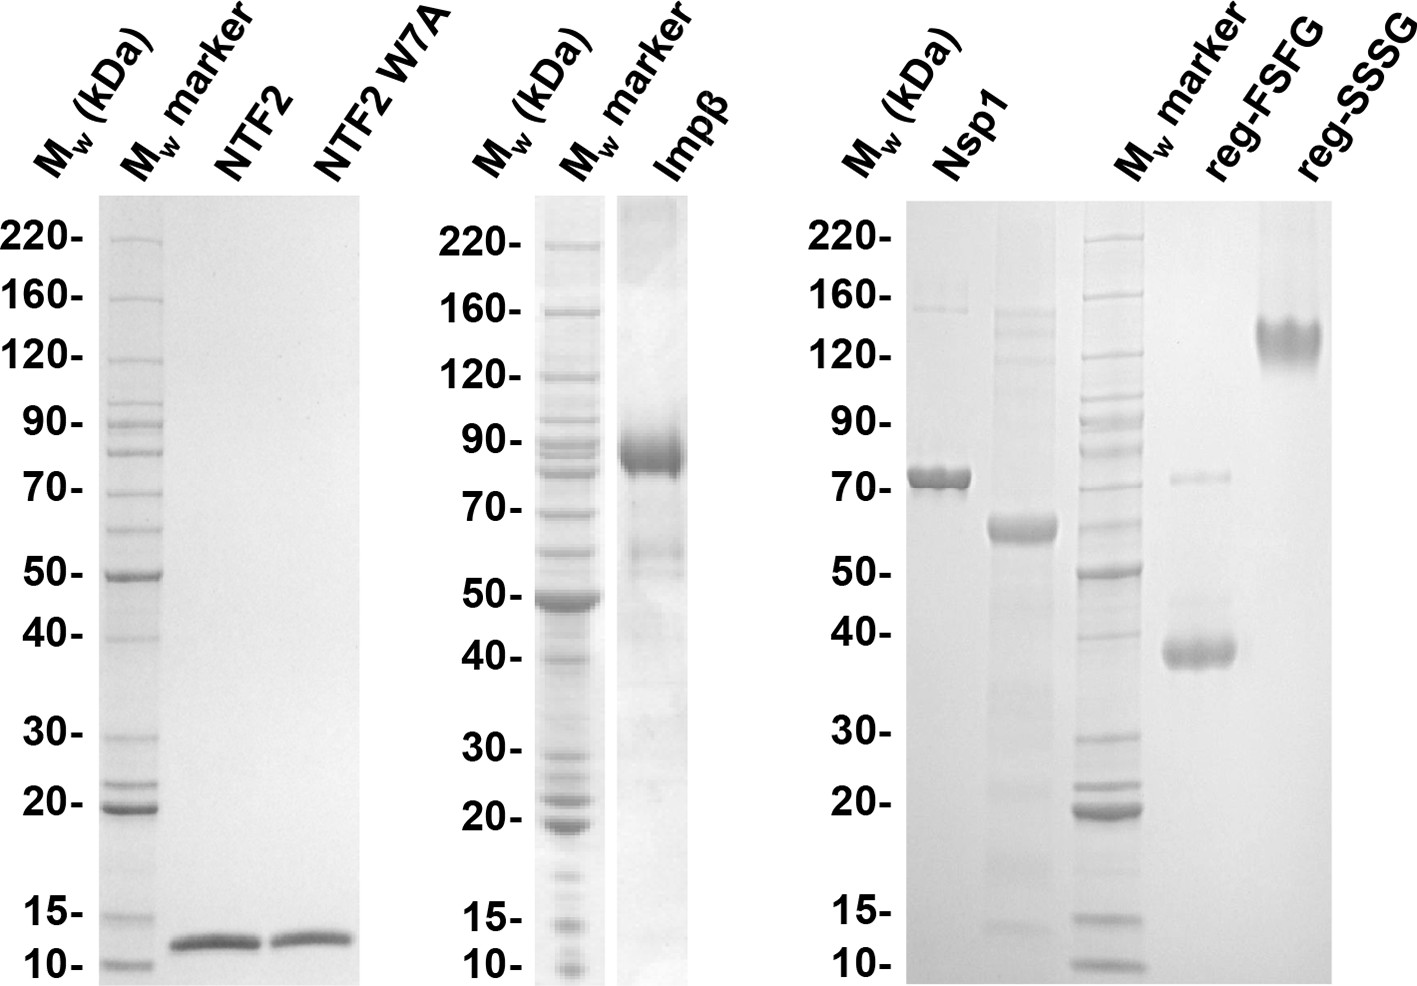
Quality of purified recombinant proteins used in this study.
FG domains with His tag were dissolved in formamide and diluted 1:3 in SDS sample buffer. 1.5 to 2.5 μg of each protein construct were resolved by SDS-PAGE and stained with Coomassie G250. The band corresponding to reg-SSSG runs much higher than the molecular weight expected; this is usually the case for very hydrophilic proteins (Shirai et al., 2008). All preparations contain more than 95% full length protein.
Figure 1—figure supplement 2

FG domains are anchored specifically and stably through their terminal His tag.
(A) Binding and elution of reg-FSFG was monitored by SE, on a silica surface previously functionalized with a supported lipid bilayer (SLB; 7% tris-NTA). Arrows on top of the graph indicate the start and duration of incubation with different sample solutions; during remaining times, the surface was exposed to working buffer. Most of the reg-FSFG remains stably bound upon rinsing in working buffer. reg-FSFG was fully eluted after the imidazole treatment (grey shaded area, not monitored), demonstrating that binding is specific through the His tag. (B-D) Site-specific and stable anchoring of Nsp1 to His tag capturing QCM-D sensors, as well as Nsp1 and Nup98-glyco to SLBs (10% bis-NTA) on silica is demonstrated by QCM-D; the data are reproduced from Figure 1 in Eisele et al. (2012) and Figure S2 in Eisele et al. (2013), respectively.
Figure 1—figure supplement 3
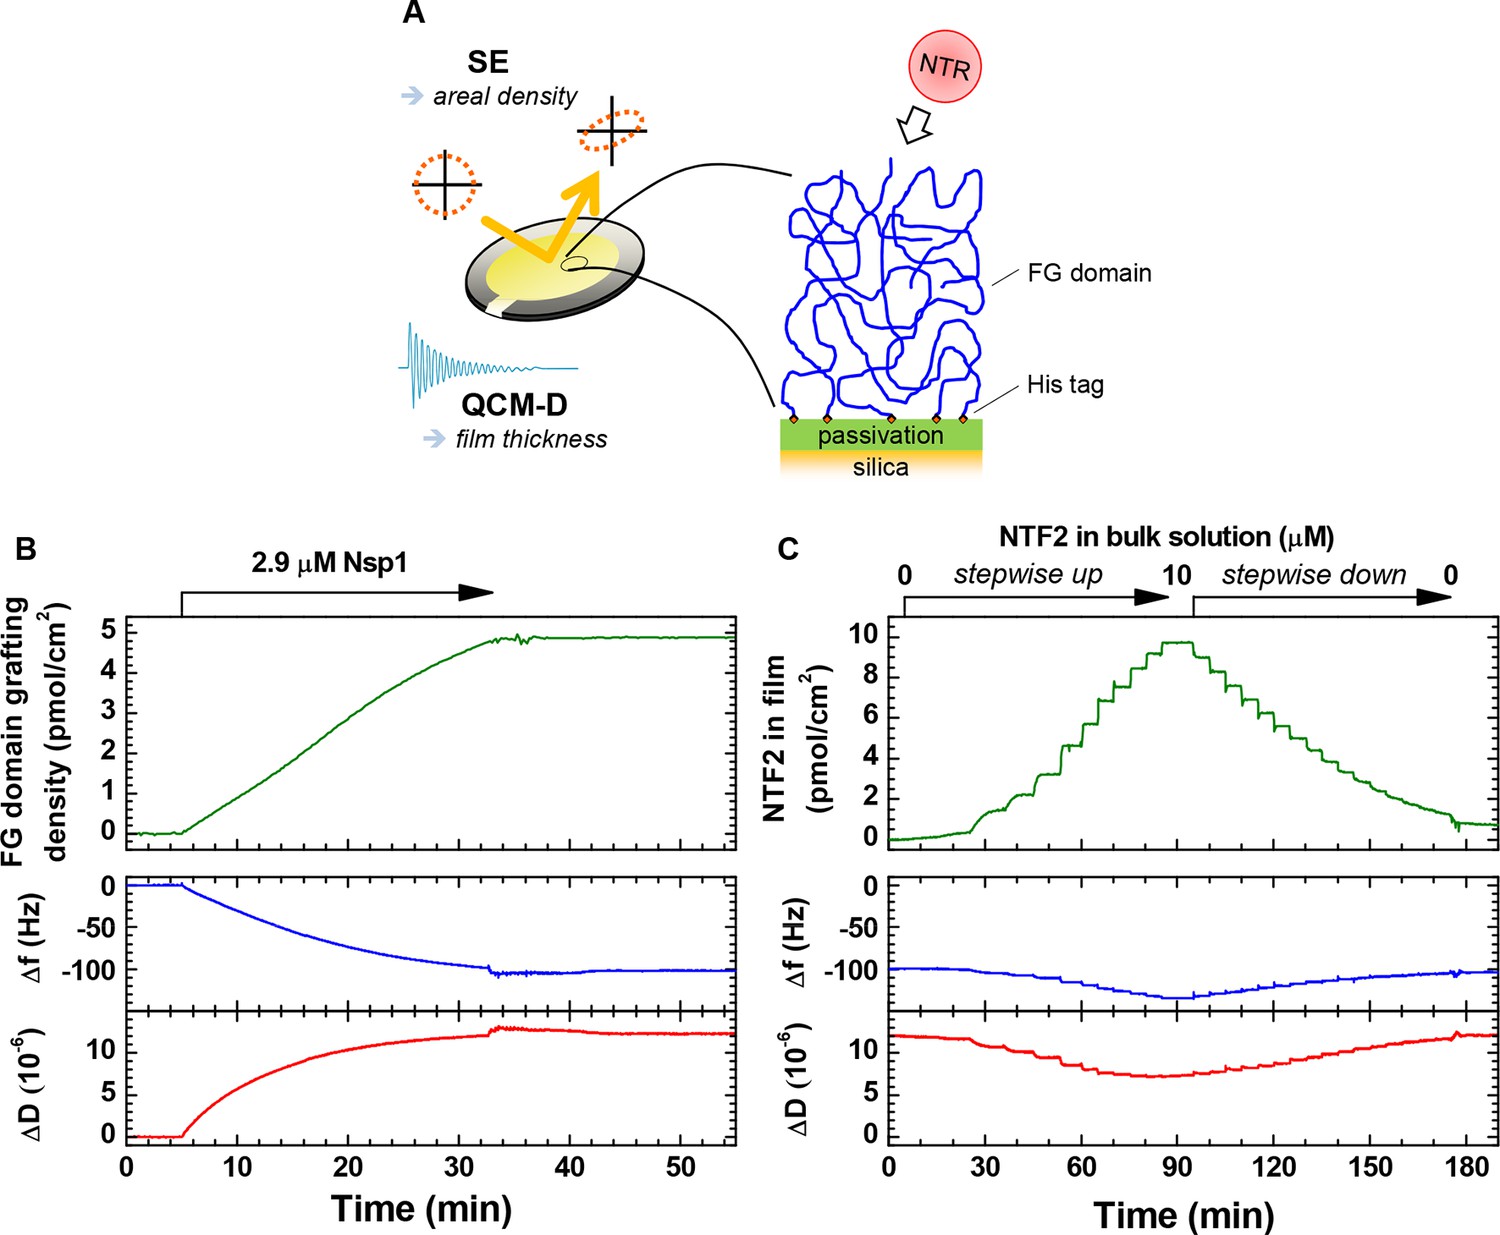
Schematic illustration of the experimental approach and representative data.
(A) Schematic illustration of the experimental approach. (B–C) Representative data for combined SE/QCM-D measurements. Areal protein densities (top) are obtained through optical modeling of SE data (see Materials and methods). QCM-D responses (bottom) are recorded in parallel, and normalized frequency shifts Δfi/i and dissipation shifts ΔDi for a selected overtone (i = 3) displayed here. Film thickness is obtained through viscoelastic modeling of QCM-D data (see Materials and methods). Δf = ΔD = 0 corresponds to the functionalized surface before FG domain grafting. (B) Monitoring of FG domain film formation. Nsp1 was exposed to a silica substrate previously functionalized with an SLB (7% tris-NTA). The final grafting density is 4.9 pmol/cm2. Minor perturbations in Δf and ΔD between 33 and 43 min are due to transient variations in the solution temperature in contact with the QCM-D sensor during the rinsing with buffer, and do not represent changes of the Nsp1 film. (C) Time-resolved data for the titration of NTF2 into this Nsp1 film. The NTF2 solution concentration was increased in 12 steps (0.0025, 0.01, 0.05, 0.1, 0.2, 0.5, 1, 2, 3, 5, 7.5 and 10 μM), and then decreased in 16 steps ((2/3)j × 10 μM, with j = 1, …, 16), followed by continuous rinsing with buffer solution to remove all NTF2 from the bulk solution. The rapid binding and unbinding of NTF2 observed here is representative for all titration measurements performed, and binding equilibriums could thus be readily attained. Moreover, binding of NTF2 was largely reversible, with less than 7% of the maximal binding remaining following rinsing in buffer for any given measurement. For Impβ, more than 75% were readily eluted from 5 pmol/cm2 Nsp1 films, and we had previously shown this NTR to elute close to completely from 10 pmol/cm2 Nsp1 films (Eisele et al., 2012; Eisele et al., 2010).
Figure 1—figure supplement 4
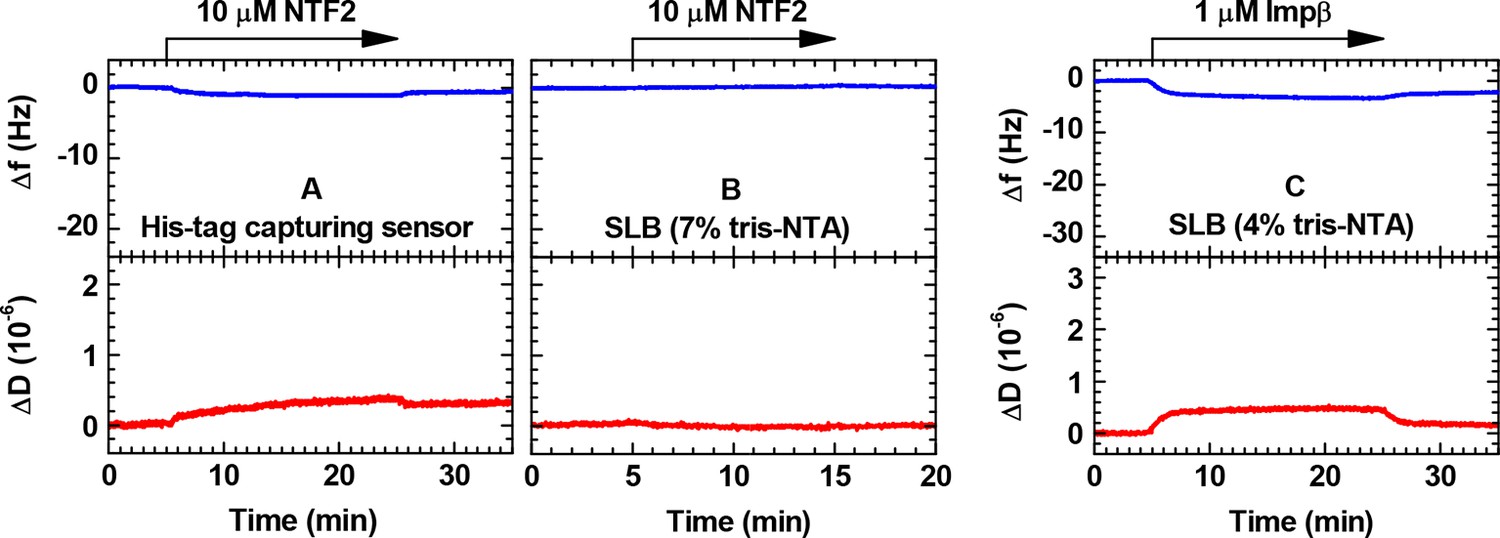
Controls for the binding of NTRs to His tag capturing surfaces monitored by QCM-D.
(A) NTF2 on His tag capturing QCM-D sensor; (B) NTF2 on SLB (7% tris-NTA); (C) Impβ on SLB (4% tris-NTA). The vertical scales were chosen such that the full range would approximately cover the magnitude expected for a full monolayer of NTRs.
Figure 1—figure supplement 5
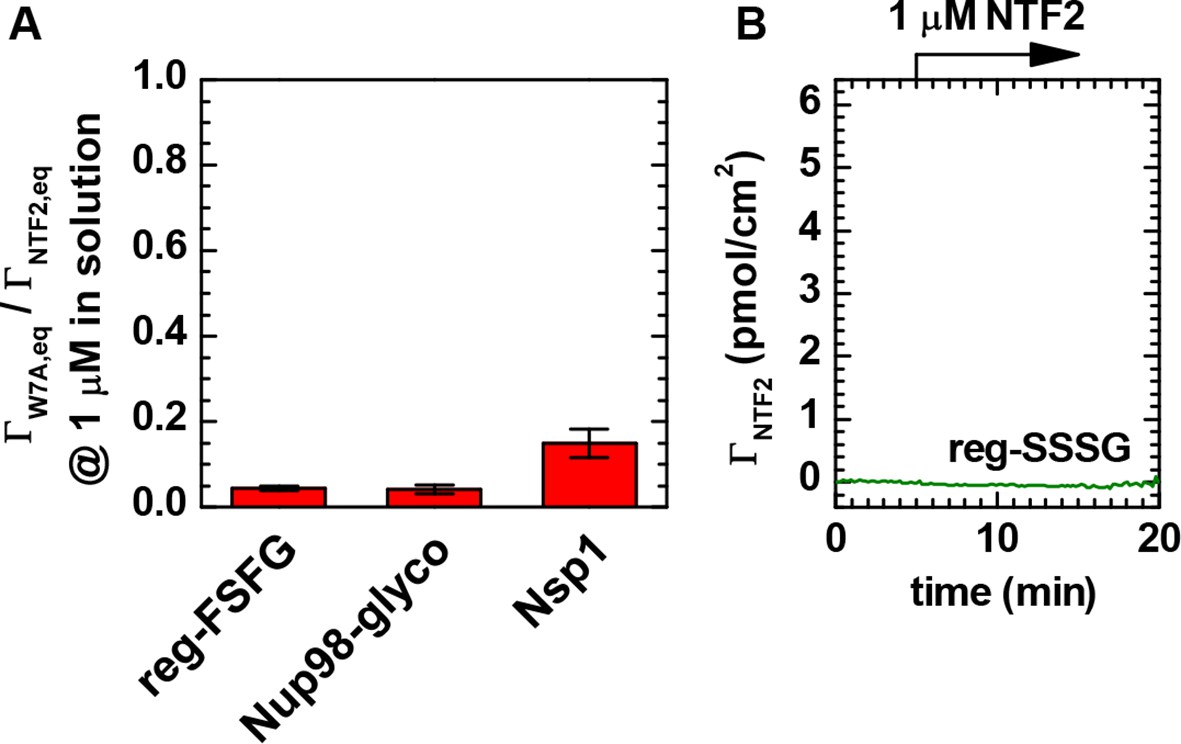
NTF2 binds all FG domains predominantly through its primary binding site.
(A) Ratio of equilibrium bound amounts of NTF2 W7A mutant and wild type NTF2 as a function of FG domain type. NTF2 and NTF2 W7A mutant were sequentially exposed to FG domain films, and binding was quantified by SE. Mean and standard errors of two to four independent measurements per FG domain type with FG domain surface densities ranging between 5 and 13 pmol/cm2 are presented. The tryptophan at position 7 is known to be important for the binding of NTF2 through a structurally defined (Bayliss et al., 2002) binding site to FG motifs (Bayliss et al., 1999). For all tested FG domain types, binding of the W7A mutant was reduced by more than 80% compared to native NTF2. (B) Native NTF2 did not bind to reg-SSSG (here at 8.3 pmol/cm2), confirming that binding to reg-FSFG requires the FSFG motif. These data confirm that the NTF2 in our experiments binds specifically to the immobilized FG domains through its primary FG motif binding site.
Figure 2 with 1 supplement
Quantitative analysis of the binding isotherms.
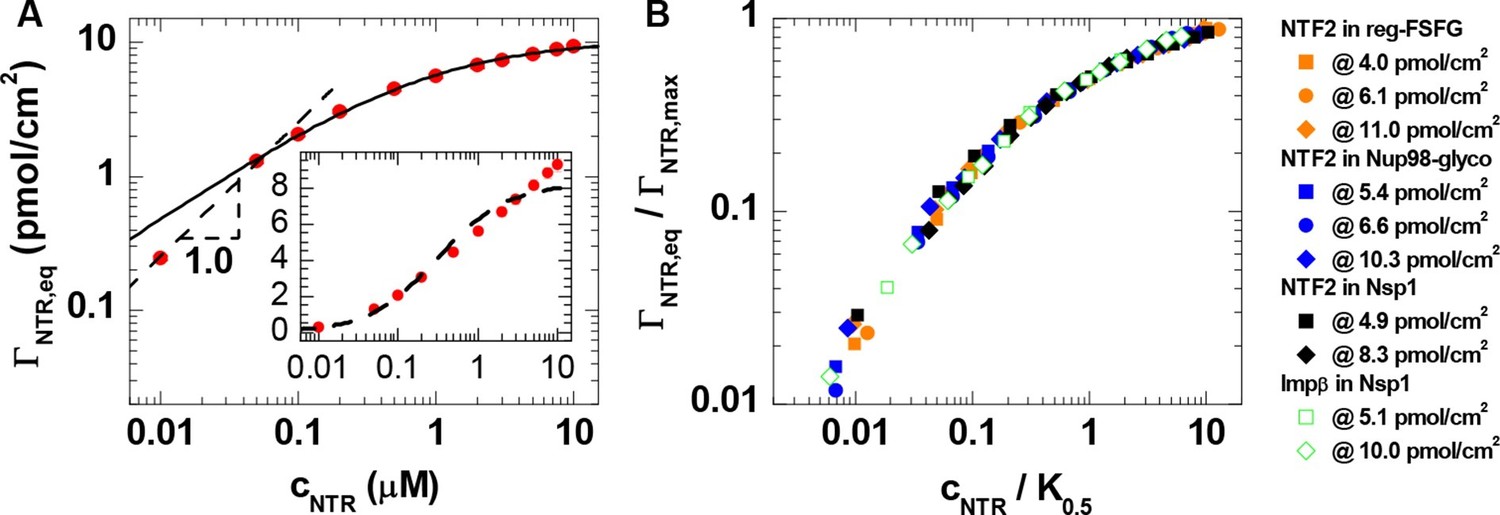
(A) A selected data set (NTF2 binding to 6.1 pmol/cm2 reg-FSFG; symbols) with fits to simple binding models (lines). Data at low NTR concentration (cNTR ≤ 0.05 μM) display a close-to-linear relation (dashed line with slope 1.0 in the log-log plot), as expected for independent binding, yet the Langmuir isotherm (inset, dashed line in lin-log plot) fails to reproduce the data over the full range of NTR concentrations. The Hill equation provides a good description of the data in the high-concentration range (0.05 μM ≤ cNTR ≤ 10 μM; solid line). (B) By normalizing the areal densities and NTR concentrations to ΓNTR,max and K0.5, respectively, all data could be overlaid on a single master curve, where the effective maximal binding ΓNTR,max and the half-maximal binding K0.5 were determined from fits with the Hill equation (see main text and Figure 2—figure supplement 1).
Figure 2—figure supplement 1
Quantitative analysis of the binding isotherms in Figure 1.
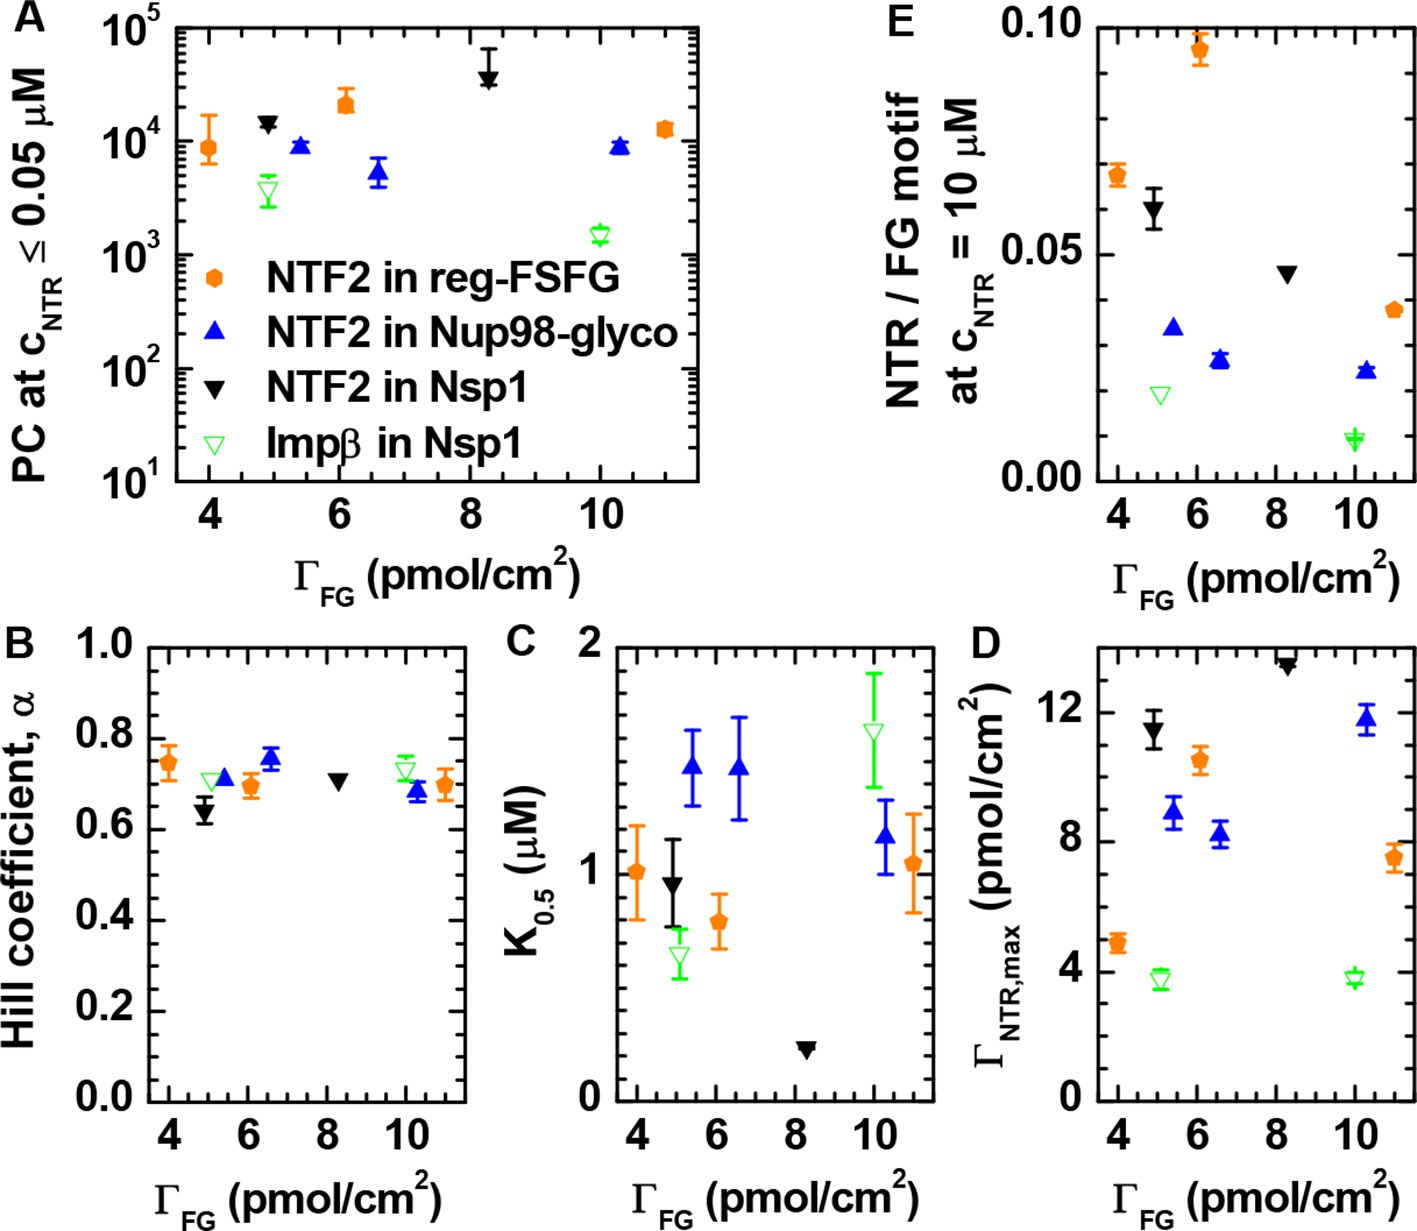
Analysis as a function of NTR and FG domain types (visualized by distinct symbols and colors, as indicated in A) and grafting density ΓFG. (A) Partition coefficients PC were obtained from a linear fit to the data at cNTR≤ 0.05 μM. (B-D) Results of fits with the Hill equation, i.e., the Hill coefficient α, the concentration for half maximal binding K0.5 and the effective maximal binding ΓNTR,max. In a first step, seven data sets where selected for which data covered the full range of 0.05 μM ≤ cNTR ≤ 10 μM, and fitted over 0.05 μM ≤ cNTR ≤ 10 μM with α, K0.5 and ΓNTR,max as adjustable parameters. From this analysis, a mean value of α = 0.71 ± 0.04 was determined. In a second step, an equivalent analysis was performed for the remaining three data sets, for which the experimental data did not cover the full concentration range (i.e., NTF2 on 5.4 pmol/cm2 Nup98-glyco, NTF2 on 8.3 pmol/cm2 Nsp1, and Impβ on 5.1 pmol/cm2 Nsp1), with α = 0.71 fixed. By thus fixing α, we prevented a scatter of the fit parameters that would only be due to the limited input data. (E) Ratio of NTR bound per FG motif at cNTR = 10 μM; the three data points not directly measured were obtained through extrapolation using the Hill equation.
Figure 3 with 5 supplements
Computational model.
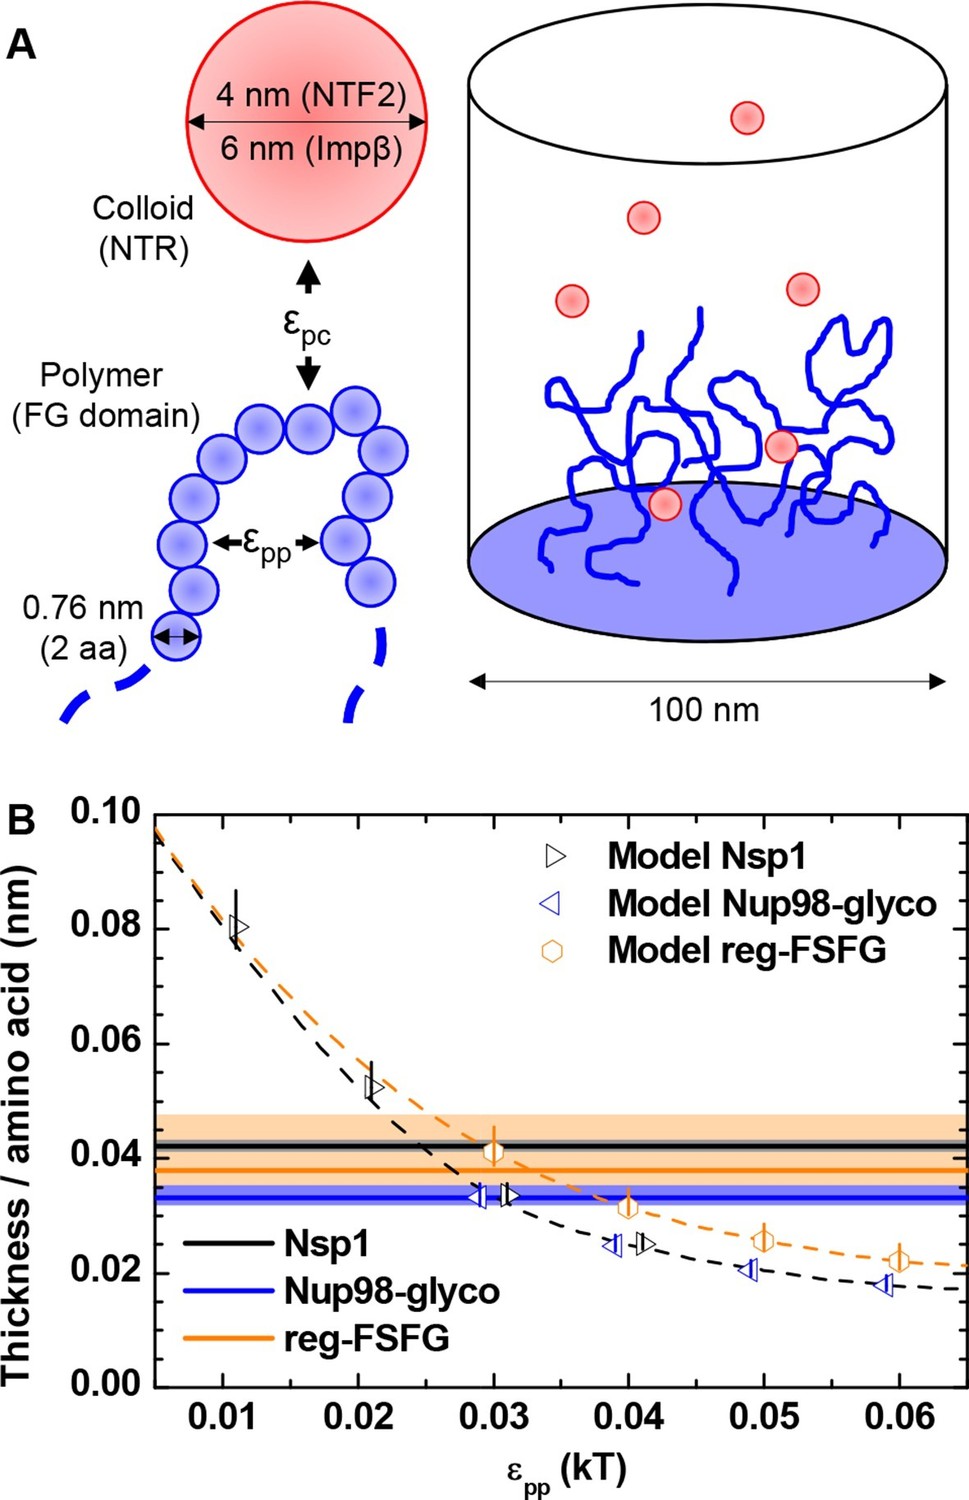
(A) Schematic illustration of the computational model. FG domains are represented as end-grafted polymers anchored at 5.5 pmol/cm2 (i.e., 3.3 molecules per 100 nm2) to the bottom of a 100 nm diameter cylinder, and modeled as strings of beads, where each bead has equal bond length and diameter (two amino acids, 0.76 nm). The number of polymer beads was set to match the length of experimentally used FG domains. NTF2 dimers and Impβ are represented as spherical colloids of 4.0 and 6.0 nm diameter, respectively. (B) Matching of the computational model with experimental data for FG domain films in the absence of NTRs. Horizontal lines represent the experimentally determined film thickness per amino acid for different FG domains (black line - Nsp1 at 4.9 pmol/cm2; blue line - Nup98-glyco at 5.4 pmol/cm2; orange line - reg-FSFG at 6.1 pmol/cm2), with shaded areas in matching colors indicating confidence intervals. Symbols represent the thickness as predicted by the computational model as a function of εpp for the different FG domains (at 5.5 pmol/cm2; colors match experimental data). The data points and the upper and lower ends of the vertical lines refer to the effective thicknesses where the densities have dropped to 5%, 1% and 10% of the maximal densities in the film, respectively. Symbols for Nsp1 and Nup98-glyco are translated along the x axis by +0.1 kBT and -0.1 kBT, respectively, to improve their visibility. Dashed lines through the symbols are cubic interpolations (the black dashed line is for Nsp1 and Nup98-glyco). Full computational details are available in ‘Materials and methods’ and Figure 3—figure supplements 1–5.
Figure 3—figure supplement 1
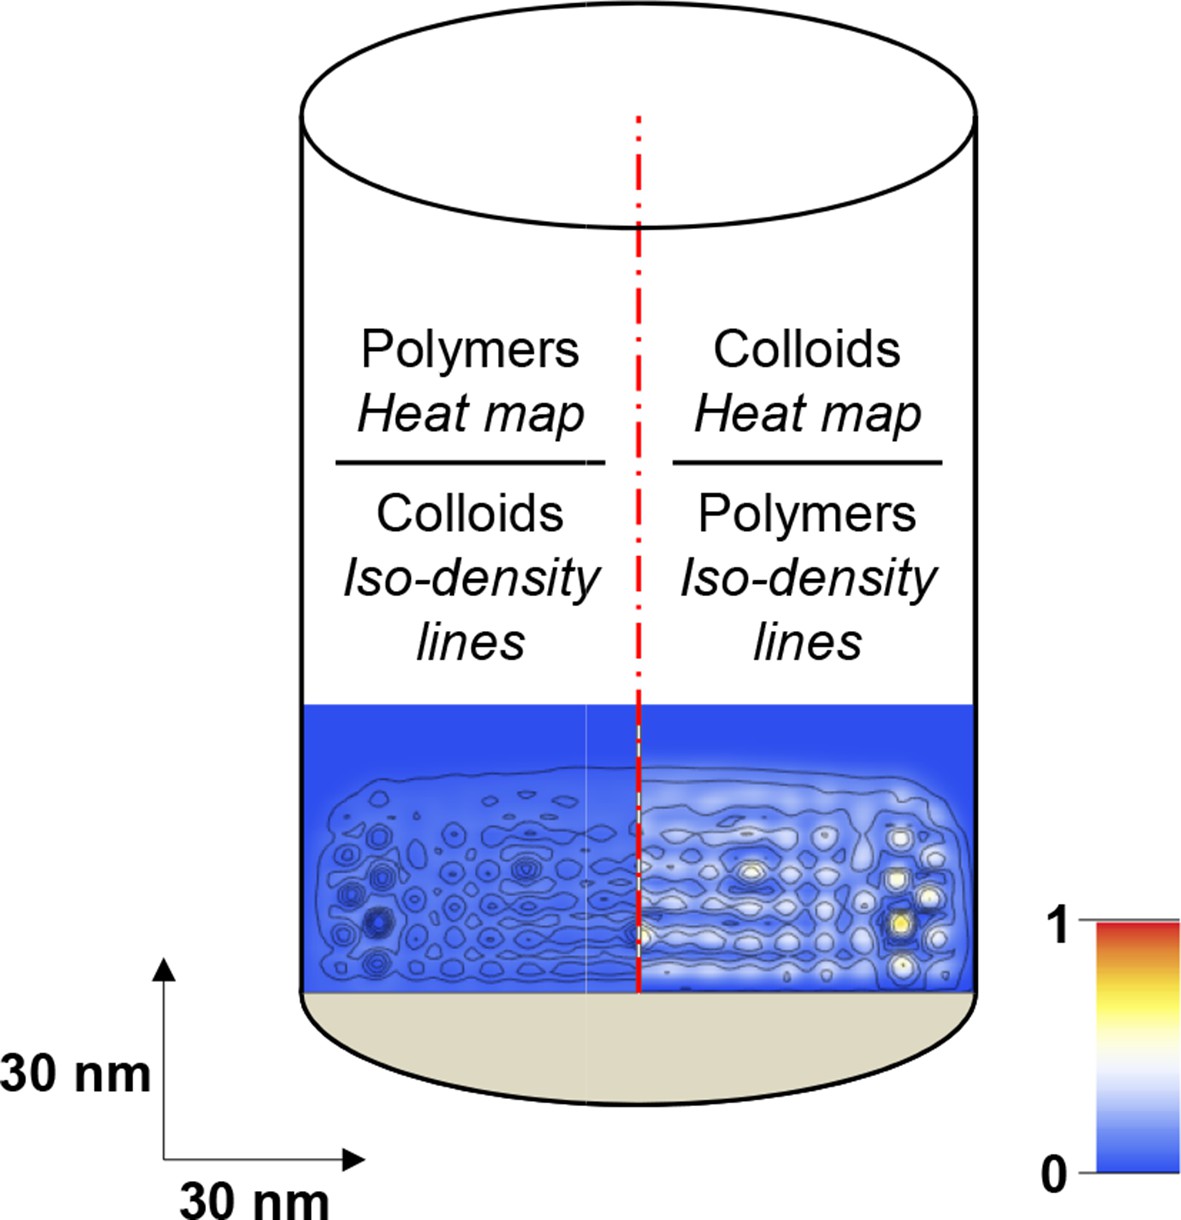
Scheme illustrating how computational modeling data is presented in the form of maps of the polymer and colloid packing fractions.
Maps are cross-sections along the axis of the modeled cylinder (with polymers grafted at the bottom; cf. Figure 3A). The bottom part of the cylinder at full width (100 nm) is shown, with horizontal and vertical dimensions to scale. The left half of each map shows the polymer packing fraction as a heat map (with scale bar in the bottom right) and the colloid packing fraction as iso-density lines; the right half shows the colloid packing fraction as a heat map and the polymer packing fraction as iso-density lines.
Figure 3—figure supplement 2
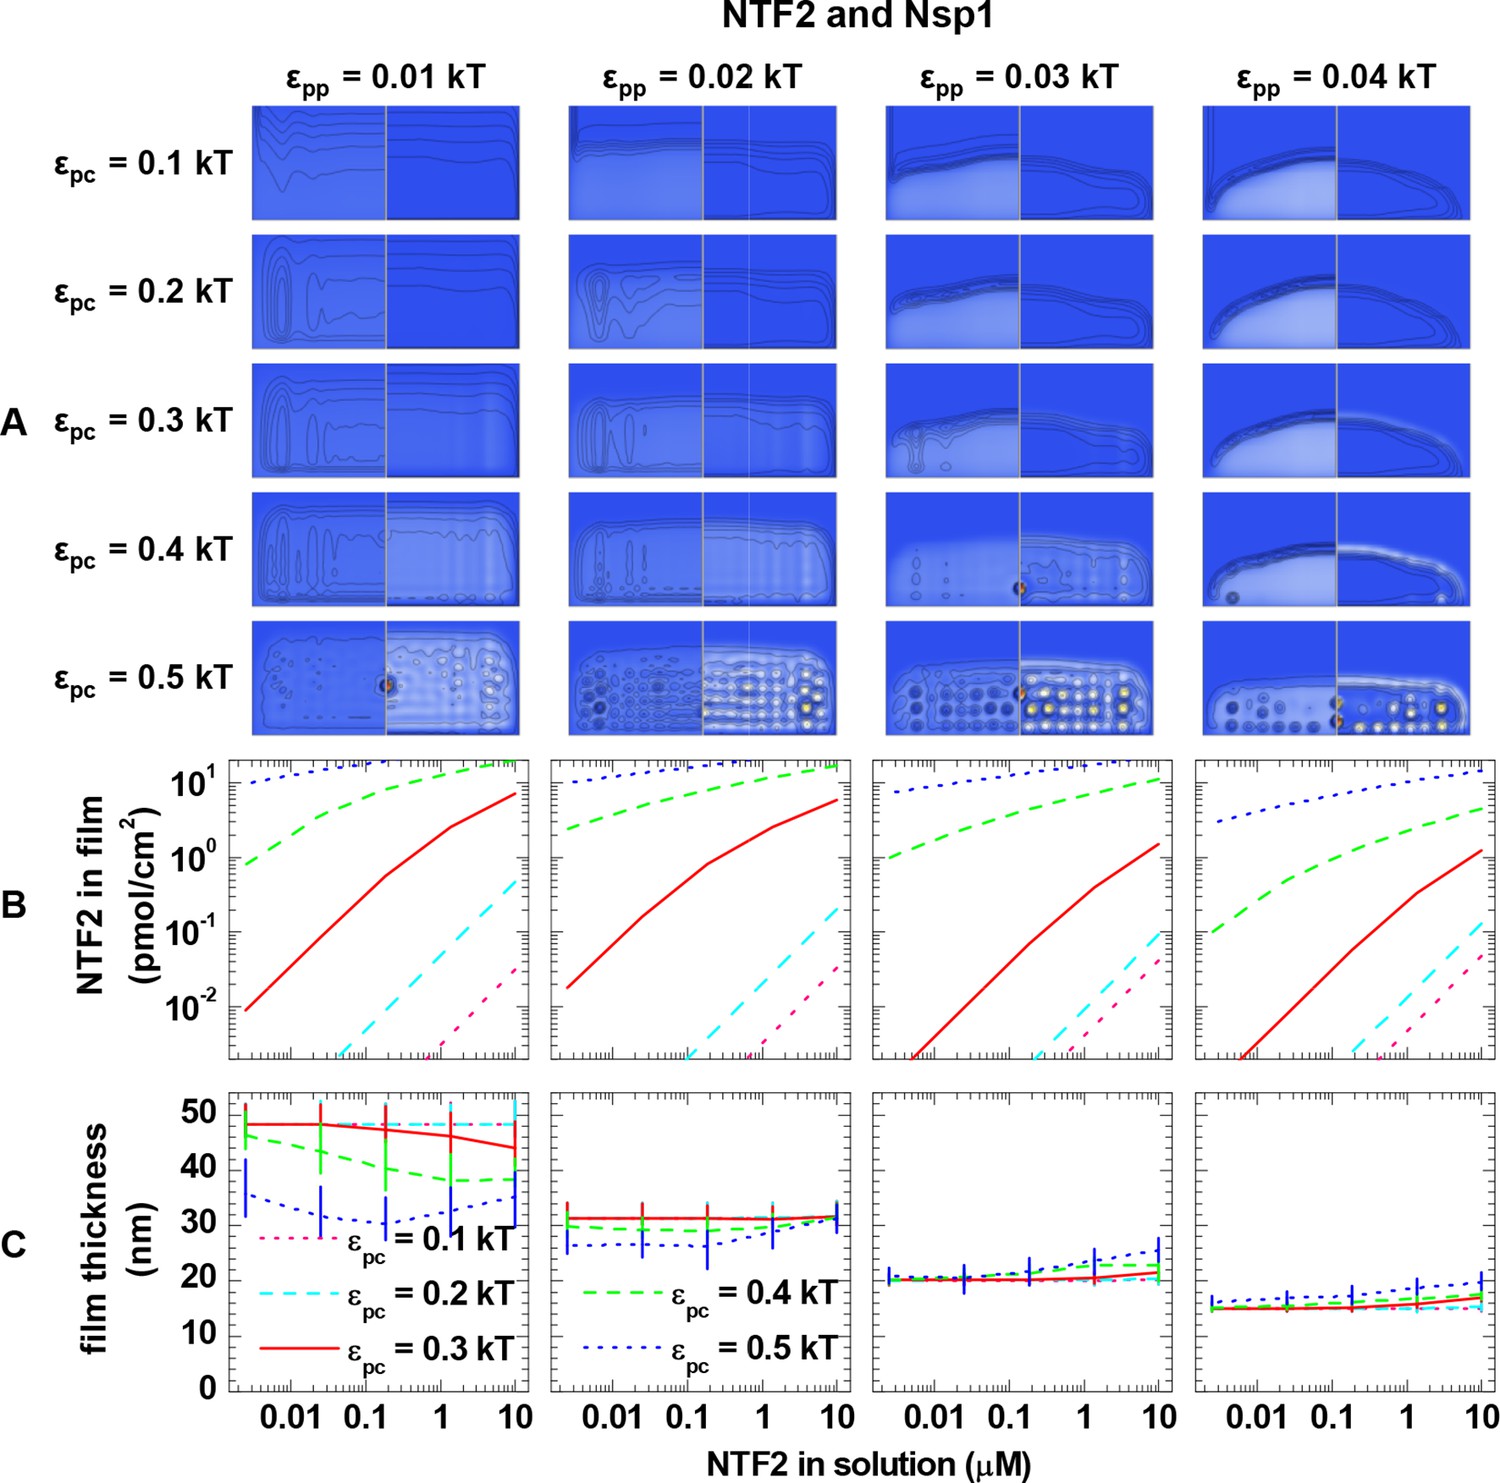
Computational modeling data for a polymer length equivalent to Nsp1 and colloids of 4.0 nm diameter (equivalent to NTF2 homodimers).
(A) Maps of the polymer and colloid packing fractions at 10 μM colloid in solution, presented as described in figure supplement 1, for selected sets of εpc (rows, as indicated on left side) and εpp (columns, as indicated on bottom). (B-C) Areal density of colloids in the film and film thickness, respectively, as a function of colloid concentration in solution for selected sets of εpp (as indicated on top) and εpc (as indicated in the graphs). The data covers the full parameter space computed. The lines and upper and lower ends of the vertical bars in (C) correspond to effective thicknesses where the densities have dropped to 5%, 1% and 10% of the maximal densities in the film, respectively (see Figure 3 and Materials and methods).
Figure 3—figure supplement 3
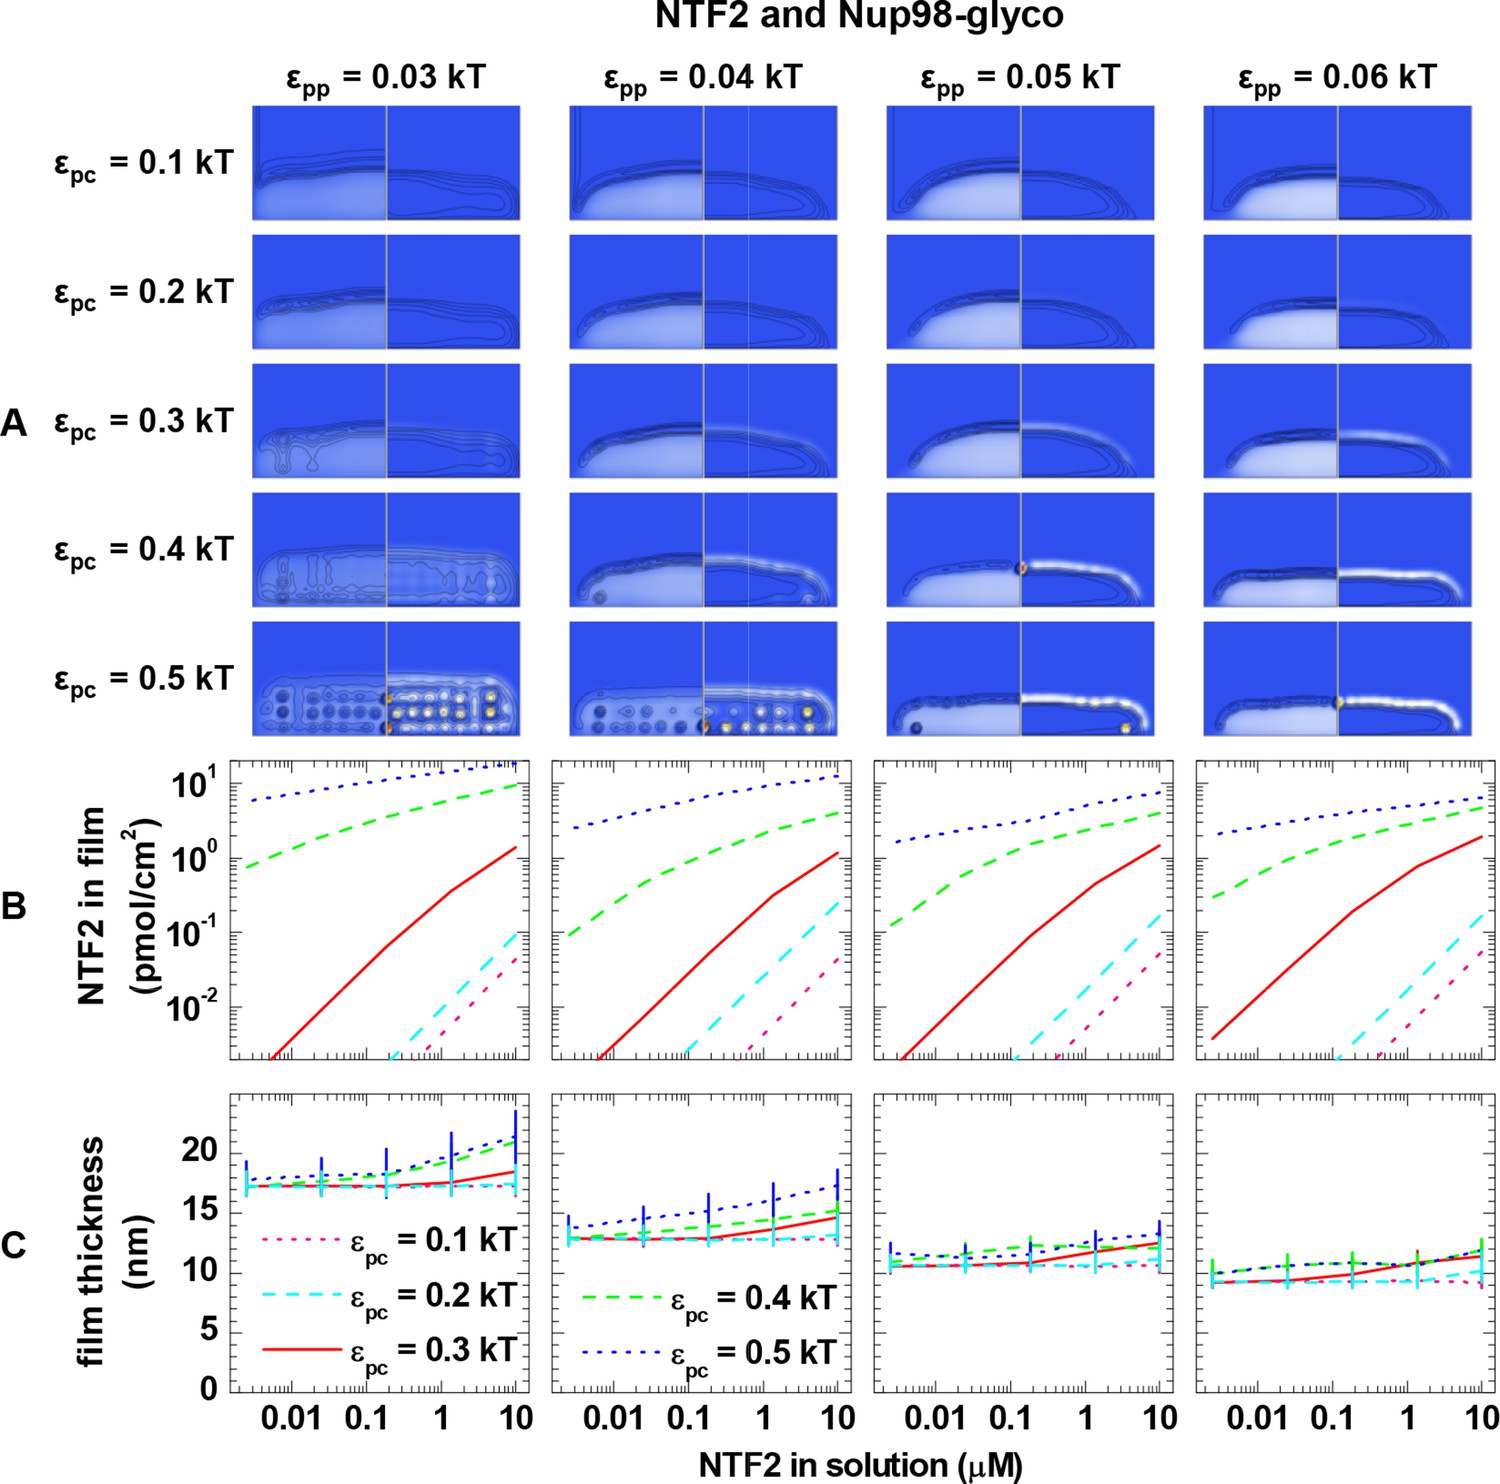
Computational modeling data for a polymer length equivalent to Nup98-glyco and colloids of 4.0 nm diameter (equivalent to NTF2 homodimers).
Data are displayed analogous to Figure 3—figure supplement 2.
Figure 3—figure supplement 4
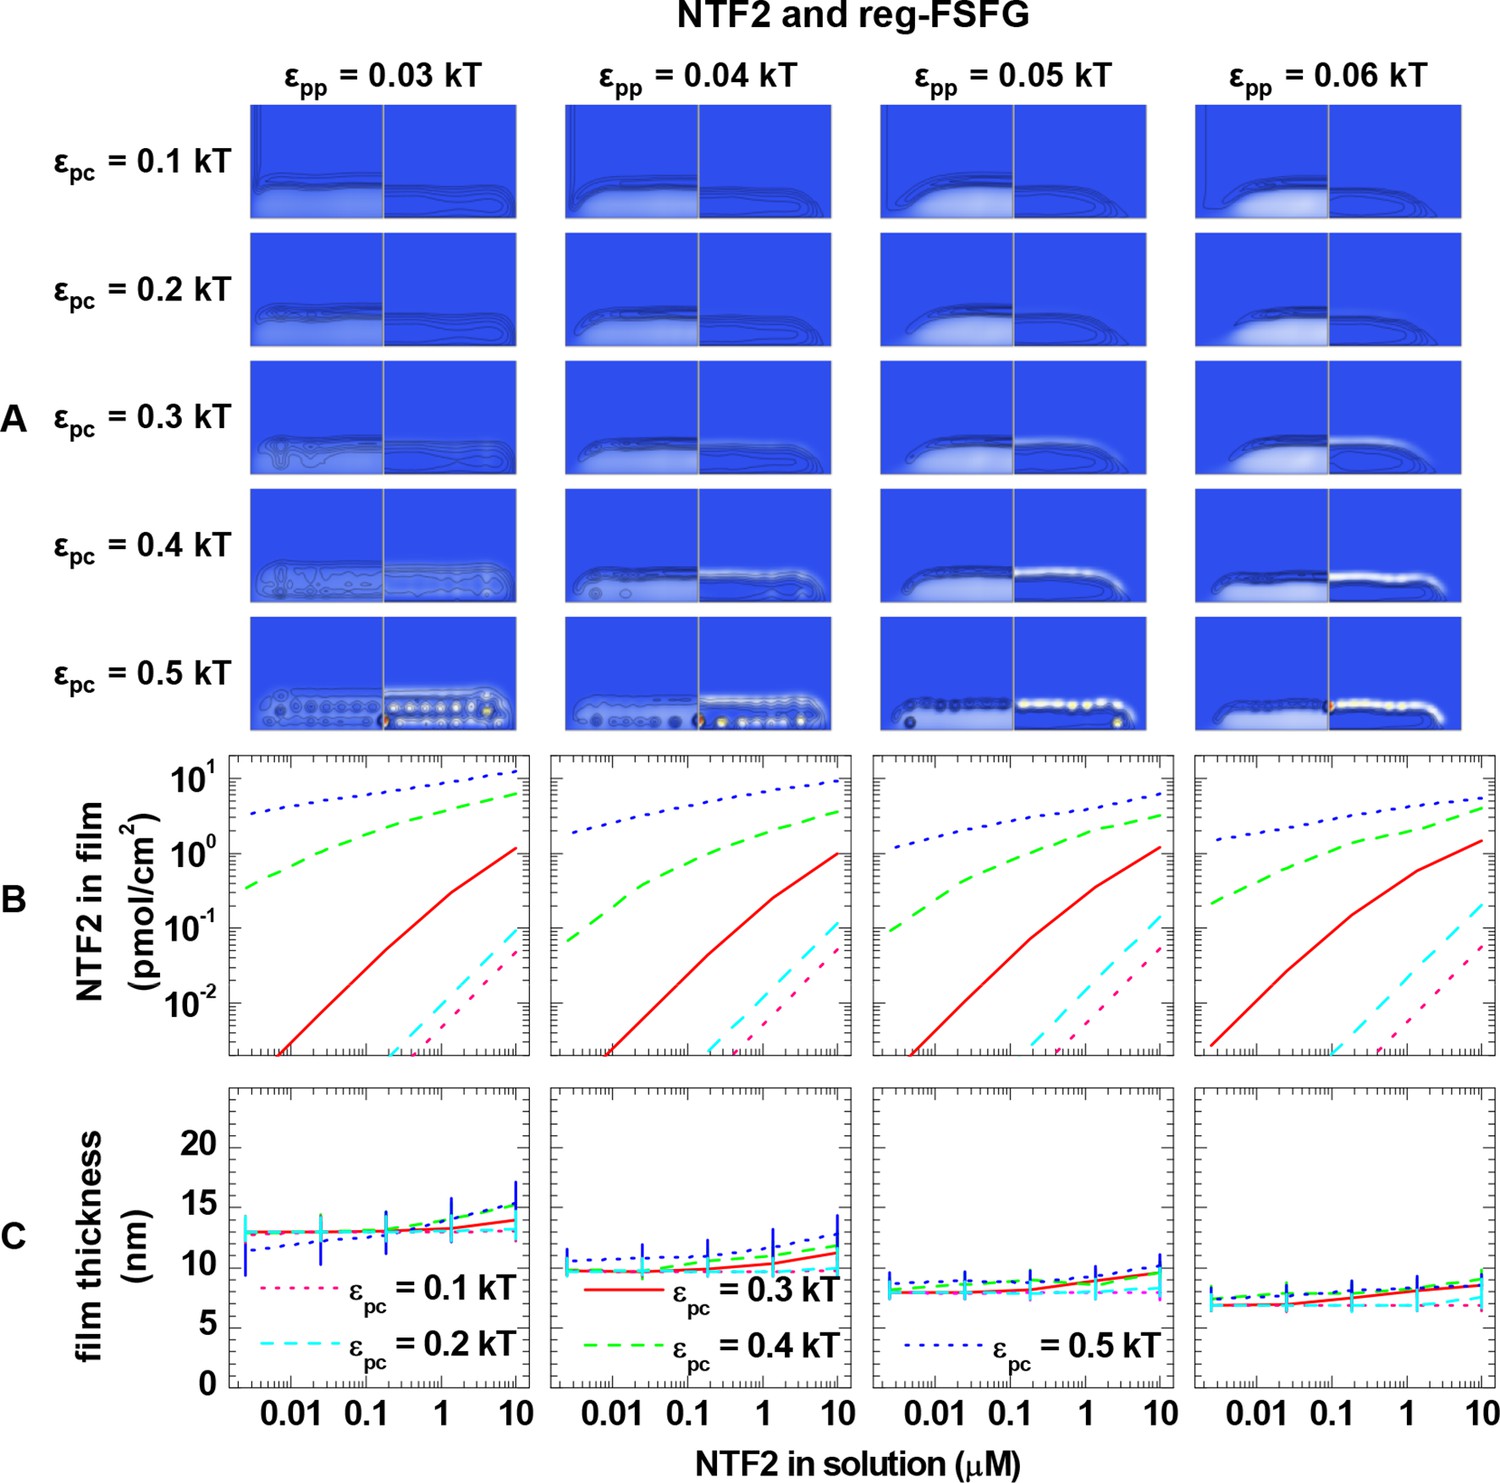
Computational modeling data for a polymer length equivalent to reg-FSFG and colloids of 4.0 nm diameter (equivalent to NTF2 homodimers).
Data are displayed analogous to Figure 3—figure supplement 2.
Figure 3—figure supplement 5
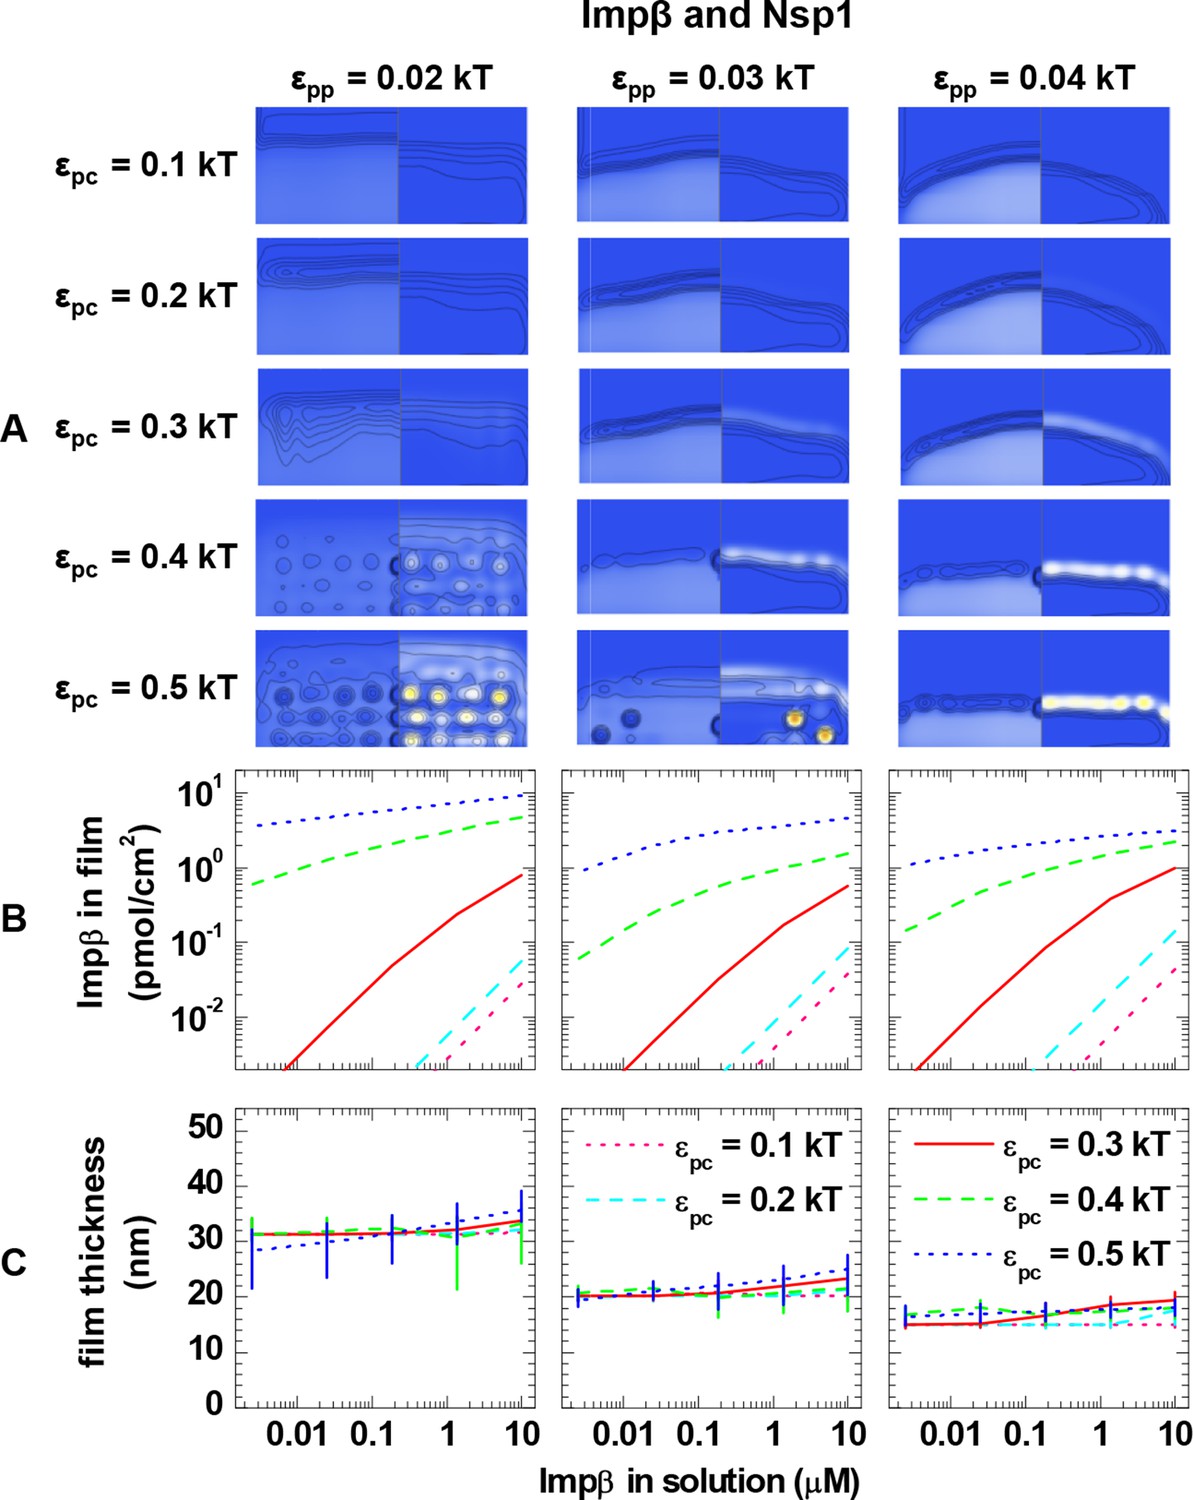
Computational modeling data for a polymer length equivalent to Nsp1 and colloids of 6.0 nm diameter (equivalent to Impβ).
Data are displayed analogous to Figure 3—figure supplement 2.
Figure 4
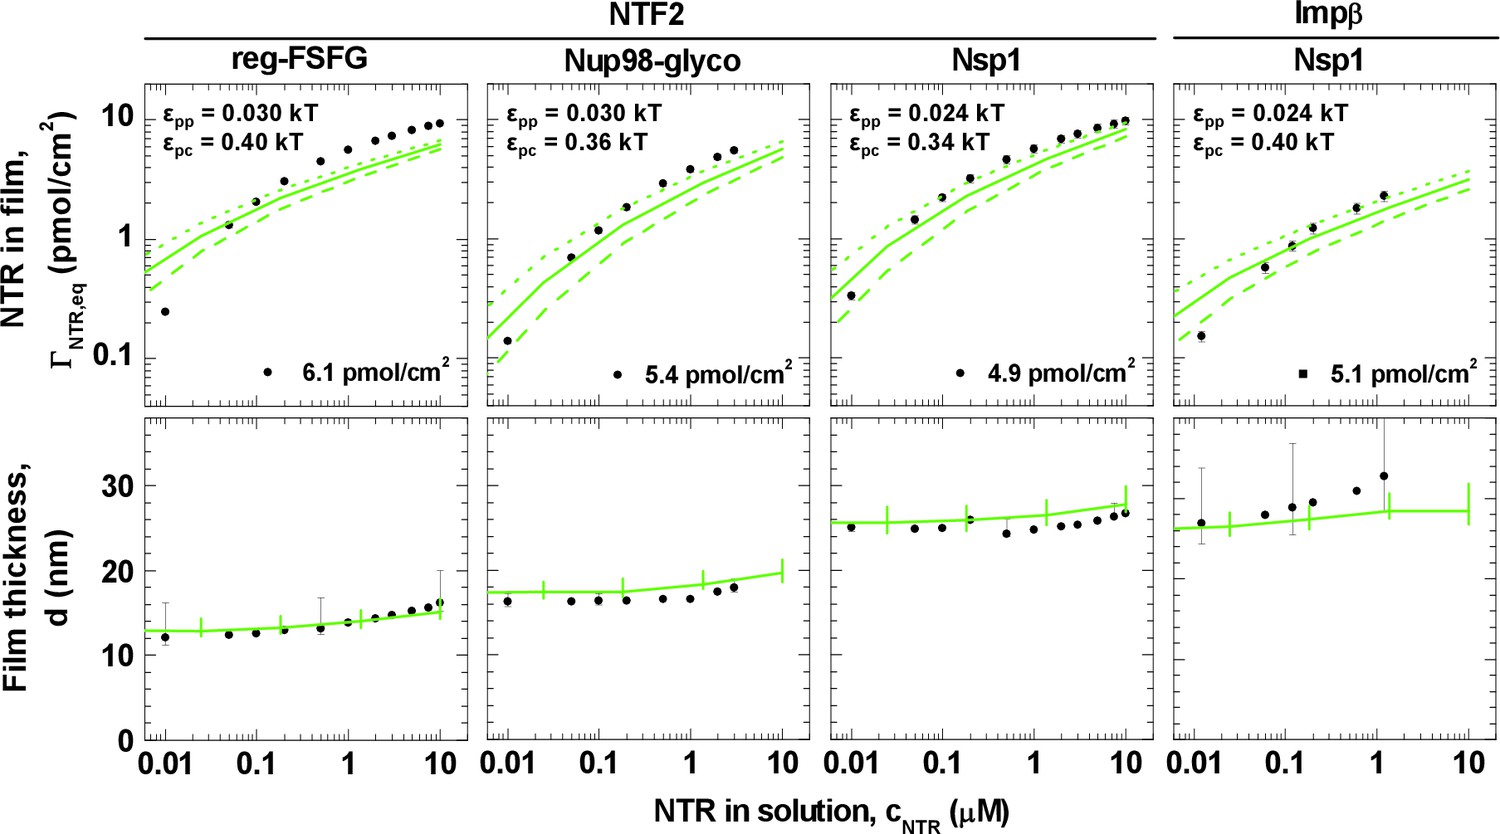
Matching of experimental and computational data.
The top row shows binding isotherms and the bottom row the concomitant film thickness evolution. The grafting density was set to 5.5 pmol/cm2 in all computations, and the experimental data with the closest FG domain grafting densities are reproduced from Figure 1 and visualized by black symbols. Computational data are shown as green lines. The solid lines represent the best match to the experiment, and the corresponding εpp and εpc are indicated. The best match of the binding isotherms was determined by minimization of the least square differences of log(ΓNTR,eq) over the range 0.025 μM ≤ cNTR ≤ 10 μM, where the experimental data was interpolated and extrapolated using a linear fit for cNTR < 0.05 μM, and the Hill equation for cNTR > 0.05 μM, as shown in Figure 2 and Figure 2—figure supplement 1. Dashed lines and dotted lines in the top row correspond to a change in εpc by -0.01 kBT and +0.01 kBT, respectively, with εpp unchanged. The lines and upper and lower ends of the vertical bars in the bottom row correspond to effective thicknesses where the densities have dropped to 5%, 1% and 10% of the maximal densities in the film, respectively (see Figure 3 and Materials and methods).
Figure 5
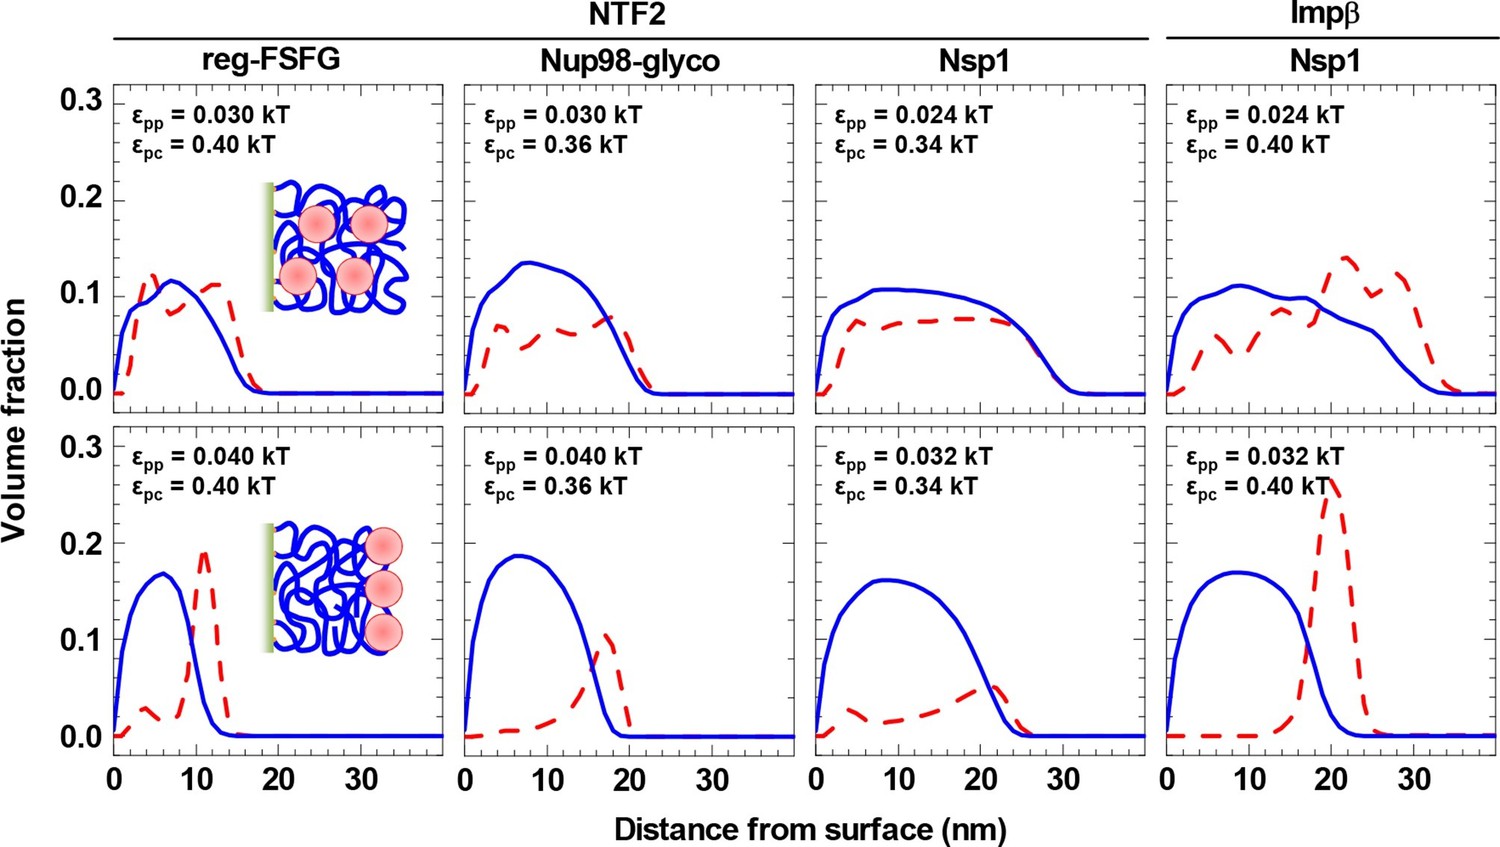
NTRs favor the penetration of and binding into FG domain films, but only just so.
Computed packing fraction profiles (polymer – blue solid line, colloid – red dashed line) in the presence of 10 μM NTR, as a function of distance from the grafting surface. The top row shows the predictions for the parameter sets of εpp and εpc that match the experimental data best (cf. Figure 4 and Table 2). The bottom row shows predictions with εpp increased by 33% compared to the best match. Schemes (insets) illustrate the distinct distributions of NTRs with these two parameter choices.
Figure 6
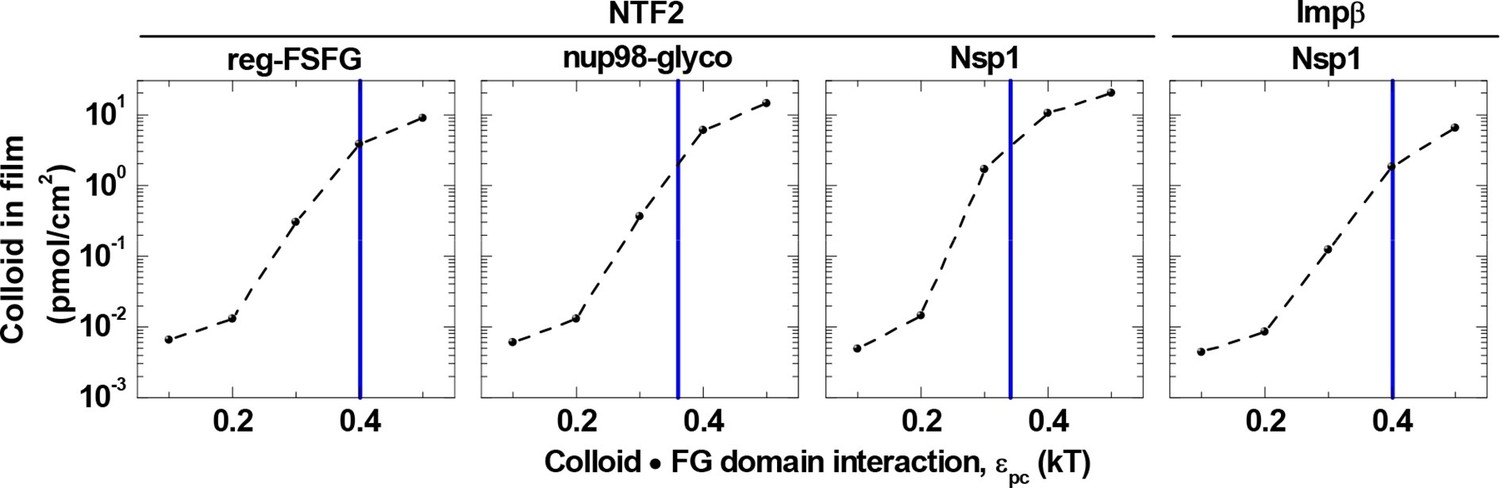
Colloid binding depends sharply on colloid•FG domain interaction strength εpc.
Computed colloid binding as a function of εpc is shown, for a colloid concentration in solution of 1.4 μM and with the FG domain cohesiveness εpp set to the values that best match the experimental data (cf. Table 2). The blue vertical lines indicate the εpc values giving the best match to the experimental data for the indicated FG domains and NTRs (cf. Table 2).
Tables
Table 1
Properties of employed FG domain constructs. See Table 1—source data 1 for the full amino acid sequences of these constructs.
| FG domain | amino acids a | sequence | FG motifs | FG motifs/amino acids | ||
|---|---|---|---|---|---|---|
| FxFG | GLFG | Other | ||||
| Nsp1 | 615 | irregular, natural | 19 | 0 | 14 | 0.054 |
| Nup98-glyco | 496 | irregular, natural | 3 | 8 | 28 | 0.079 |
| reg-FSFG | 315 | regular, artificial | 16 | 0 | 0 | 0.051 |
-
a Excluding the His tags but including all other auxiliary amino acids (TEV cleavage sites, Cys tags and spacers).
-
Table 1—source data 1
Amino acid sequence of employed FG domain constructs.
FG domains are shown in black letters, His tags in blue letters, and remaining parts (i.e., TEV cleavage sites, Cys tags and spacers) in grey letters. FxFG motifs are marked in yellow, GLFG motifs in green, other FG motifs in purple. Nup98-glyco features O-GlcNAc on ~30 of the S and T residues.
- https://doi.org/10.7554/eLife.14119.004
Table 2
Interaction parameters determined based on comparison of experiment and computational model.
| FG domain | εpp (kBT) | εpc (kBT) NTF2 | εpc (kBT) Impβ |
|---|---|---|---|
| Nsp1 | 0.024 ± 0.001 | 0.34 ± 0.02 | 0.40 ± 0.02 |
| Nup98-glyco | 0.030 ± 0.002 | 0.36 ± 0.02 | - |
| reg-FSFG | 0.030 ± 0.005 | 0.40 ± 0.02 | - |
Download links
A two-part list of links to download the article, or parts of the article, in various formats.
Downloads (link to download the article as PDF)
Open citations (links to open the citations from this article in various online reference manager services)
Cite this article (links to download the citations from this article in formats compatible with various reference manager tools)
A physical model describing the interaction of nuclear transport receptors with FG nucleoporin domain assemblies
eLife 5:e14119.
https://doi.org/10.7554/eLife.14119


