Place recognition using batlike sonar
- University of Bristol, United Kingdom
- University of Antwerp, Belgium
Figures
Figure 1
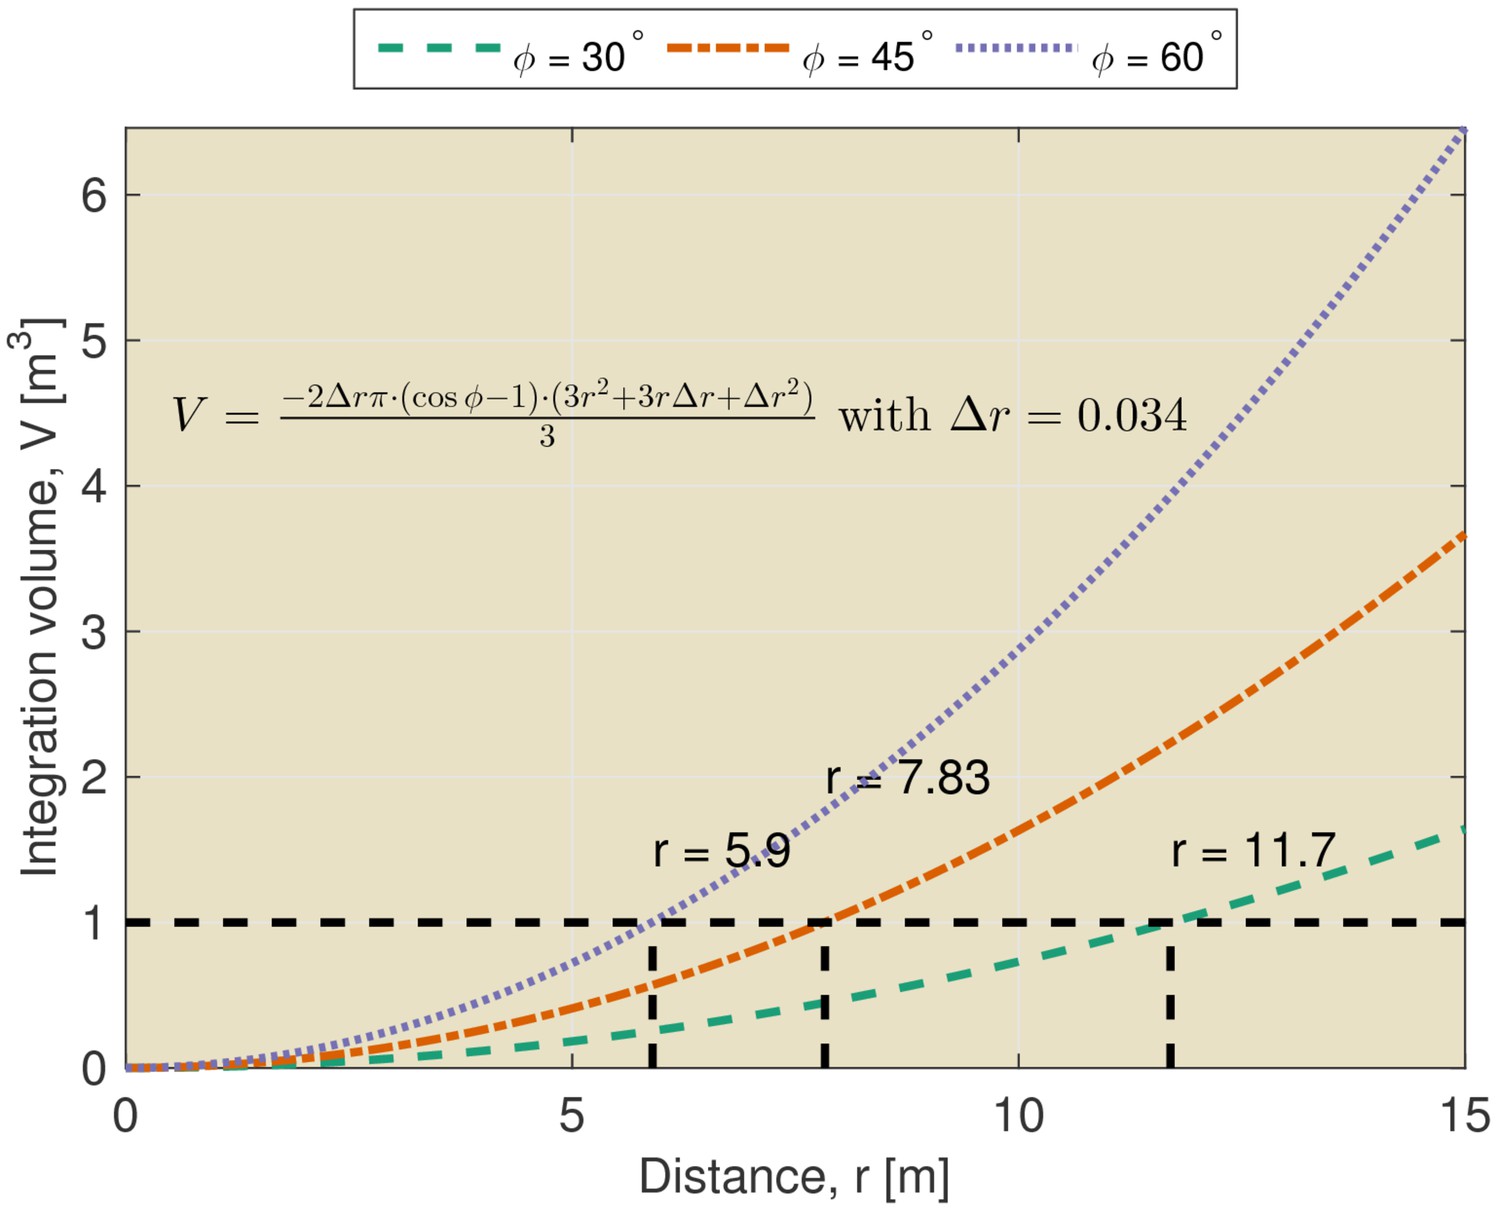
Integration volume as a function of distance.
The integration volume calculated for different beamwidths as a function of distance from the bat. The integration volume is approximated as a section of a spherical shell. The opening angle of the section is given by the beam width . The thickness of the shell is given by the temporal integration of the sonar system. The temporal integration of the sonar system has been assumed to be 200 μs yielding an integration distance (i.e. thickness of the shell) of about 0.034 m.
Figure 2
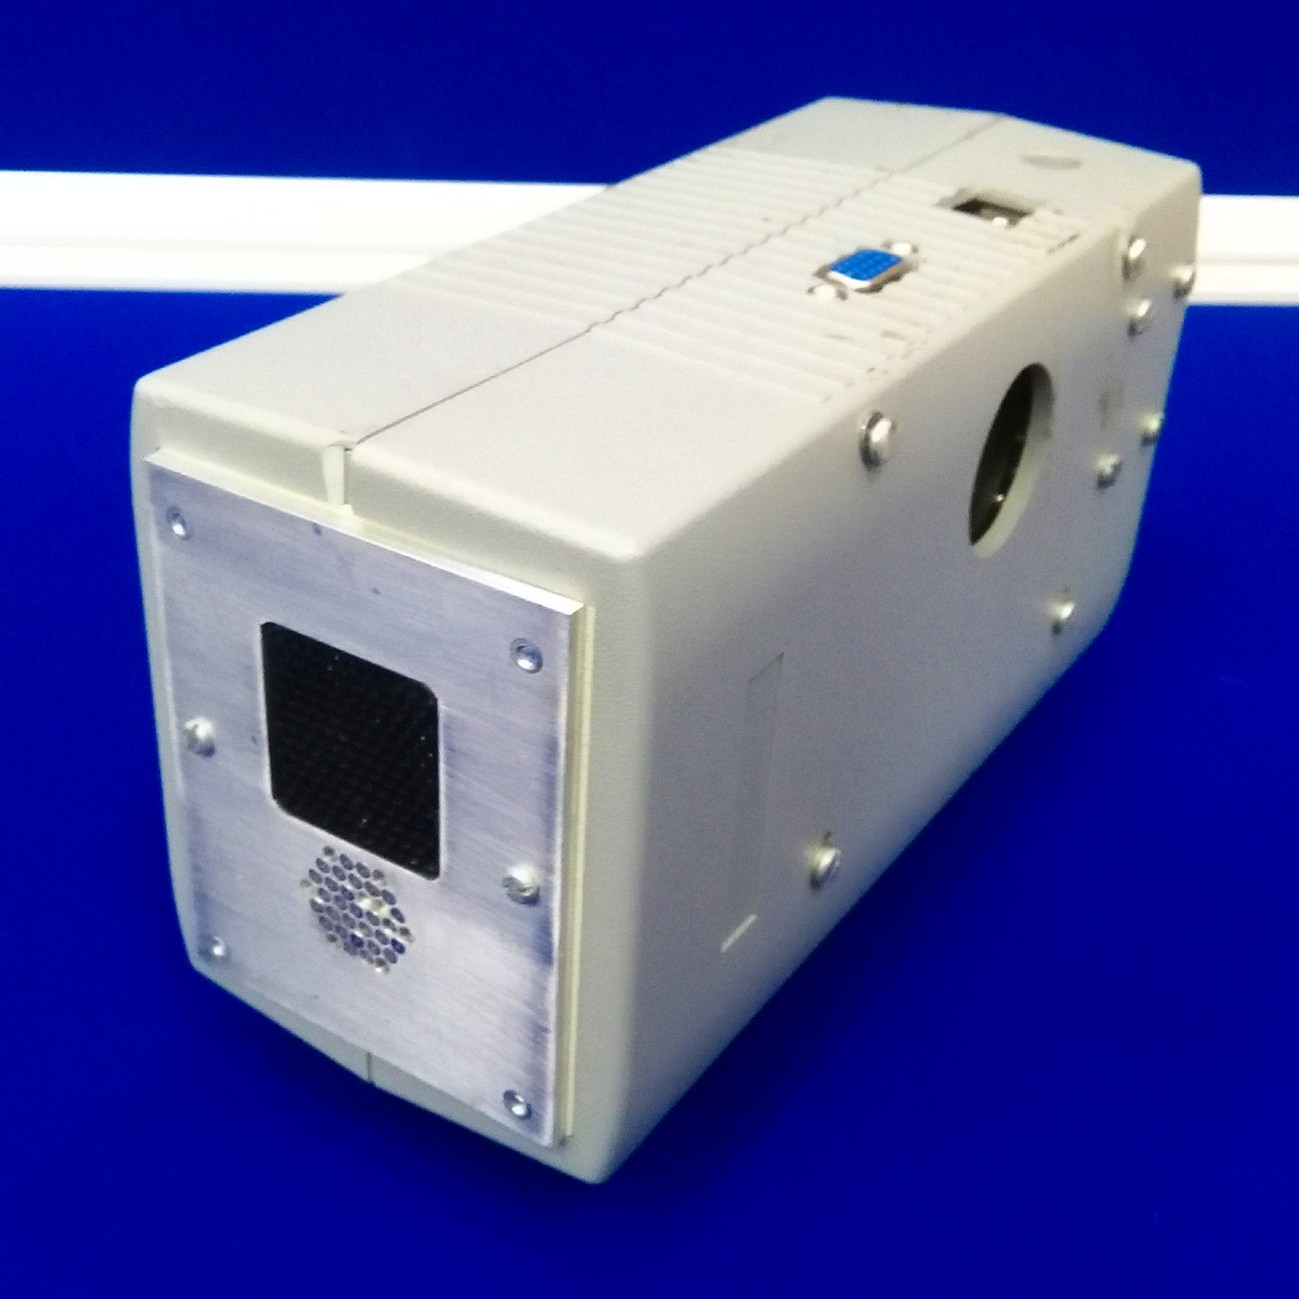
Close up of the ensonification device.
At the front of the device the array of 31 microphones (Knowles FG series) can be seen. The Senscomp Series 7000 ultrasonic speaker is located above this array.
Figure 3
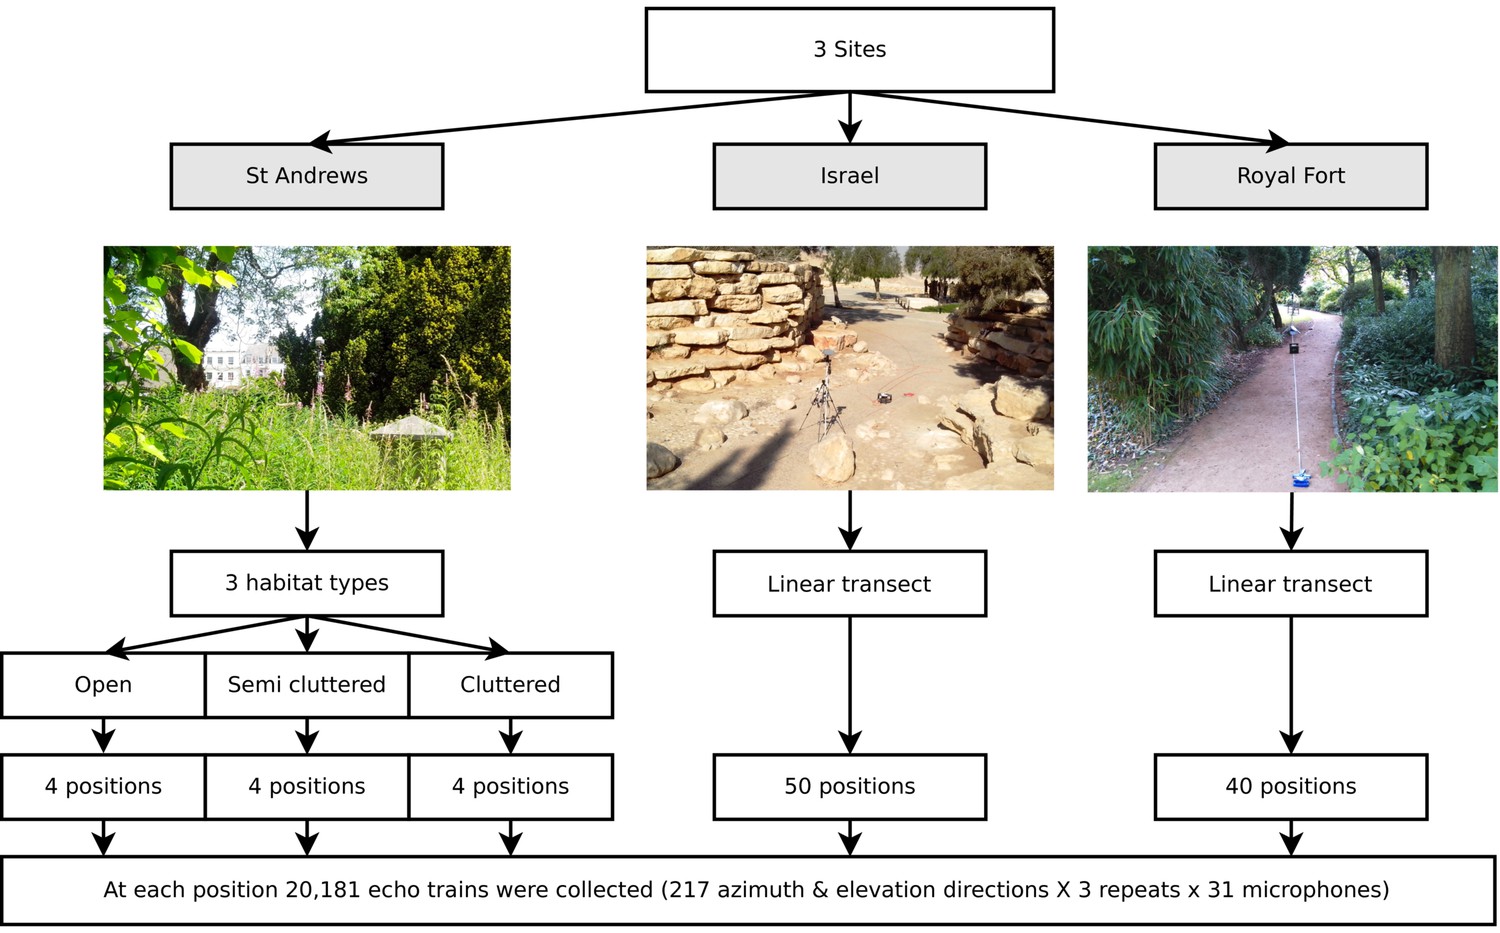
Illustration of the data collected.
Three data sets were collected (corresponding with three field sites). First, at St Andrews park, the ensonification device was placed at twelve different locations in habitats with varying levels of clutter (Open, Semi Cluttered, and Cluttered). At each of the twelve positions, echo trains from 217 azimuth and elevation directions were collected. At the Israel and Royal Fort Gardens site, the ensonification device was placed at 50 and 40 positions along a straight line, respectively. At each of the 50 (spaced 20 cm apart) or 40 (spaced 25 cm apart) positions, echo trains from 217 azimuth and elevation directions were collected.
Figure 4
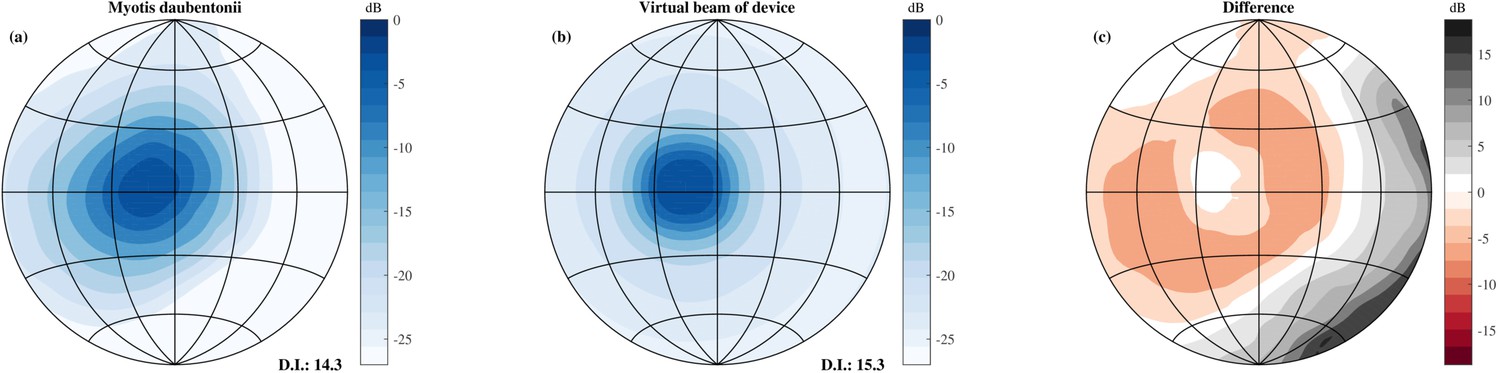
Comparison of the simulated beamwidth and the virtual beamwidth of the ensonification device.
Comparison of the simulated beamwidth of M. daubentonii (panel a) (Surlykke et al., 2009) across the range 40 to 100 kHz and the virtual beamwidth of the ensonification device after averaging across 3 neighbouring directions based on the theoretical emission pattern of the Senscomp emitter (panel b). Panel c depicts the difference between the beamwidth of M. daubentonii and the virtual beam. Note that for the beam of M. daubentonii the emission and hearing directionality were combined.
Figure 5
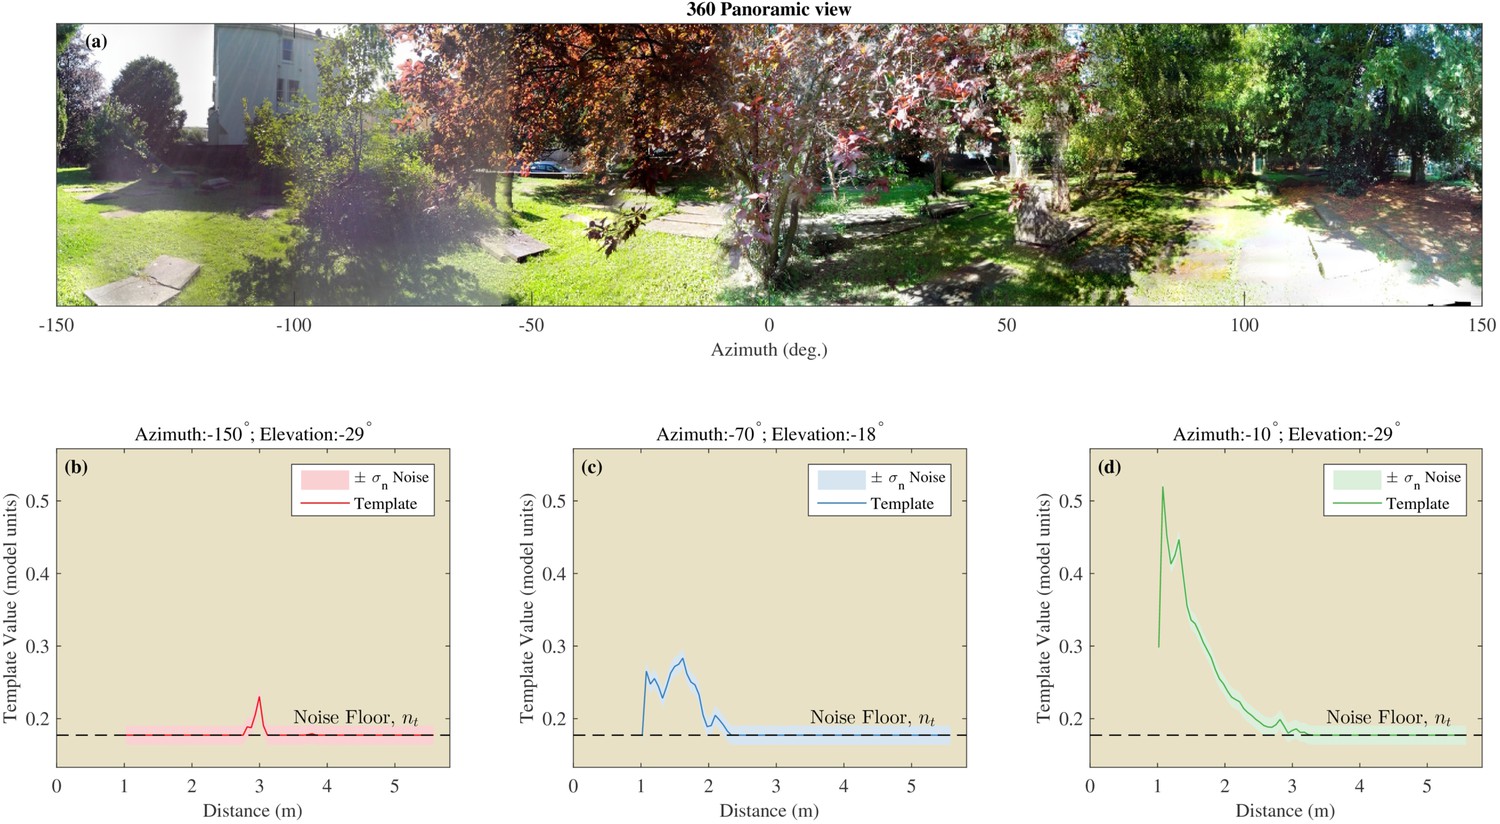
Example of the templates using the St Andrews data.
(a) 360 degree panoramic view of one of the locations in St Andrews park which was ensonified (Semi cluttered 3). (b–d) Examples of three templates from three different azimuth and elevation directions. The assumed noise on the templates is shown by the shaded areas.
Figure 6

Template classification performance.
Left: Panoramic views taken at the 12 positions. Middle: Probability () for each of the 12 St Andrews positions as a function of azimuth and elevation. right: Angular error () for each of the 12 St Andrews positions as a function of azimuth and elevation.
Figure 7
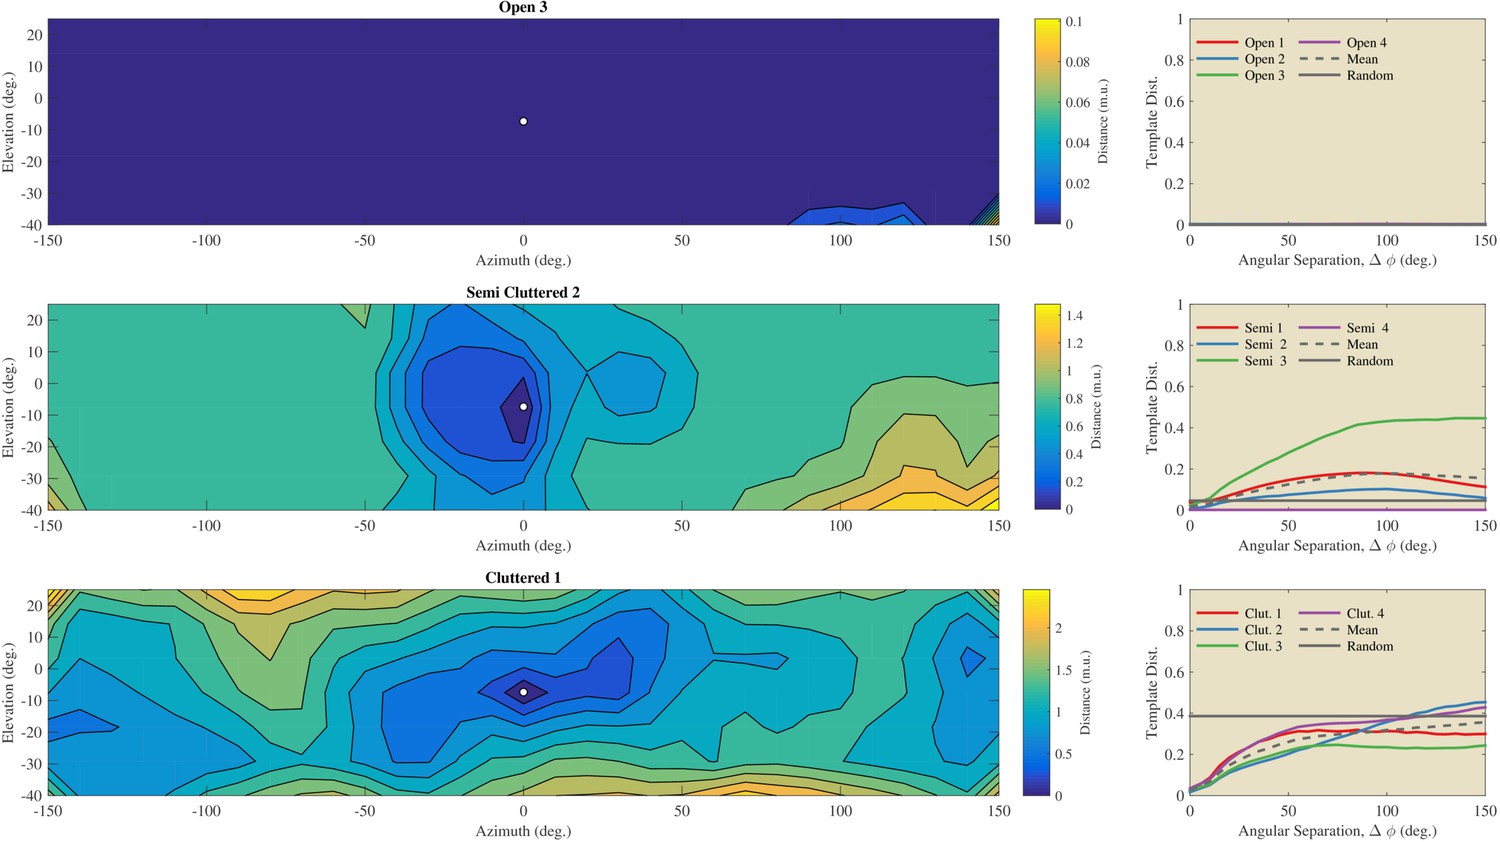
Evaluation of the angular catchment areas using the St Andrews data.
Left column: Examples of the dissimilarity between a reference template and the other 216 directions for an Open, a Semi Cluttered, and a Cluttered habitat. The direction of the reference template (azimuth 0° & elevation −7°) is indicated by a white dot. The dissimilarity between the reference template and all other templates is depicted by the contour plots. Right: the average dissimilarity between templates as a function of the angular separation in each of the Open, Semi cluttered and Cluttered habitats. The mean dissimilarity as a function of the angular separation for each of the three types of habitats is indicated by a black dotted line. A horizontal black line indicates the average dissimilarity between randomly selected templates. The dissimilarity between unrelated templates serves as a baseline against which the dissimilarity as a function of angular separation can be compared (Greif and Siemers, 2010).
Figure 8
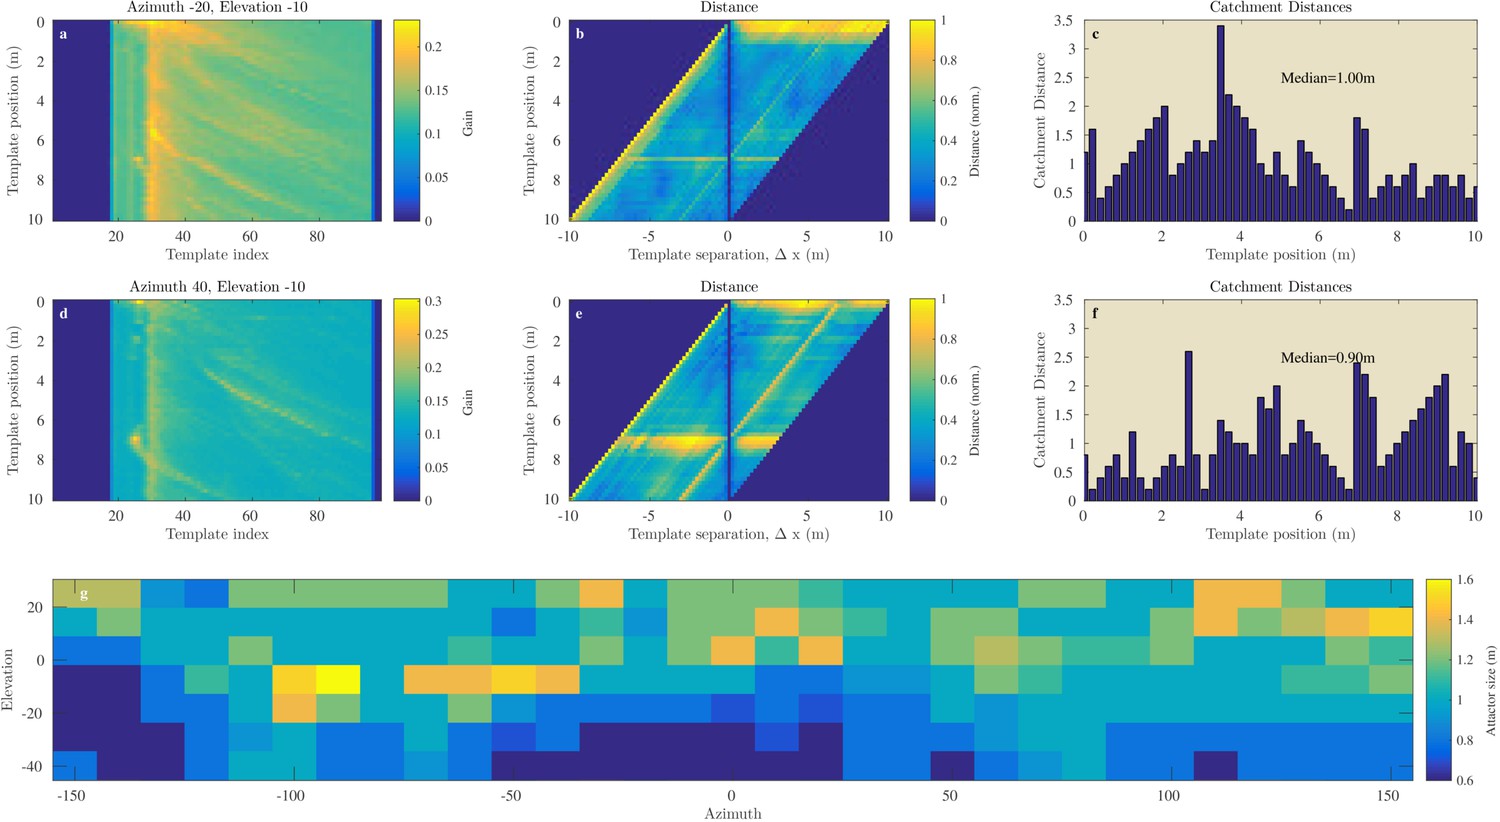
Catchment distance for the Israel site.
Illustration of the process of finding the catchment distance for the Israel data and the median catchment distance as a function of direction. (a) Templates for ensonification direction −20° azimuth and −10° elevation as a function of the position (i.e. 0 to 10 m). (b) The pairwise dissimilarity between the templates in panel (a) as a function of the displacement between the templates. (c) For each position, a linear catchment distance was calculated. This was done by finding the template separation interval across which the distance increased monotonically. (c) The resulting catchment distances for the data in panel (b). (d), (e), (f) similar but for azimuth direction 40° and 10° elevation. (g) The median catchment distance for each of the 217 azimuth and elevation directions.
Figure 9
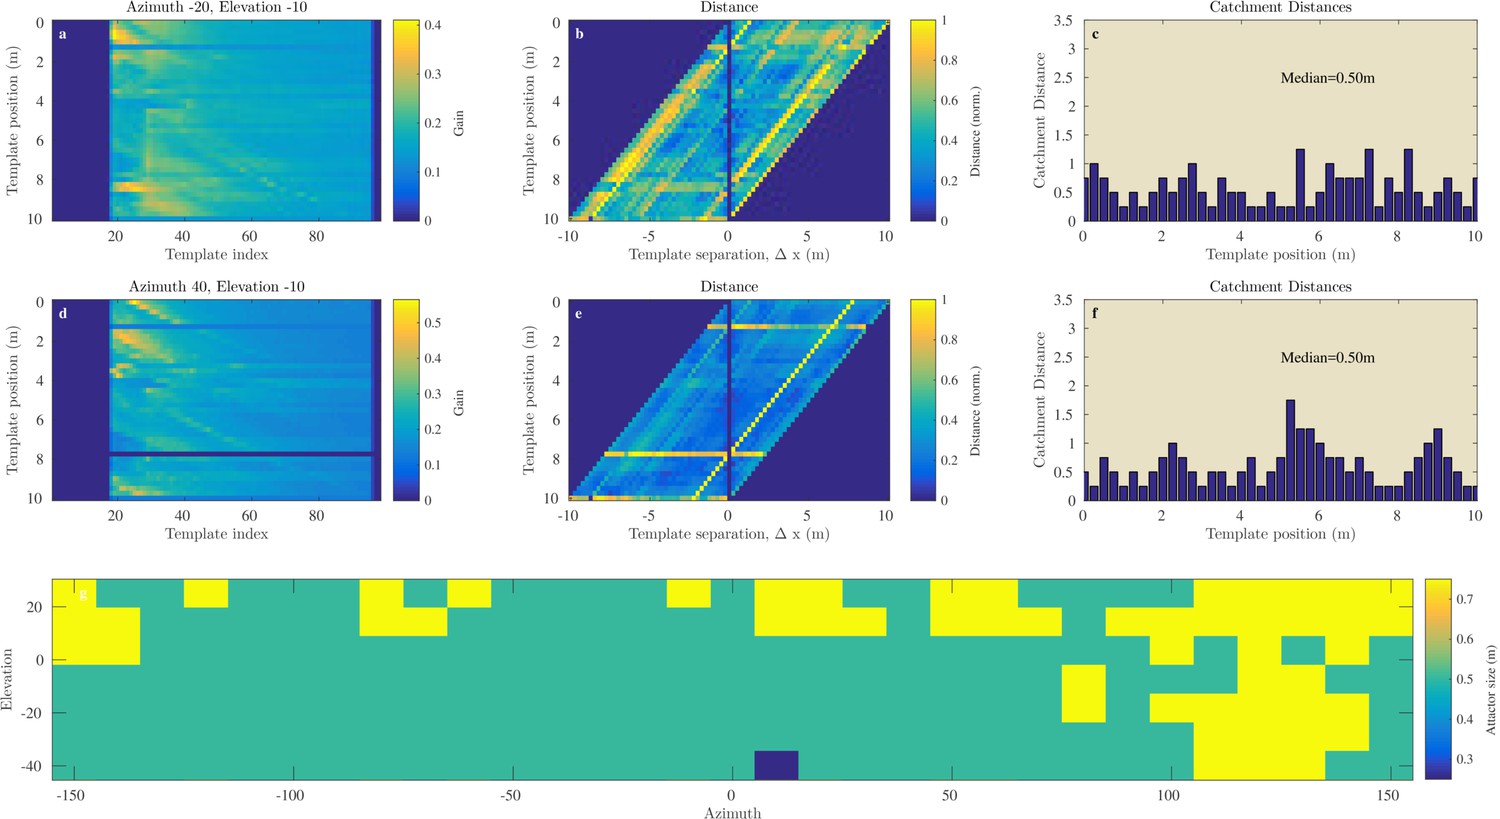
Catchment distance for the Royal Fort Gardens data.
Similar as Figure 8 but for the Royal Fort Gardens data set.
Figure 10
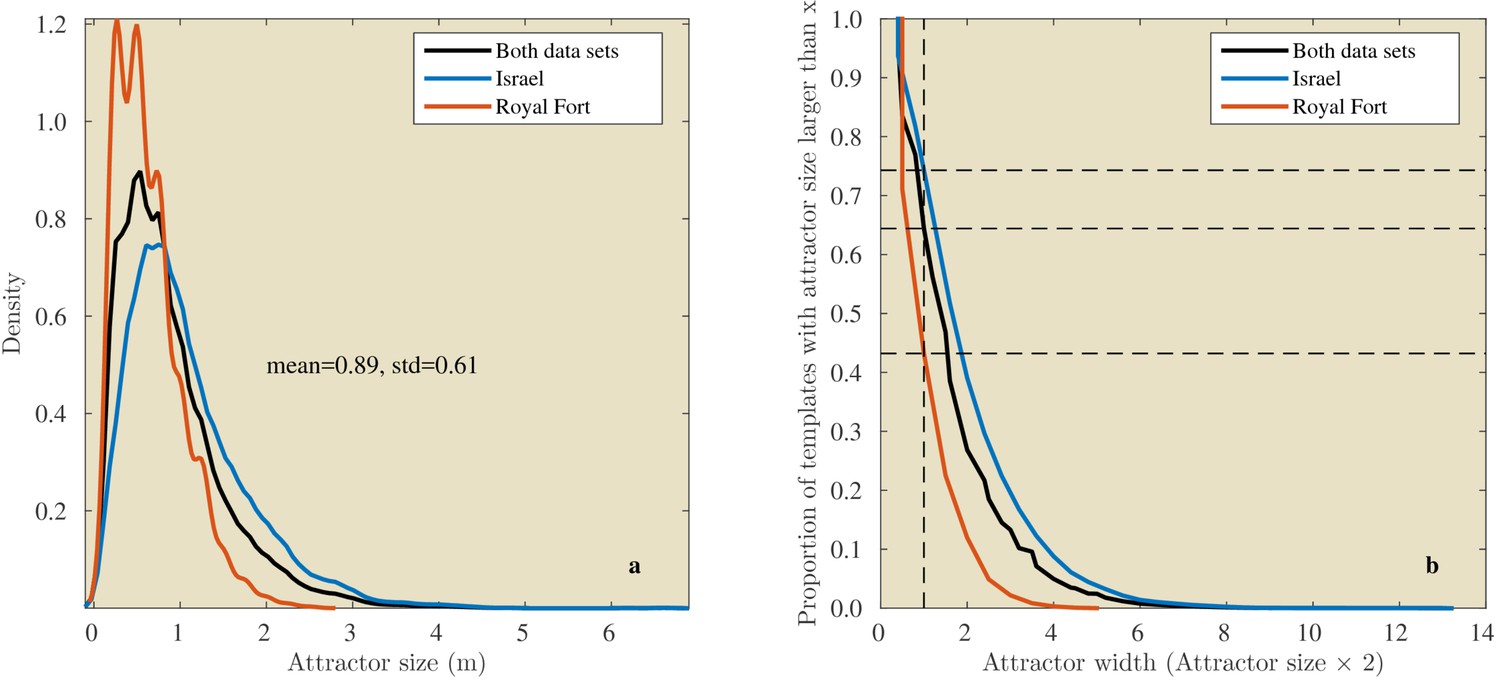
Linear attractor distances.
(a) Histogram of the linear attractor sizes for both the Israel and Royal Fort Gardens data set. (b) Plot showing the proportion of templates with a linear attractor distance larger than a given value.
Figure 11

Probability of correct classificaiton as a function of the linear catchement distance.
2D histograms of the probability of correct classification versus the linear catchment distances for the templates in the Israel (left) and Royal fort (right) data sets.
Figure 12
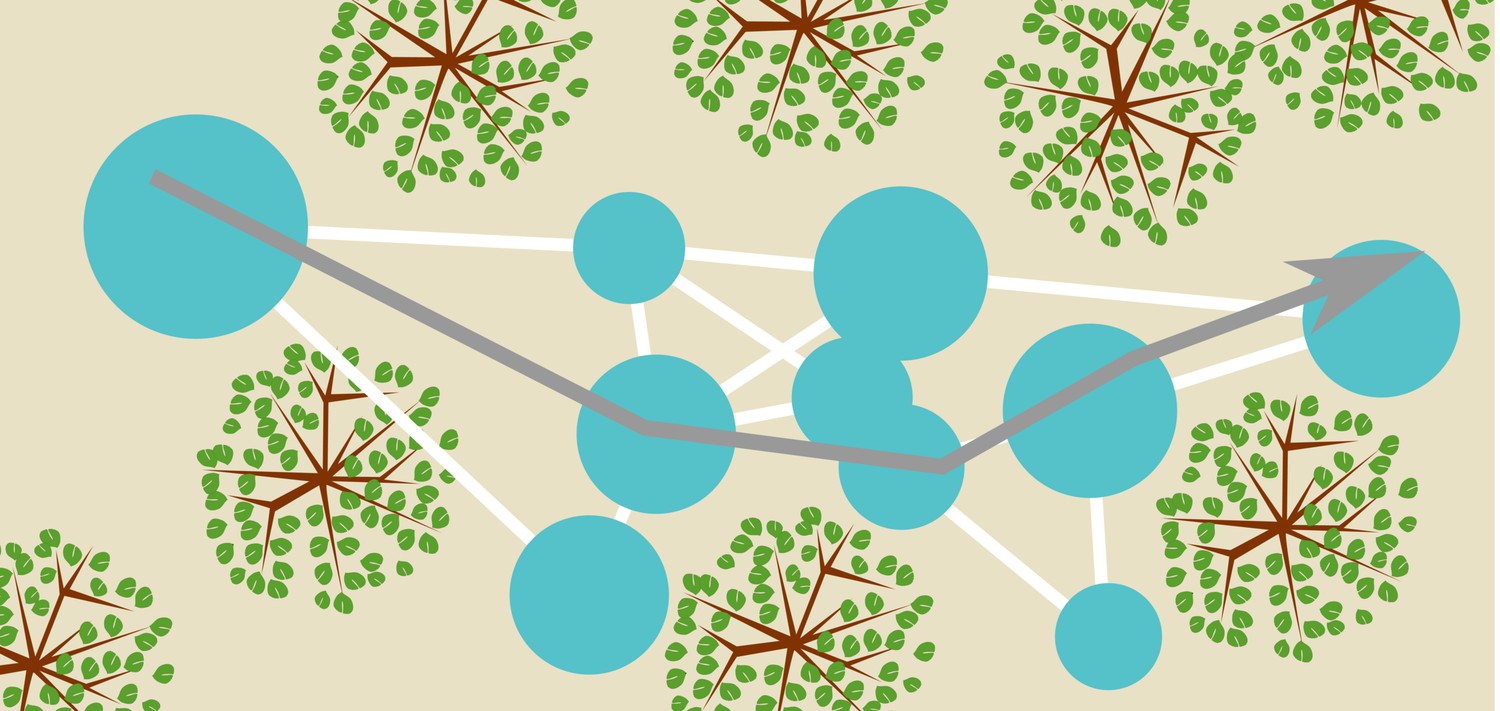
Conceptual sketch of an environment and a map.
The blue circles represent templates and their catchment areas. The white lines between them represent directions and distances between template locations inferred from odometry, thereby forming a graph-like representation of space. A bat navigating this map (represented by the grey arrow) can use the templates as sign posts at which it reorients itself. Having recognized a particular template (catchment area) the bat knows where it is and approximately which direction it should fly in to arrive at any of the other template locations. Notice that the (catchment areas of) the templates do not cover the complete space.
Download links
A two-part list of links to download the article, or parts of the article, in various formats.
Downloads (link to download the article as PDF)
Open citations (links to open the citations from this article in various online reference manager services)
Cite this article (links to download the citations from this article in formats compatible with various reference manager tools)
Place recognition using batlike sonar
eLife 5:e14188.
https://doi.org/10.7554/eLife.14188


