An extrasynaptic GABAergic signal modulates a pattern of forward movement in Caenorhabditis elegans
- Harvard University, United States
- University of Science and Technology of China, China
- University of Toronto, Canada
Figures
Figure 1 with 1 supplement

The GABAergic motor neurons RME restrict head bending amplitude and exhibit intracellular calcium signals that are correlated with head bending.
(A) Schematics showing the innervation of anterior muscles by RME and SMD motor neurons. Note that the cell bodies (denoted by circles) of RMEV (V) and SMDD (D) are located on the ventral side and the cell bodies (denoted by circles) of RMED (D) and SMDV (V) are located on the dorsal side. RME and SMD neurons innervate the muscles that are contralateral to the position of their cell bodies. Arrows denote excitatory synapses and blunt-ended lines denote inhibitory synapses. Only the muscles and motor neurons on the left-side are shown (White et al., 1986). A, anterior; D, dorsal. (B) Schematics showing the method of quantifying the amplitude of head bending, which is defined as the standard deviation of head curvature along the first ~18% of the worm body over the time lapse of measurement (Materials and methods). (C) Ablating all 4 RME neurons or the dorsal and ventral RME (RMED/V) increases head bending amplitude, but ablating only the left and right RME neurons (RMEL/R) does not have an effect. (D) The unc-25(e156) and unc-47(e307) mutant animals exhibit increased head bending amplitude. For C and D, One-way ANOVA with Dunnett’s post-test, **p<0.01, *p<0.05, n ≥ 9 animals each, bar graphs indicate mean values and error bars indicate SEM. (E, F) Schematics showing the positions of RMED/V cell bodies and processes (E) and single frames of GCaMP3 fluorescence signals in RMED and RMEV (F). A, anterior; D, dorsal; a.u., arbitrary unit. (G) Sample GCaMP3 signals in RMEV and RMED neurons and the corresponding head bending in the same animal. Figure 1—figure supplement 1. shows samples of cross-correlation between the calcium transients in the cell body and neurite of a RMED neuron or a RMEV neuron. (H) Cross-correlation between RMEV or RMED GCaMP3 signal and head bending. Faint lines indicate the results from individual animals and the thick lines indicate mean value.
Figure 1—figure supplement 1
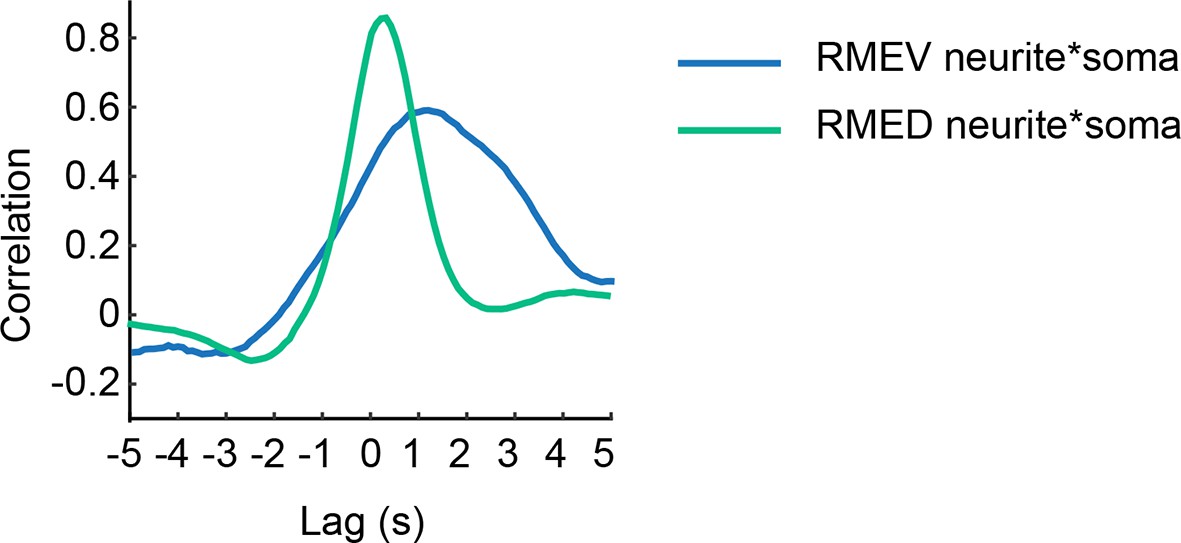
Sample cross-correlation between the GCaMP3 signal in the cell body and the GCaMP3 signal in the neurite of a RMEV or a RMED neuron.
https://doi.org/10.7554/eLife.14197.003
Figure 2 with 2 supplements
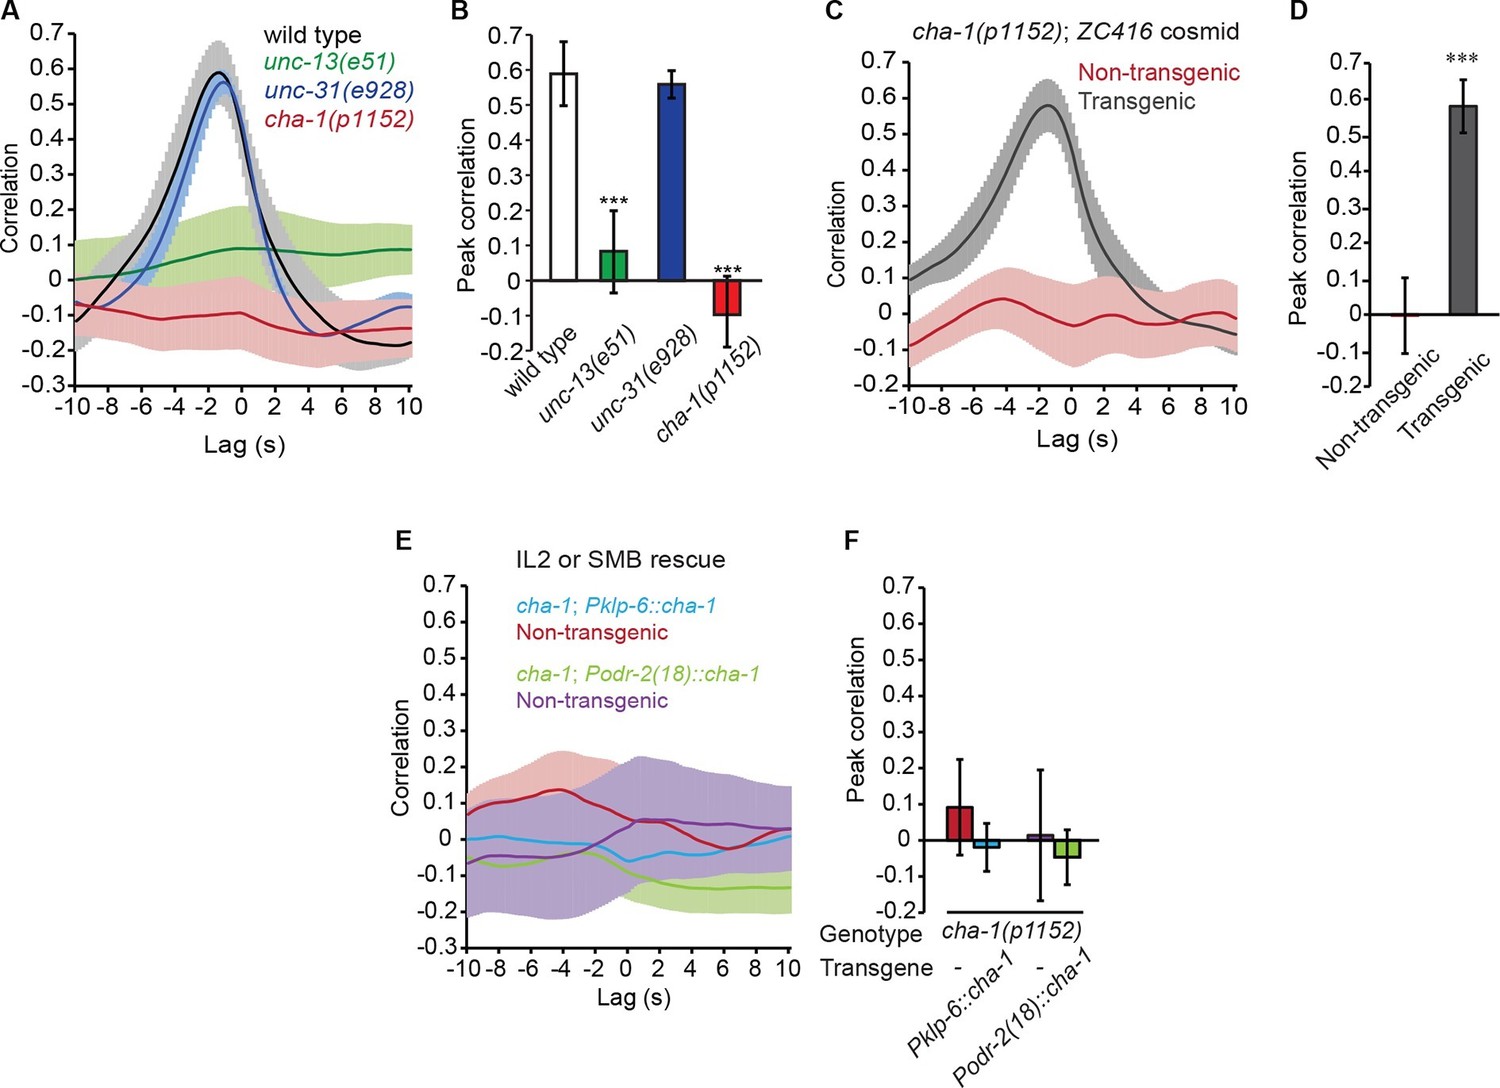
The head bending-correlated calcium activity of RME depends on cholinergic neurotransmission.
(A, B) The unc-13(e51) and cha-1(p1152) mutant animals are significantly defective in cross-correlation (A) and peak correlation (B) between RME calcium activity and head bending; but the unc-31(e928) mutant animals are normal. Figure 2—figure supplement 1 and 2 show the representative GCaMP3 signals in RME neurons in immobilized and in unc-54(e1092) animals, respectively. (C, D) The defects of cha-1(p1152) mutant animals in cross-correlation (C) and peak correlation (D) between RME calcium activity and head bending is rescued by cosmid ZC416 that contains the coding region of cha-1 genomic DNA. (E, F) Expressing a wild-type cha-1 cDNA in IL2 (Pklp-6::cha-1) or SMB (Podr-2(18)::cha-1) does not rescue the correlation (E) or peak correlation (F) between RME calcium activity and head bending in cha-1(p1152) mutant animals. For B, one-way ANOVA with Dunnett’s post-test. For D and F, transgenic animals are compared with nontransgenic siblings with student’s t-test. For all, ***p<0.001, n ≥ 7 animals each, Mean ± SEM, peak correlation is the highest correlation within the 1 s time window centered on the peak correlation of the wild-type control in A and B; while similar effects were usually observed in more than one transgenic lines, the effect of each transgene is reported with the results from one transgenic line.
Figure 2—figure supplement 1
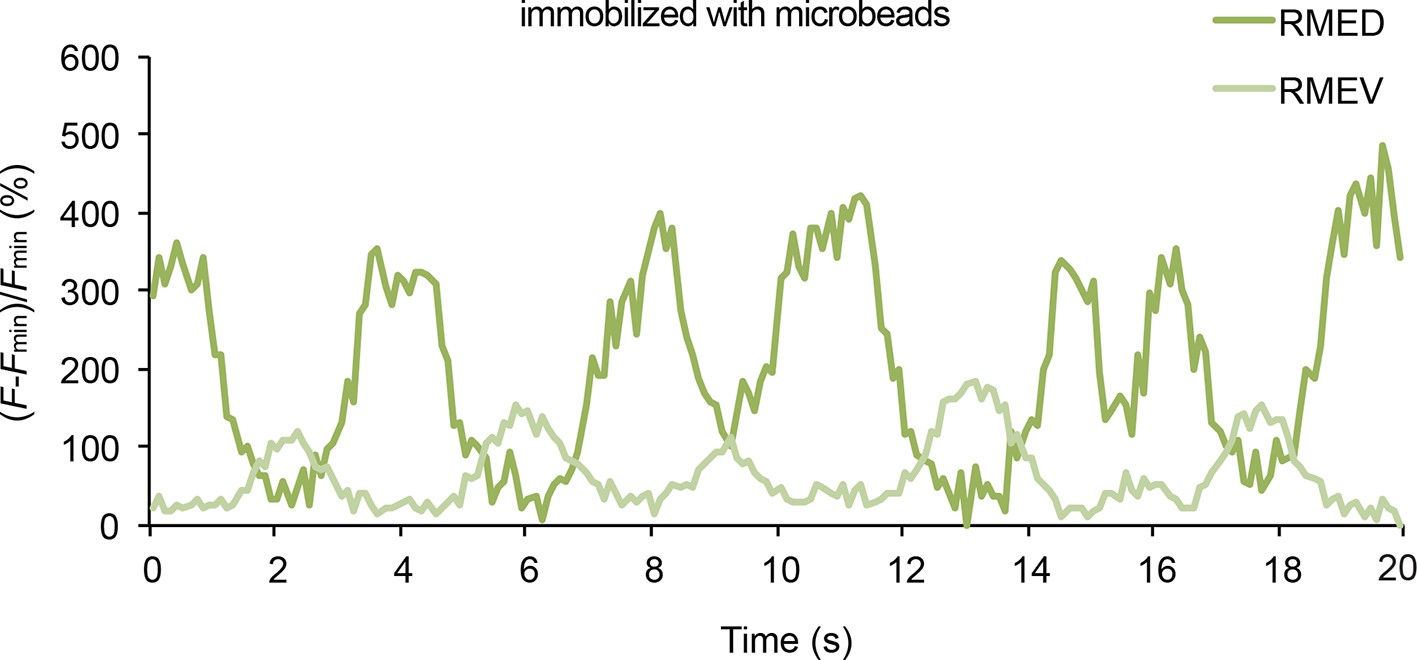
Representative traces for GCaMP3 signal in RME in animals immobilized with microbeads (Materials and methods).
Fmin indicates the minimal fluorescence intensity during the recording.
Figure 2—figure supplement 2
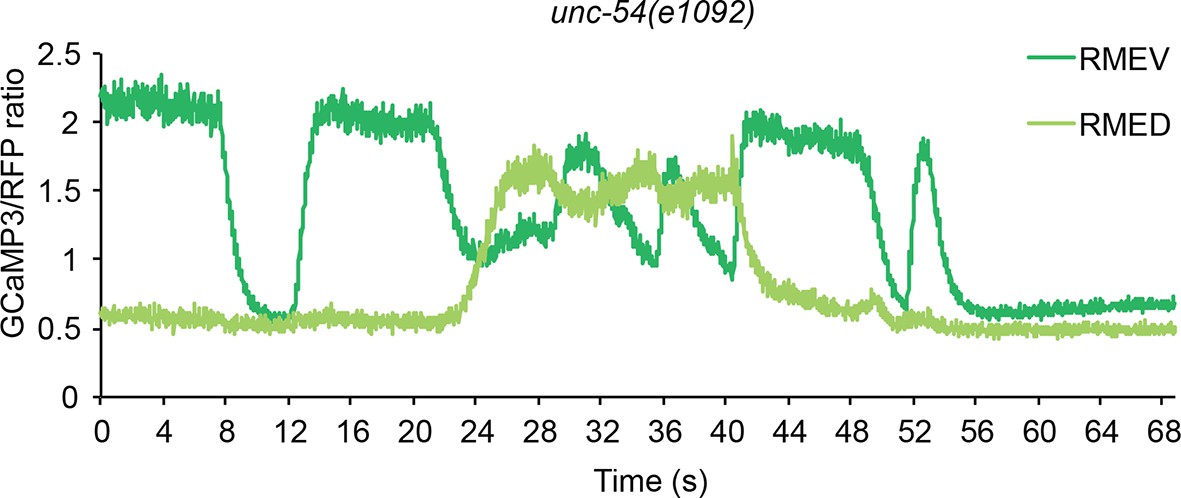
Representative traces for calcium signal in RME in unc-54(e1092) mutant animals.
The calcium signal is presented as the ratio between the GCaMP3 signal and the RFP signal expressed in RME.
Figure 3

The head bending-correlated calcium activity of RME is regulated by the cholinergic signal from SMD.
(A) Volumetric view of a 3-D image stack from an animal expressing Pglr-1::GCaMP3 and Punc-25::GCaMP3. A, anterior; D, dorsal; circles highlight cell bodies; a.u., arbitrary unit. (B) Sample traces of calcium dynamics in SMDD and RMED during head movement. (C) Cross-correlation between calcium activities in SMDD and RMED. n = 6 animals, faint lines indicate the results from individual animals, the thick line indicates the mean value and the shade indicates SEM. (D, E) Expressing a wild-type cha-1 cDNA in SMD neurons (Pglr-1::cha-1 or Plad-2::cha-1) rescues the head-bending correlated calcium activity in RME. Peak correlation is the highest correlation within the 1 s time window centered on the peak correlation of the wild-type control in Figure 2A and B. (F, G) Ablating SMD in the transgenic animals that express the wild-type cha-1 cDNA with the glr-1 promoter in the cha-1(p1152) mutant animals abolishes the rescuing effect on the head-bending correlated calcium activity in RME. Peak correlation is the highest correlation within the 1 s time window centered on the peak correlation of the mock control. For (E and G), transgenic animals are compared with non-transgenic siblings with student’s t-test. For (D-G) ***p<0.001, **p<0.01, n ≥ 5 animals each, Mean ± SEM; while similar effects were usually observed in more than one transgenic lines, the effect of each transgene is reported with the results from one transgenic line.
Figure 4 with 1 supplement
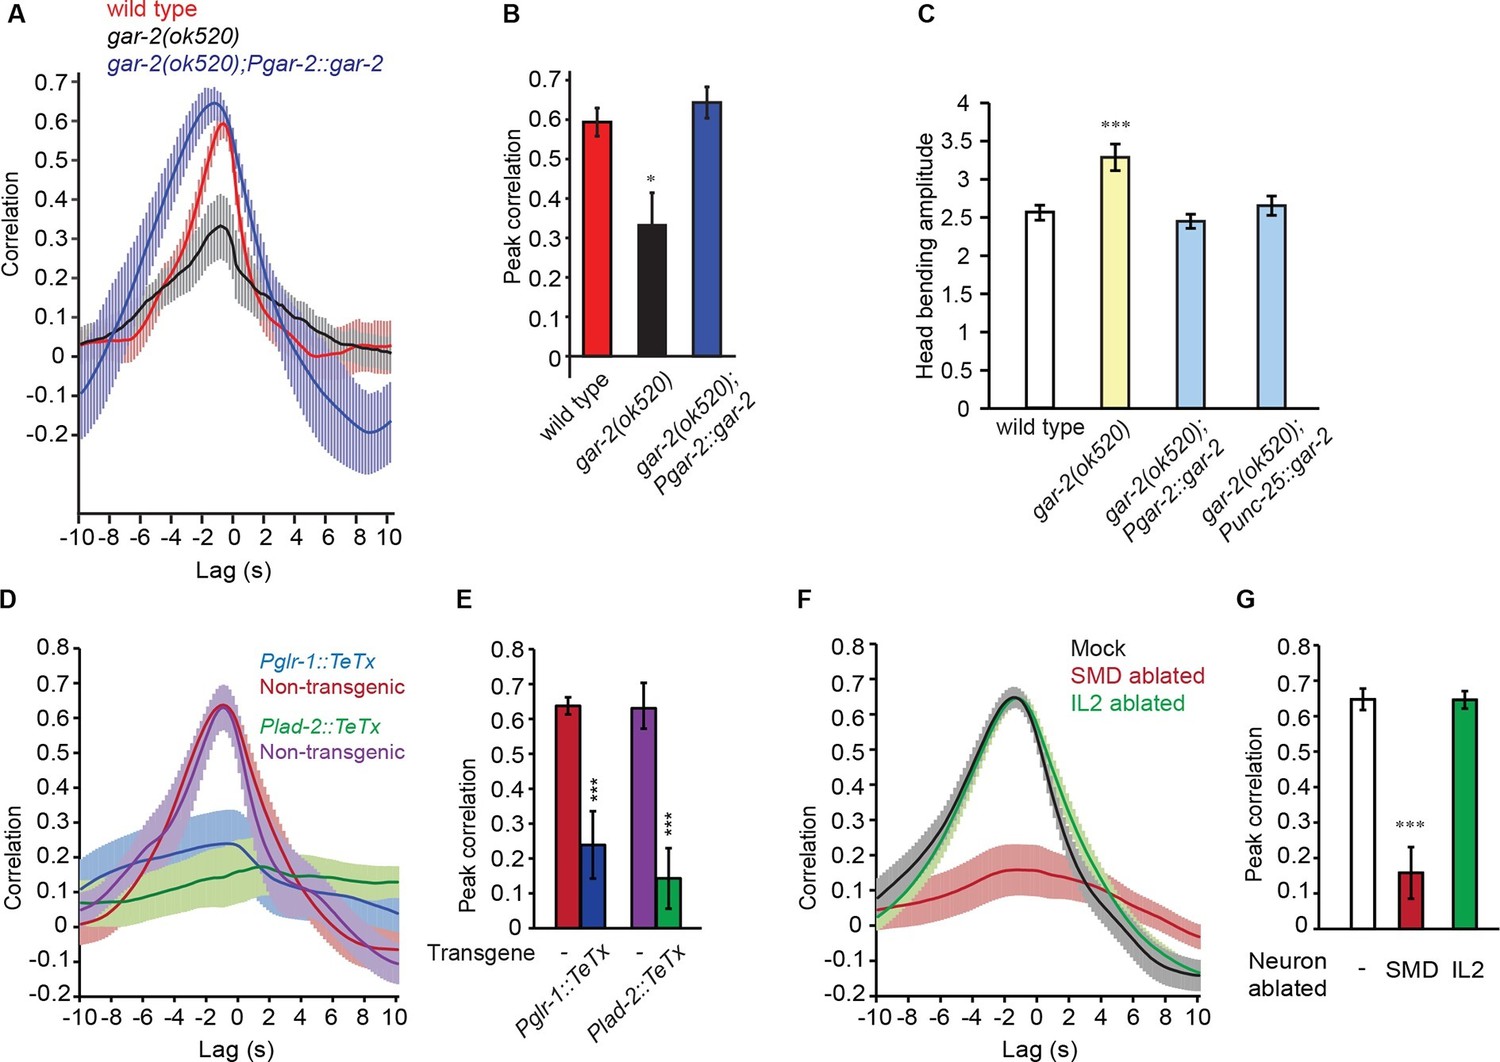
SMD regulate the activity of RME via the metabotropic acetylcholine receptor GAR-2.
(A, B) The gar-2(ok520) mutants are defective in cross-correlation (A) and peak correlation (B) between RME calcium activity and head bending, and the expression of Pgar-2::gar-2 rescues the defects. Transgenic animals and mutants are compared with wild type with ANONA with Dunnett’s post-test. Peak correlation is the highest correlation within the 1 s time window centered on the peak correlation of the wild-type control. n ≥ 7 animals each. (C) A deletion mutation in gar-2(ok520) significantly increases the amplitude of head bending and the defect is rescued by expressing a wild-type gar-2 cDNA with the gar-2 promoter (Pgar-2::gar-2) or with the unc-25 promoter that is selectively expressed in GABAergic neurons (Punc-25::gar-2). gar-2(ok520) mutants and transgenic animals are compared with wild type with ANONA with Dunnett’s post-test, n ≥ 9 animals each. (D, E) Blocking neurotransmission from SMD neurons (Pglr-1::TeTx or Plad-2::TeTx) generates significant defects in cross-correlation (D) and peak correlation (E) between RME calcium activity and head bending. Transgenic animals are compared with non-transgenic siblings with student’s t-test, n ≥ 9 animals each. Figure 4—figure supplement 1 shows that blocking neurotransmission from IL2 (Pklp-6::TeTx) or SMB (Podr-2(18)::TeTx) neurons or both does not alter the cross-correlation or peak correlation between RME calcium activity and head movement. (F, G) Ablating SMD, but not IL2, generates significant defects in cross-correlation (F) and peak correlation (G) between RME calcium activity and head bending. Ablated animals and mock controls are compared with student’s t-test, n ≥ 9 animals each. For E and G, peak correlation is the highest correlation within the 1 s time window centered on the peak correlation of the wild-type control in Figure 2A and B. For all, ***p<0.001, *p<0.05, Mean ± SEM; while similar effects were usually observed in more than one transgenic lines, the effect of each transgene is reported with the results from one transgenic line.
Figure 4—figure supplement 1
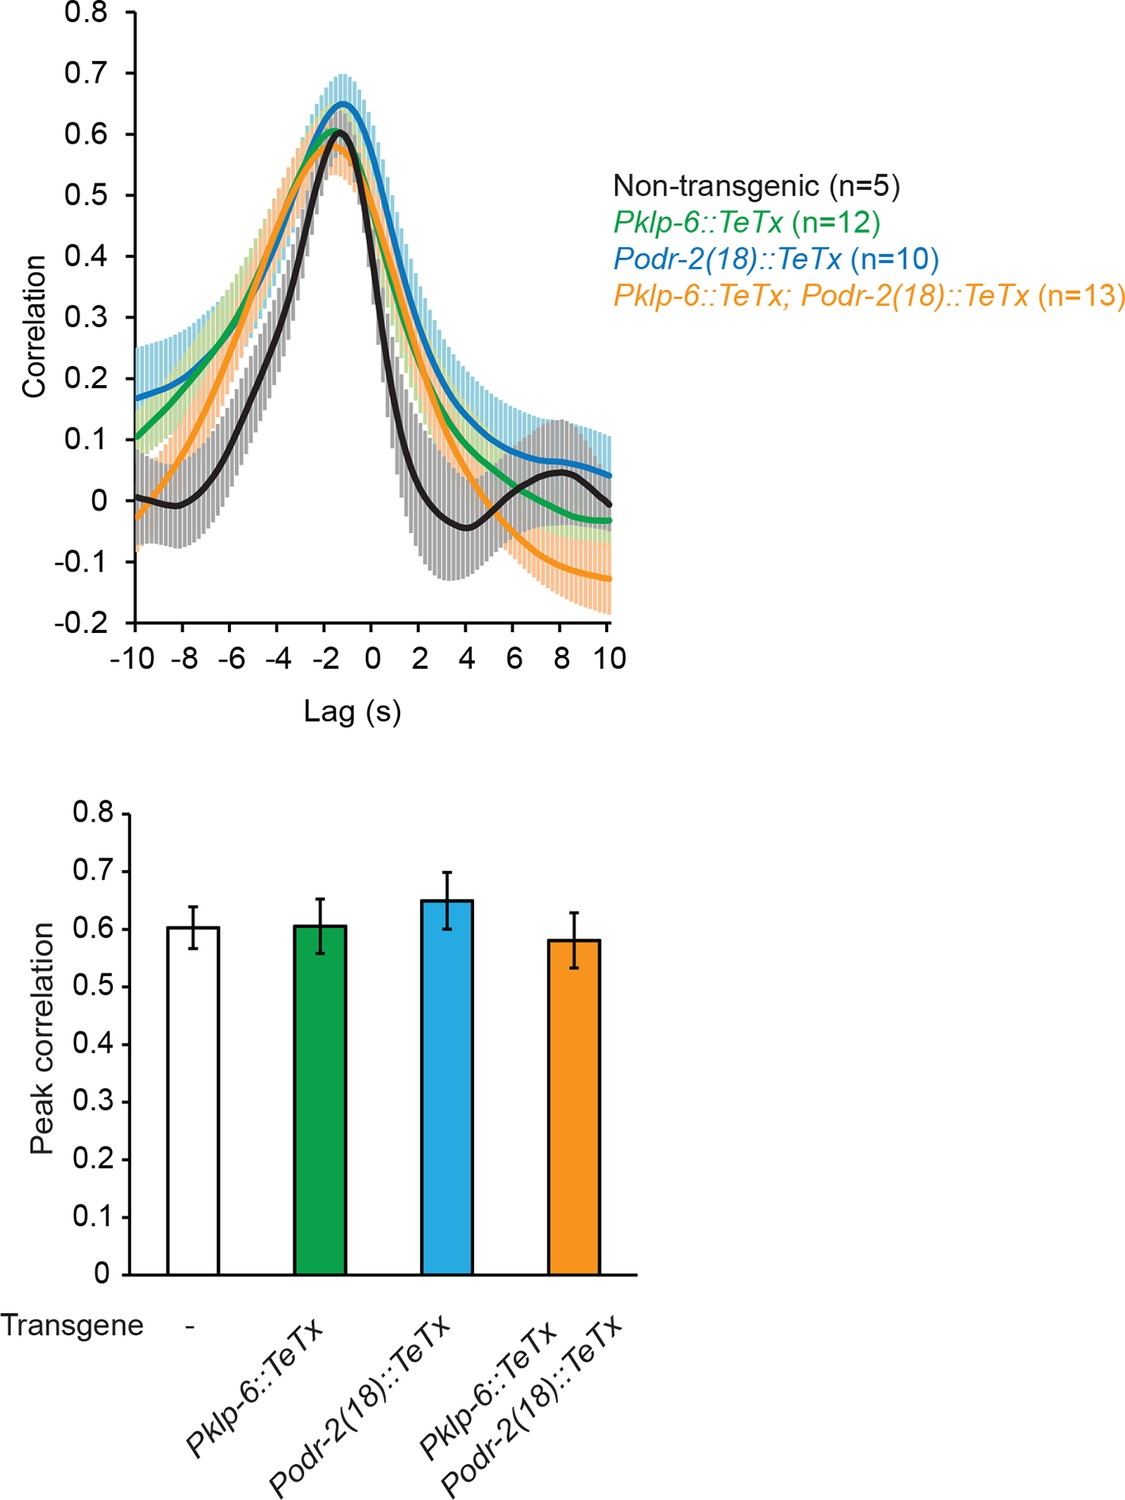
Blocking neurotransmission from IL2 neurons (Pklp-6::TeTx) or SMB neurons (Podr-2(18)::TeTx) or both does not significantly alter the cross-correlation or peak correlation between RME calcium activity and head movement.
One-way ANOVA with Dunnett’s post-test; transgenic animals are compared with the non-transgenic controls, Mean ± SEM. Peak correlation is the highest correlation within the 1 s time window centered on the peak correlation of the wild-type control in Figure 2B.
Figure 5 with 1 supplement
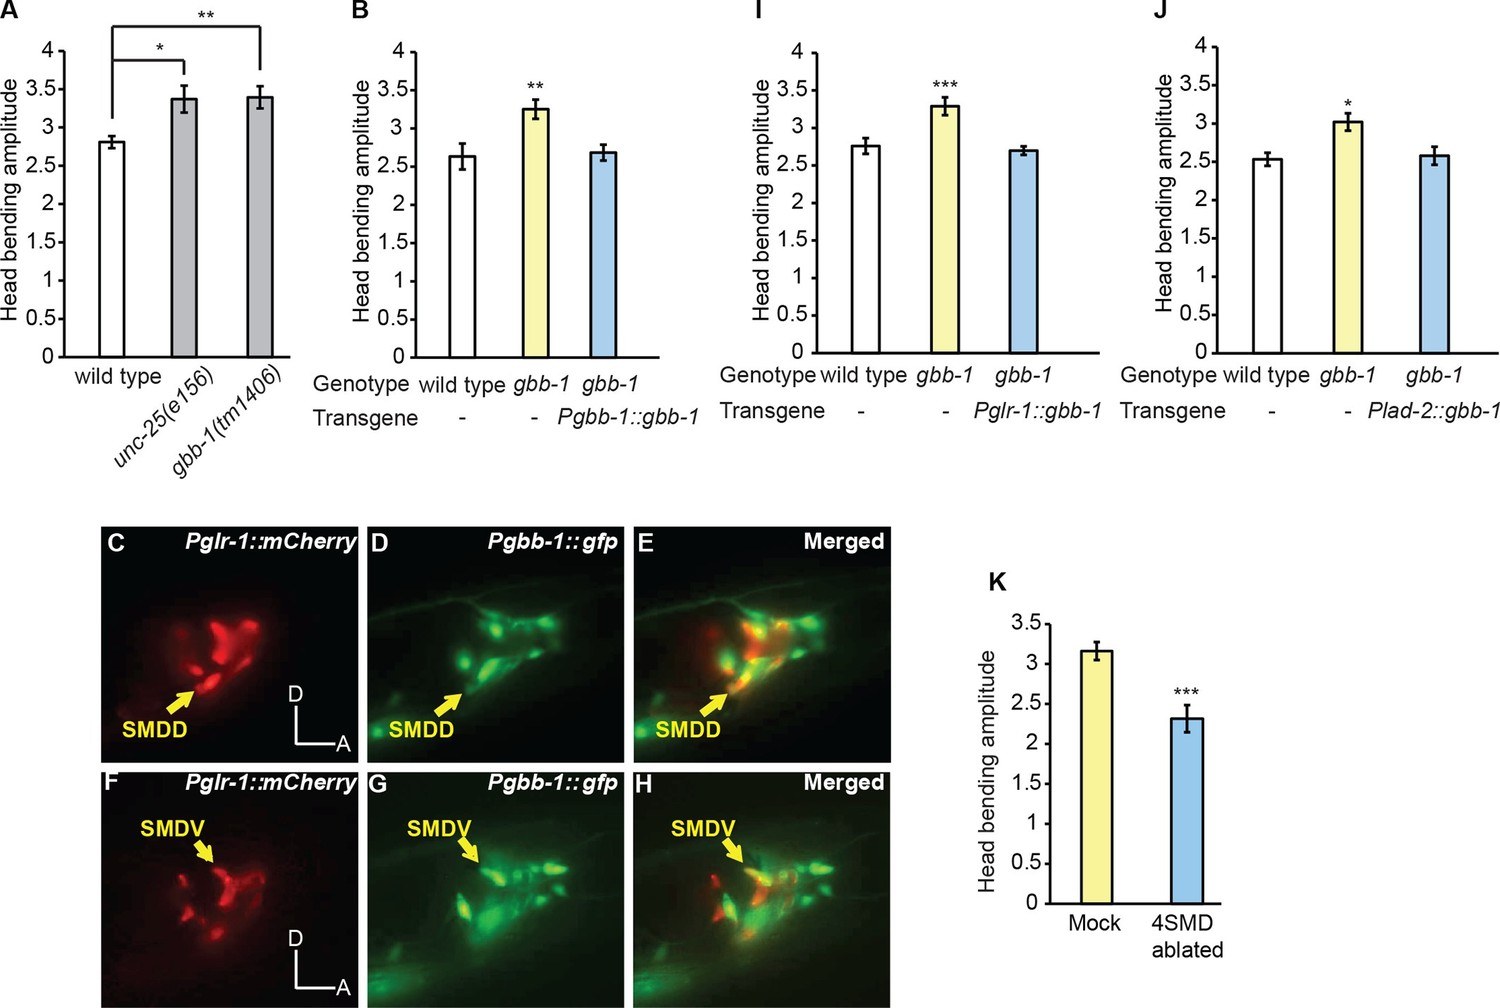
The GABAB receptor subunit GBB-1 acts in the SMD neurons to limit head bending amplitude.
(A) The gbb-1(tm1406) mutants show an increased head bending amplitude similar to unc-25(e156) mutants. One-way ANOVA with Dunnett’s post-test, n ≥ 8 animals each. Figure 5—figure supplement 1. shows the increased head bending amplitude in the gbb-1;gbb-2 double mutant animals in comparison with wild type. (B) The exaggerated head bending in gbb-1(tm1406) mutants is rescued by expressing a wild-type gbb-1 cDNA under the endogenous promoter of gbb-1. Transgenic animals (n=16 animals) are compared with non-transgenic siblings (n=15 animals) with student’s t-test. (C-H) gbb-1 is expressed in head neurons, including SMD. Pglr-1::mCherry is expressed in SMD and several other neurons. The expression of Pgbb-1::gfp and Pglr-1::mCherry overlap in SMD. Arrows denote SMDD or SMDV neuron. A, anterior; D, dorsal. (I, J) The exaggerated head bending in gbb-1(tm1406) mutants is rescued by expressing a wild-type gbb-1 cDNA under the glr-1 promoter (I) or the lad-2 promoter (J). Transgenic animals (n ≥ 14 animals) are compared with non-transgenic siblings (n ≥ 13 animals) with student’s t-test. (K), SMD-ablated animals show decreased head bending amplitude. Neuron-ablated animals are compared with mock controls with Student’s t-test, n = 9 animals each. For all, ***p<0.001, **p<0.01, *p<0.05, Mean ± SEM; while similar effects were usually observed in more than one transgenic lines, the effect of each transgene is reported with the results from one transgenic line.
Figure 5—figure supplement 1
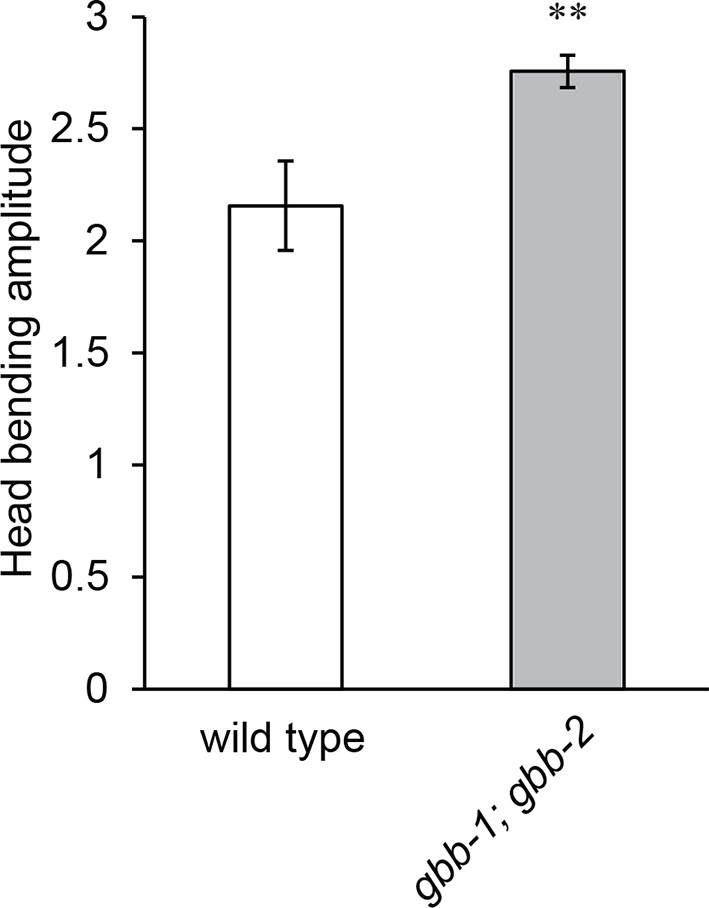
The gbb-1(tm1406);gbb-2(tm1165) double mutant animals show increased head bending amplitude, similarly as the gbb-1(tm1406) single mutants.
Student’s t-test, **p<0.01, n ≥ 9 animals, Mean ± SEM.
Figure 6

The activity of the RME GABAergic neurons is causally linked with head bending amplitude.
(A) Video images of locomotory behavior before and during green light illumination in a worm that expresses Arch in RME neurons. The illuminated head region is highlighted in green. (B) Video images of locomotory behavior before and during blue light illumination in a worm that expresses ChR2 in RME neurons. The illuminated head region is highlighted in blue. (C) Quantification of optogenetic effects on head bending amplitude in wild type, mutants and transgenic animals that express a wild-type gbb-1 cDNA under the glr-1 or lad-2 promoters in unc-49;gbb-1 background. Sample size: RME::Arch in wild type (n = 25 trials, 15 animals), RME::ChR2 in wild type (n = 98 trials, >20 animals), RME::ChR2 in unc-25(e156) (n = 63 trials, 14 animals), RME::ChR2 in unc-49(e407) (n = 85 trials, 17 animals), RME::ChR2 in gbb-1(tm1406) (n = 81 trials, 11 animals), RME::ChR2 in unc-49(e407); gbb-1(tm1406) (n = 83 trials, 6 animals), RME::ChR2 in unc-49(e407); gbb-1(tm1406); Pglr-1::gbb-1 (n = 51 trials, 7 animals), RME::ChR2 in unc-49(e407); gbb-1(tm1406); Plad-2::gbb-1(n = 90 trials, 9 animals). For each trial, we calculate the change of the head bending amplitude during and before optogenetic manipulation of RME with sign test for zero median, ***p<0.0001; unc-49(e407) and gbb-1(tm1406) are compared with Mann-Whitney U test, ###p<0.0001; Mean ± SEM; while similar effects were usually observed in more than one transgenic lines, the effect of each transgene is reported with the results from one transgenic line. (D) A schematic model for the mechanisms underlying RME GABAergic neuromodulatory function.
Figure 7 with 1 supplement
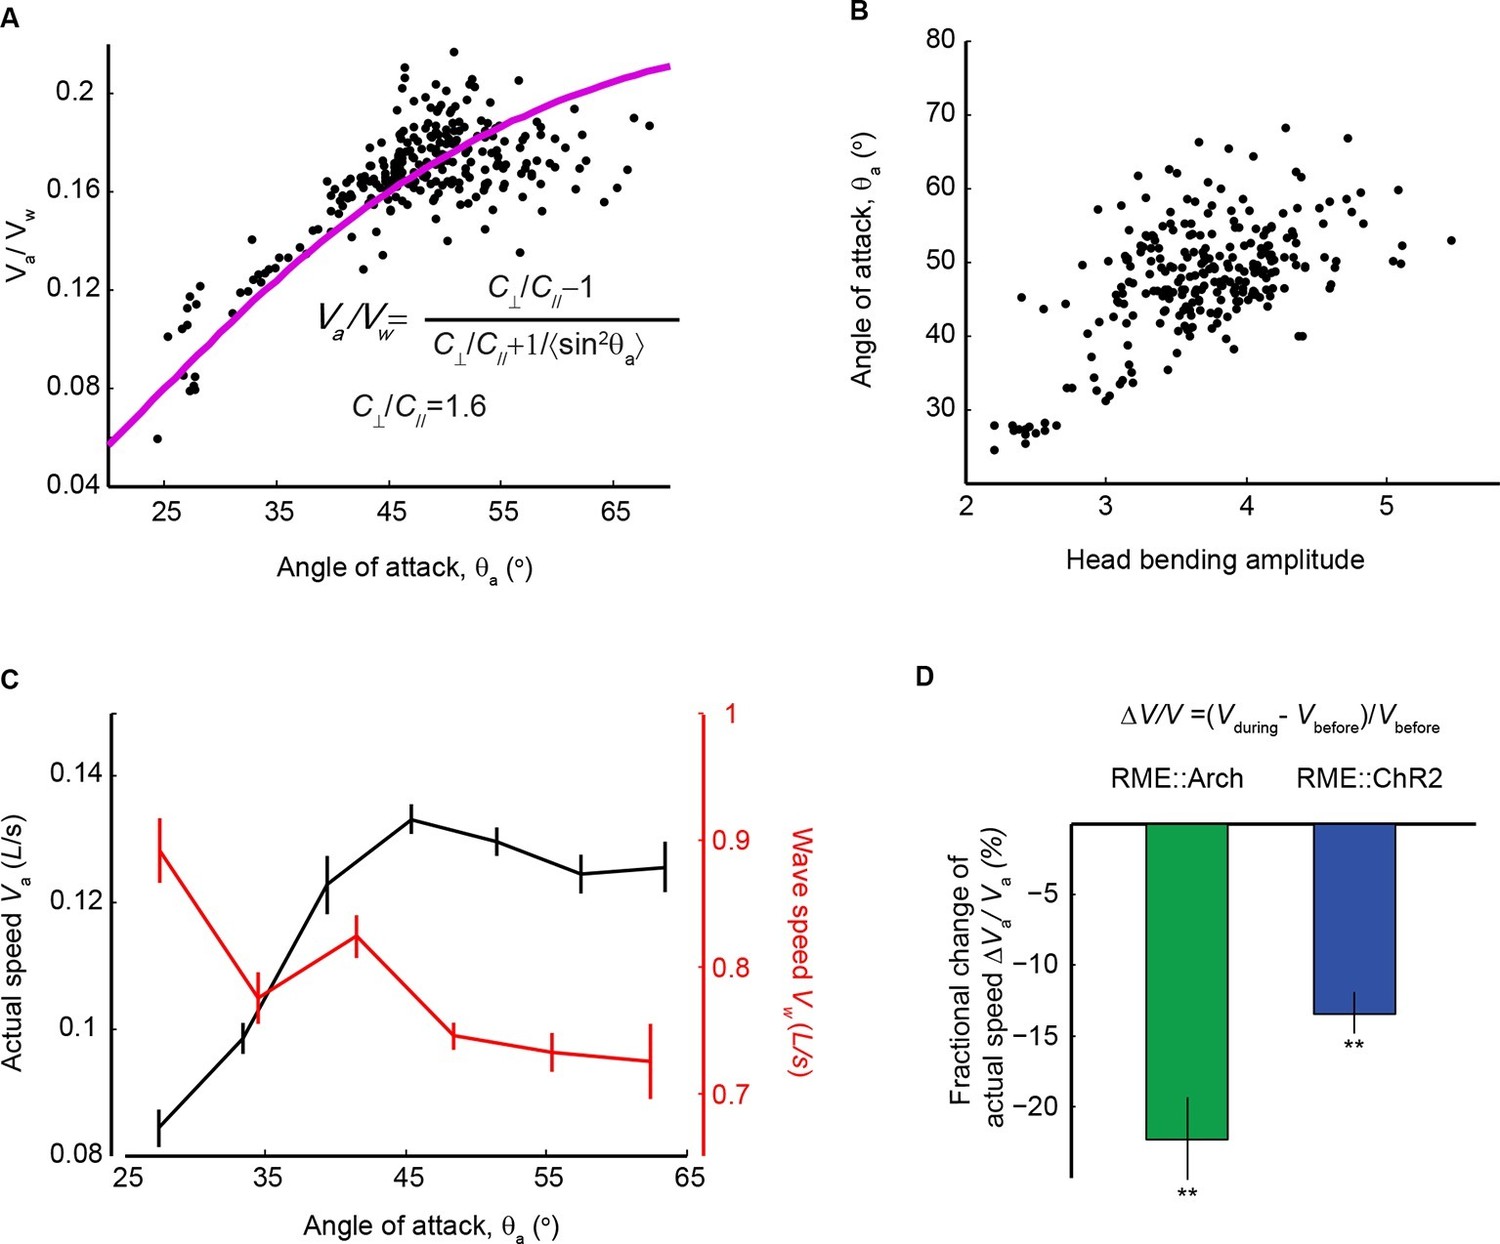
Head bending amplitude correlates with speed and efficiency of forward locomotion.
(A) The angle of attack, measured as the average angle of a body segment with respect to the direction of forward movement, is plotted with the propulsion efficiency, defined as the ratio of the actual speed Va to the propagation speed of undulation in the reference frame of a worm Vw. Magenta line is the theoretical fit according to the equation in the figure panel. In this equation, C⊥ is the drag coefficient perpendicular to the worm body and C// is the drag coefficient longitudinal to the worm body. C⊥/C// = 1.6, which is the best fitting parameter, agrees well with theoretical calculation in the small angle limit (Gray and Hancock, 1955). (B) The angle of attack increases with head bending amplitude (R = 0.57, p<10-23, Pearson’s correlation). In A and B, each dot represents one measurement from a bout (~10–15 s) of forward locomotion of wild-type animals in 25% dextran (w/v). (C) By binning the velocity data in (A) and (B), we replot the actual speed (Va, black) and propagation wave speed of forward locomotion (Vw, red) with the angle of attack. Propagation wave speed decreases with the angle of attack (R = −0.32, p<10–6, Pearson’s correlation). At around 45 degree angle, the actual speed of locomotion is maximized. For A-C, n > 100 bouts of forward movements from 10 worms, Mean ± SEM. (D) Optogenetic inhibition of RME neurons that express Arch (n = 11 trials, 5 animals) or optogenetic activation of RME neurons that express channelrhodopsin ChR2 (n = 34 trials, 5 animals) significantly reduces the actual speed of forward locomotion. For each trial, we calculate the change of actual speed of locomotion during and before optogenetic manipulation of RME, **p<0.01, Wilcoxon signed rank test for zero median, Mean ± SEM. Figure 7—figure supplement 1 shows the effects of optogenetic manipulation of RME activity on propulsion efficiency.
Figure 7—figure supplement 1
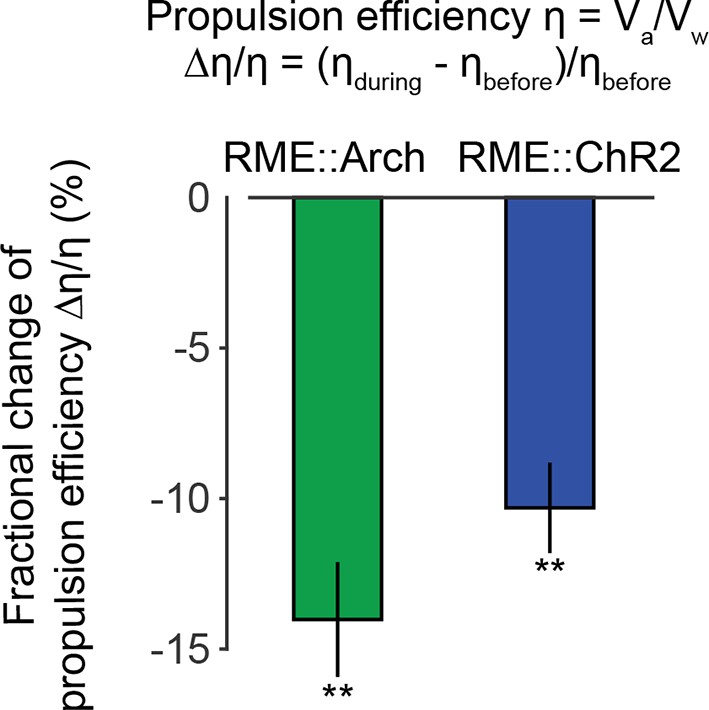
Optogenetically inhibiting RME neurons that express Arch (n = 11 trials, 5 animals) or optogenetically activating RME neurons that express channelrhodopsin ChR2 (n = 34 trials, 5 animals) significantly reduces propulsion efficiency of forward locomotion.
Here we measured the fractional change of the propulsion efficiency during bouts of forward locomotion before optogenetic stimulation and during optogenetic stimulation. Wilcoxon signed rank test for zero median, **p<0.01, Mean ± SEM.
Videos
Video 1
Undulatory movement of a wild-type animal on an agar plate.
The animal moves forward towards right at the beginning of the movie.
Video 2
Undulatory movement of a wild-type animal with RMED and RMEV ablated.
The animal in the movie moves towards lower-left corner on an agar plate at the beginning of the movie. Note the increased head bending amplitude in the animal.
Video 3
Undulatory movement of an unc-25(e156) mutant animal on an agar plate.
The animal moves towards upper-right corner at the beginning of the movie and then turns to move towards lower-right corner. Note the increased head bending amplitude in the unc-25 mutant animal.
Video 4
A representative movie for GCaMP3 signals in RMED and RMEV neurons and the head bending in a transgenic animal that expresses GCaMP3 in GABAergic neurons.
Both REMD and RMEV extend processes to the contralateral side to innervate the contralateral muscles and these processes run side-by-side. Because the calcium signals in the cell body and process of a RME neuron correlate with each other, we measure the calcium dynamics in the cell bodies of RME in this study. The RMED or RMEV cell body is highlighted with a circle in the movie. Please refer to Figure 1E and F for the positions of RME cell bodies and processes. Ventral to the right and anterior to the upper-right corner.
Video 5
A representative movie for GCaMP3 signals in RMED/V and SMDD/V neurons and the head bending in a transgenic animal that expresses GCaMP3 in a few neurons, including RMED/V and SMDD/V.
RMED and SMDD neurons are labeled with circles on the movie frames. Dorsal to the right and anterior to the low-right corner.
Video 6
Undulatory movement of a gar-2(ok520) mutant animal on an agar plate.
The animal moves down at the beginning of the movie and then turns to move towards left and then up. Note the increased head bending amplitude in the gar-2 mutant animal.
Video 7
Undulatory movement of a wild-type animal with SMDD and SMDV neurons ablated.
The animal moves towards lower-right corner on an agar plate at the beginning of the movie. Note the reduced head bending amplitude in the animal.
Video 8
Inhibiting RME activity with a green laser in a transgenic animal that expresses Arch in RME increases head bending amplitude.
Laser illumination starts when a 'DLP ON' signal appears in upper-left corner and stops when the 'DLP ON' signal disappears. The worm is stimulated for one cycle of illumination, 5 s–34 s. The animal’s head is pointing down at the beginning of the movie. The head region illuminated with green laser is highlighted with a shade. The tail is highlighted with a circle. The animal moves in 25%-30% (w/v) dextran sandwiched between two glass slides (Materials and methods).
Video 9
Activating RME activity with a blue laser in a transgenic animal that expresses ChR2 in RME decreases head bending amplitude.
The RIS neuron is ablated in the animal. Laser illumination starts when a 'DLP ON' signal appears in the upper-left corner and stops when the 'DLP ON' signal disappears. The worm is stimulated for 2 cycles of illumination, 4 s–15 s and 25 s–36 s. The head is pointing towards the upper-left corner at the beginning of the movie. The head region illuminated with blue laser is highlighted with a shade. The tail is highlighted with a circle. The animal moves in 25%–30% (w/v) dextran sandwiched between two glass slides (Materials and methods).
Additional files
-
Source code 1
auto tack 23.vi.
The LabVIEW program used to record movement of C. elegans.
- https://doi.org/10.7554/eLife.14197.024
-
Source code 2
YS_test_analyze_agarose_free_moving.m.
The Matlab code used to quantify head bending amplitude in moving animals.
- https://doi.org/10.7554/eLife.14197.025
Download links
A two-part list of links to download the article, or parts of the article, in various formats.
Downloads (link to download the article as PDF)
Open citations (links to open the citations from this article in various online reference manager services)
Cite this article (links to download the citations from this article in formats compatible with various reference manager tools)
An extrasynaptic GABAergic signal modulates a pattern of forward movement in Caenorhabditis elegans
eLife 5:e14197.
https://doi.org/10.7554/eLife.14197


