Evolution-guided functional analyses reveal diverse antiviral specificities encoded by IFIT1 genes in mammals
- Fred Hutchinson Cancer Research Center, United States
- Howard Hughes Medical Institute, Fred Hutchinson Cancer Research Center, United States
- University of Washington School of Medicine, United States
Figures
Figure 1

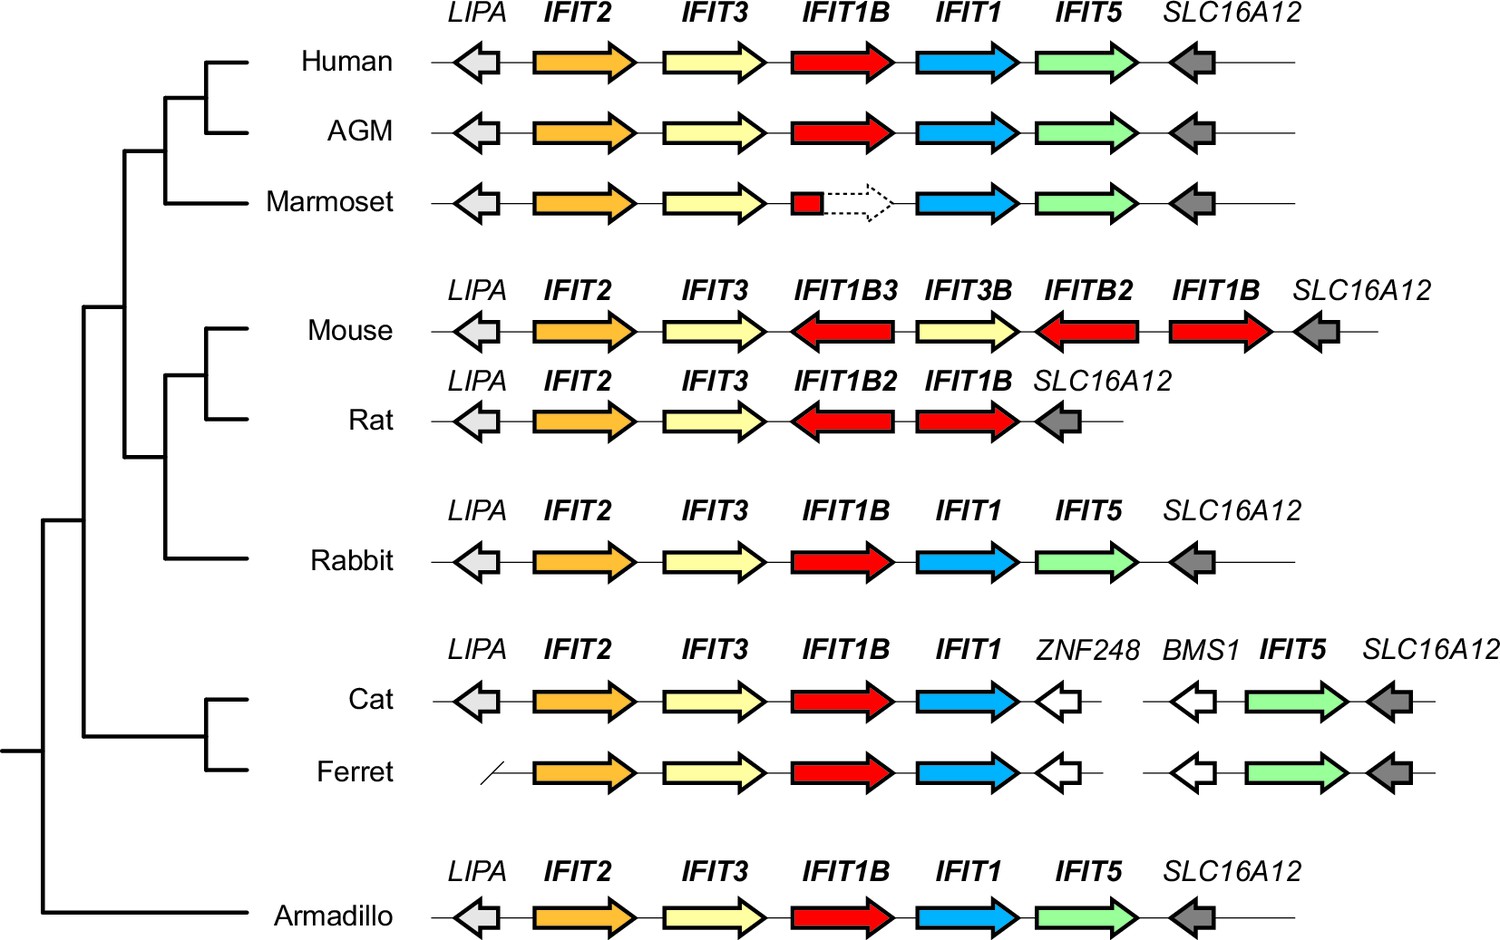
Discordant signatures of synteny and phylogeny for mammalian IFIT genes.
(A) Alignment of the IFIT gene locus from several mammalian genomes. Colored arrows indicate intact IFIT genes and grey arrows indicate neighboring syntenic genes. At left is a schematic phylogenetic tree showing the relatedness of the indicated species. In carnivores such as cats and ferrets, the IFIT locus is split with IFIT5 in one chromosomal location and the remainder of the IFITs in another. In the marmoset genome, the IFIT1B gene has been pseudogenized by frameshift and nonsense mutations, as indicated by the dashed white arrow. Note that the nomenclature for the IFIT genes marked with asterisks is as previously proposed; we suggest a revised nomenclature scheme for those genes in this report from Figure 2 onwards. A version of this figure, with revised gene names and coloring, is found in Figure 2—figure supplement 4. (B) Maximum likelihood phylogenetic tree generated using an alignment of the entire gene sequence of the indicated IFITs. Bootstrap values greater than 80% are shown along the supported branch. Gene names with asterisks next to them have been revised from Figure 2 onward. Accession numbers for all sequences are found in Supplementary file 1.
Figure 2 with 4 supplements
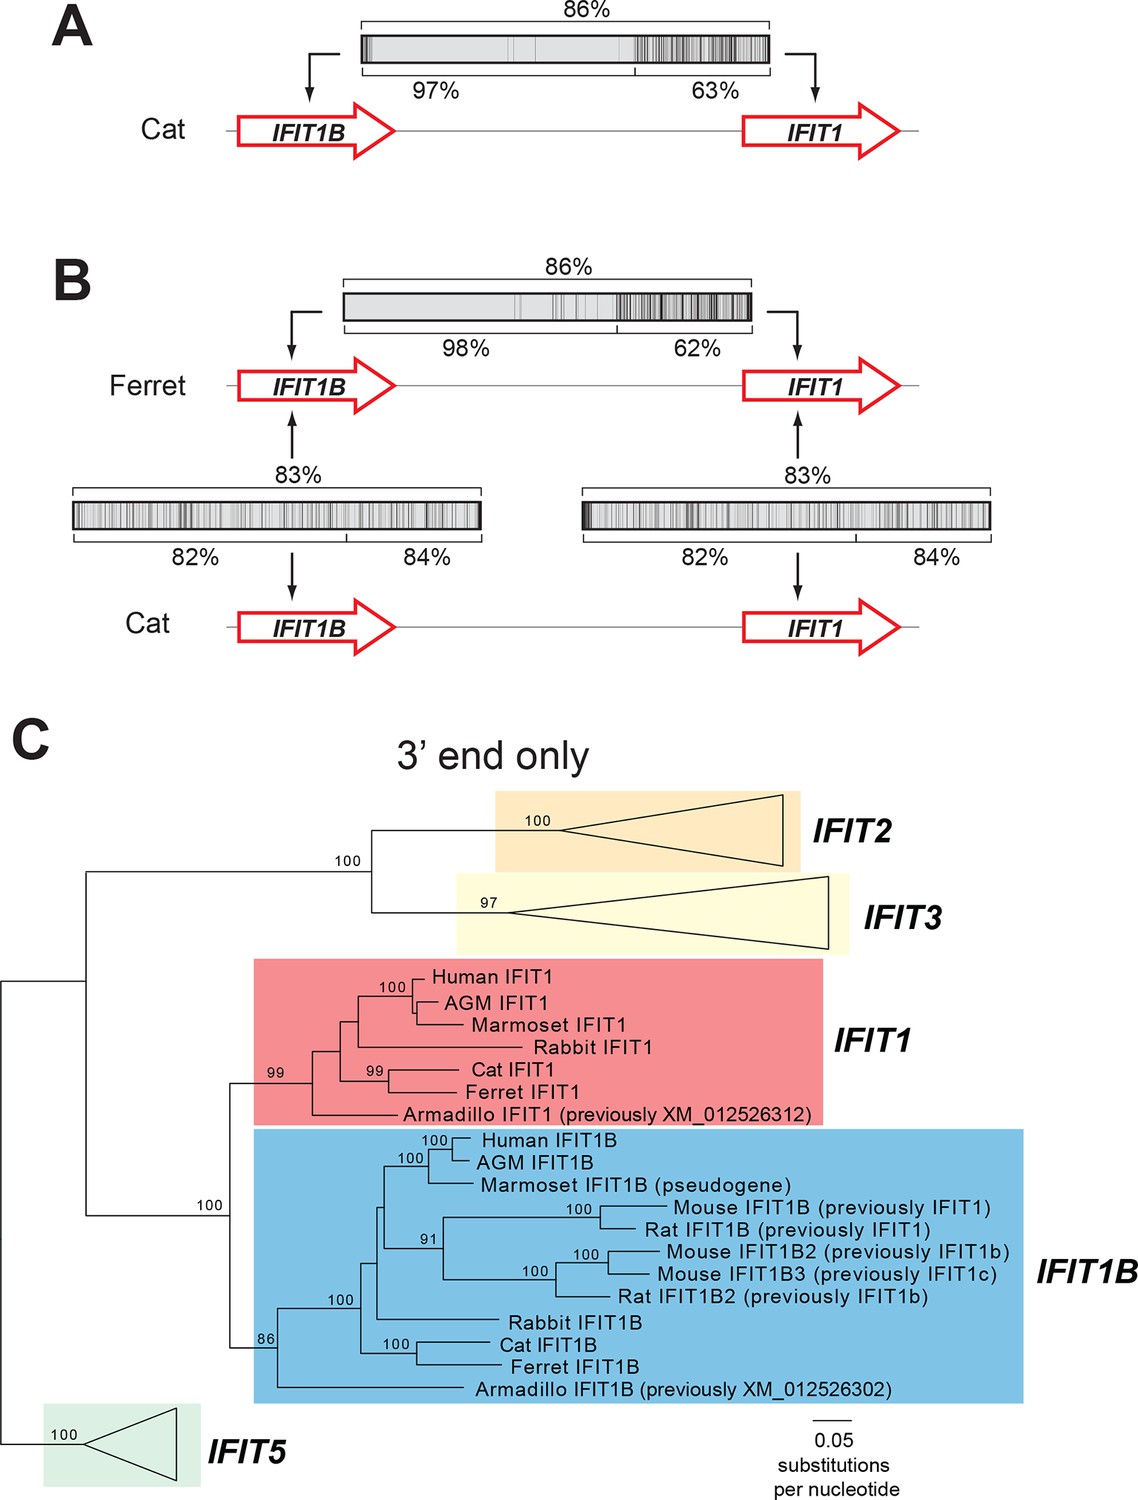
An ancient gene duplication gave rise to paralogous IFIT1 and IFIT1B gene families.
(A) Comparison of the nucleotide sequence of cat IFIT1 and IFIT1B indicating gene conversion between the two paralogs. The middle rectangle represents a pairwise sequence alignment, with black vertical lines indicating differences between the two gene sequences. Percent nucleotide identity for the whole gene comparison is shown above the alignment schematic, with the 5' end and 3' end percent identities shown below. (B) Additional pairwise sequence alignments are shown as in part A. Additional examples supporting a common recombination breakpoint are shown in Figure 2—figure supplement 1. Mapping of the recombination breakpoint onto IFIT structural models (Abbas et al., 2013; Yang et al., 2012) is shown in Figure 2—figure supplement 2. (C) Maximum likelihood phylogenetic tree of IFIT genes using only the 3' end of the gene alignment (corresponding to bases 907–1437 of human IFIT1). Bootstrap values greater than 80% are shown along the supported branch. For clarity, IFIT2, IFIT3 and IFIT5 branches are collapsed and represented as triangles. A maximum likelihood phylogenetic tree of the 5' end of the IFIT gene alignment is shown in Figure 2—figure supplement 3. A figure showing revised gene names on the gene locus alignment is shown in Figure 2—figure supplement 4.
Figure 2—figure supplement 1
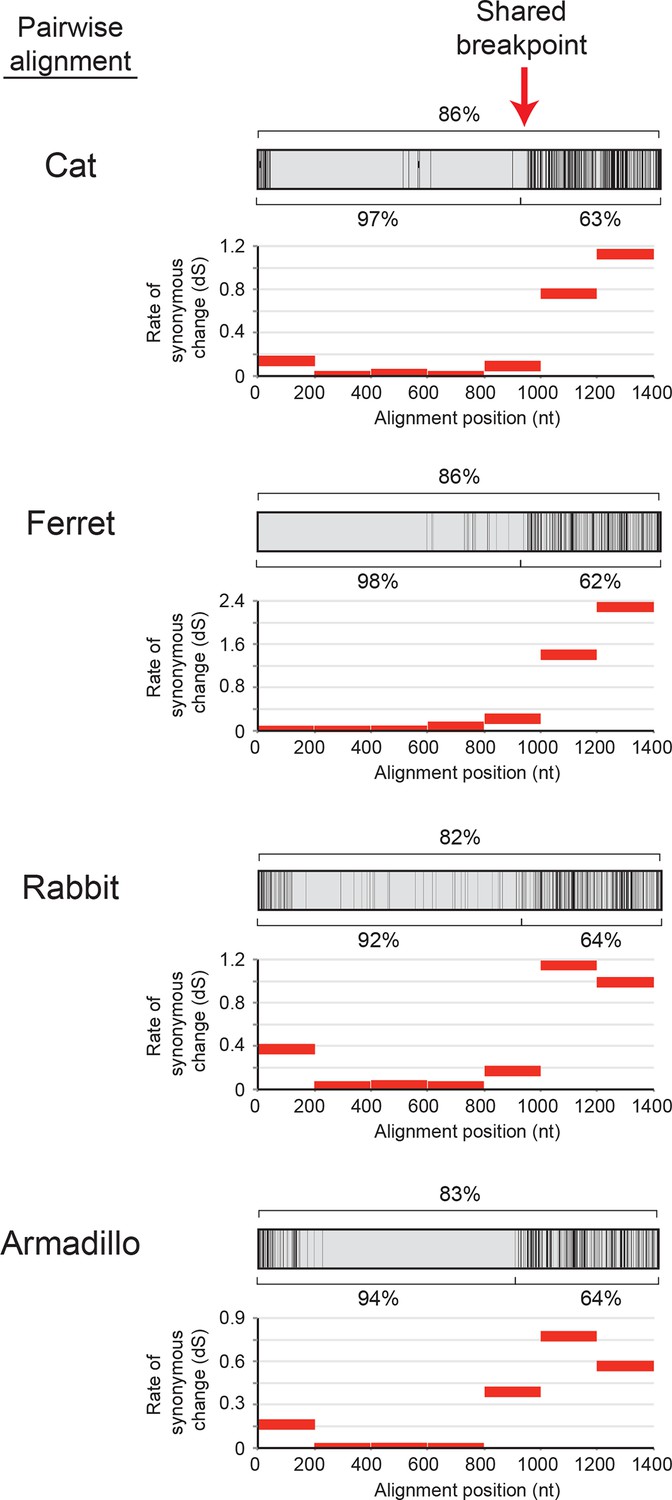
Recurrent gene conversion across several diverse mammalian species has utilized a similar recombination breakpoint.
Pairwise alignments between IFIT1 and IFIT1B genes in the indicated species are represented as in Figure 2A, with black vertical lines indicating differences between the two gene sequences. Percent identity for the whole gene comparison is shown directly above the alignment schematic, with the 5' end and 3' end percent identities shown directly below. Below each pairwise alignment schematic is a sliding window calculation using K-Estimator (Comeron, 1999) of the rate of synonymous changes (dS) for each alignment. Each 200 nt window is represented by a red horizontal line at the calculated dS value. The recombination breakpoint (red vertical arrow) between regions of high sequence identity and low dS (5' end) and low sequence identity and high dS (3' end) is similar across these distantly related species.
Figure 2—figure supplement 2
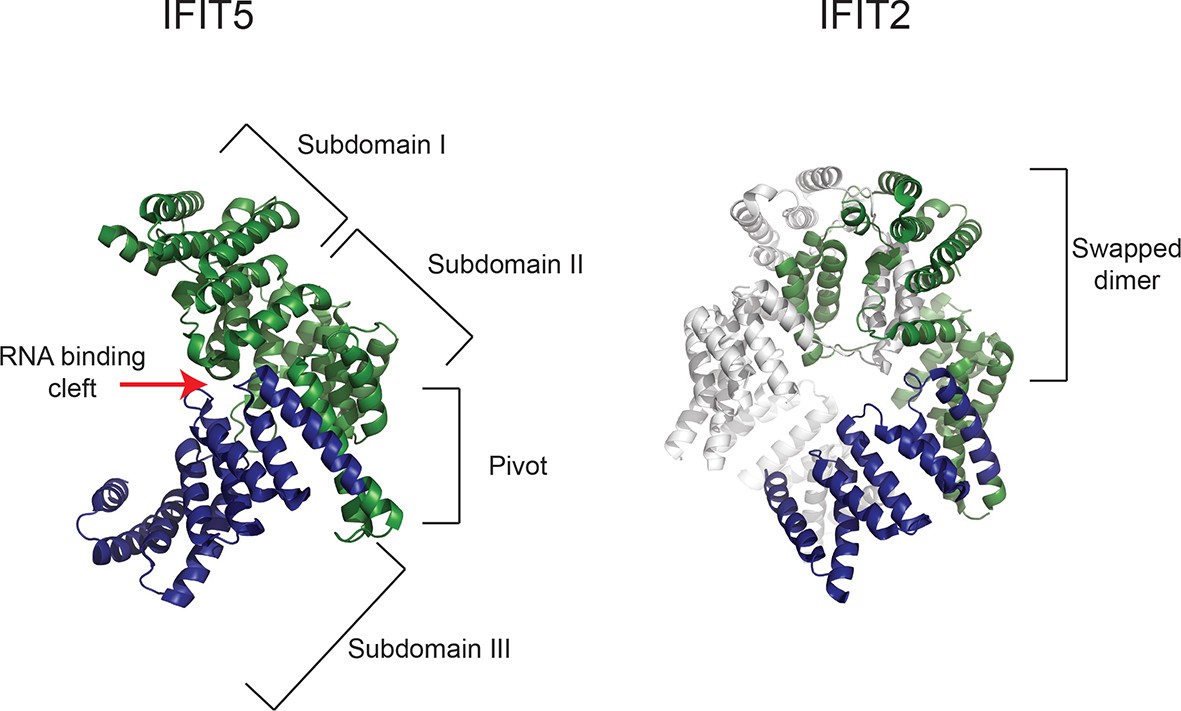
Gene conversion of IFIT1 and IFIT1B homogenizes some IFIT structural domains while leaving others to independently evolve.
Structures of human IFIT5 complexed with RNA ([Abbas et al., 2013], PDB code 4HOT) and the human IFIT2 dimer ([Yang et al., 2012], PDB code 4G1T) are shown. In both cases, residues in the N-terminus of the protein that align to the recurrently recombining region of IFIT1 and IFIT1B (see Figure 2—figure supplement 1) are shown in green, while the non-recombining region is shown in blue. For IFIT5, the major structural domains as described in (Abbas et al., 2013) are indicated, with the recombination breakpoint (Figure 2—figure supplement 1) falling in the 'pivot' region between the second and third subdomains. For IFIT2, one monomer is shown in grey, revealing that the non-recombining region lies outside of the swapped interface that underpins IFIT2 dimerization (Yang et al., 2012).
Figure 2—figure supplement 3
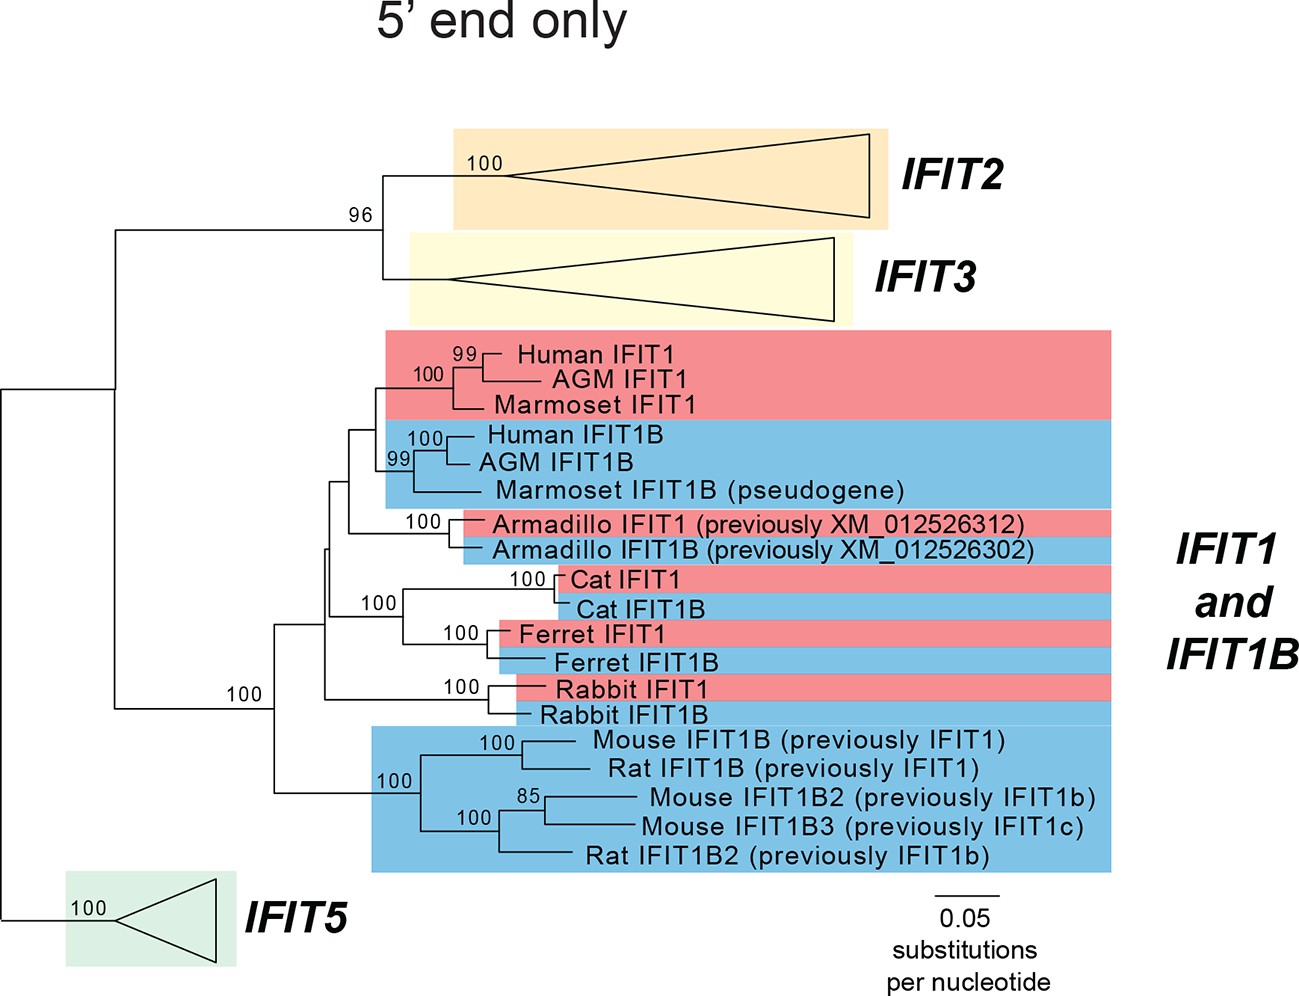
Phylogenetic tree of the recombining region of mammalian IFIT genes.
Maximum likelihood phylogenetic tree of IFIT genes using only the region 5' to the recombination breakpoint (see Figure 2C and Figure 2—figure supplement 1). Bootstrap values greater than 80% are shown along the supported branch. The red and blue coloring is based on the phylogeny shown in Figure 2C.
Figure 2—figure supplement 4
Synteny of mammalian IFITs with updated IFIT1 and IFIT1B gene names.
Alignment of the IFIT gene locus from several mammalian genomes as in Figure 1. Gene colors and names have been revised to correspond to the phylogenetic relatedness of genes shown in Figure 2C.
Figure 3 with 4 supplements
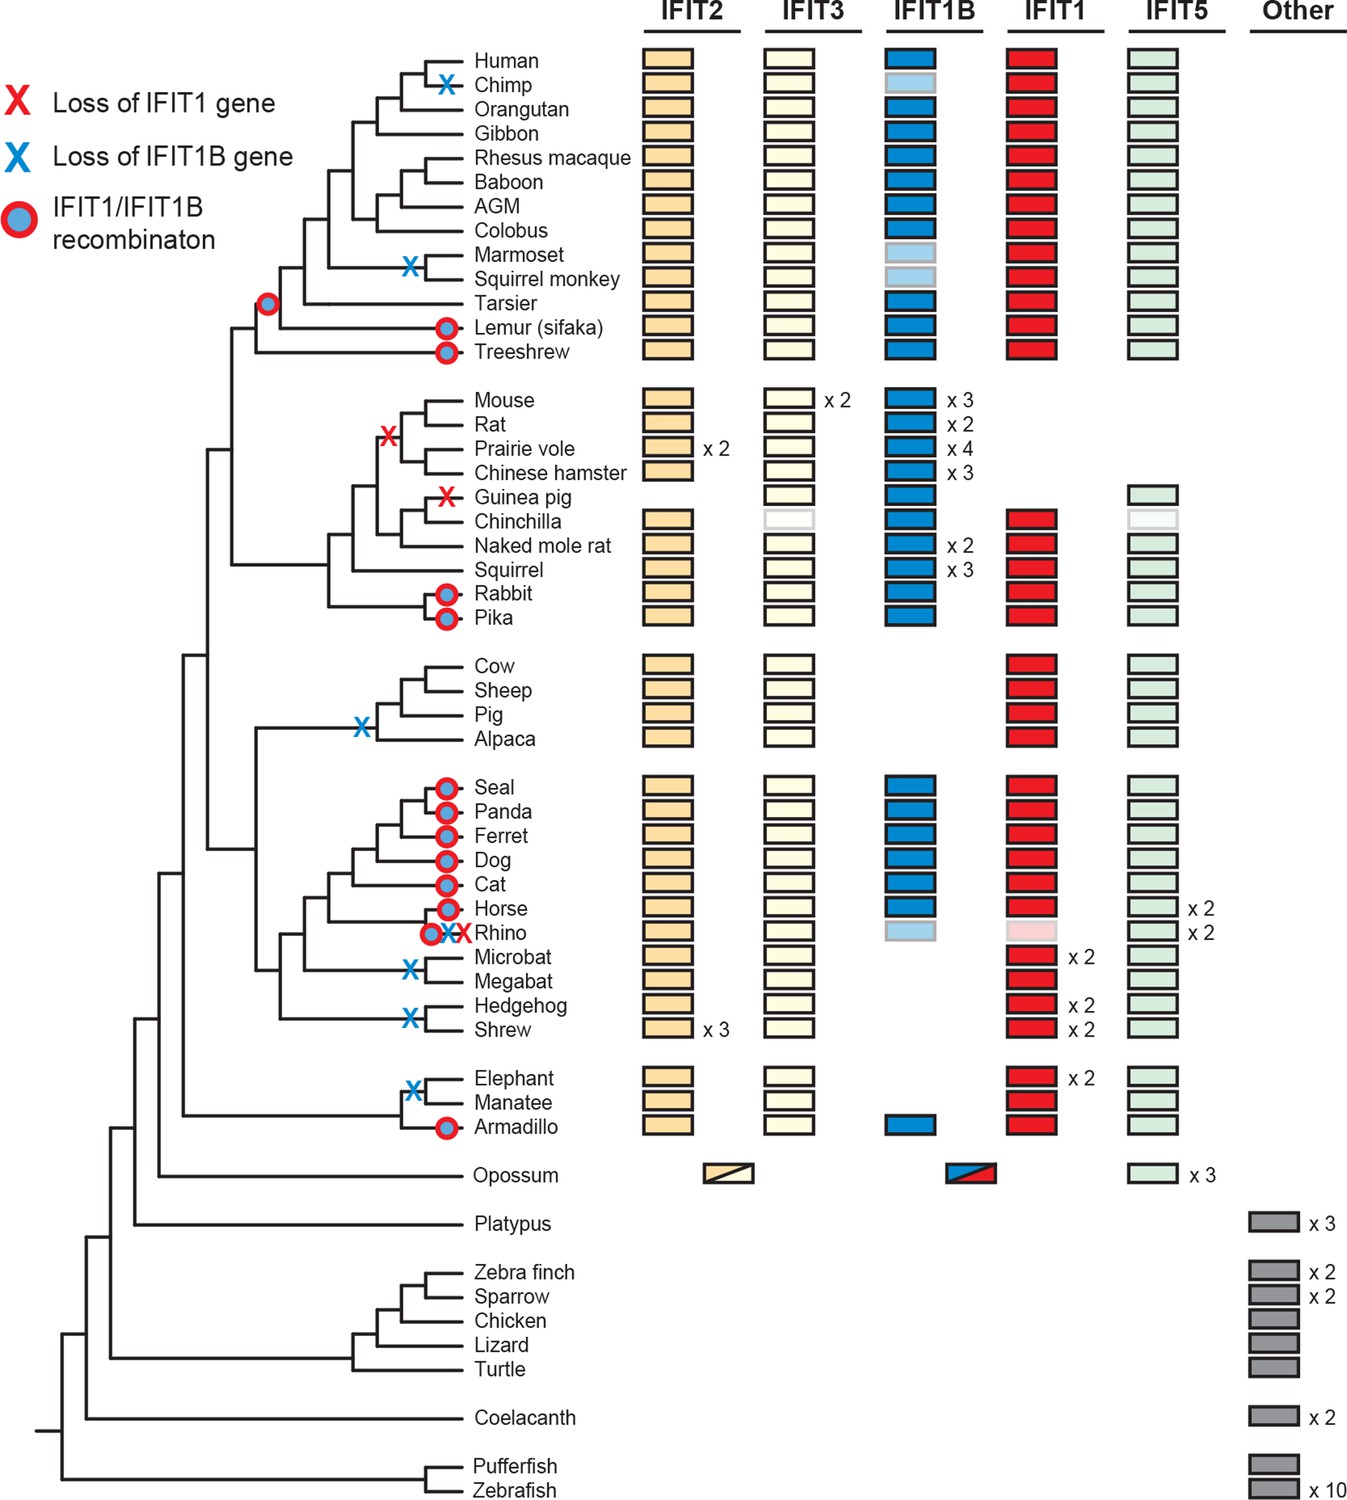
Widespread gene birth, gene loss and gene conversion in vertebrate IFIT genes.
Summary table of the IFIT gene repertoire of 51 vertebrate species (see complete phylogeny in Figure 3—figure supplement 1 as well as expanded regions of trees built from the 5' and 3' end of the IFIT gene alignment in Figure 3—figure supplements 2 and 3). Colored boxes indicate the presence of a given IFIT gene sequence, with multiple copies indicated as a number to the right of the colored box. Lightened boxes indicate that only a partial or pseudogenized copy of the gene can be found in the genome. On the phylogenetic tree to the left, X's indicate deletion or pseudogenization of either IFIT1 or IFIT1B genes from that lineage (see Figure 3—figure supplement 4 for primate examples). Also shown are predicted occurrences of gene conversion (red-around-blue circles) between IFIT1 and IFIT1B sequences based on discordance between phylogenetic trees generated from 3' or 5' regions of the genes (for carnivore examples see Figure 3—figure supplement 2). Accession numbers for all sequences are found in Supplementary file 1.
Figure 3—figure supplement 1
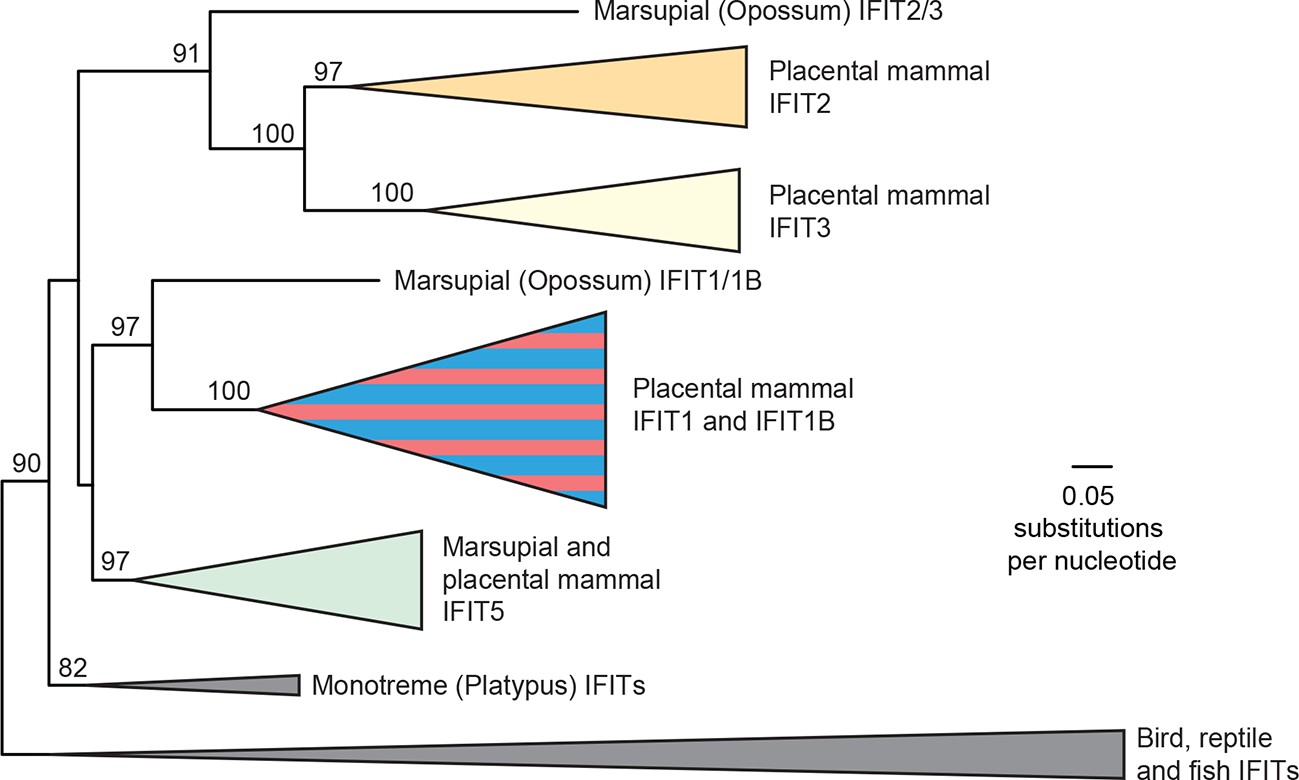
Phylogeny of vertebrate IFIT genes.
Maximum likelihood phylogenetic tree of over 200 IFIT genes from 51 vertebrate species. Bootstrap values greater than 80% are shown along the supported branch. An ancestral IFIT was duplicated multiple times early in mammalian evolution, resulting in many species having IFIT1, IFIT1B, IFIT2, IFIT3 and IFIT5. As in Figure 1B, IFIT1 and IFIT1B genes cannot be resolved into distinct phylogenetic clades based on the full-length gene alignment.
Figure 3—figure supplement 2
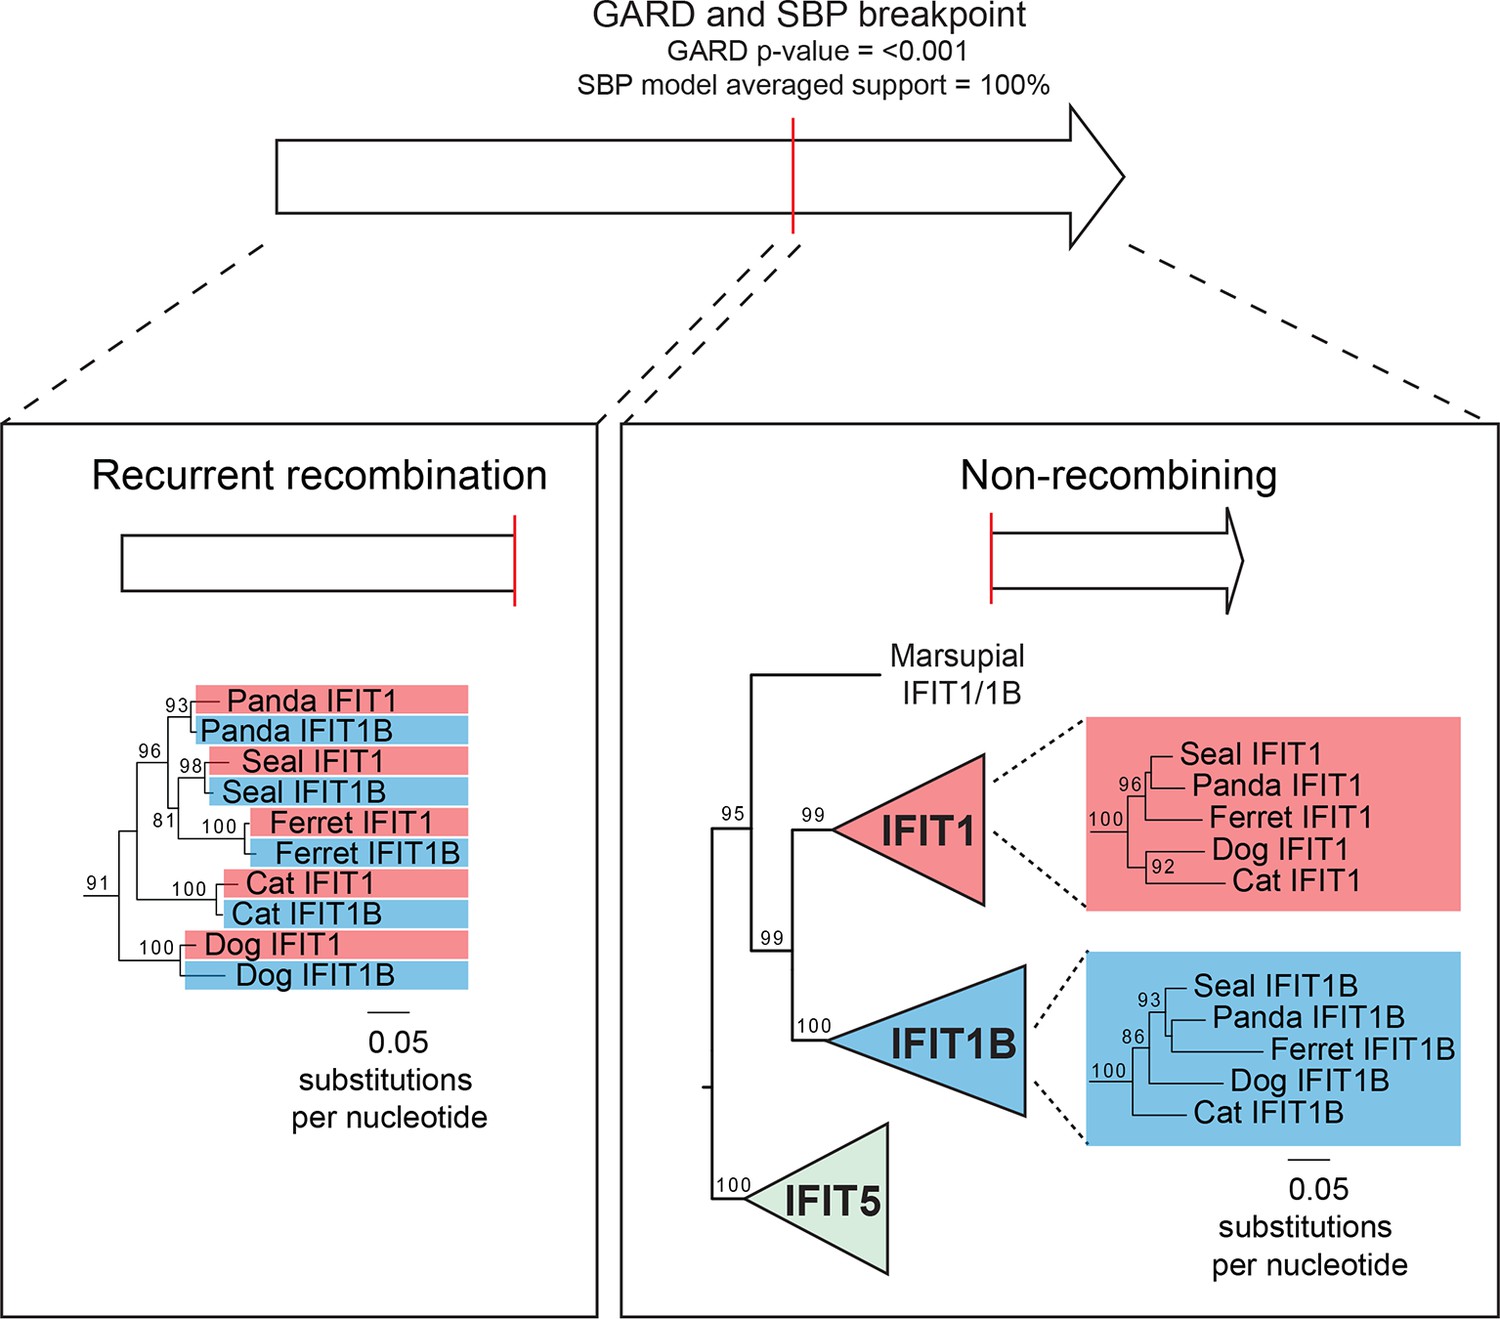
Recurrent gene conversion is restricted to the 5' ends of IFIT genes.
GARD and SBP analyses were run on the complete IFIT gene phylogeny shown in Figure 3—figure supplement 1. These analyses indicate recurrent gene conversion between IFIT1 and IFIT1B paralogs 5' to the breakpoint indicated in red, while there is no evidence for gene conversion in the 3' end of the genes. Below are portions of the maximum likelihood phylogenetic tree of the recombining 5' region (left) and the non-recombining 3' region (right) of vertebrate IFITs highlighting only the region of the tree showing carnivore IFIT1 and IFIT1B gene sequences. Bootstrap values greater than 80% are shown along the supported branch.
Figure 3—figure supplement 3
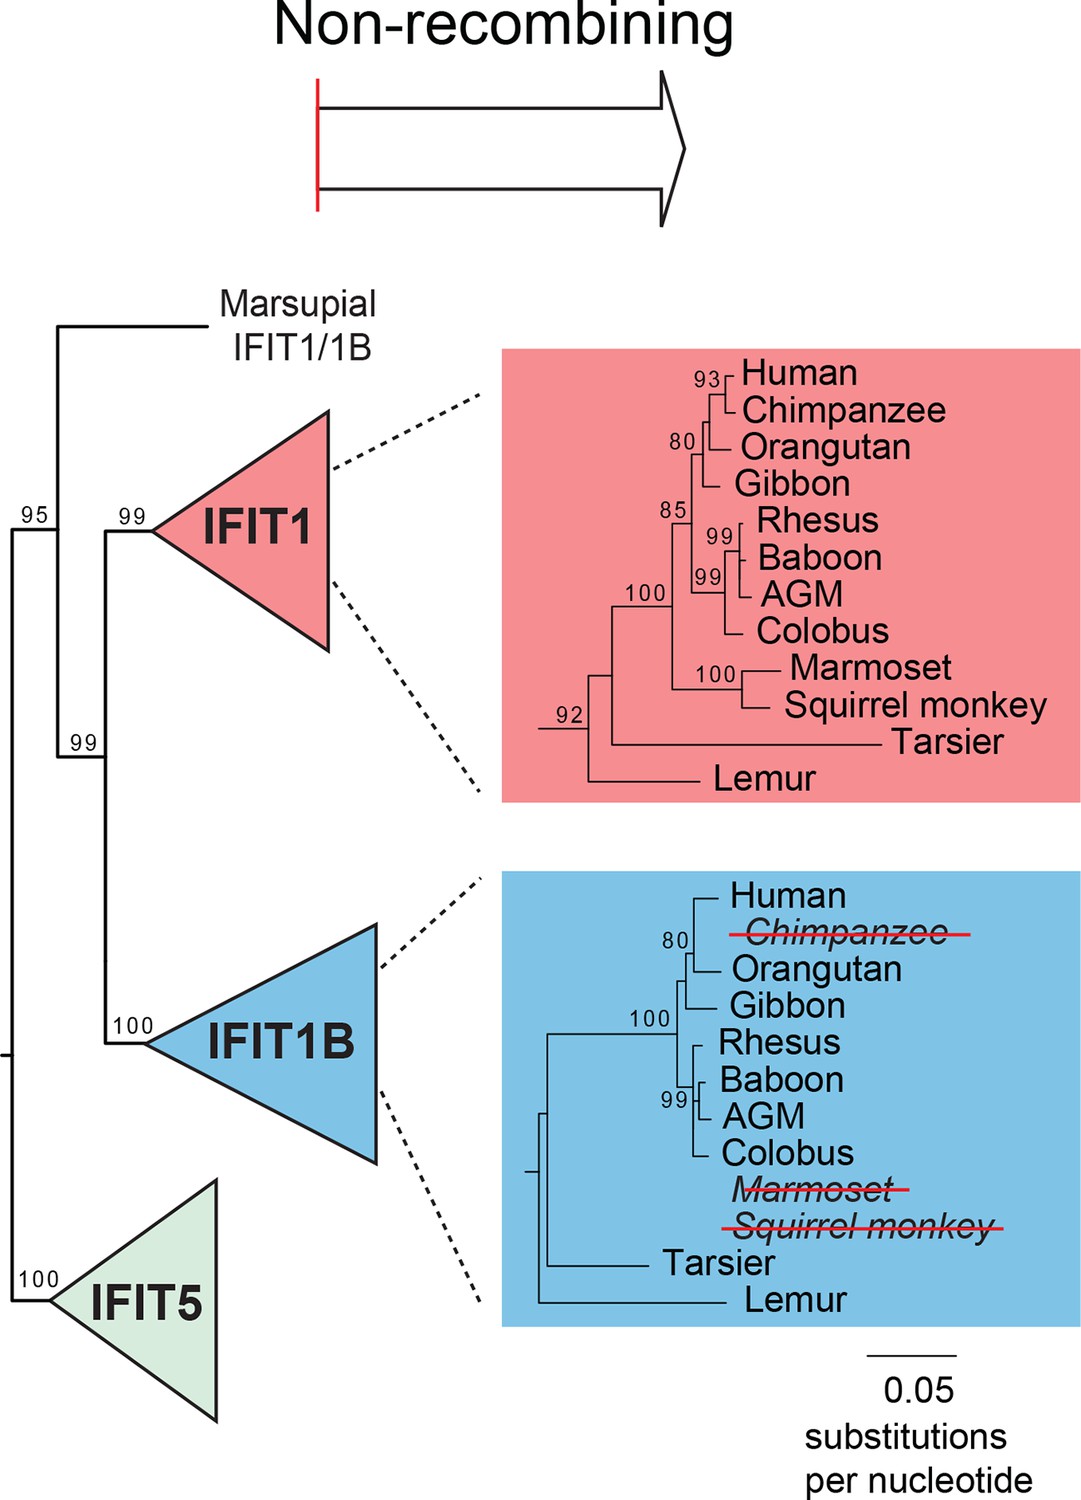
Primate IFIT1 and IFIT1B genes.
A portion of the maximum likelihood phylogenetic tree of the non-recombining 3' region of vertebrate IFITs is shown as in Figure 3 supplement 2. Bootstrap values greater than 80% are shown along the supported branch. Primate IFIT1 and IFIT1B gene phylogenies are expanded, with pseudogenization of chimpanzee and New World monkey (marmoset and squirrel monkey) IFIT1B genes by frameshift and nonsense mutations (see Figure 3—figure supplement 4) indicated by red-strikethroughs. Subsequent analyses suggest that human IFIT1B also lacks activity, although it encodes an intact open reading frame.
Figure 3—figure supplement 4
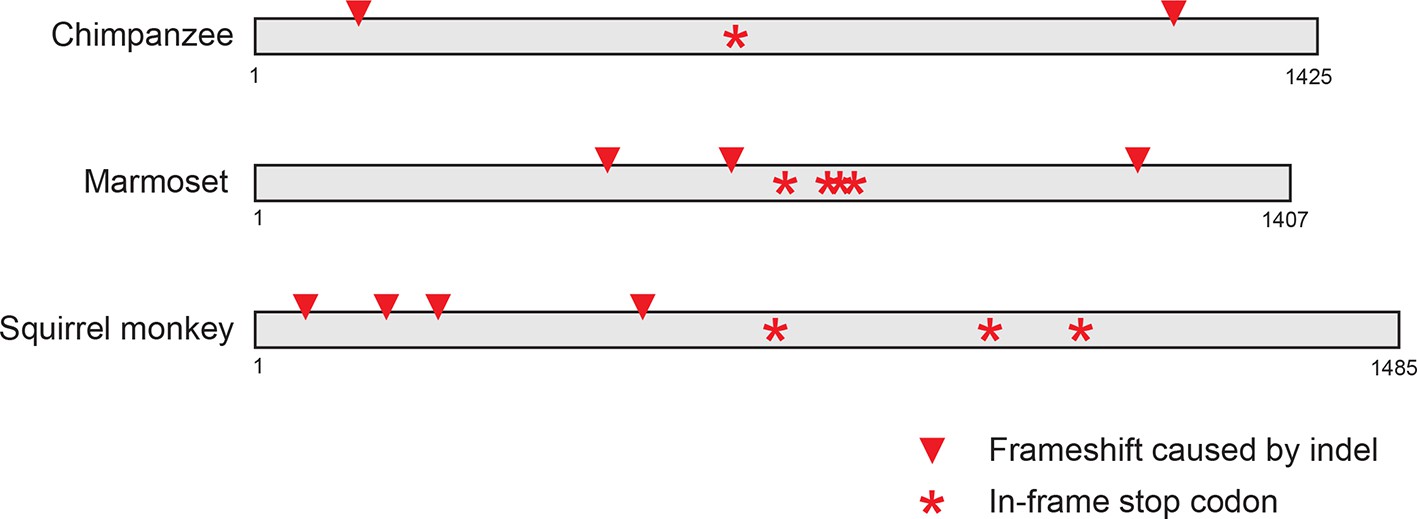
Pseudogenization of IFIT1B genes from several primate lineages.
Location of frameshift and nonsense mutations in pseudogenized primate IFIT1B genes are shown. Gene sequences were aligned to intact human IFIT1B and frameshift-inducing insertions or deletions (red triangles) or nonsense mutations (red asterisks) are shown in the corresponding position in the sequence.
Figure 4 with 1 supplement
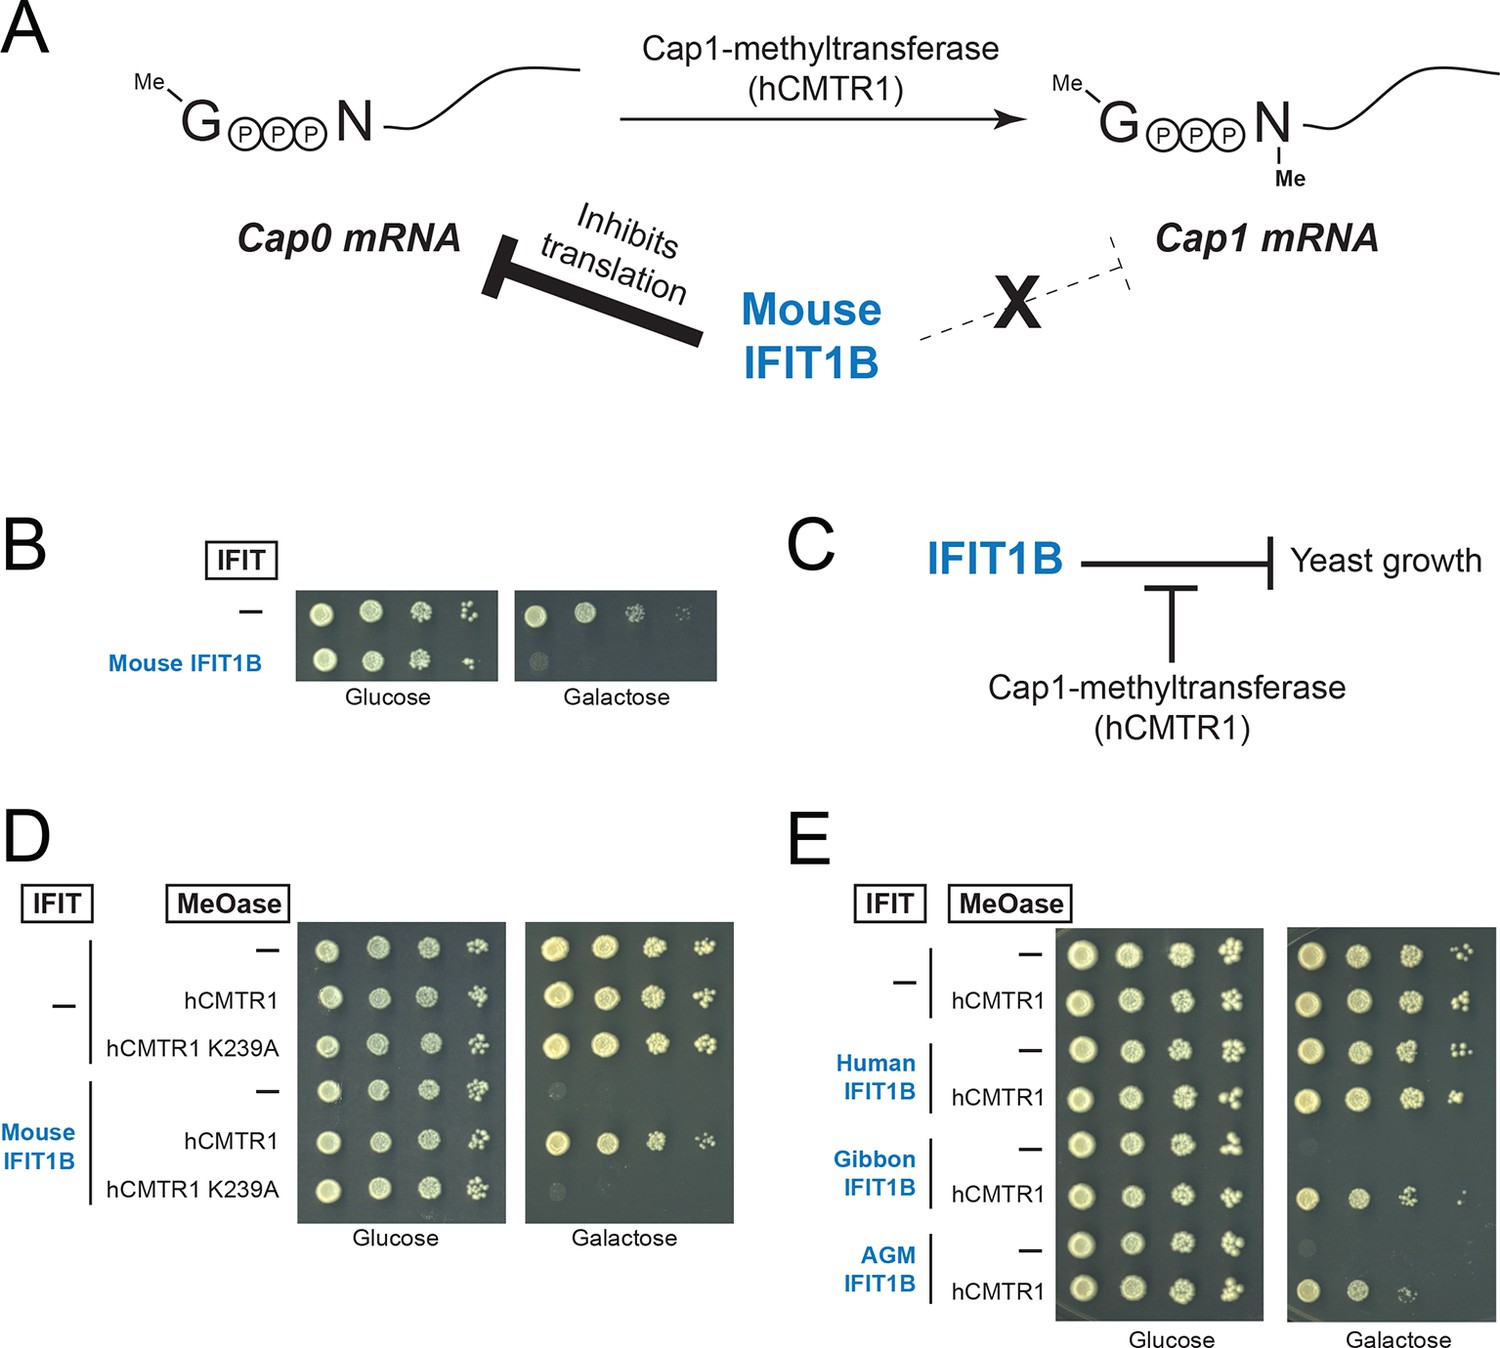
A yeast genetic assay recapitulates IFIT1B molecular specificity.
(A) Schematic of mRNA cap structures and the proposed role of mouse IFIT1B in recognition and inhibition of mRNAs containing cap0-structures. Methylation of the first transcribed nucleotide of mRNAs, represented by an 'N', is performed by cap1-methyltransferases, such as human CMTR1 (hCMTR1). However, cap1-methyltransferase activity is absent in budding yeast. Mouse IFIT1B binds and inhibits translation of cap0-mRNAs, but its activity is blocked when mRNAs contain a cap1-structure. (B) A budding yeast growth assay for IFIT1B function. Since budding yeast lack a cap1-methyltransferase, their mRNAs are predicted to be targeted by mouse IFIT1B. Shown are 10-fold serial dilutions of yeast spotted on media in which the indicated IFIT is either not expressed (Glucose) or expressed (Galactose). Rows marked with '-' indicate an empty vector control. (C) Predicted role for hCMTR1 in blocking IFIT1B-mediated growth inhibition. (D–E) Yeast growth inhibition assays as in part B, but with galactose-induced co-expression of the indicated methyltransferase (cap1-methyltransferase (hCMTR1) wildtype or catalytic mutant (K239A)). In these panels, both IFIT and hCMTR1 expression are only induced upon grown on galactose-containing media. Protein expression data corresponding to these yeast strains grown in galactose are shown in Figure 4—figure supplement 1.
Figure 4—figure supplement 1
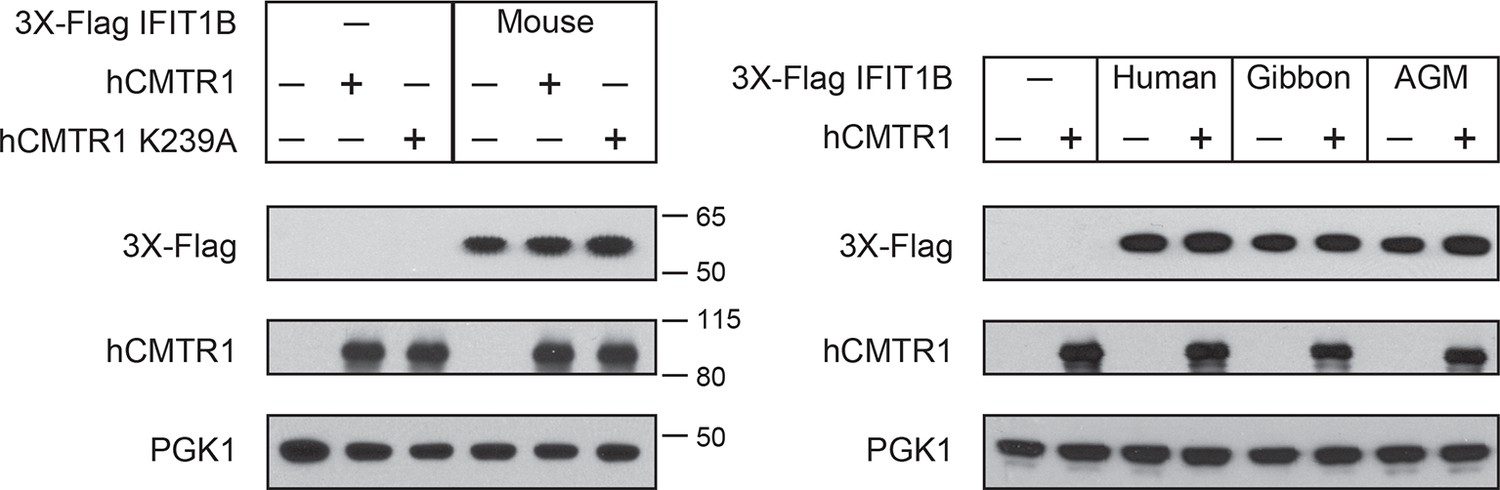
Expression of IFIT1B and cap1-methyltransferase proteins in yeast.
Western blots of yeast described in Figure 4. Lanes marked with '-' indicate an empty vector control. Shown are blots probed with anti-Flag antibody (for IFIT1B expression), anti-hCMTR1 (for cap1-methyltransferase expression) and anti-PGK1 (as a loading control). The location of molecular weight markers (in kiloDaltons) are indicated on the right of the Western blots.
Figure 5 with 1 supplement
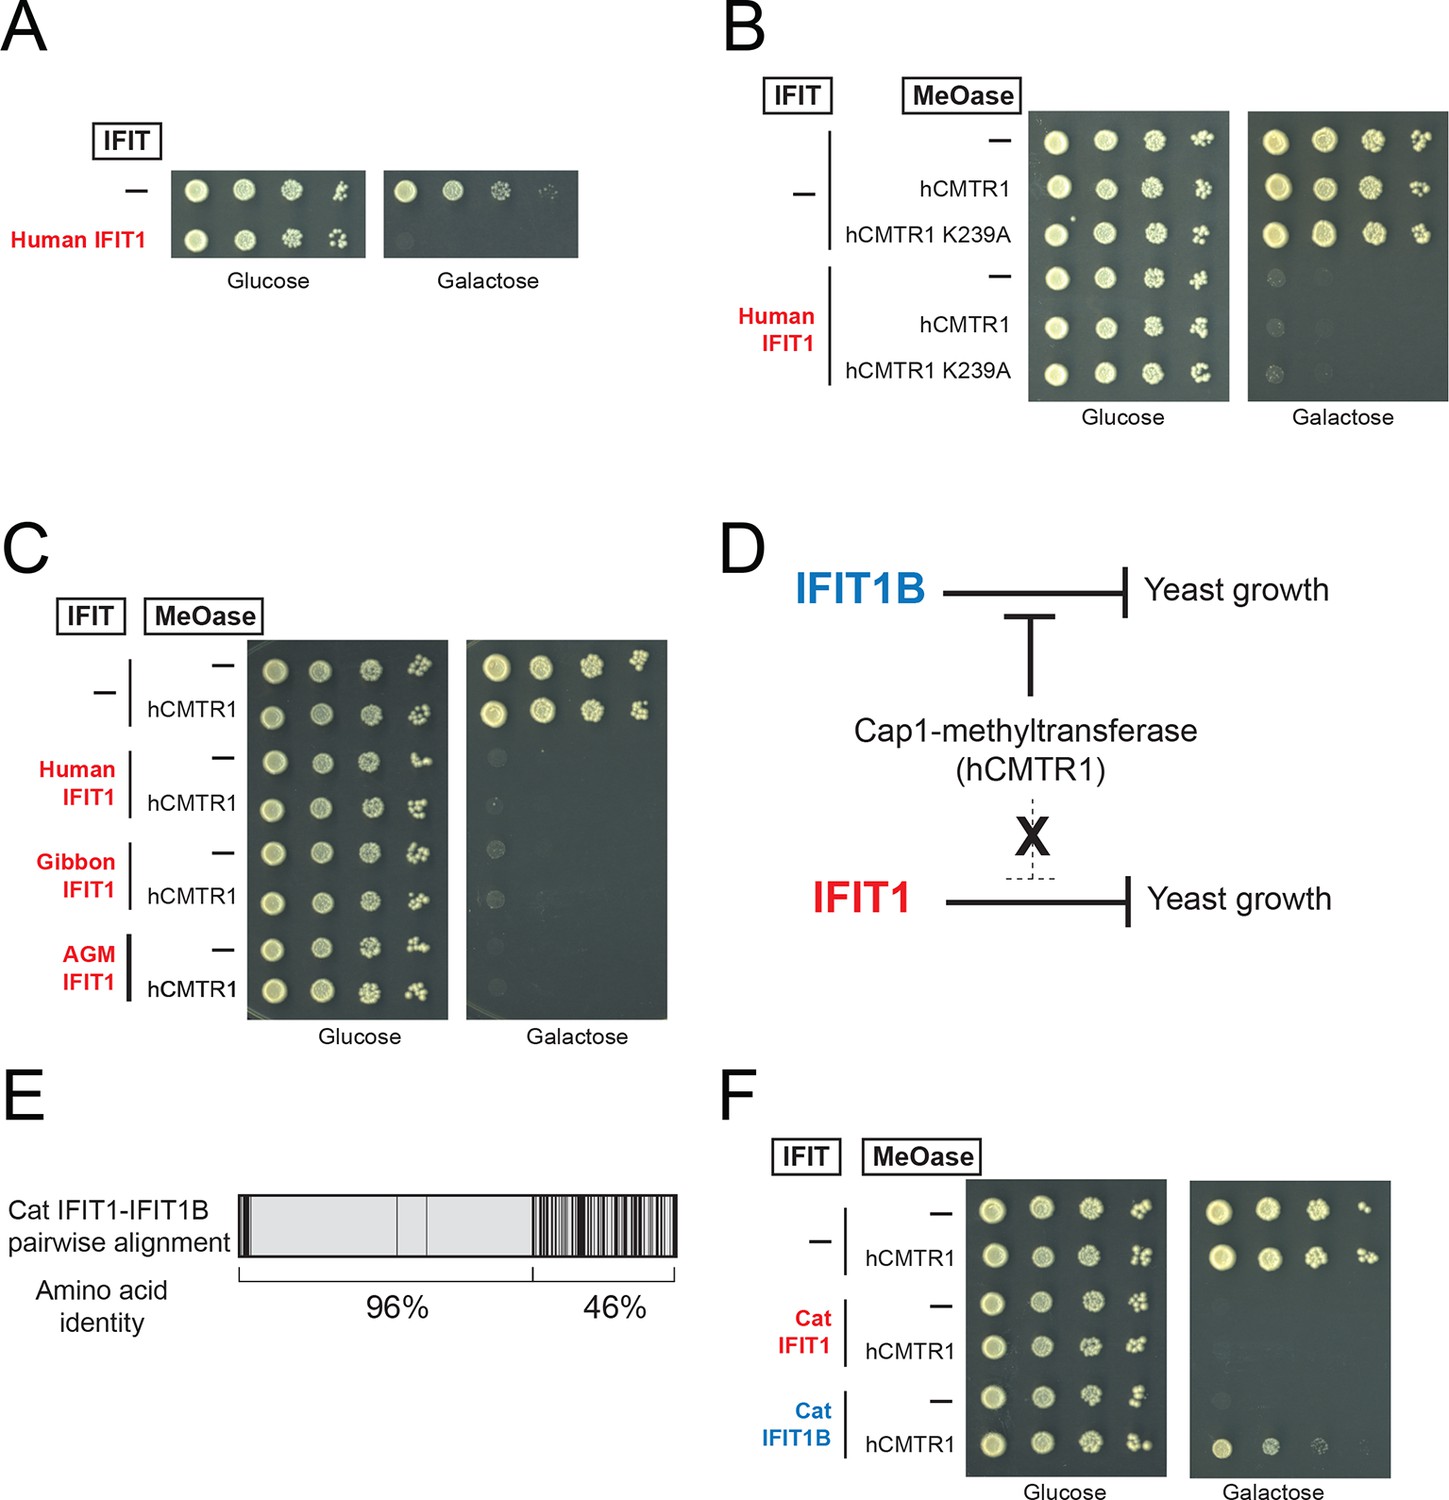
IFIT1-mediated growth inhibition is not relieved by a cap1-methyltransferase.
(A–C) Yeast growth inhibition assays as in Figure 4 with the indicated IFIT1. (D) In contrast to IFIT1B, IFIT1 inhibits yeast growth regardless of whether cap1-methyltransferase is present. (E) Pairwise comparison of the amino acid sequence of cat IFIT1 and IFIT1B, with black vertical lines indicating differences between the two protein sequences. Shown below are the pairwise amino acid identities for the N- and C-terminal regions of the alignment. (F) Yeast growth inhibition assays as in Figure 4 with cat IFIT1 or IFIT1B. In these panels, both IFIT and hCMTR1 expression are only induced upon grown on galactose-containing media. Protein expression data corresponding to these yeast strains grown in galactose are shown in Figure 5—figure supplement 1.
Figure 5—figure supplement 1
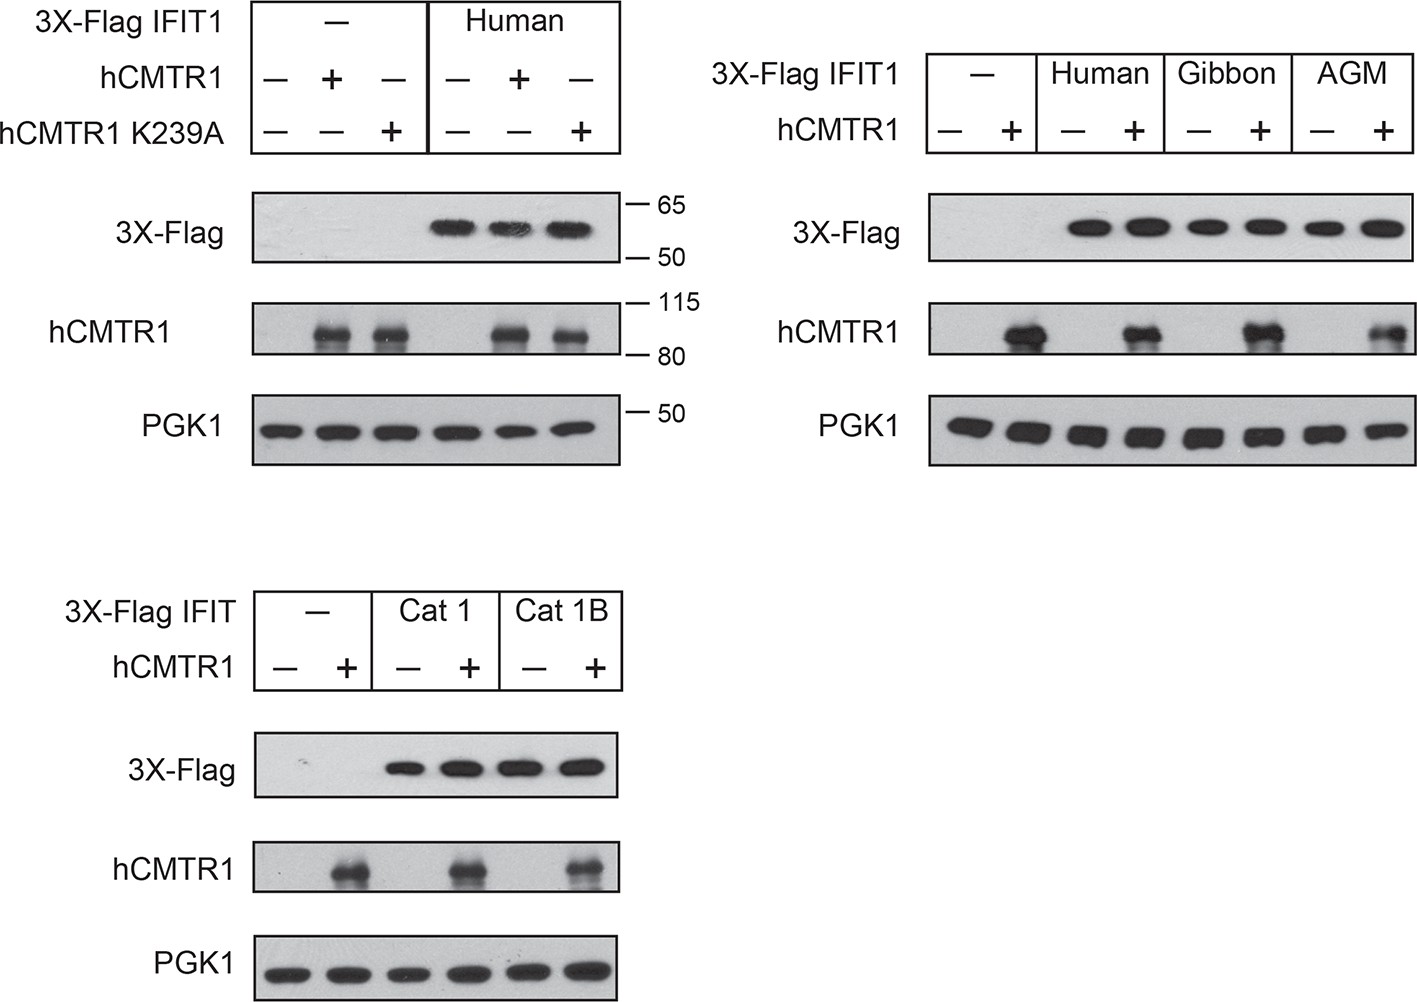
Expression of IFIT1 proteins in yeast.
Western blots of yeast described in Figure 5. Lanes marked with '-' indicate an empty vector control. Shown are blots probed with anti-Flag antibody (for IFIT1 or IFIT1B expression), anti-hCMTR1 (for cap1-methyltransferase expression) and anti-PGK1 (as a loading control). The location of molecular weight markers (in kiloDaltons) are indicated on the right of the Western blots.
Figure 6
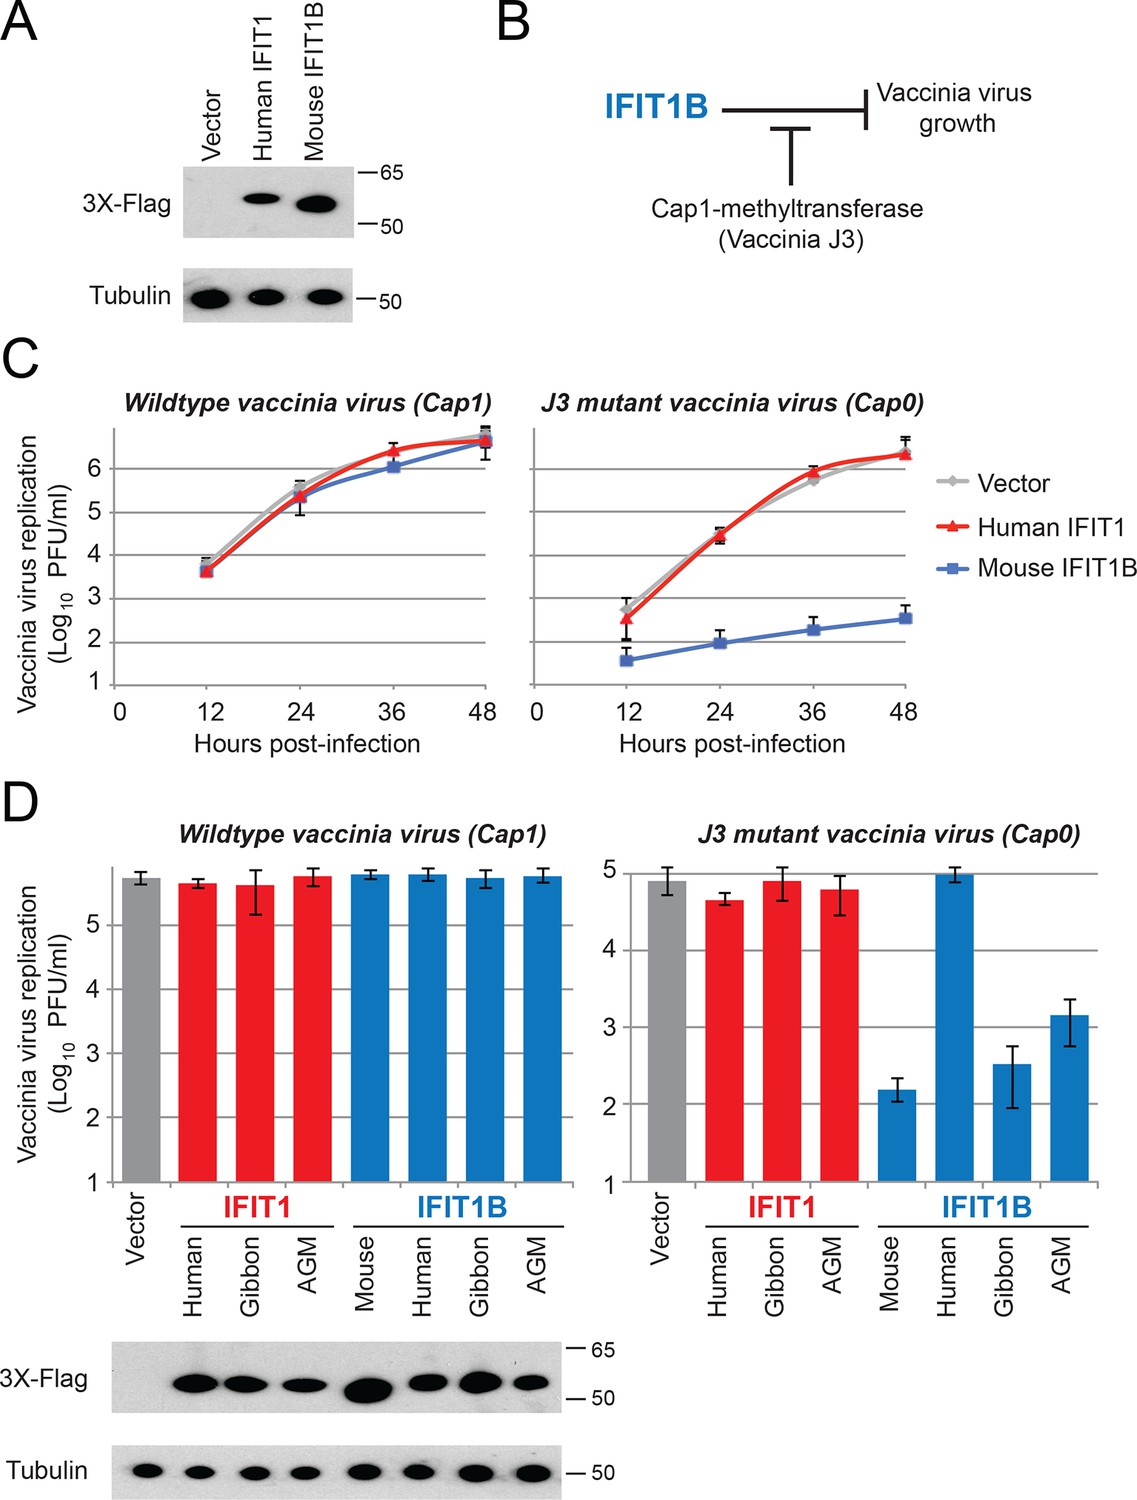
IFIT1B, but not IFIT1, inhibits replication of a cap0-containing virus.
(A) Cell lines were generated that express human IFIT1 or mouse IFIT1B, as assessed by western blot. (B) Predicted role for vaccinia virus cap1-methyltransferase (J3) in blocking IFIT1B-mediated viral inhibition. (C) Cell lines expressing the indicated IFIT protein were infected with either wildtype (left) or cap1-methlytransferase mutant (J3 K175A, right) vaccinia virus at an MOI of 0.01. Virus was harvested at the indicated time point and titered. Error bars represent standard deviation of three biological replicates. (D) As in panel C, but only showing data 24 hr post-infection with wildtype (left) or the cap1-methyltransferase mutant (right) vaccinia virus. Shown below are protein expression levels from uninfected cell lines.
Figure 7
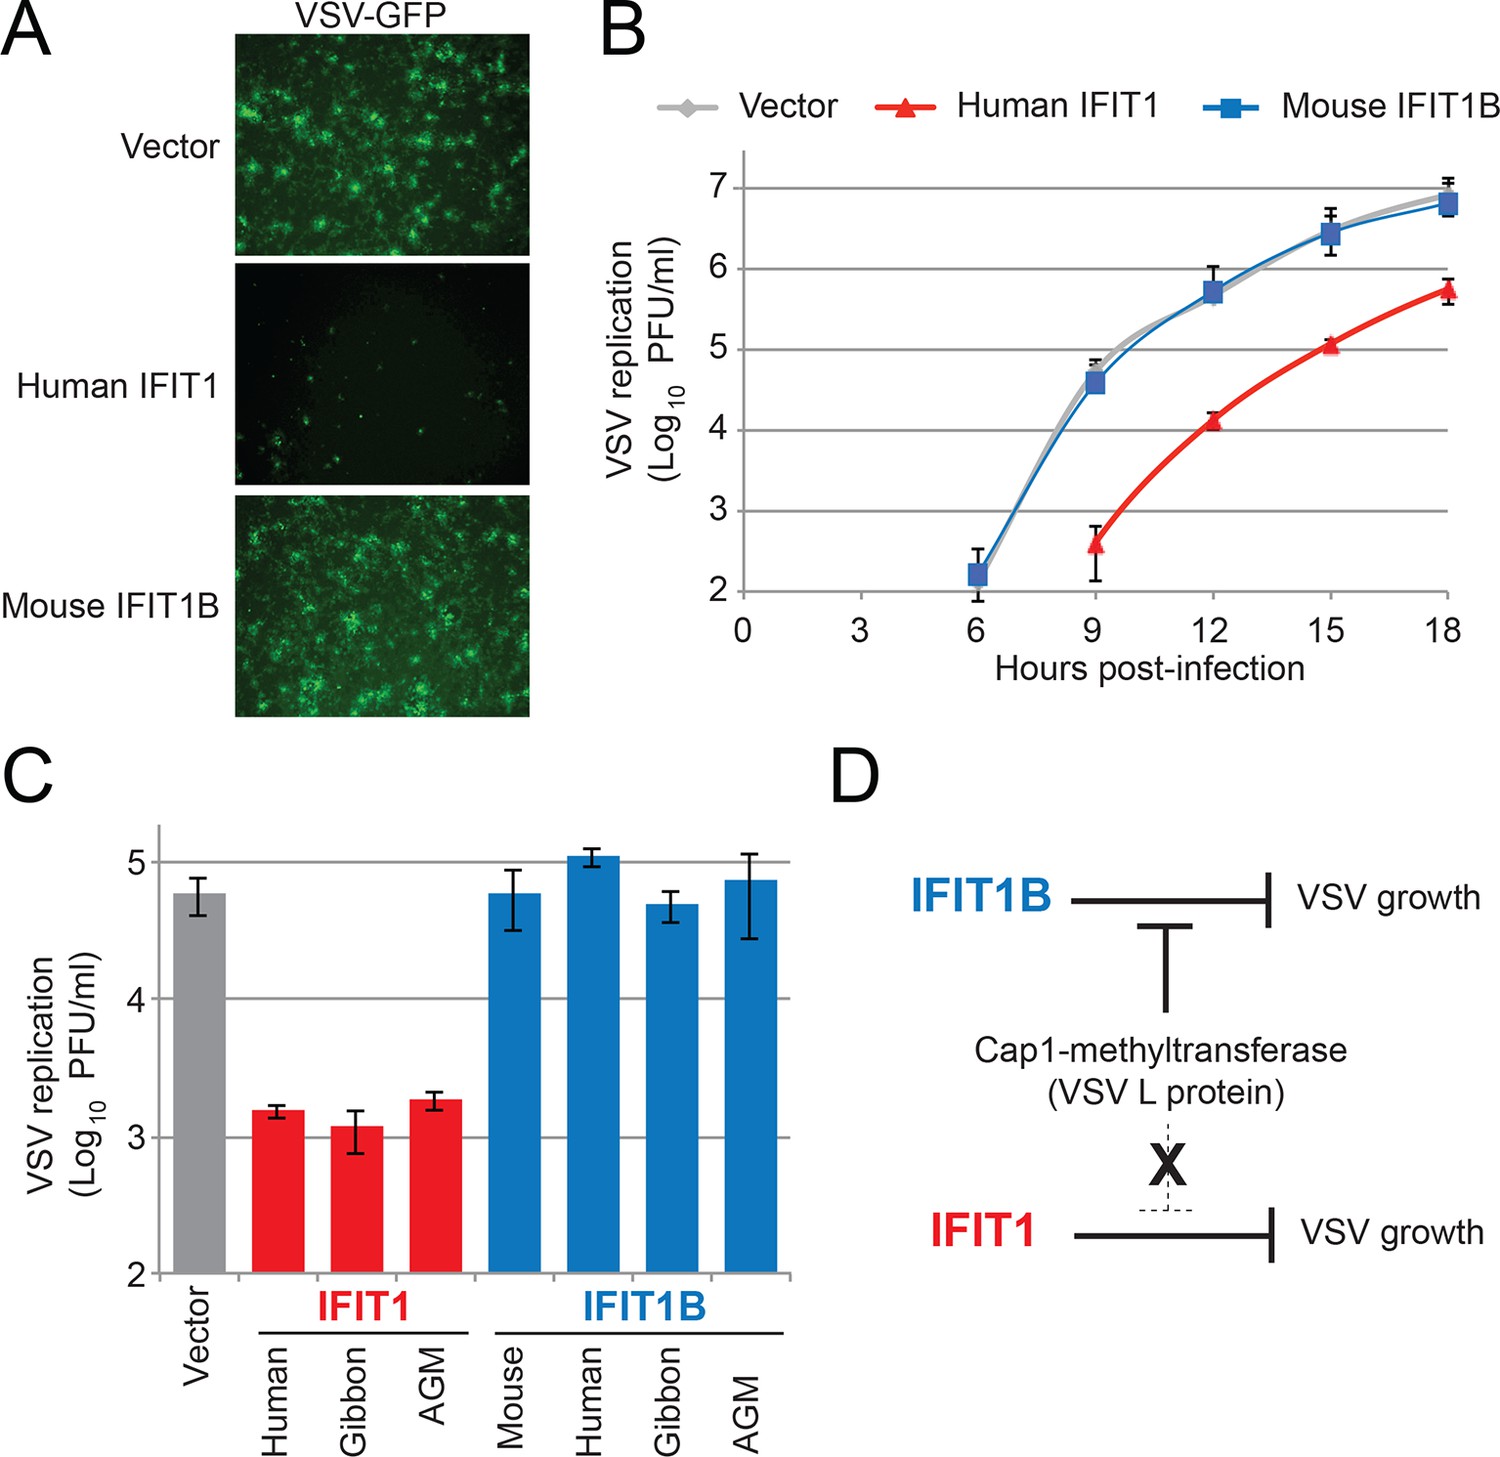
IFIT1, but not IFIT1B, inhibits replication of VSV, a cap1-containing virus.
(A) Cell lines were infected with vesicular stomatitis virus (VSV) encoding a GFP protein at an MOI of 0.01. After 12 hr, cells were visualized for expression of the virally-encoded GFP. (B) Infections were performed as in part A, but at the indicated timepoint, virus was harvested and titered. Error bars represent standard deviation of three biological replicates. (C) Infections were performed as in part A, harvested after 12 hr, and titered. Error bars represent standard deviation of three biological replicates. (D) In contrast to IFIT1B, IFIT1 inhibits VSV growth arrest regardless of the fact that cap1-methyltransferase is present.
Additional files
-
Supplementary file 1
IFIT sequences and accession numbers used for phylogenetic studies.
- https://doi.org/10.7554/eLife.14228.020
-
Supplementary file 2
Oligonucleotides used for cloning and manipulation of IFIT genes.
- https://doi.org/10.7554/eLife.14228.021
Download links
A two-part list of links to download the article, or parts of the article, in various formats.
Downloads (link to download the article as PDF)
Open citations (links to open the citations from this article in various online reference manager services)
Cite this article (links to download the citations from this article in formats compatible with various reference manager tools)
Evolution-guided functional analyses reveal diverse antiviral specificities encoded by IFIT1 genes in mammals
eLife 5:e14228.
https://doi.org/10.7554/eLife.14228


