Serial grouping of 2D-image regions with object-based attention in humans
- Royal Netherlands Academy of Arts and Sciences, The Netherlands
- Academic Medical Center, The Netherlands
- Vrije Universiteit Amsterdam, The Netherlands
Figures
Figure 1
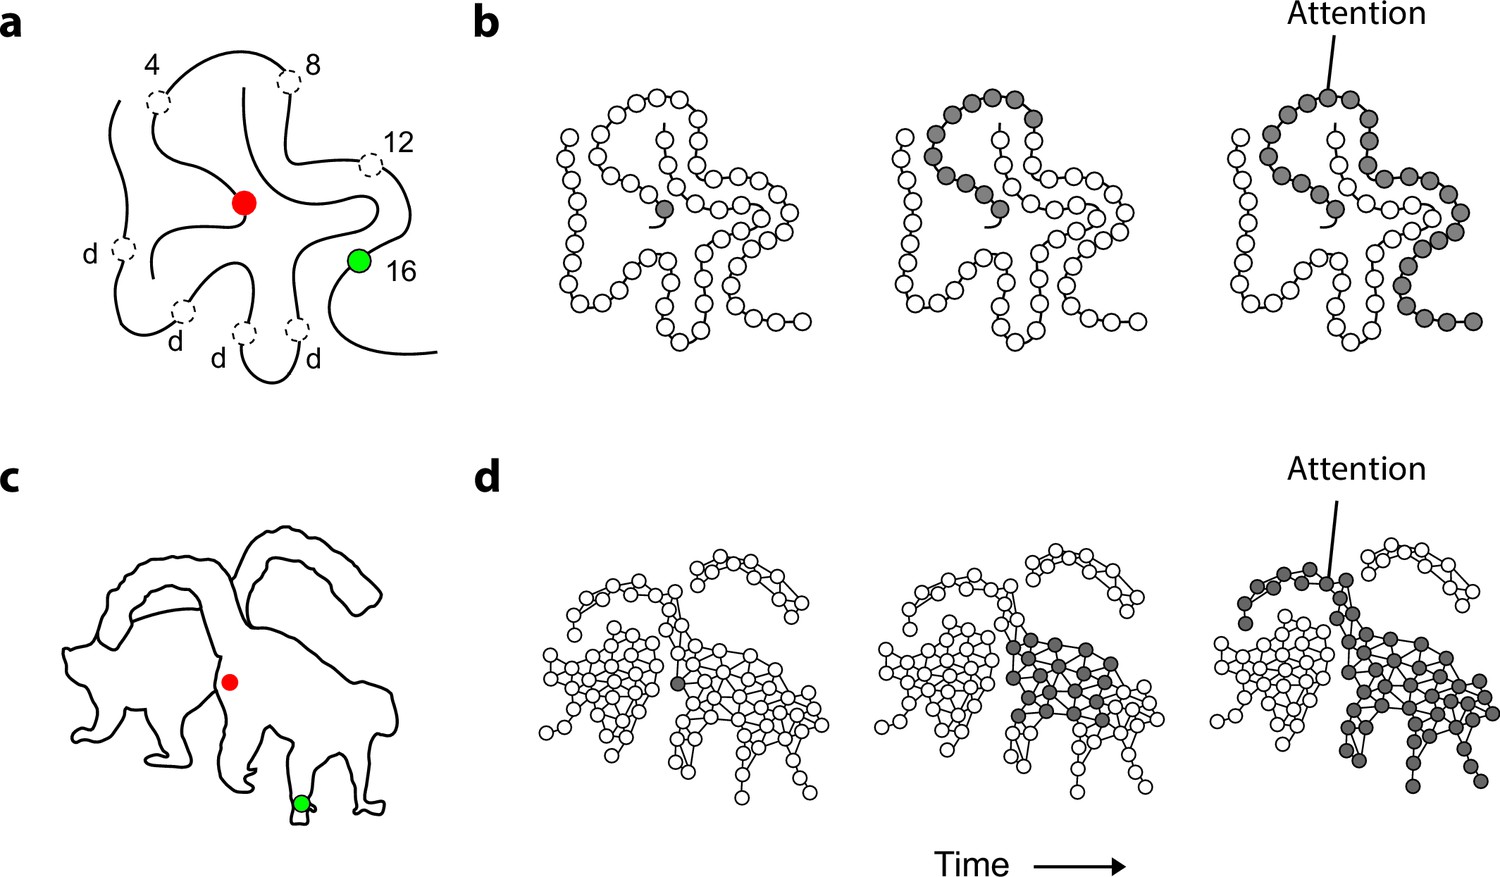
Mechanism of perceptual grouping.
(a) Perceptual grouping of contour elements calls on a serial process as illustrated with a curve-tracing task. The actual stimulus contains one cue (green, dashed circles show other possible cue locations) and the participant indicates whether it falls on the same curve or on the other curve (points labeled ‘d’) as the fixation point. Reactions times increase linearly with the distance between the fixation point and the second cue on the same object (here 4, 8, 12, or 16 degrees) (Jolicoeur et al., 1986). (b) Perceptual grouping corresponds to spreading object-based attention over the curve. Cortical neurons propagate an enhanced firing rate of cells over the representation of the relevant curve in the visual cortex (Roelfsema, 2006). (c) An example stimulus of a 2D shape for which we measure the time course of perceptual grouping. (d) We tested the hypothesis that grouping of 2D shapes also requires a serial grouping operation.
Figure 2
Model predictions.
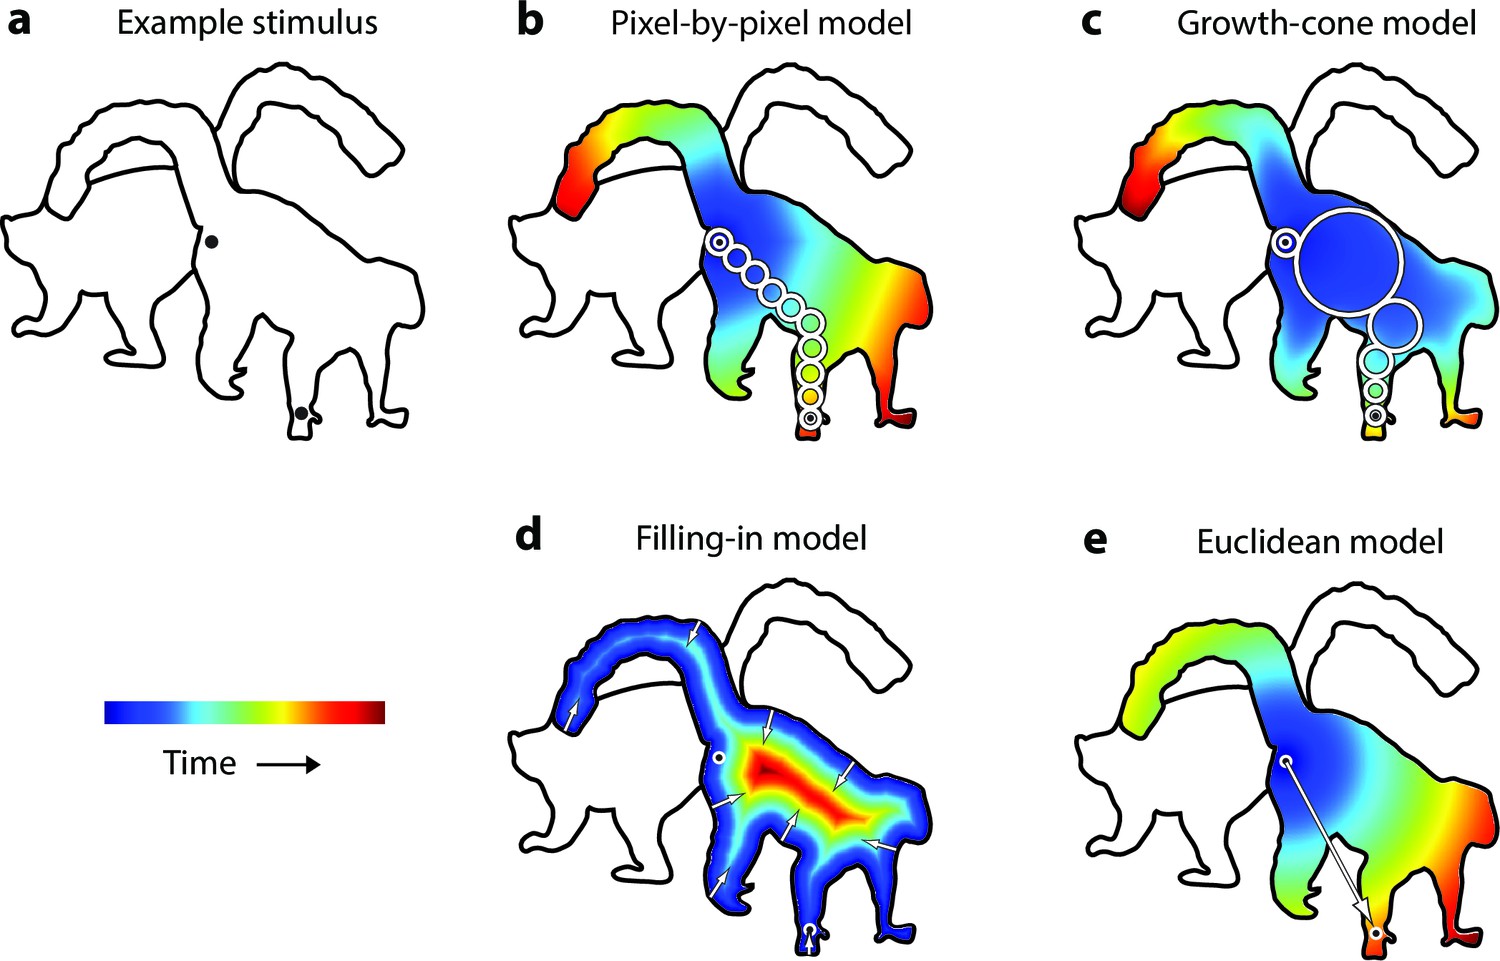
(a) An example stimulus. The participant indicates if the cues (black dots) fall on the same or different shapes. (b) The pixel-by-pixel model predicts that the RT depends on the shortest path within the interior of the image region. (c) The growth-cone model holds that the speed of the grouping signal also depends on the size of homogeneous image regions. (d) The filling-in model predicts that the grouping signal spreads inwards from the boundaries. (e) The Euclidean model holds that reaction time depends on the distance between cues (i.e., the eccentricity of the second cue).
Figure 3
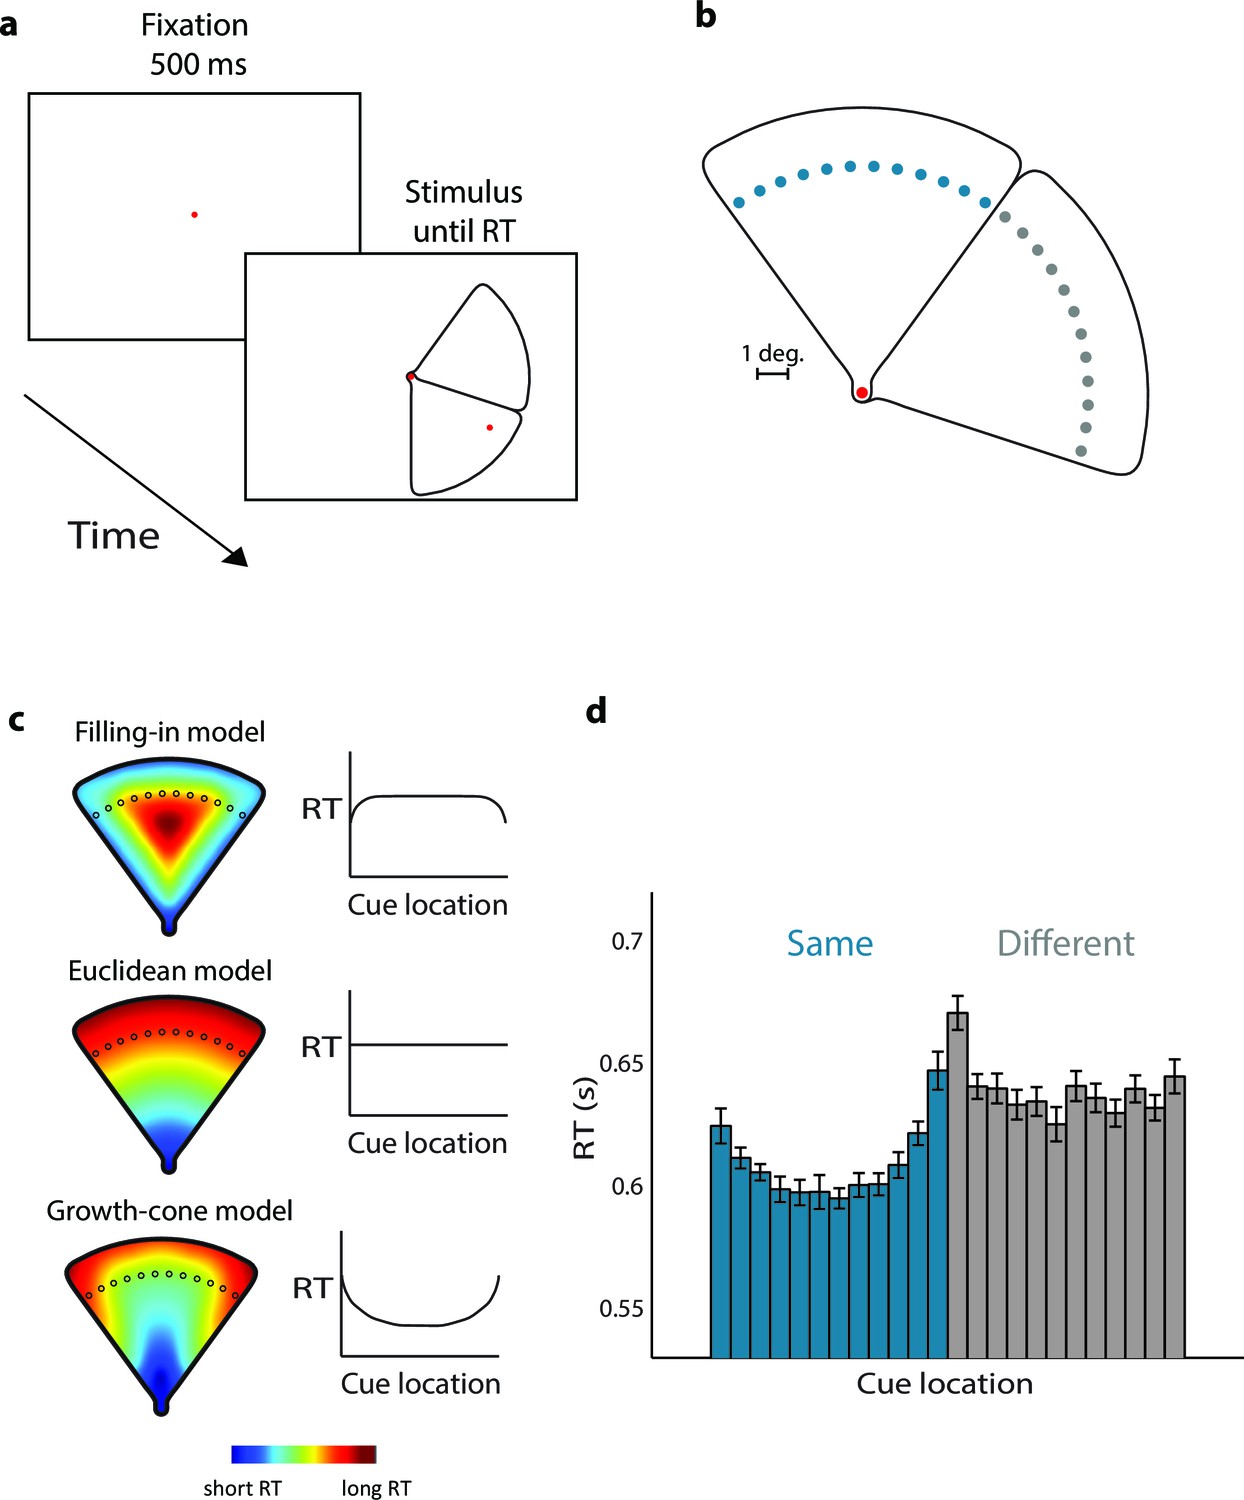
Parsing a wedge-shaped object (Experiment 1A).
(a) Trial structure. After a fixation period of 500 ms, we presented two wedges and a cue. The subjects reported whether the cue fell on the same wedge as the fixation point. (b) The second cue could fall on the same (blue dots) or different wedge as fixation point (grey dots). The cues in the actual experiment were red. (c) RT predictions of the filling-in model, Euclidean model, and growth-cone model. (d) Average RTs of 20 observers. Blue bars, RTs for the same object; grey bars, RTs for the different object. Error bars, s.e.m. across participants (after correction for baseline differences in RT).
Figure 4
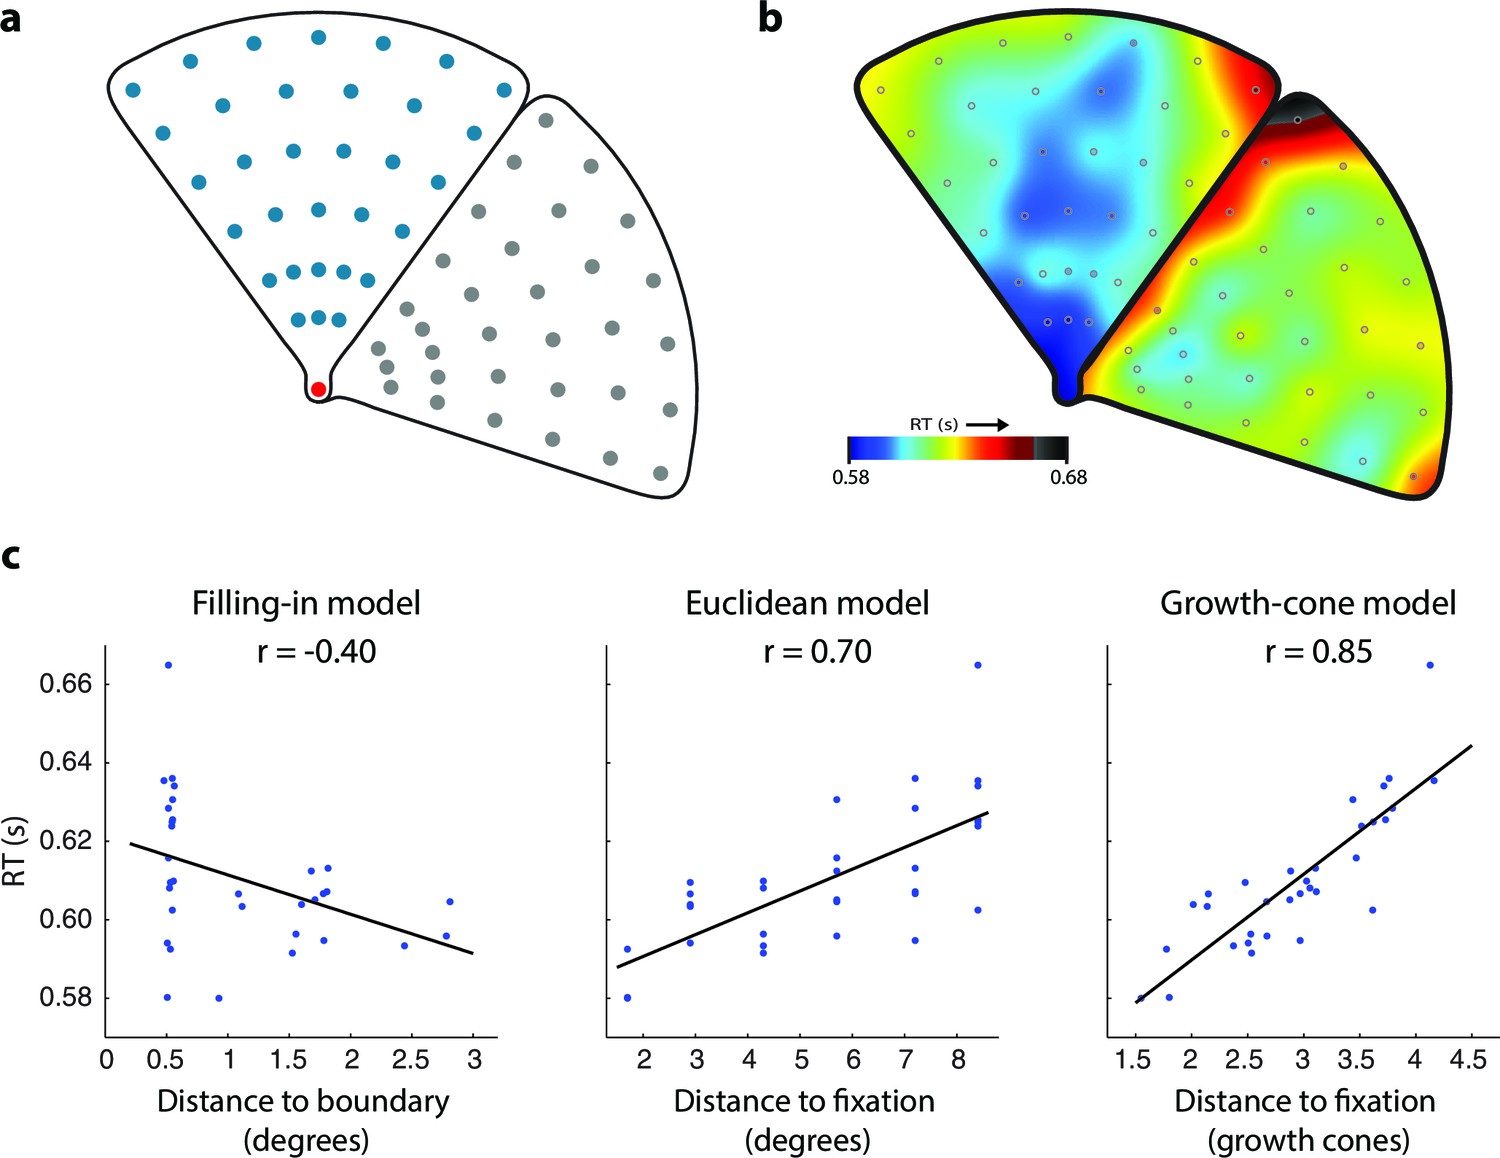
Time course of grouping a simple, wedge-shaped object (Experiment 1B).
(a) In Experiment 1B cue locations were at multiple eccentricities on the same (blue) or different object (grey). (b) The pattern of RTs. Cold and warm colors show short and long RTs, respectively. (c) Regression analysis showing the fit of the models to the RT data. The growth-cone model explains 72% of the variance (r=0.85) and is superior to the other models.
Figure 5 with 1 supplement
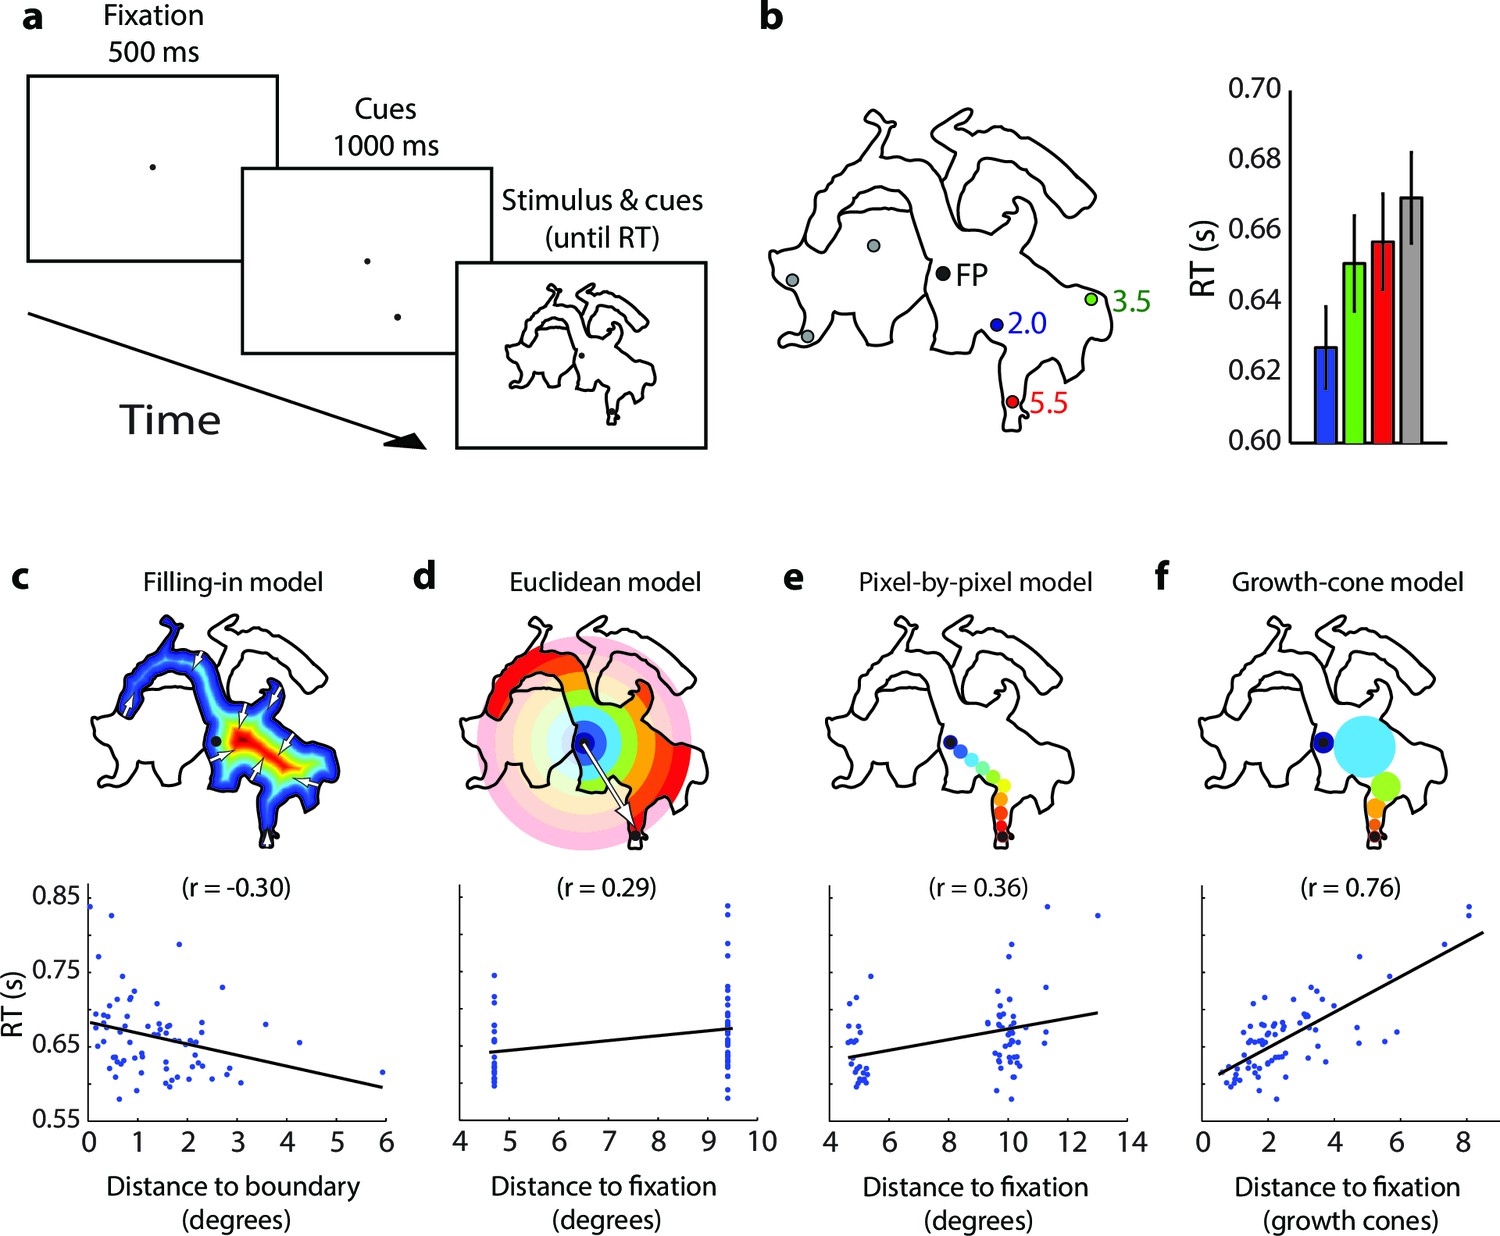
Time course of parsing scrambled cartoons (Experiment 2) (the actual stimuli were white outlines on a black background).
(a) After a fixation epoch of 500 ms, the subjects saw the cue for 1000 ms, and then also two objects. They reported whether the cue fell on the same object as the fixation point. (b) Left, Example stimulus. FP, fixation point. Numbers indicate the estimated number of growth cones between the cues and the FP. Right, RTs averaged across participants for the different cue locations. Error bars represent s.e.m. (c-f) Regression of the RT on the predictions of the filling-in (c), Euclidean (d), pixel-by-pixel (e), and growth-cone model (f).
Figure 5—figure supplement 1
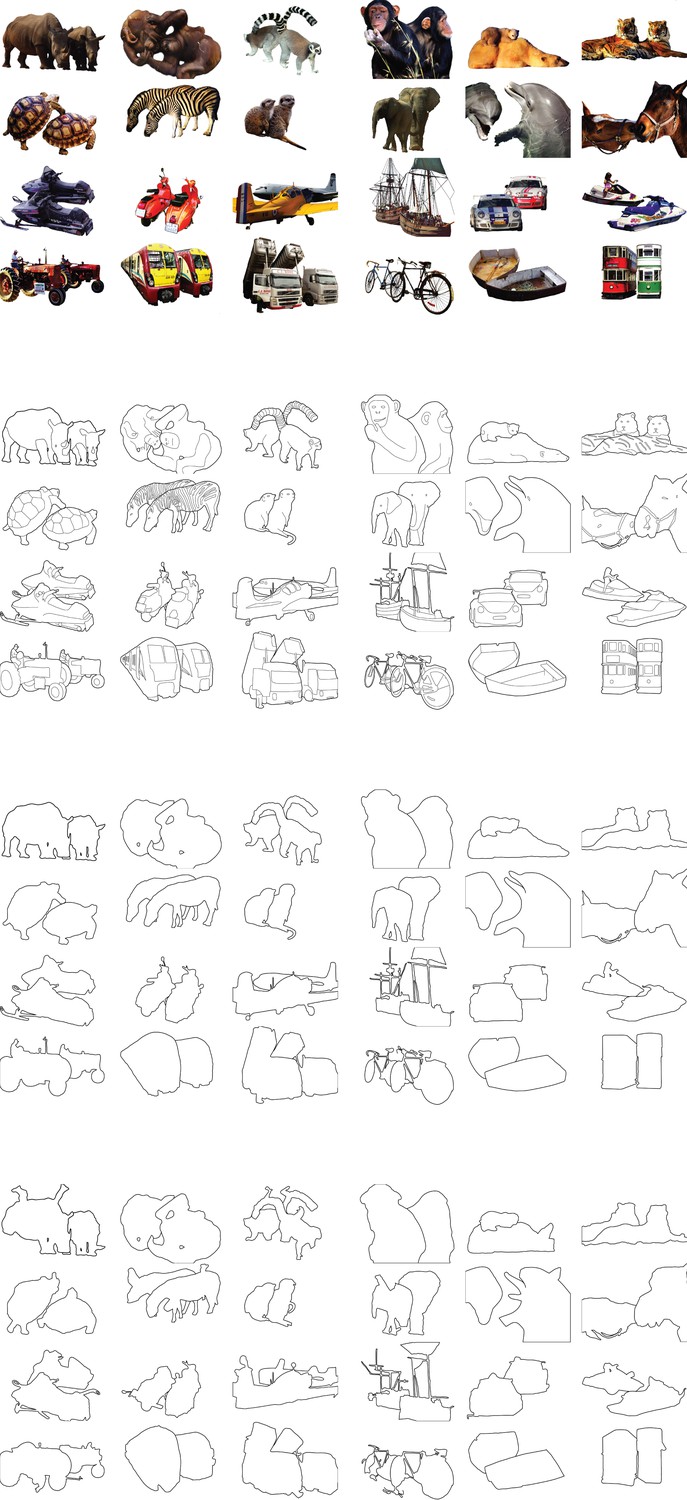
The full stimulus set for Experiment 2.
https://doi.org/10.7554/eLife.14320.008
Figure 6
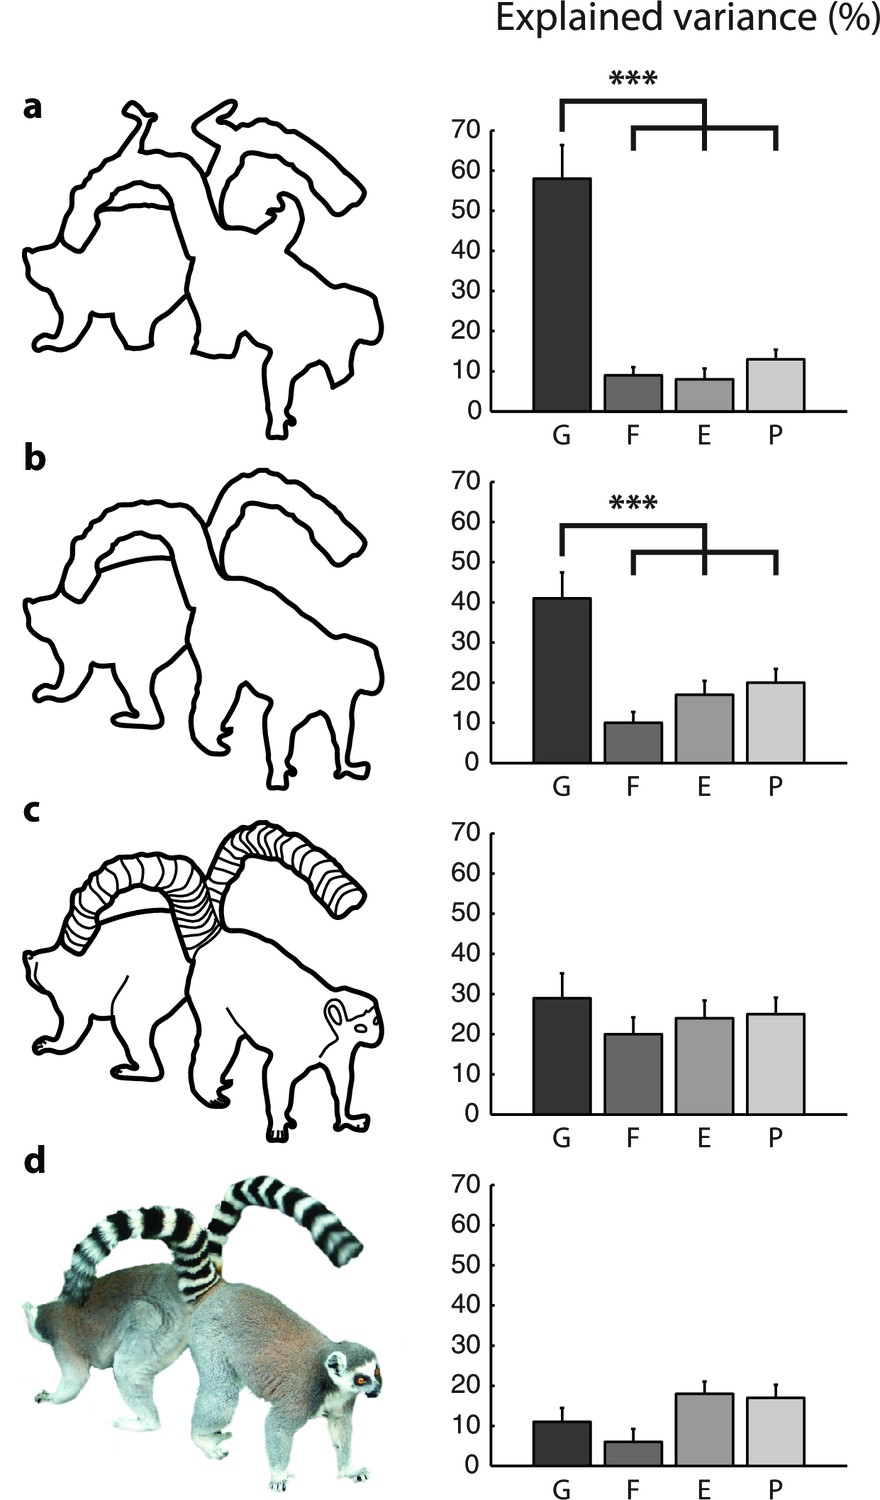
Model fits for the different types of images (Experiment 2).
The bars show the variance in RT explained by the different models for (a) scrambled cartoons; (b) cartoon outlines; (c) detailed cartoons; and (d) color pictures. G, growth-cone; F, filling-in; E, Euclidean; P, pixel-by-pixel model. Asterisks (***) represent p<0.01 (bootstrap test).
Figure 7
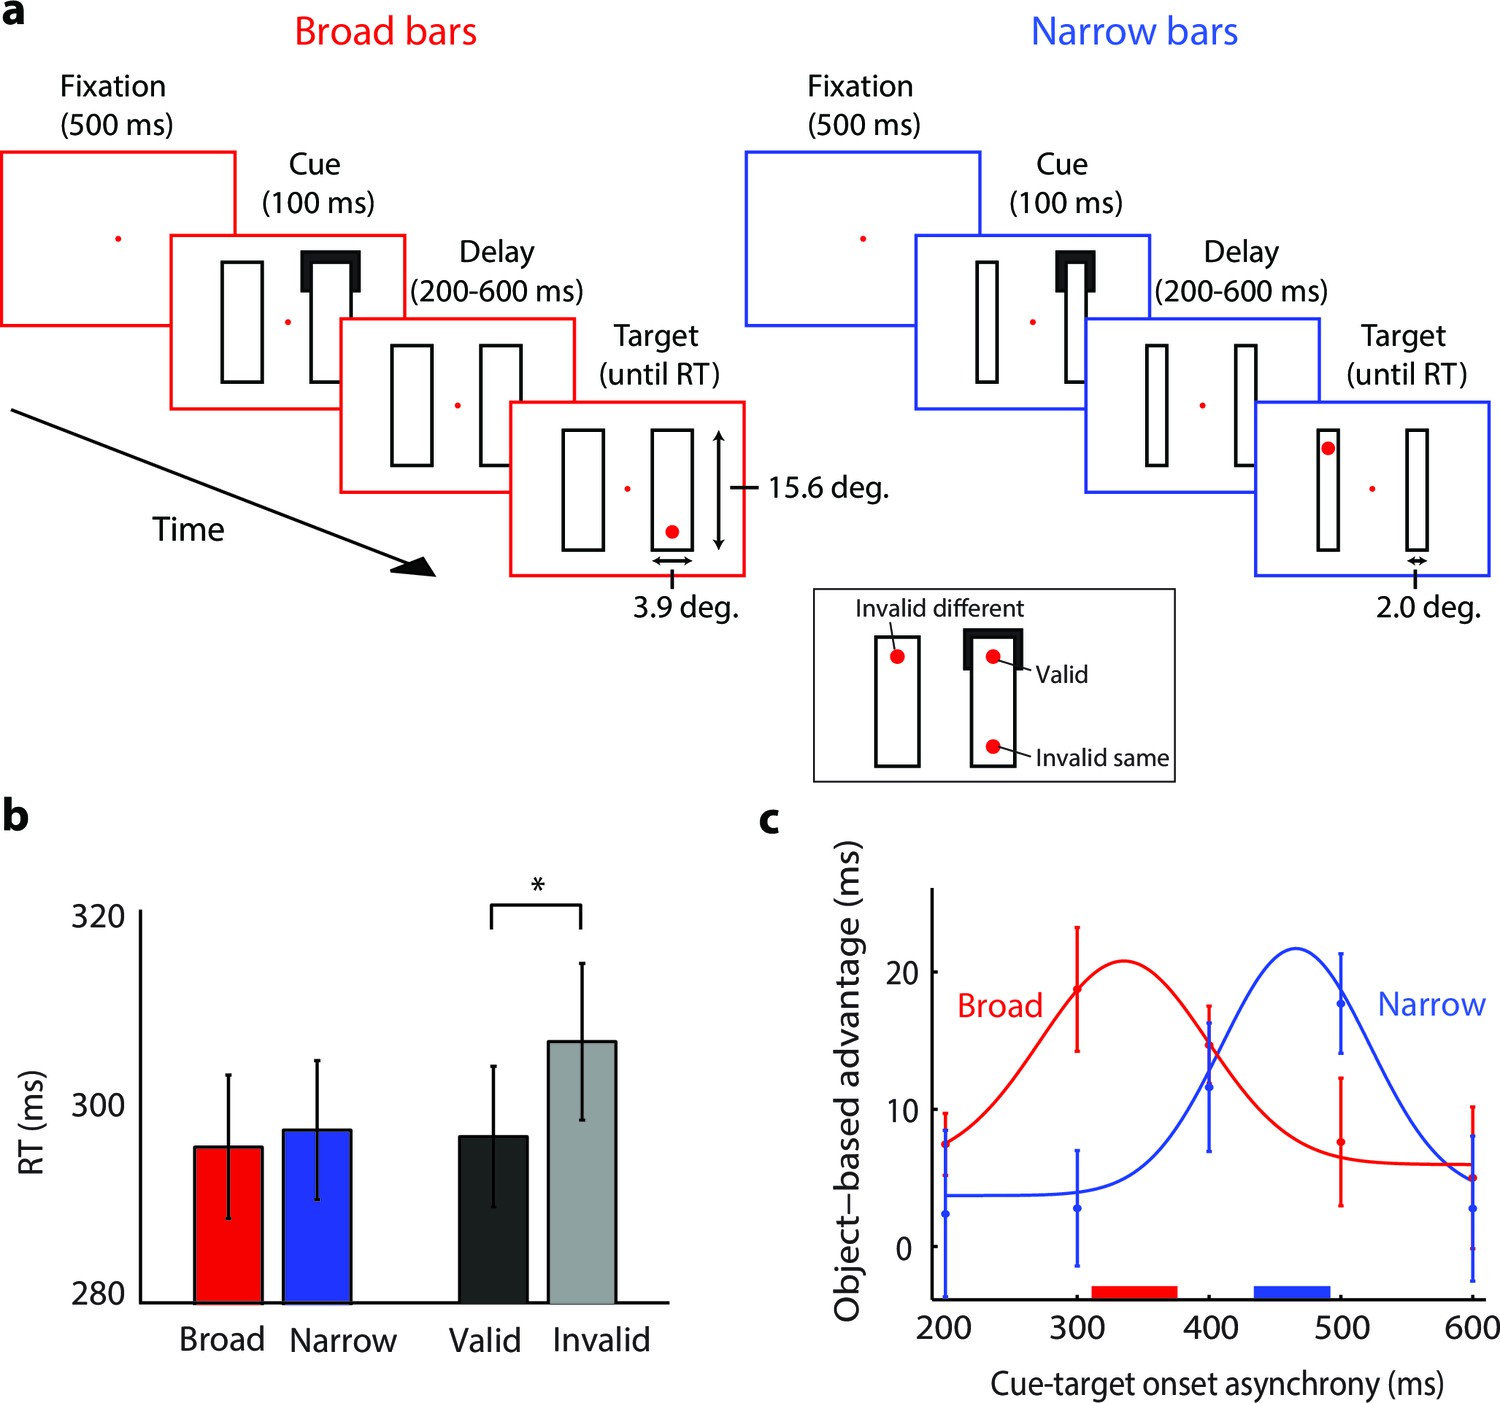
The time-course of spreading object-based attention (Experiment 3; actual stimuli were white on a black background).
(a) We presented two broad (left) or narrow bars (right) and one bar was cued at one of its ends for 100 ms. After a variable delay, we presented a target dot at the cued location (valid trials, see inset) or at one of two locations that were equidistant from the cue, on the same (invalid same) or on the other bar (invalid different), i.e. only one target dot per trial. In catch trials (not shown), the target did not appear. (b) Reaction times for the validly cued trials for the broad (red) and narrow bars (blue) did not differ (t-test, p>0.1). Reaction times for the validly (black) cued locations were faster than those for the invalidly (grey) cued locations (*, p<0.01 in t-test). (c) The object-based advantage (RTinvalid different – RTinvalid same) as a function of cue-target onset asynchrony. The curves show the fit of Gaussian functions to the object-based advantage for the broad (red) and narrow bars (blue), respectively. The red and blue horizontal bars on the x-axis indicate the 95% confidence interval of the peak of the Gaussian function as measured with a bootstrap method. Error bars represent s.e.m. of the data points.
Figure 8
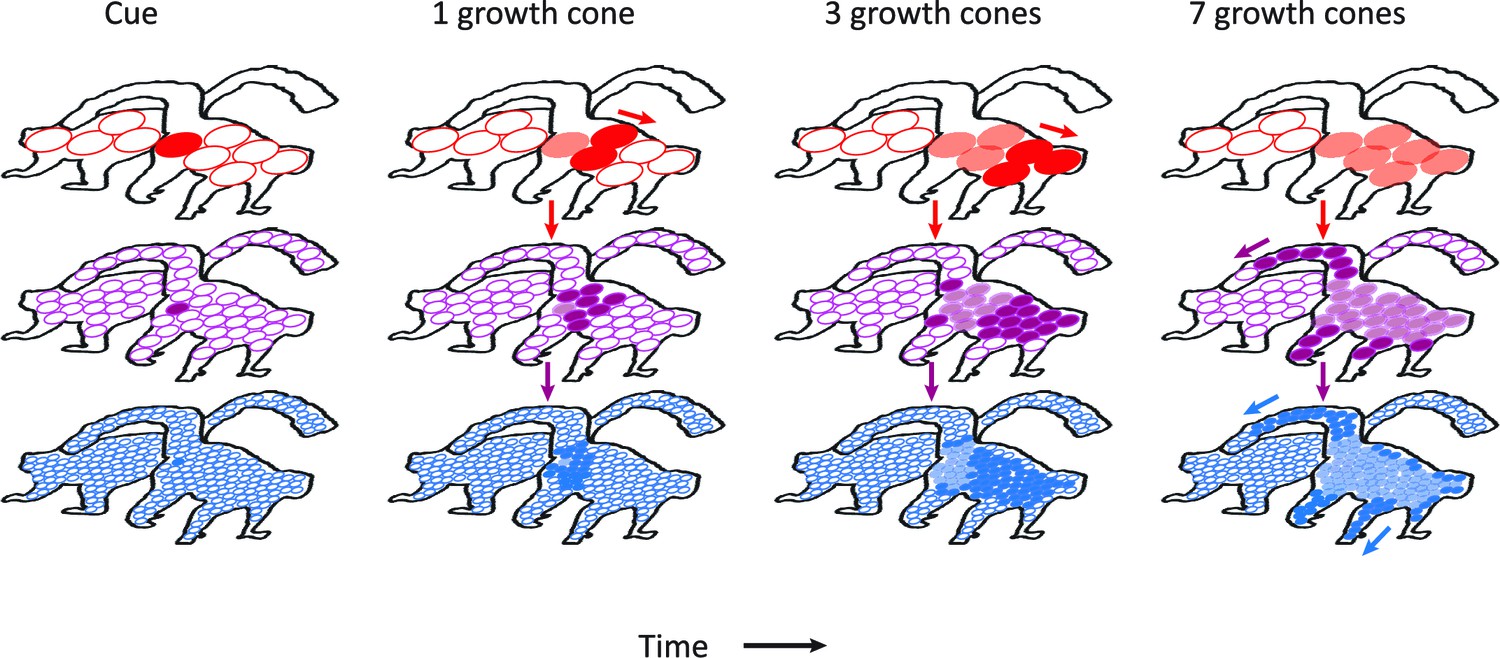
Schematic representation of the contribution of different visual areas to perceptual grouping.
Horizontal rows illustrate low-, mid-, and high-level visual areas with larger receptive fields in higher areas. The four columns illustrate different time steps during the grouping process; after the presentation of the cue, and after 1, 3 and 7 growth-cone shifts. The labeling process begins at the cued location. Higher cortical areas with large receptive fields make great strides in the propagation of enhanced neuronal activity and this fast progress also impacts on lower areas through feedback connections (downward pointing arrows). However, the higher visual areas cannot resolve fine-scale details and the grouping of narrower image regions therefore relies on the propagation of enhanced neuronal activity in lower visual areas with smaller receptive fields. Darker colors represent image regions that have been recently reached by the grouping process and lighter colors denote image regions that were labeled at an earlier point in time. White circles represent receptive fields that have not been reached by the grouping process. Note that the labeling process is serial and that the speed of grouping depends on the size of the receptive fields that contribute to the grouping process.
Author response image 1
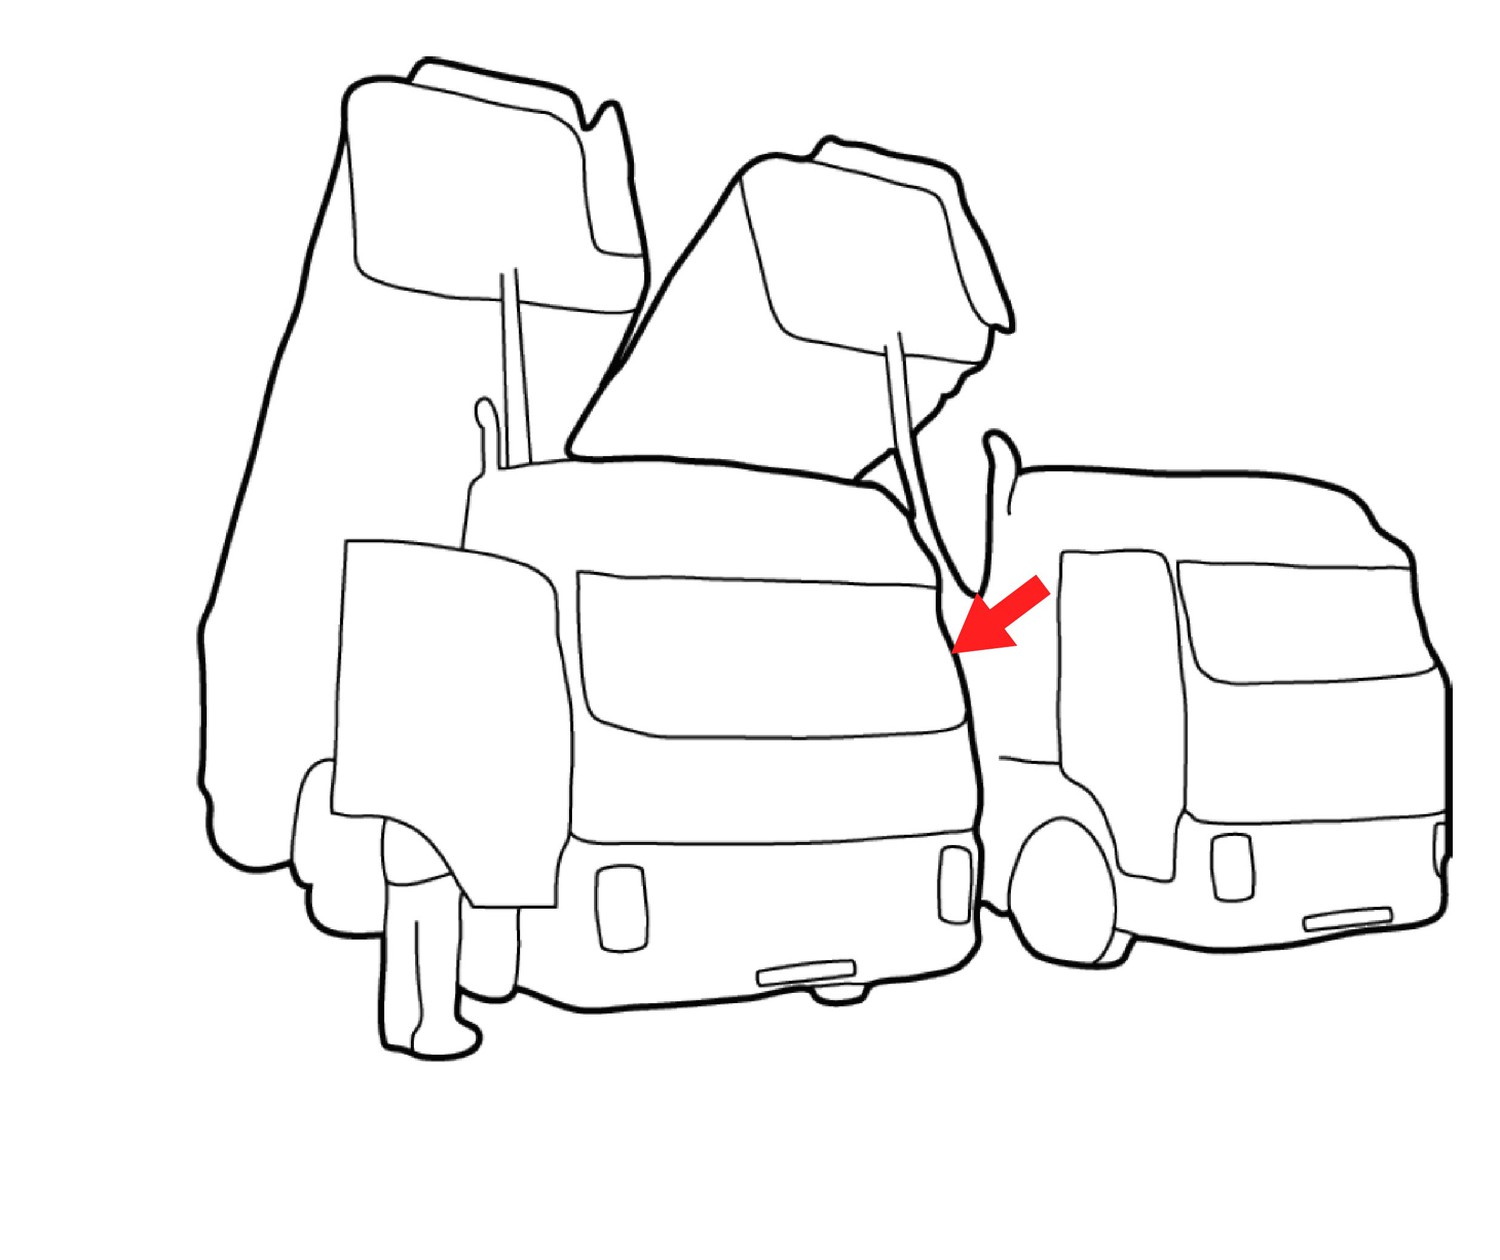
We see that the contour indicated by the red arrow is part of the left truck.
The correct assignment of this contour depends on knowledge about the shape of a truck. Image parsing based on shape knowledge is called “semantic segmentation”.
Download links
A two-part list of links to download the article, or parts of the article, in various formats.
Downloads (link to download the article as PDF)
Open citations (links to open the citations from this article in various online reference manager services)
Cite this article (links to download the citations from this article in formats compatible with various reference manager tools)
Serial grouping of 2D-image regions with object-based attention in humans
eLife 5:e14320.
https://doi.org/10.7554/eLife.14320


