Analysis of protein phosphorylation in nerve terminal reveals extensive changes in active zone proteins upon exocytosis
- Max Planck Institute for Biophysical Chemistry, Germany
- National University of Singapore, Singapore
- University Medical Center Göttingen, Germany
Figures
Figure 1
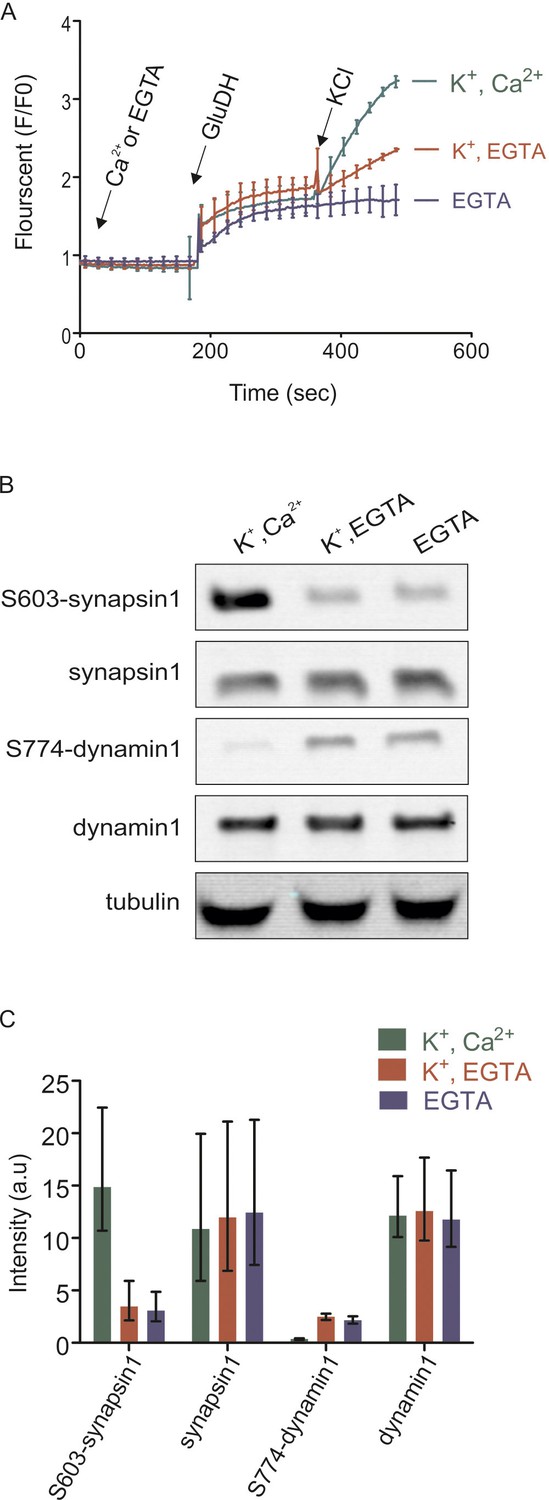
Isolated synaptosomes are responsive to stimulations.
(A) Glutamate release by synaptosomes, monitored by enzymatic conversion of glutamate by glutamate dehydrogenase (GluDH) (see Materials and methods). The functionality of isolated synaptosomes was also assessed by immunoblot detection of phosphorylated Ser603 of synapsin1 and Ser774 of dynamin1 (B and C). (A) Synaptosomes were preincubated in buffer containing either Ca2+ (final concentration 1.3 mM) or EGTA (final concentration 0.5 mM), followed by sequential addition of GluDH (200 U) and KCl (K+) for depolarization (final concentration 50 mM) or not stimulated (no K+ was added). Data represented as mean of three replicates, with the bars indicating the range of values. (B and C) Immunoblot analyses of phosphorylation changes in synapsin1 (Ser603) and dynamin1 (Ser774). Synaptosomes monitored and treated 2 min after addition of KCl as described in (A) were analyzed by immunoblotting using phosphospecific antibodies. (B) Representative immunoblots. To ensure equal loading, all samples were also blotted using antibodies insensitive to phosphorylation change, and tubulin as a loading control. (C) Quantification of the blot signals obtained from three independent experiments shown as the mean of the three replicates, with the error bars indicating the range of values.
Figure 2 with 5 supplements
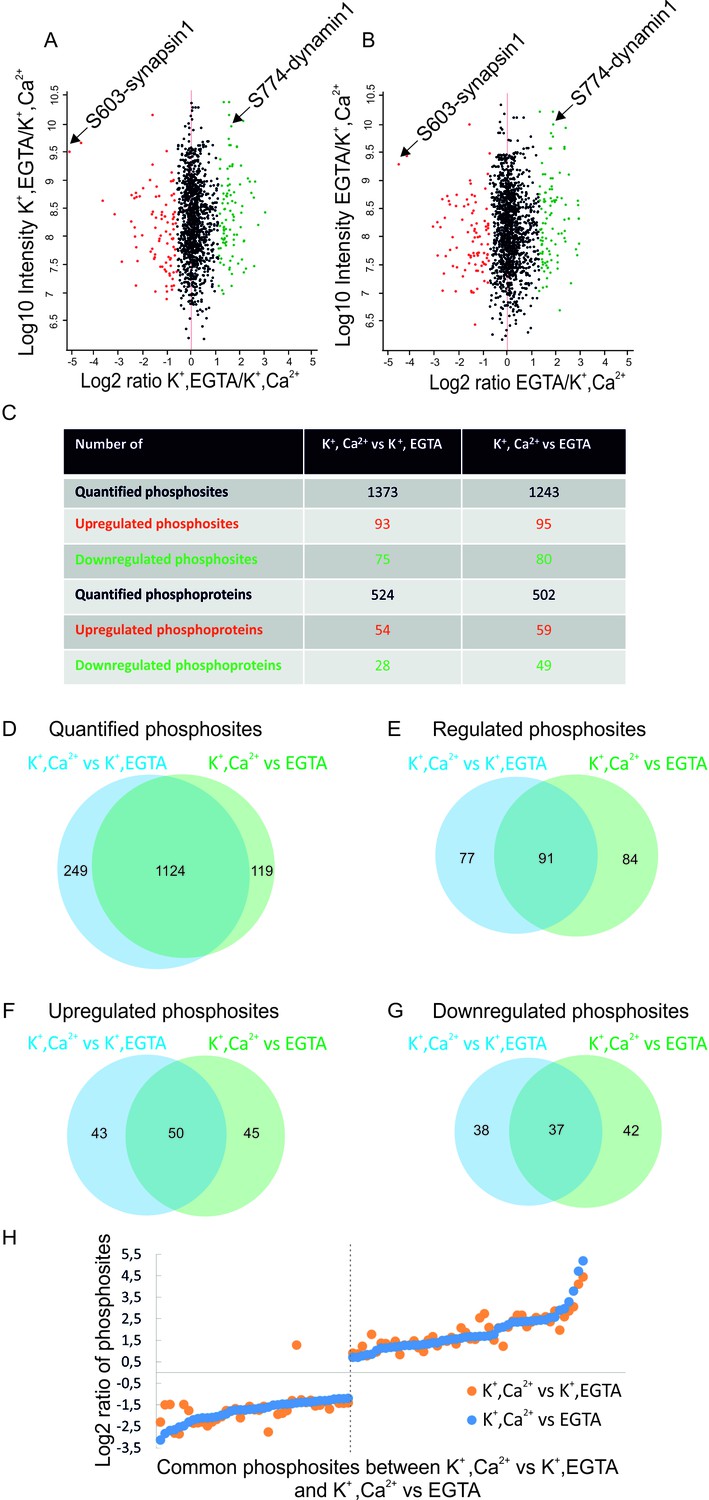
Overview of the quantified phosphosites identified in resting and stimulated synaptosomes.
Distribution of quantified phosphosites from pair-wise comparisons of (A) depolarization with Ca2+ versus depolarization without Ca2+ (K+, Ca2+ versus K+, EGTA) (B) depolarization with Ca2+ versus no depolarization (K+, Ca2+ versus EGTA). Quantifications were done by dimethyl labeling and significant outliers were determined using the Perseus module based on two-tailed ‘Significant A’ test (p-value ≤0.05) (see Materials and methods). Red dots represent upregulated phosphosites, green dots represent downregulated sites when comparing depolarization in the presence to absence of Ca2+. Positions represented by black dots did not change (C) Number of quantified, up- or down-regulated phosphosites and phosphoproteins in the two comparisons. (D–G) The proportional Venn diagrams show the overlap of quantified phosphosites (D), regulated phosphosites (E), upregulated phosphosites (F) and downregulated phosphosites (G) between the two conditions indicated above. (H) Plot comparing the extent of stimulation-dependent phosphorylation changes with respect to non-depolarized and depolarized control samples. All regulated phosphosites shared between K+, Ca2+ versus K+, EGTA and K+, Ca2+ versus EGTA comparisons are depicted.
Figure 2—figure supplement 1
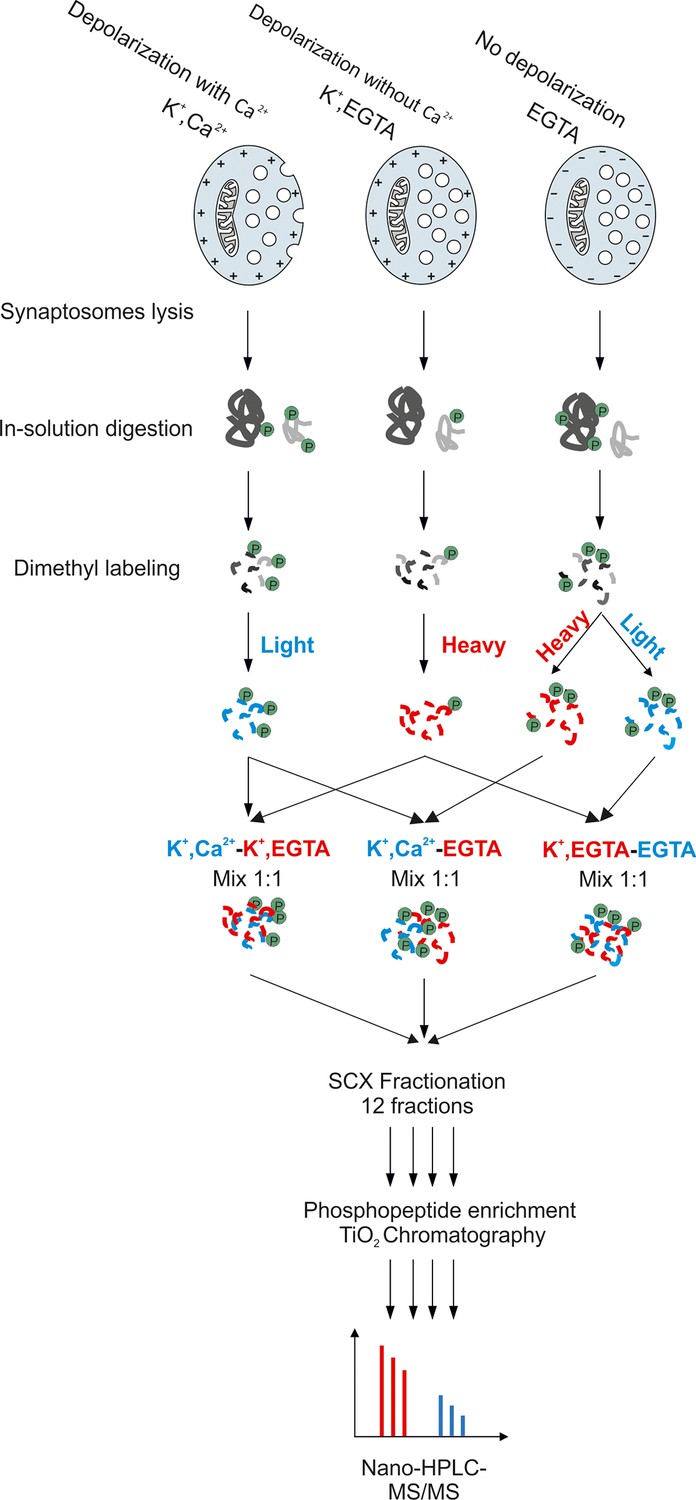
Workflow for large-scale quantitative phosphoproteomics of synaptosomes.
Synaptosomal proteins were extracted by lysis of synaptosomes and acetone precipitation. The protein pellets were dried, resuspended in 1% RapiGest buffer and digested by trypsin. Peptides were labeled with heavy and light dimethyl labeling (Boersema et al., 2009). To obtain pair-wise comparisons between the three conditions, samples were mixed with a ratio of 1:1. The mixed peptides were separated by strong cation exchange (SCX) chromatography, with the eluate being divided into 12 fractions. Phosphopeptides in each fraction were separately enriched by TiO2 microbeads (Larsen et al., 2005) and subjected for mass spectrometry analysis.
Figure 2—figure supplement 2
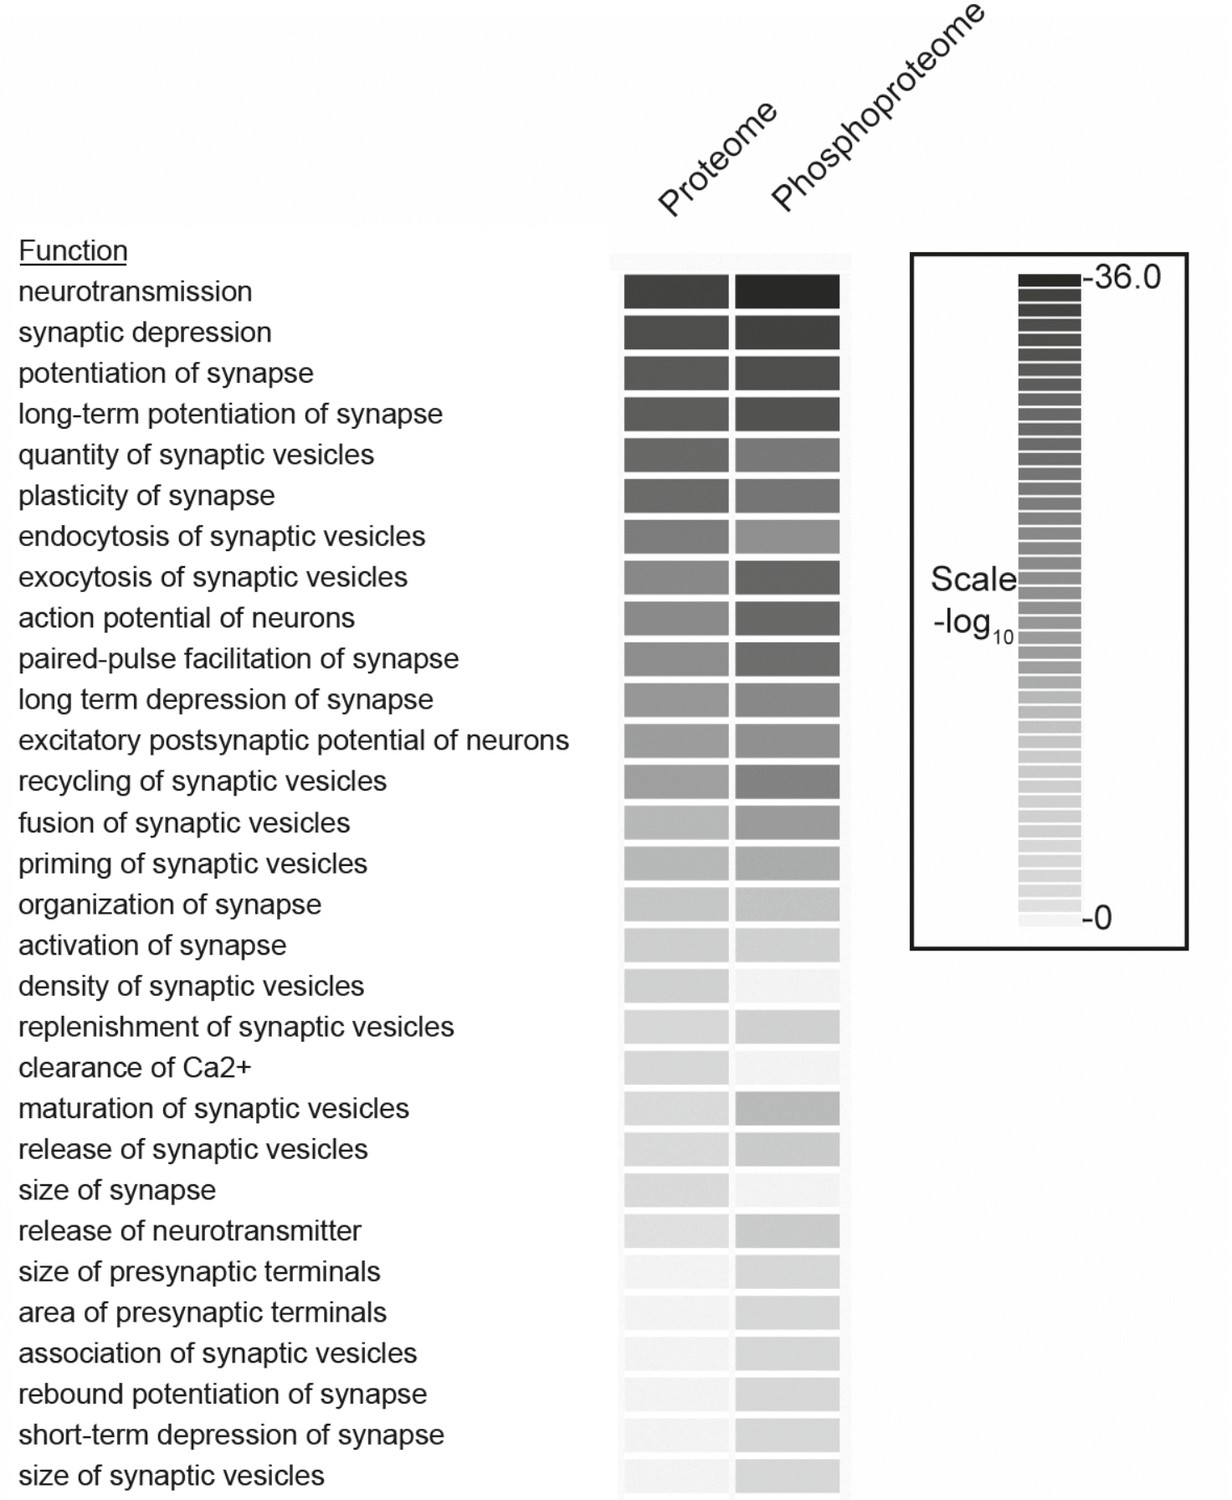
Comparison of functional categories for proteins identified in the phosphoproteome versus the proteome of synaptosomes.
The comparison analysis function of Ingenuity Pathway Analysis tools was used to determine the biological functions that are significantly enriched between proteome and phosphoproteome datasets. The functions with p-value more than 0.01 were included in the analyses. Redundant functions and additional functions related to neuronal disease and neuronal development related functions were manually filtered.
Figure 2—figure supplement 3
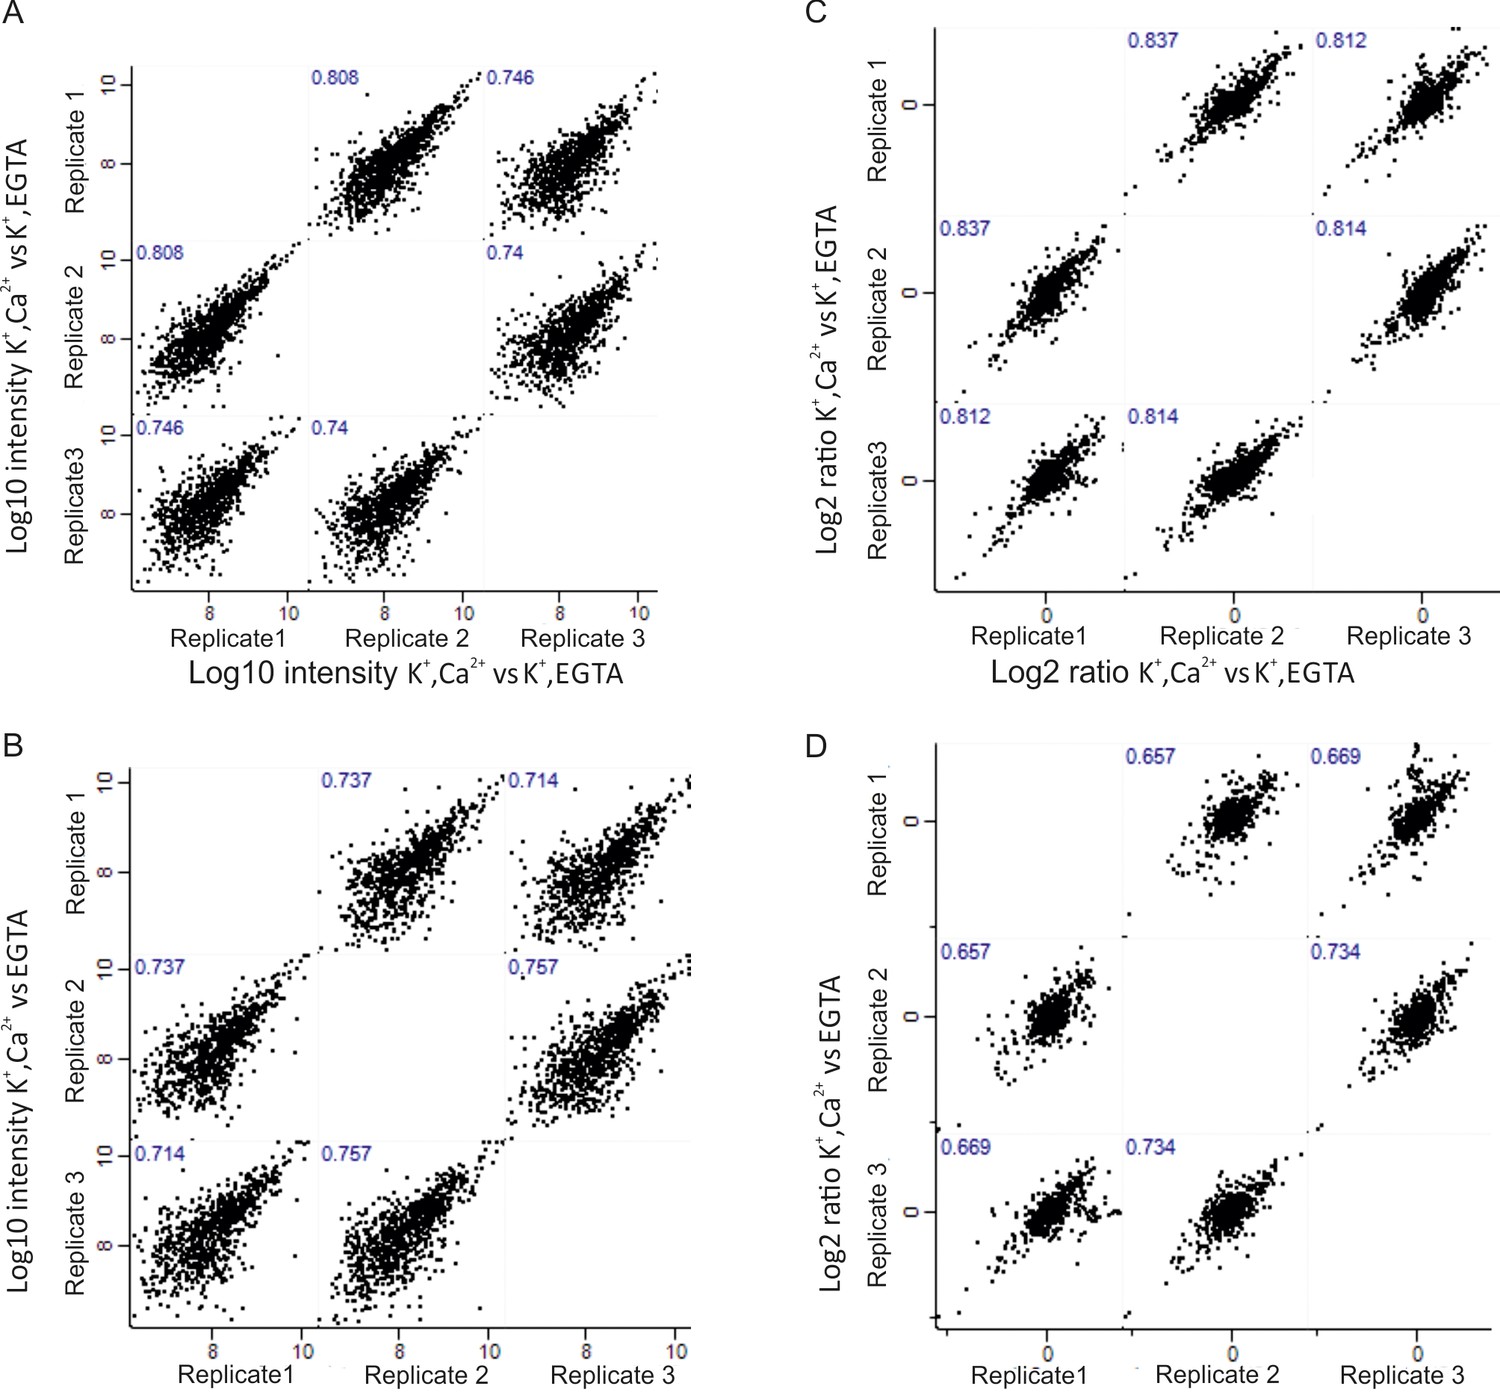
Correlation of phosphoproteome between biological replicates.
Correlation plots depicting correlation of phosphosite between three biological replicates at Log10 intensity level and Log2 ratio of H/L level in depolarization with Ca2+ versus depolarization without Ca2+ (K+, Ca2+ versus K+, EGTA) comparison (A, C), depolarization with Ca2+ versus no depolarization (K+, Ca2+ versus EGTA) (B, D).
Figure 2—figure supplement 4

Phosphorylation status and its change upon membrane depolarization.
Distribution of quantified phosphosites in the comparison between depolarized and non-depolarized synaptosomes in the presence of EGTA. Quantification was performed by dimethyl labeling and significant outliers were determined based on two-tailed ‘Significant A’ test; p-value ≤0.05 in the Perseus module. Red dots represent phosphosites that were upregulated, and, green dots represent sites that were downregulated during depolarization. Correlation plots are shown depicting correlation of phosphosite between three biological replicates at Log10 intensity (B) level and Log2 ratio (C) of H/L level.
Figure 2—figure supplement 5
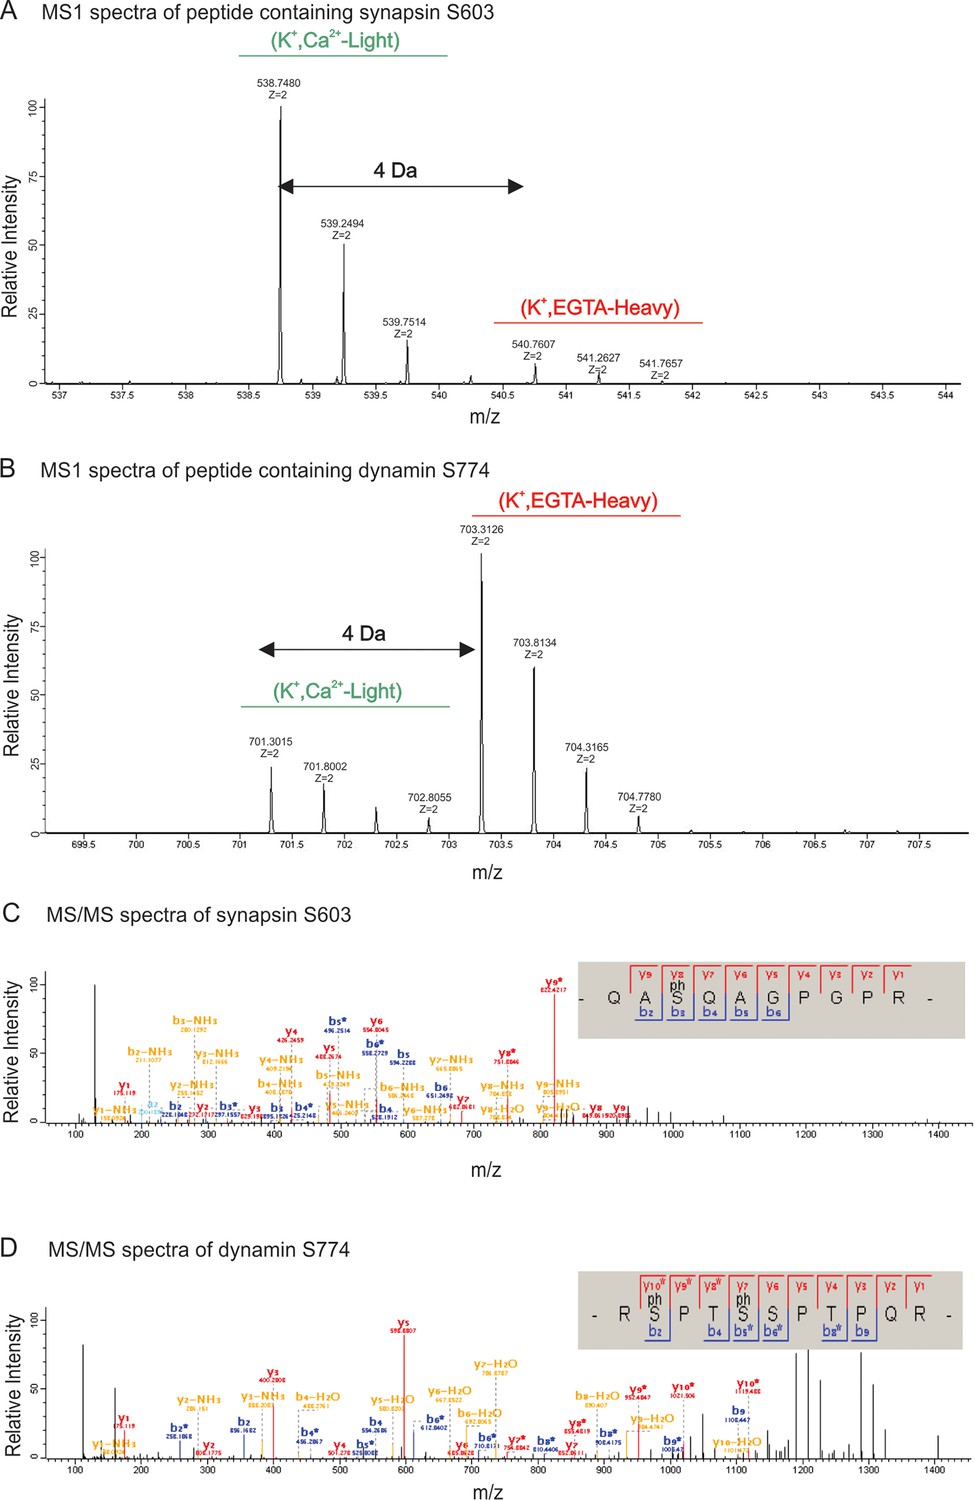
MS1 and MS/MS spectrum of synapsin Ser603 and dynamin Ser774.
Partial spectra of mass spectrometric survey scans in MS1 (precursor spectra) containing phosphopeptides of synapsin Ser603 (A) and dynamin S774 (B) in light (K+, Ca2+) and heavy (K+, EGTA) isotopic pattern that is used to calculated the relative abundances. MS/MS spectra resulting from HCD fragmentation of phosphopeptides containing synapsin Ser603 m/z 538.74782+ (C) and dynamin Ser774 m/z 703.21232+ (D), respectively, showing the phosphopeptides _QAS(ph)QAGPGPR_ and _RS(ph)PTS(ph)SPTPQR. Both of these phosphopeptides were eluted in the first fraction of SCX. MaxQuant Viewer (version 1.5.0.25) was used to illustrate the spectra.
Figure 3
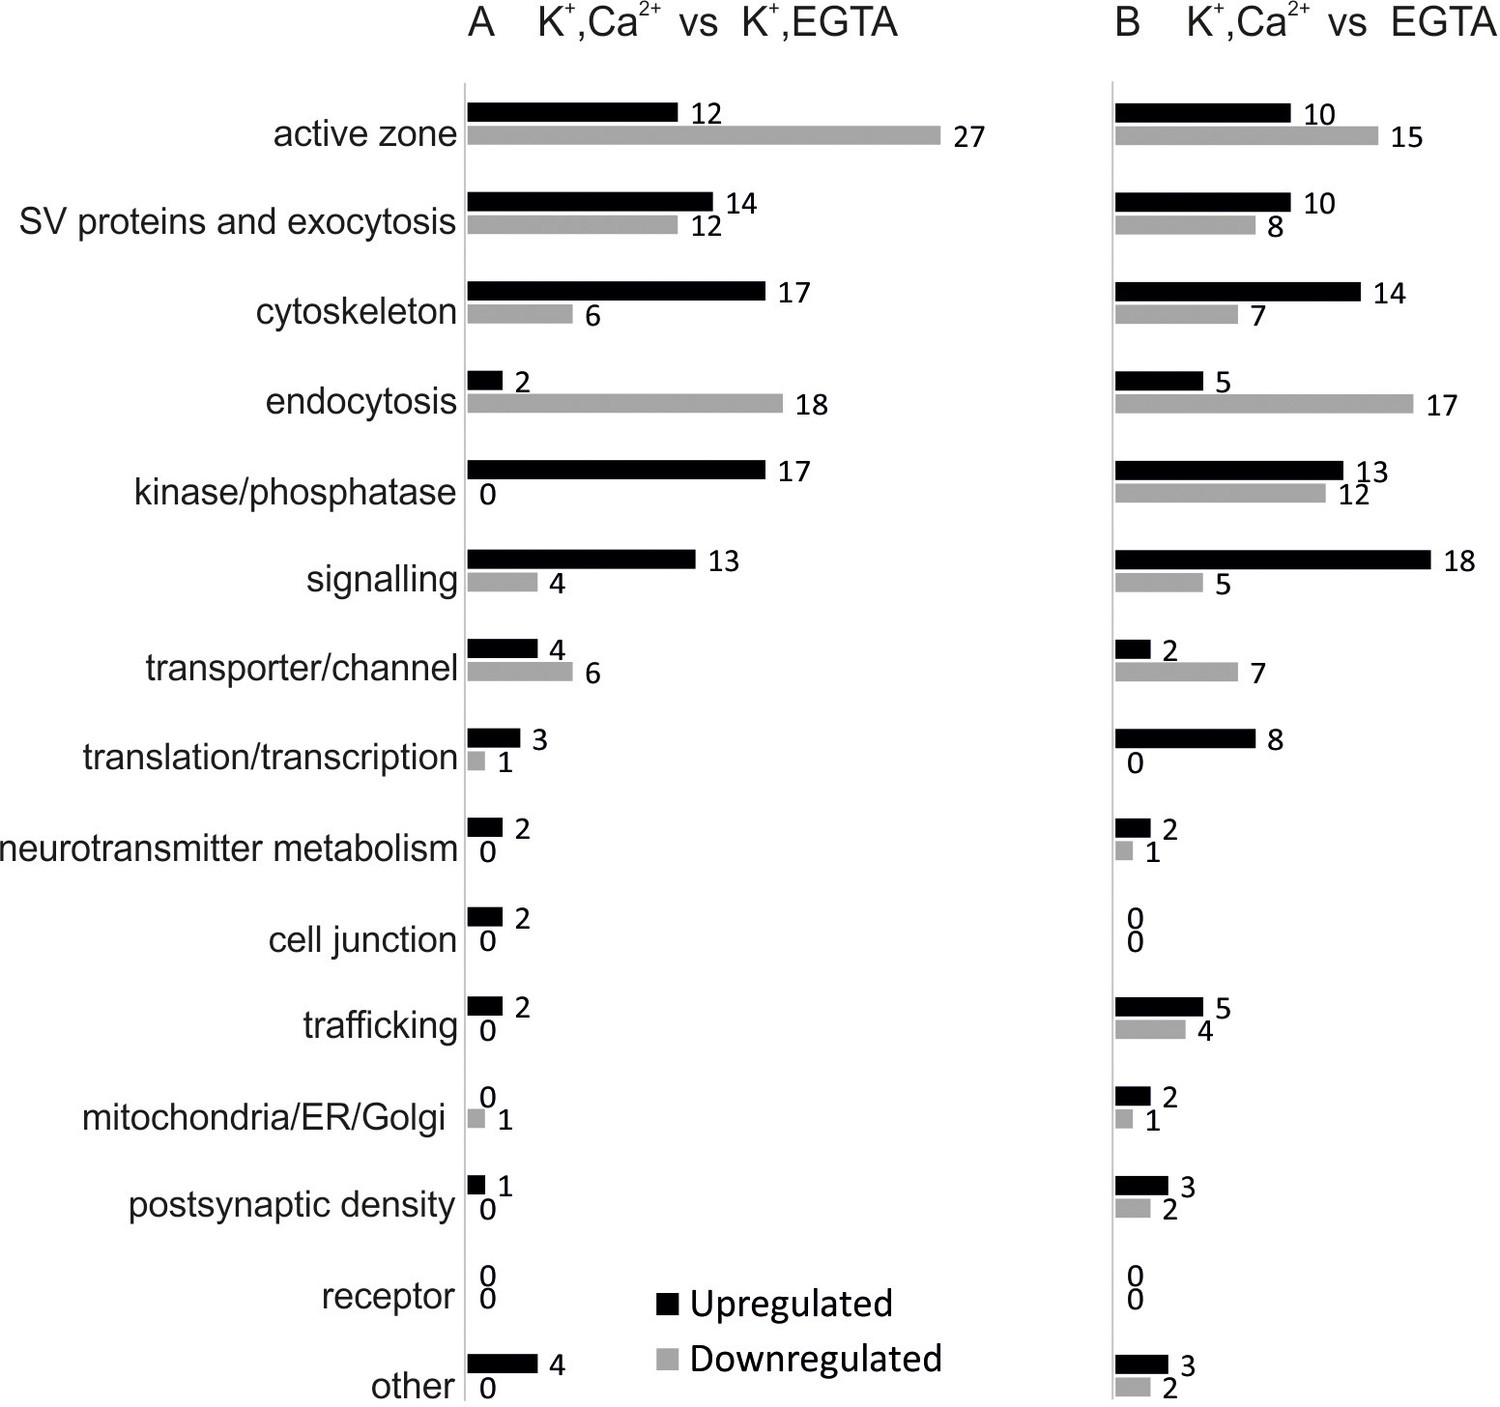
Overview of the regulated phosphosites, based on corresponding grouping of protein functions.
Proteins containing regulated phosphosites were individually divided into 15 groups as described previously (Boyken et al., 2013). Proteins with function/localization other than listed or uncharacterized proteins were grouped into the 'other' category.
Figure 4
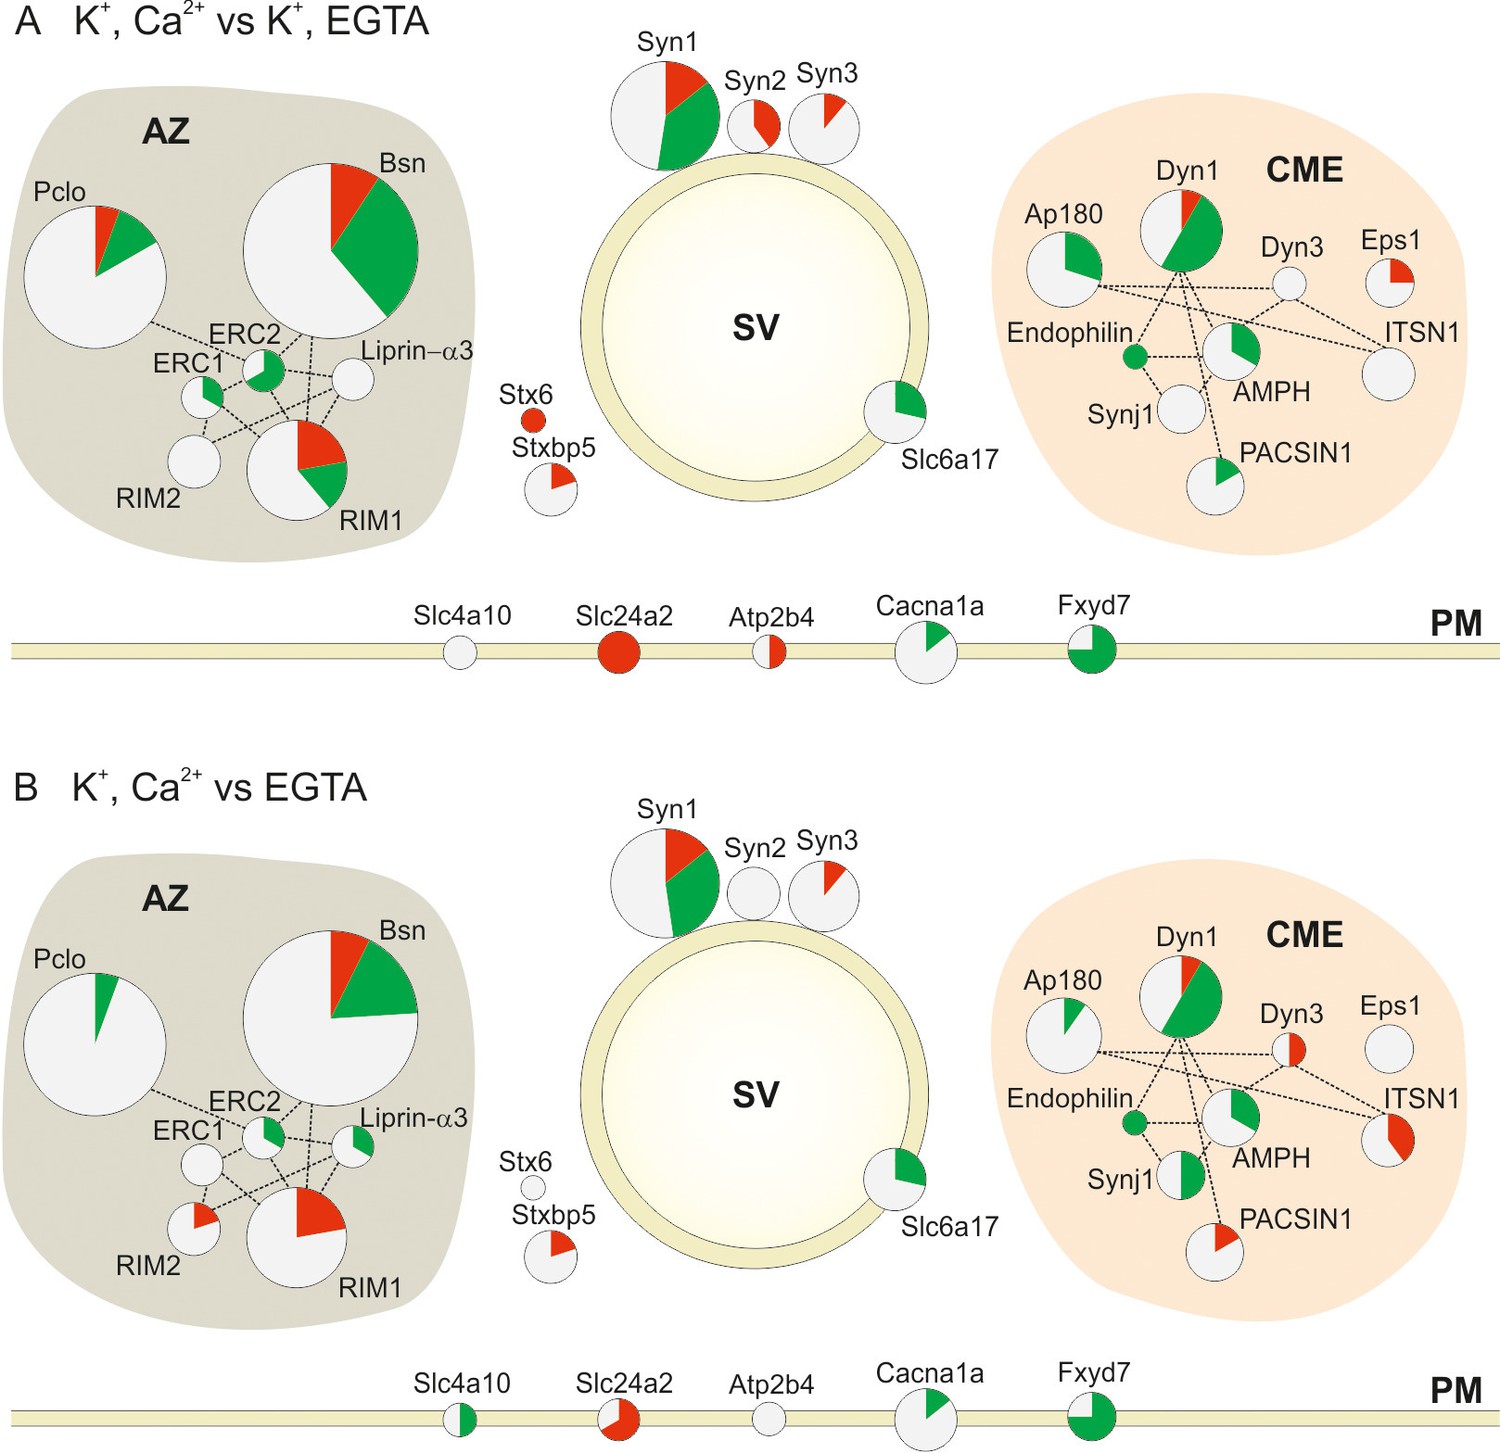
Changes in the phosphorylation status of proteins involved in synaptic vesicle trafficking following stimulation.
Overview of changes in the phosphorylation status of Active Zone proteins (AZ), synaptic vesicle proteins (SV), proteins involved in Clathrin Mediated Endocytosis (CME) and Plasma Membrane proteins (PM) in the two pair-wise comparisons: (A) depolarization with Ca2+ versus depolarization without Ca2+ (K+, Ca2+ versus K+, EGTA) (B) depolarization with Ca2+ versus no depolarization (K+, Ca2+ versus EGTA). The circles are proportional to the number of quantified phosphosites in the two conditions. The red, green and white area in each circle is proportional to the number of up, down and nonregulated phosphosites, respectively. The dotted lines connecting the circles show the interactions of the proteins based on STRING database and literature mining (references included in the main text; for a glossary of the abbreviations see supplemental Figure 4—source data 1.
-
Figure 4—source data 1
Protein name, Gene name, Uniprot ID and abbreviation of proteins shown in Figure 4.
- https://doi.org/10.7554/eLife.14530.012
Figure 5
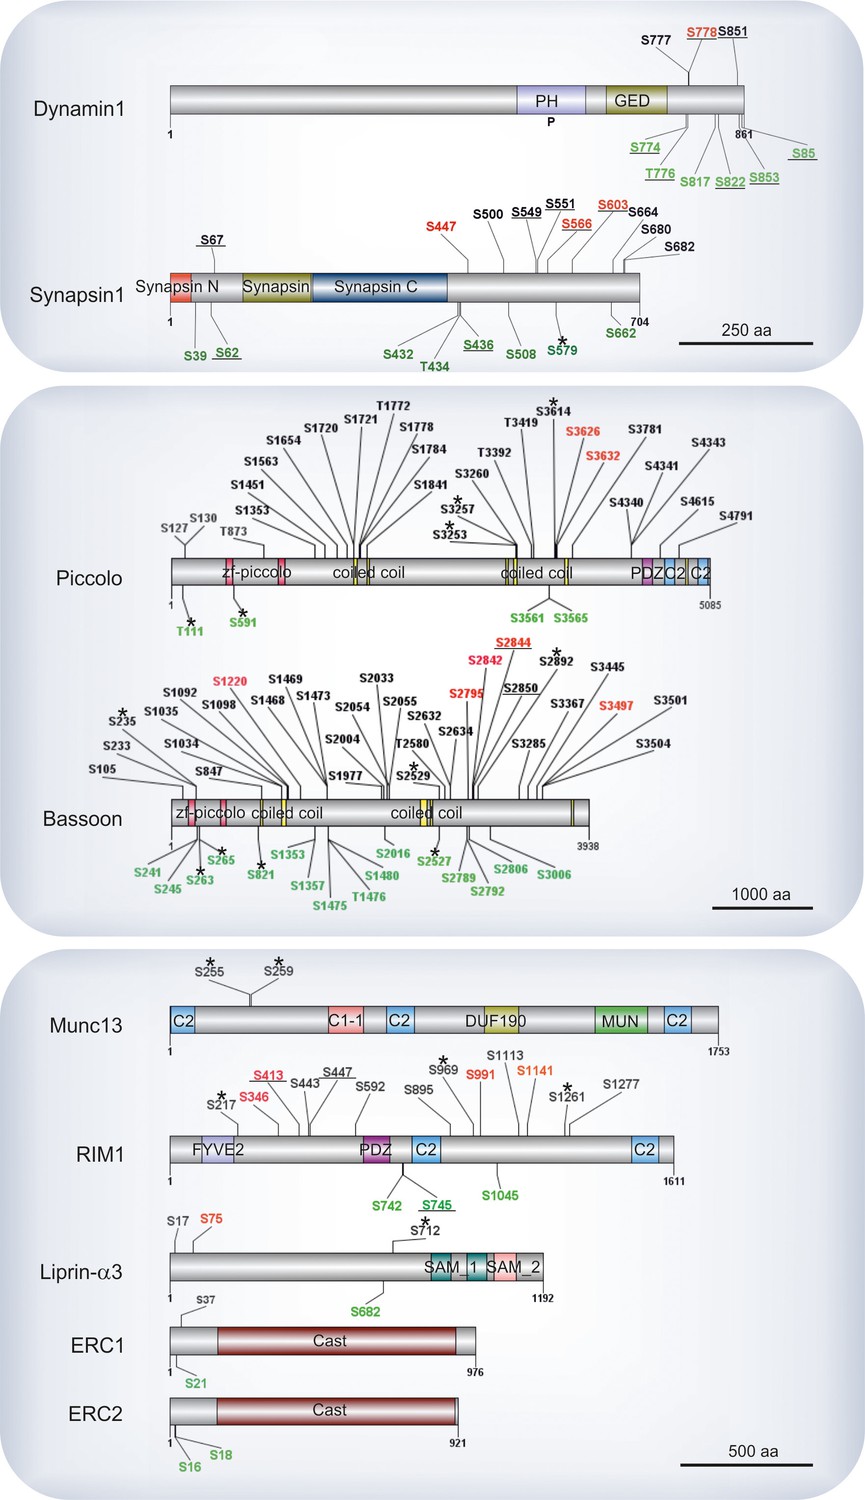
Phosphosites identified in proteins of the active zone.
Colors indicate phosphosites that are upregulated (red), downregulated (green), or remain unchanged (black) in depolarization with Ca2+ versus depolarization without Ca2+ comparison (K+, Ca2+ versus K+, EGTA). The underlined phosphosites represent sites previously reported to be physiologically relevant (for references see Supplementary file 3, available at Dryad [Kohansal-Nodehi et al., 2016]). Unmarked phosphosites represent sites previously reported only by proteomic discovery-mode mass spectrometry, defined as HTP in the publicly available PhosphoSitePlus database. Phosphosites marked with a star represent phosphosites reported here for the first time. For comparison, phosphosites found in the well-studied proteins dynamin1 and synapsin1 are shown.
Figure 6

Analysis of sequence motifs and experimental verification of specific kinase phosphorylation on selected phosphosites.
(A–D) Sequence analysis of regulated phosphosites using the Motif-X tool (Schwartz and Gygi, 2005). The frequency of residues surrounding the phosphorylated serine is indicated by the size of the letters. Among the upregulated sites, the motif RXXS is overrepresented, whereas the SP motif is conspicuously present among downregulated motifs. (E) In vitro kinase assays evaluating the ability of selected kinases to phosphorylated phosphosites identified on active zone proteins. Five phosphosites were selected from four active zone proteins for testing against CaMKII, PKA, and PKC. For each site, two 13-mer peptides were synthesized as substrates (for sequences of the peptide see Figure 6—source data 1) that correspond to the sequence surrounding the phosphorylated serine, with one of them containing an alanine instead of the serine as control. The following peptides were used as positive controls: (i) synapsin S603 that is known to be phosphorylated by CaMKII (Jovanovic et al., 2001) and (ii) autocamide-2, kemptide, and neurogranin were used as known substrates of CaMKII, PKA, and PKC, respectively. Background was determined by omitting peptide from the assay. The data show means of three replicates, with the bars indicating the range of values.
-
Figure 6—source data 1
Sequence of the peptides used in in vitro kinase assay.
- https://doi.org/10.7554/eLife.14530.015
Author response image 1
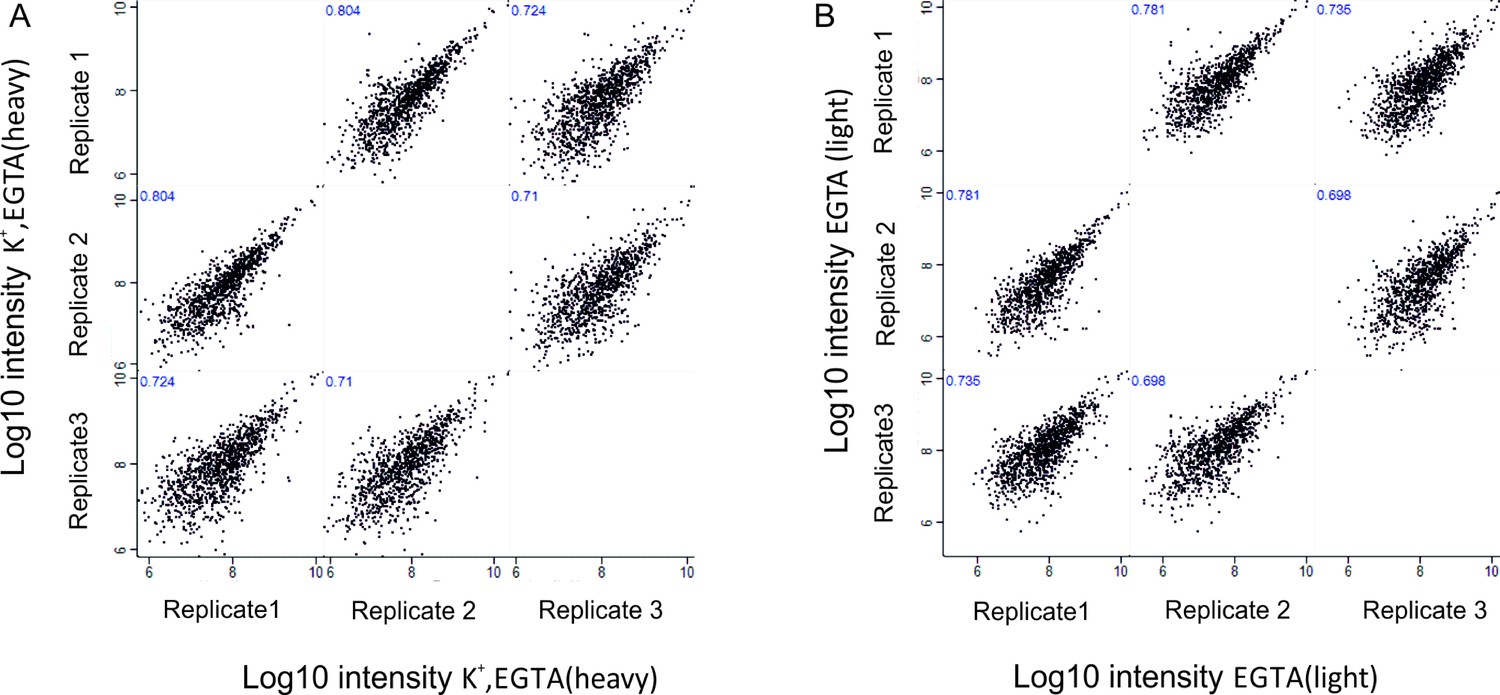
Correlation of phosphosites between biological replicates.
Correlation plots depicting correlation of phosphosites between three biological replicates at Log10 intensity level in depolarization without Ca2+ (K+, EGTA, heavy) condition (A), no depolarization (EGTA, light) condition (B).
Download links
A two-part list of links to download the article, or parts of the article, in various formats.
Downloads (link to download the article as PDF)
Open citations (links to open the citations from this article in various online reference manager services)
Cite this article (links to download the citations from this article in formats compatible with various reference manager tools)
Analysis of protein phosphorylation in nerve terminal reveals extensive changes in active zone proteins upon exocytosis
eLife 5:e14530.
https://doi.org/10.7554/eLife.14530


