p21-activated kinase 1 restricts tonic endocannabinoid signaling in the hippocampus
- Southeast University, China
- The Hospital for Sick Children, Canada
- University of Toronto, Canada
- Cumming School of Medicine, Canada
- University of Calgary, Canada
Figures
Figure 1
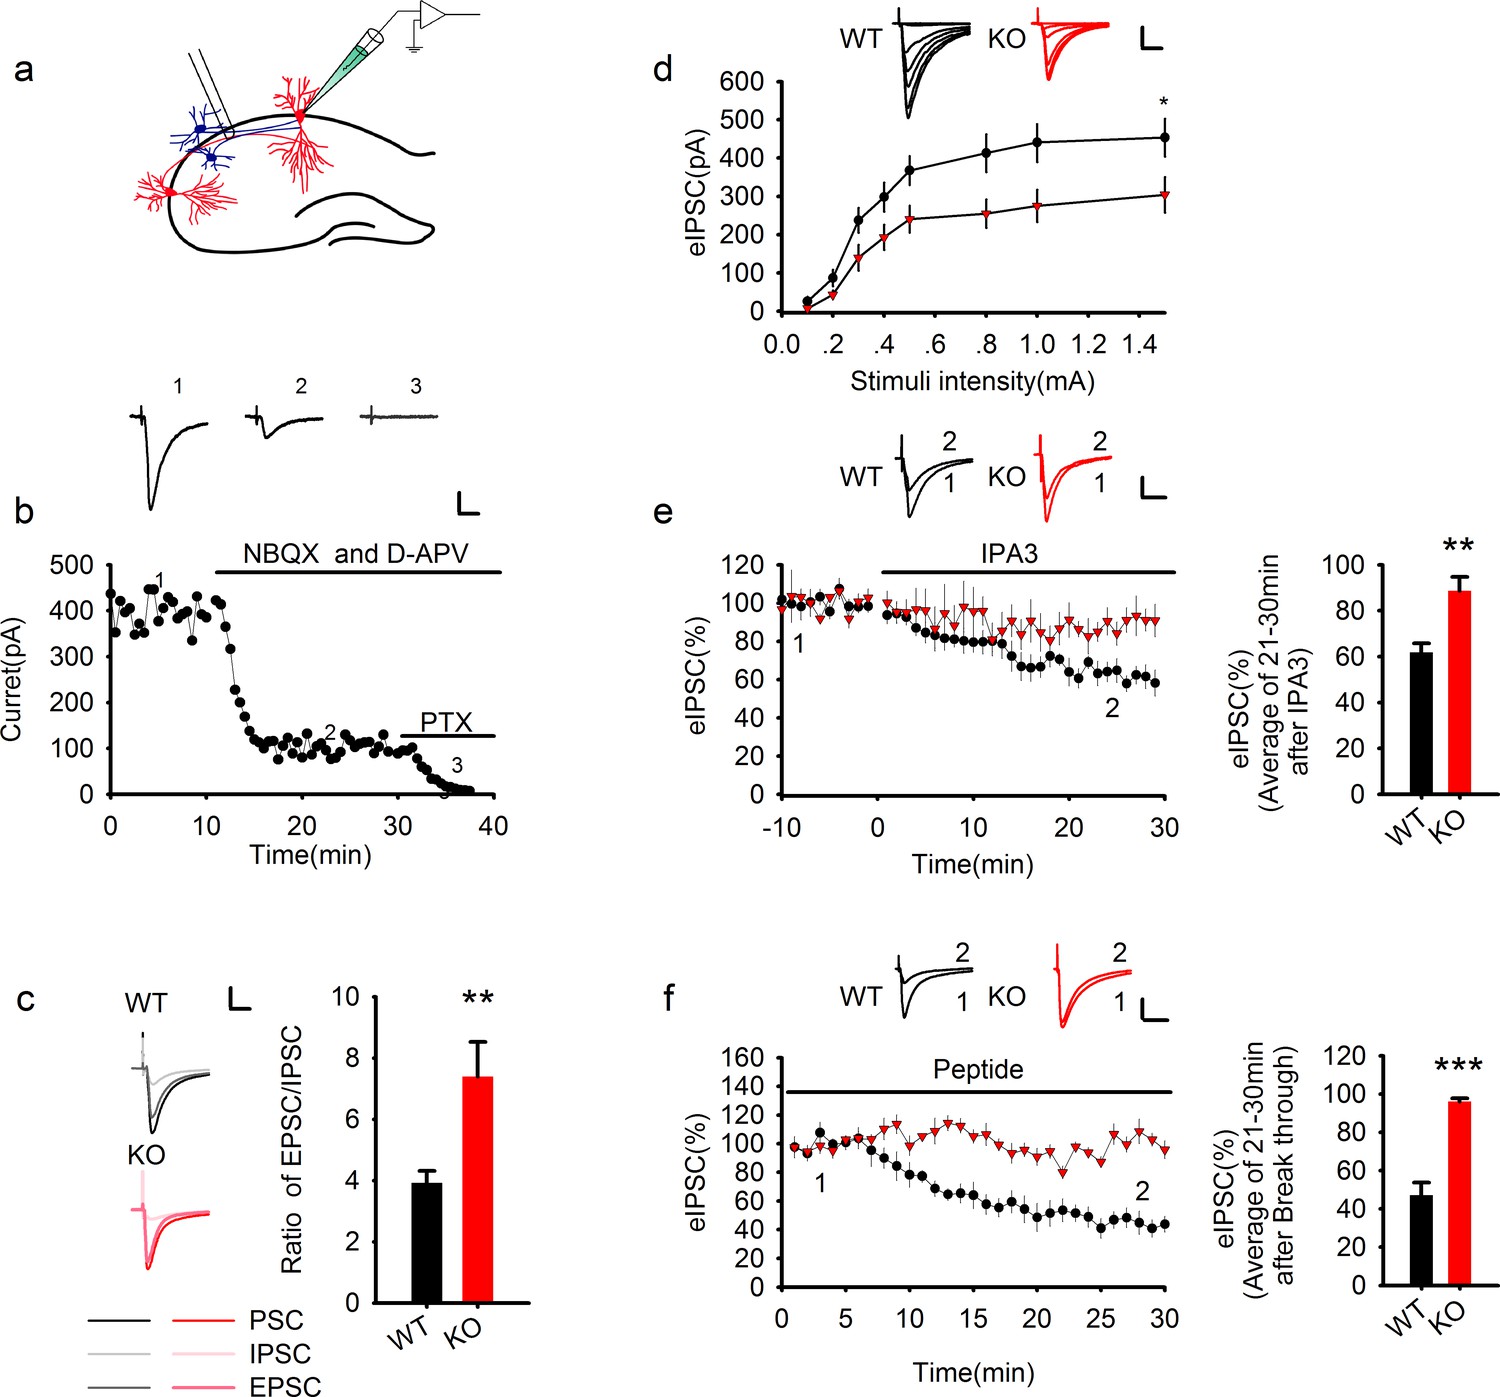
Genetic ablation of PAK1 enhances E/I ratio by selectively suppressing inhibitory synaptic responses.
(a) Diagram of a hippocampal slice showing the placement of stimulating and recoding electrodes. (b) A representative whole-cell recording experiment and samples traces at indicated time points showing the time course of evoked synaptic currents in the absence or presence of various inhibitors to determine the E/I ratio. Scale bar: 100 pA/25 ms. (c) Left: sample traces of various components of synaptic currents. Right: summary data showing an increased E/I ratio in PAK1 KO compared to WT control (WT = 3.92 ± 0.39, n = 8 (5); KO = 7.39 ± 1.13, n = 6 (4); **p=0.007; t-test). Scale bar: 100 pA/25 ms. (d) Whole-cell recordings of input-output curves showing significantly reduced amplitude of evoked IPSC (eIPSC) in PAK1 KO compared to WT neurons (genotype: F(1, 27) = 5.946, *p=0.022; stimuli: F(7, 189) = 70.983, ***p<0.001; repeated measures two-way ANOVA [also see Figure 1—source data 1]; at 1.5 mA stimulus: WT = 453.39 ± 49.41 pA, n = 15 (5); KO = 304.08 ± 46.54 pA, n = 14 (5); *p=0.037; t-test). Scale bar: 125 pA/25 ms. (e) Whole-cell recordings of eIPSC showing that bath application of IPA3 caused a rapid decrease in eIPSC amplitude in WT, but not in PAK1 KO neuron (genotype: F(1, 10) = 5.615, *p=0.039; time: F(3, 30) =16.332, ***p<0.001; repeated measures two-way ANOVA [also see Figure 1—source data 2]; at 21–30 min post IPA3 perfusion: WT = 61.84 ± 4.01%, n = 7 (4); KO = 88.65 ± 6.08%, n = 5 (3); **p=0.003; t-test). Scale bar: 20 pA/25 ms. (f) Whole-cell recordings of eIPSC showing that intracellular infusion of the PAK1 inhibitory peptide specifically in the postsynaptic neurons caused a rapid decrease in eIPSC amplitude in WT, but not in PAK1 KO neurons (genotype: F(1, 9) = 62.66, ***p<0.001; time: F(2, 18) = 30.720, ***p<0.001; repeated measures two-way ANOVA [also see Figure 1—source data 3]; at 21–30 min after whole-cell break-in: WT = 47.07 ± 6.63%, n = 5 (4); KO = 96.17 ± 1.67%, n = 6(5);***p<0.001; t-test). Scale bar: 40 pA/25 ms.
-
Figure 1—source data 1
Statistical data summary for Figure 1d: input/output curves of eIPSC using repeated measures two-way ANOVA.
- https://doi.org/10.7554/eLife.14653.004
-
Figure 1—source data 2
Statistical data summary for Figure 1e: IPA3 effect on eIPSC using repeated measures two-way ANOVA.
- https://doi.org/10.7554/eLife.14653.005
-
Figure 1—source data 3
Statistical data summary for Figure 1f: PAK1 inhibitory peptide effect on eIPSC using repeated measures two-way ANOVA.
- https://doi.org/10.7554/eLife.14653.006
Figure 2 with 2 supplements
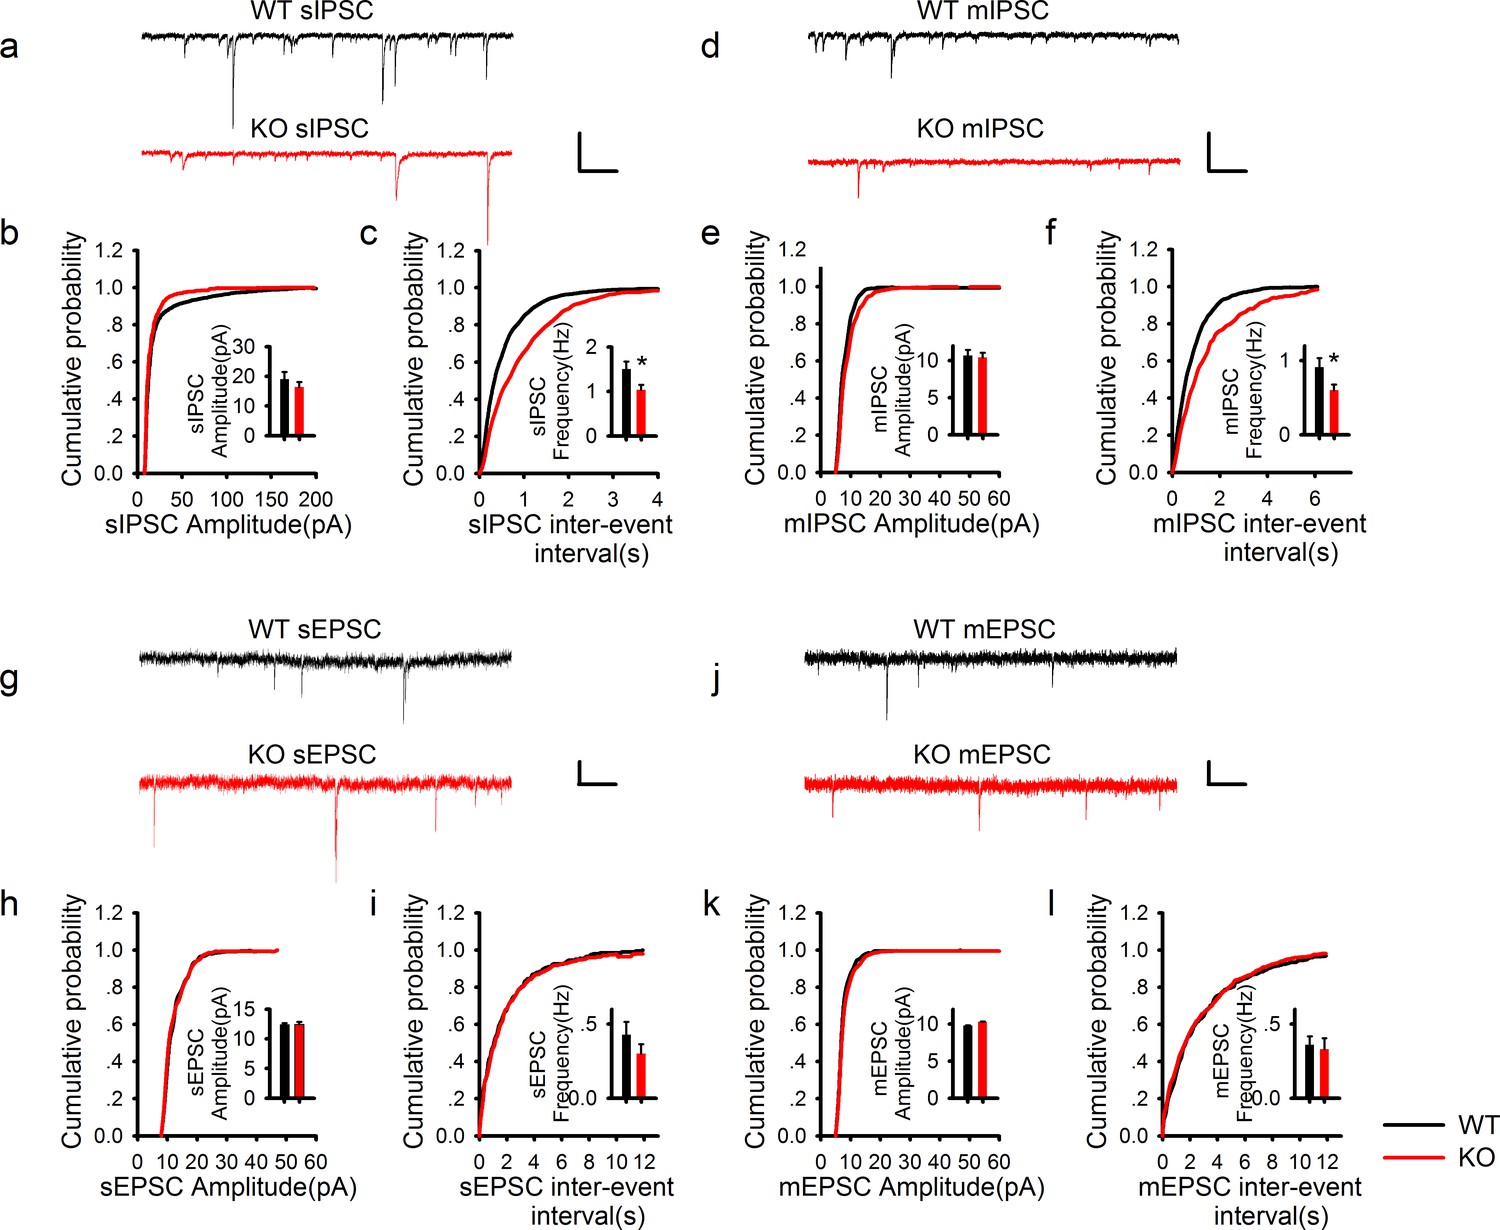
PAK1 deletion specifically reduces the frequency, but not the amplitude of inhibitory synaptic responses.
(a) Sample traces of sIPSC recordings. (b, c) Summary graphs of (a) showing normal distribution and mean value of the amplitude (b: WT = 19.07 ± 2.44 pA, n = 13 (5); KO = 16.44 ± 1.62 pA, n = 20 (6); p=0.35), but decreased frequency (c: WT = 1.50 ± 0.17 Hz, n = 13 (7); KO 1.03 ± 0.11 Hz, n = 20 (6); *p=0.021) of sIPSCs in PAK1 KO compared to WT control. (d) Sample traces of mIPSC recordings. (e, f) Summary graphs of (d) showing normal distribution and mean value of the amplitudes (e: WT = 10.69 ± 0.75 pA, n = 10 (4); KO = 10.40 ± 0.64 pA, n = 16 (4); p=0.773), but decreased frequency (f: WT = 0.91 ± 0.12 Hz, n = 10 (4); KO = 0.60 ± 0.08 Hz, n = 16 (4); *p=0.034) of mIPSCs in PAK1 KO compared to WT control. (g) Sample traces of sEPSC recordings. (h, i) Summary graphs of (g) showing normal amplitude (h: WT = 12.37 ± 0.30 pA, n = 20 (5); KO = 12.43 ± 0.46 pA, n = 14 (5); p=0.897) and frequency (i: WT = 0.43 ± 0.08 Hz, n = 20 (5); KO = 0.30 ± 0.06 Hz, n = 14 (5); p=0.272) of sEPSCs in PAK1 KO compared to WT control. (j) Sample traces of mEPSC recordings. (k, l) Summary graphs of (j) showing normal amplitude (k: WT = 9.79 ± 0.06 pA, n = 7 (3); KO = 10.30 ± 0.06 pA, n = 9 (3); p=0.545) and frequency (l: WT = 0.36 ± 0.05 Hz, n = 7 (3); KO = 0.33 ± 0.07 Hz, n = 9 (3); p=0.806) of mEPSCs in PAK1 KO compared to WT control. All scale bars: 50 pA/1 s.
Figure 2—figure supplement 1
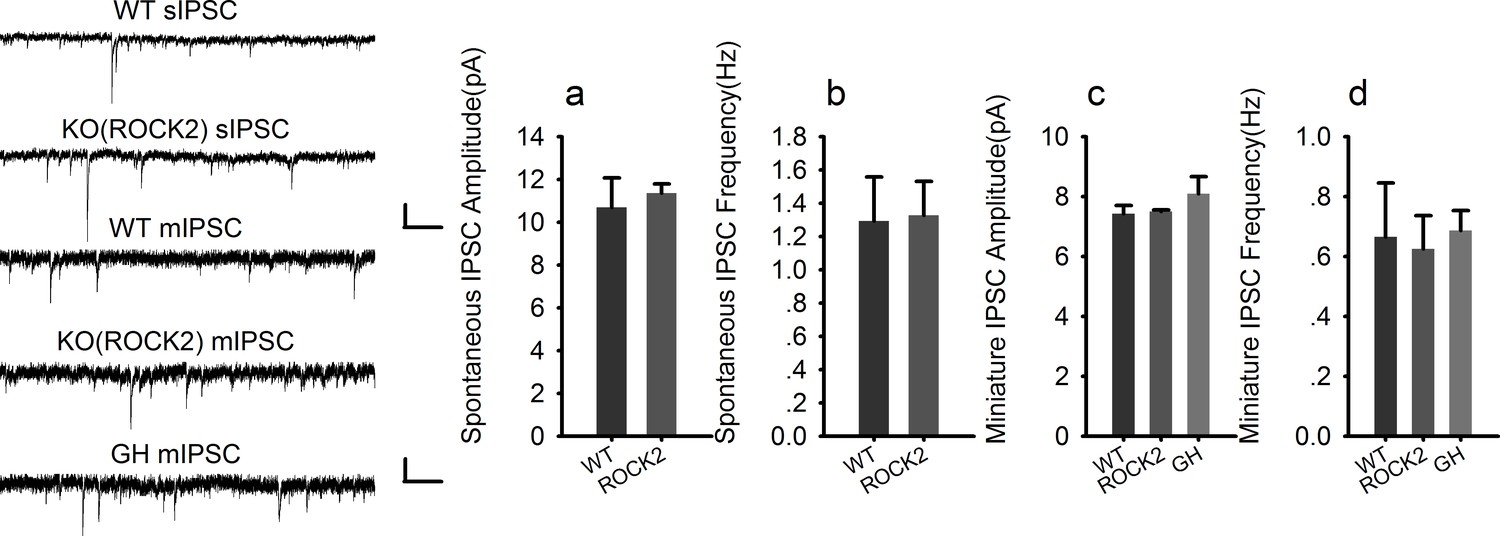
Normal inhibitory transmission in ROCK2 KO mice.
https://doi.org/10.7554/eLife.14653.008-
Figure 2—figure supplement 1—source data 1
Statistical data summary for Figure 2—figure supplement 1: Normal inhibitory transmission in ROCK2 KO mice using one-way ANOVA.
- https://doi.org/10.7554/eLife.14653.009
Figure 2—figure supplement 2
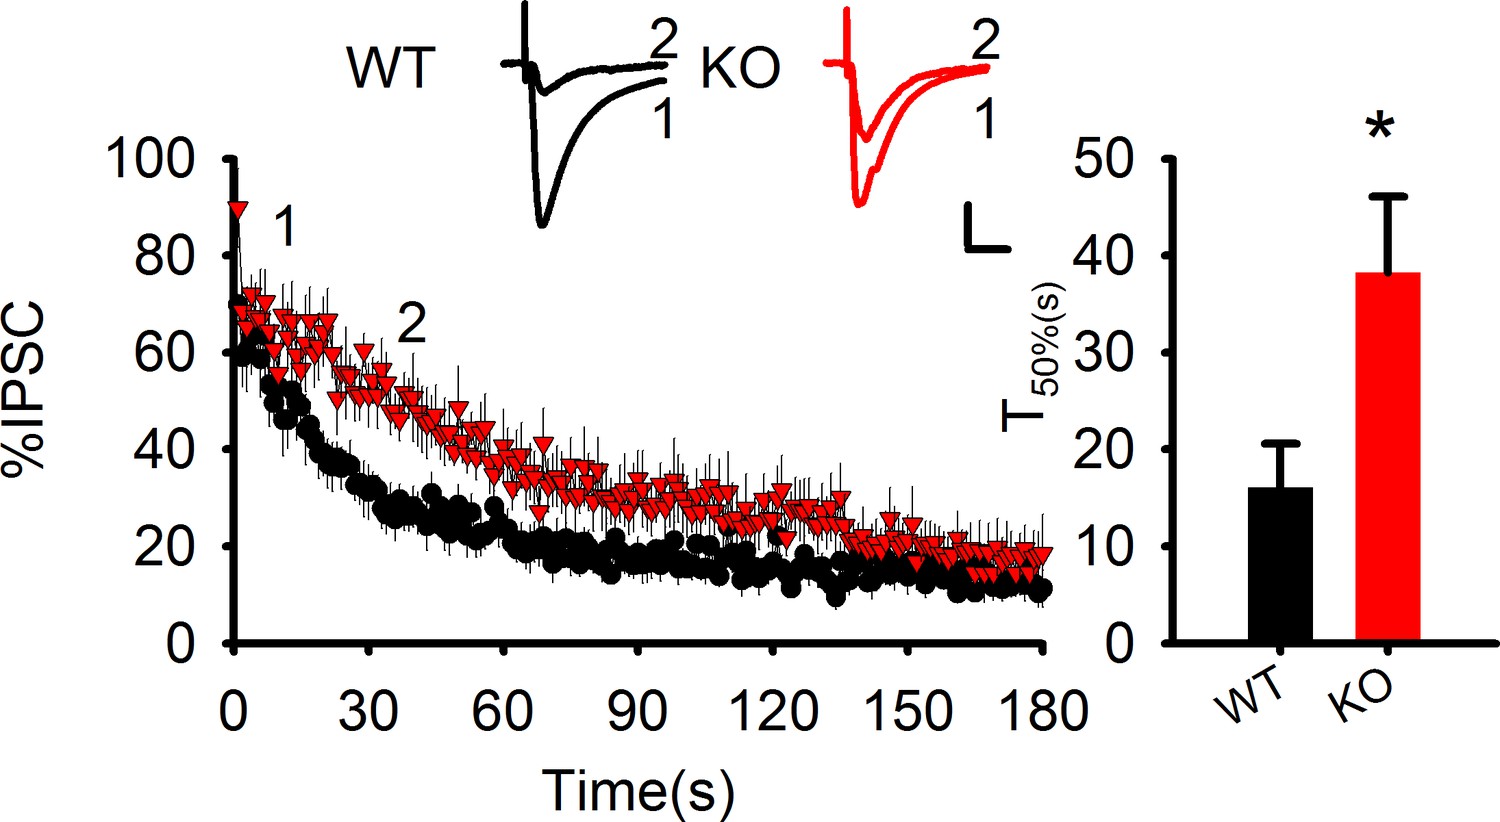
Impaired transmitter depletion in response to sustained synaptic activation.
https://doi.org/10.7554/eLife.14653.010
Figure 3
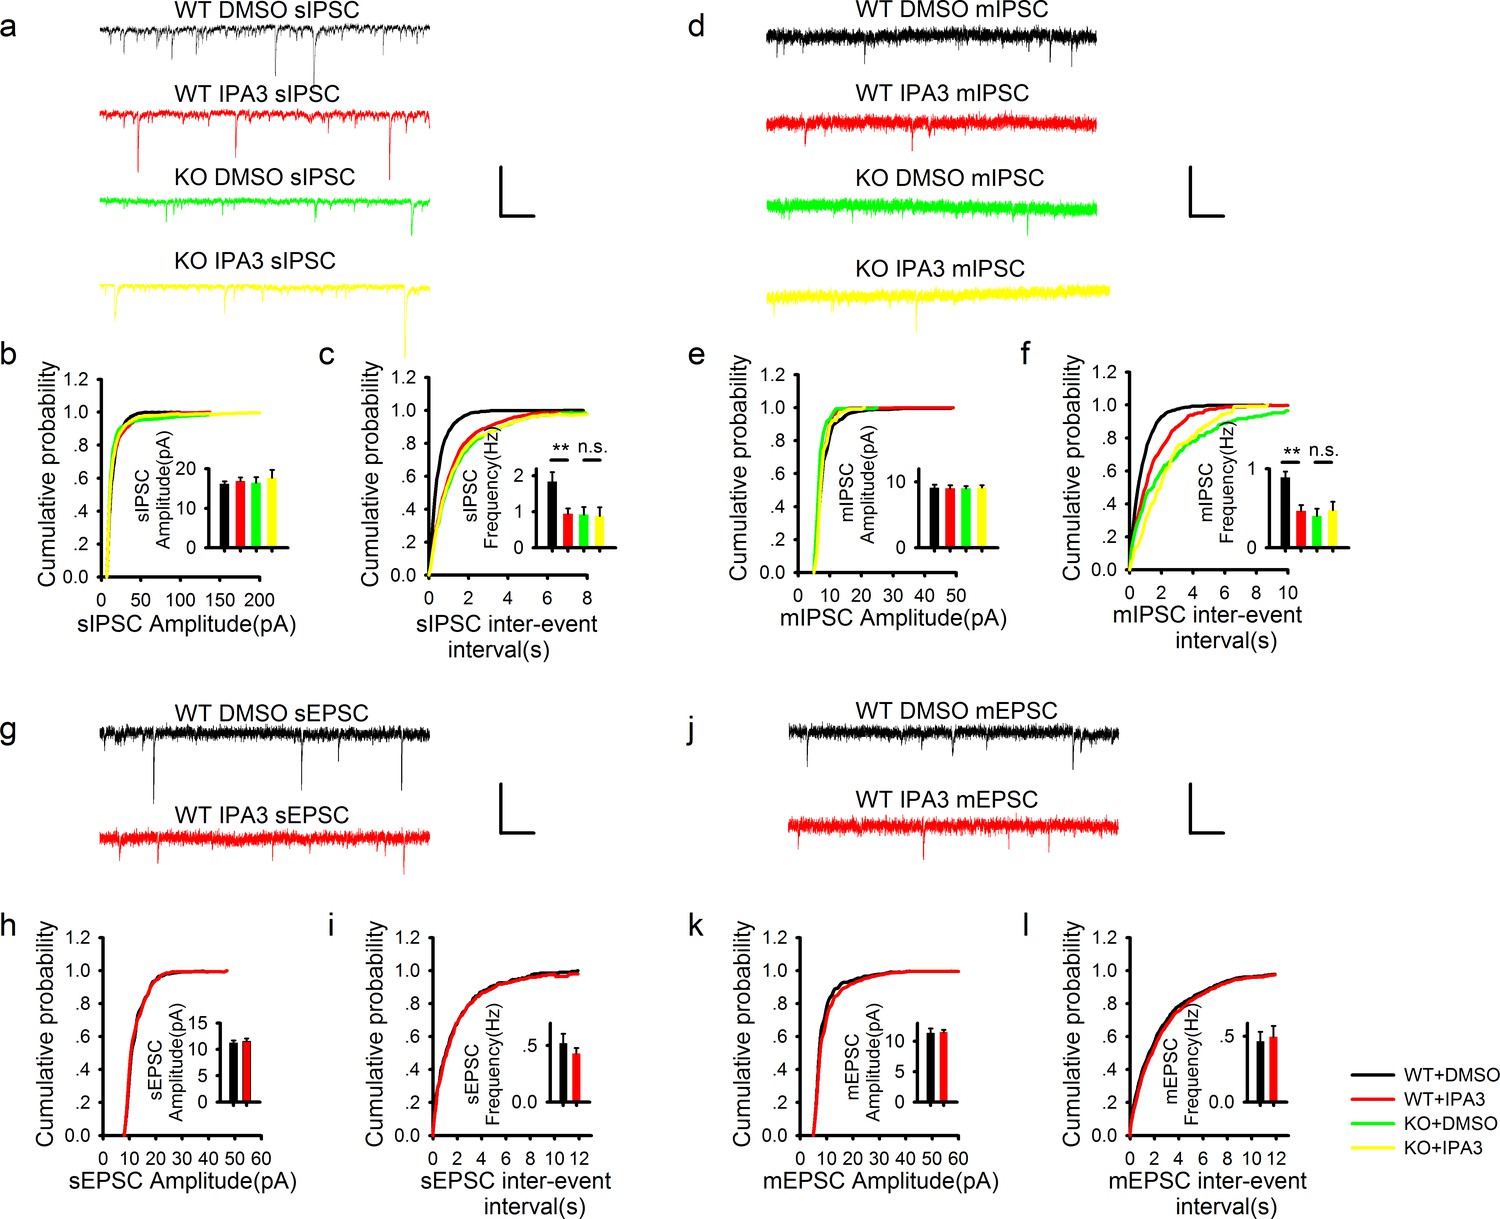
Acute disruption of postsynaptic PAK1 also selectively impairs the frequency, but not the amplitude of inhibitory synaptic responses.
(a) Sample traces of sIPSC recordings. Scale bar: 60 pA/1 s. (b, c) Summary graphs of (a) showing normal amplitude (b: WT+DMSO = 16.14 ± 0.65 pA, n = 13 (4); WT+IPA3 = 16.83 ± 0.95 pA, n = 15 (4); KO+DMSO = 16.46 ± 1.41 pA, n = 9 (3); KO+IPA3 = 17.74 ± 1.98 pA, n = 9 (3); genotype: F(1, 42) = 0.250, p=0.620; drug: F(1, 42) = 0.646, p=0.426; two-way ANOVA), but reduced frequency (c: WT+DMSO = 1.84 ± 0.26 Hz, n = 13 (4); WT+IPA3 = 0.95 ± 0.15 Hz, n = 15 (4); KO+DMSO = 0.93 ± 0.20 Hz, n = 9 (3); KO+IPA3 = 0.88 ± 0.24 Hz, n = 9 (3); genotype: F(1, 42) = 4.908, *p=0.032; drug: F(1, 42) = 4.524, *p=0.039; also see Figure 3—source data 1 for t-tests between groups) of sIPSCs in the PAK1 inhibitor IPA3 treated compared to vehicle (DMSO) treated WT neurons. (d) Sample traces of mIPSC recordings. (e, f) Summary graphs of (d) showing normal amplitude (e: WT+DMSO =9.10 ± 0.47 pA, n = 15 (6); WT+IPA3 = 9.02 ± 0.46 pA, n = 11 (6); KO+DMSO = 9.02 ± 0.36 pA, n = 10 (4); KO+IPA3 = 9.13 ± 0.36 pA, n =8 (3); genotype: F(1, 40) = 0.001, p=0.969; drug: F(1, 40) = 0.001, p=0.978; two-way ANOVA), but decreased frequency of mIPSCs (f: WT+DMSO = 0.89 ± 0.07 Hz, n = 15 (6); WT+IPA3 = 0.46 ± 0.08 Hz, n = 11 (6); KO+DMSO = 0.40 ± 0.09 Hz, n = 10 (4); KO+IPA3 = 0.48 ± 0.10 Hz, n = 8 (3); genotype: F(1, 40) = 7.703, **p=0.008; drug: F(1, 40) = 4.259, *p=0.046, two-way ANOVA; also see Figure 3—source data 2 for t-tests between groups) in IPA3 treated compared DMSO treated WT neurons. (g) Sample traces of sEPSC recordings. (h, i) Summary graphs of (g) showing that IPA3 had no effect on either amplitude (h: WT+DMSO = 11.21 ± 0.49 pA, n = 8 (4); WT+IPA3 = 11.52 ± 0.55 pA, n = 12 (5); p=0.693; t-test) or frequency (i: WT+DMSO = 0.52 ± 0.08 Hz, n = 8 (4); WT+IPA3 = 0.43 ± 0.05 pA, n = 12 (5); p=0.322; t-test) compared to DMSO treated WT neurons. (j) Sample traces of mEPSC recordings. (k, l) Summary graphs of (j) showing that IPA3 had no effect on either amplitude (k: WT+DMSO = 11.40 ± 0.71 pA, n = 9 (5); WT+IPA3 = 11.52 ± 0.39 pA, n = 10 (5); p=0.882; t-test) or frequency (l: WT+DMSO =0.46 ± 0.07 Hz, n = 9 (5); WT+IPA3 = 0.50 ± 0.08 pA, n = 10 (5); p=0.754; t-test) of mEPSCs compared to DMSO treated WT neurons. Scale bars for d, j and l: 20 pA/1 s.
-
Figure 3—source data 1
Statistical data summary for Figure 3b,c: Effect of IPA3 on frequency and amplitude of sIPSC of WT and PAK1 KO neurons using two-way ANOVA.
- https://doi.org/10.7554/eLife.14653.012
-
Figure 3—source data 2
Statistical data summary for Figure 3e,f: Effect of IPA3 on frequency and amplitude of mIPSC of WT and PAK1 KO neurons using two-way ANOVA.
- https://doi.org/10.7554/eLife.14653.013
Figure 4 with 1 supplement
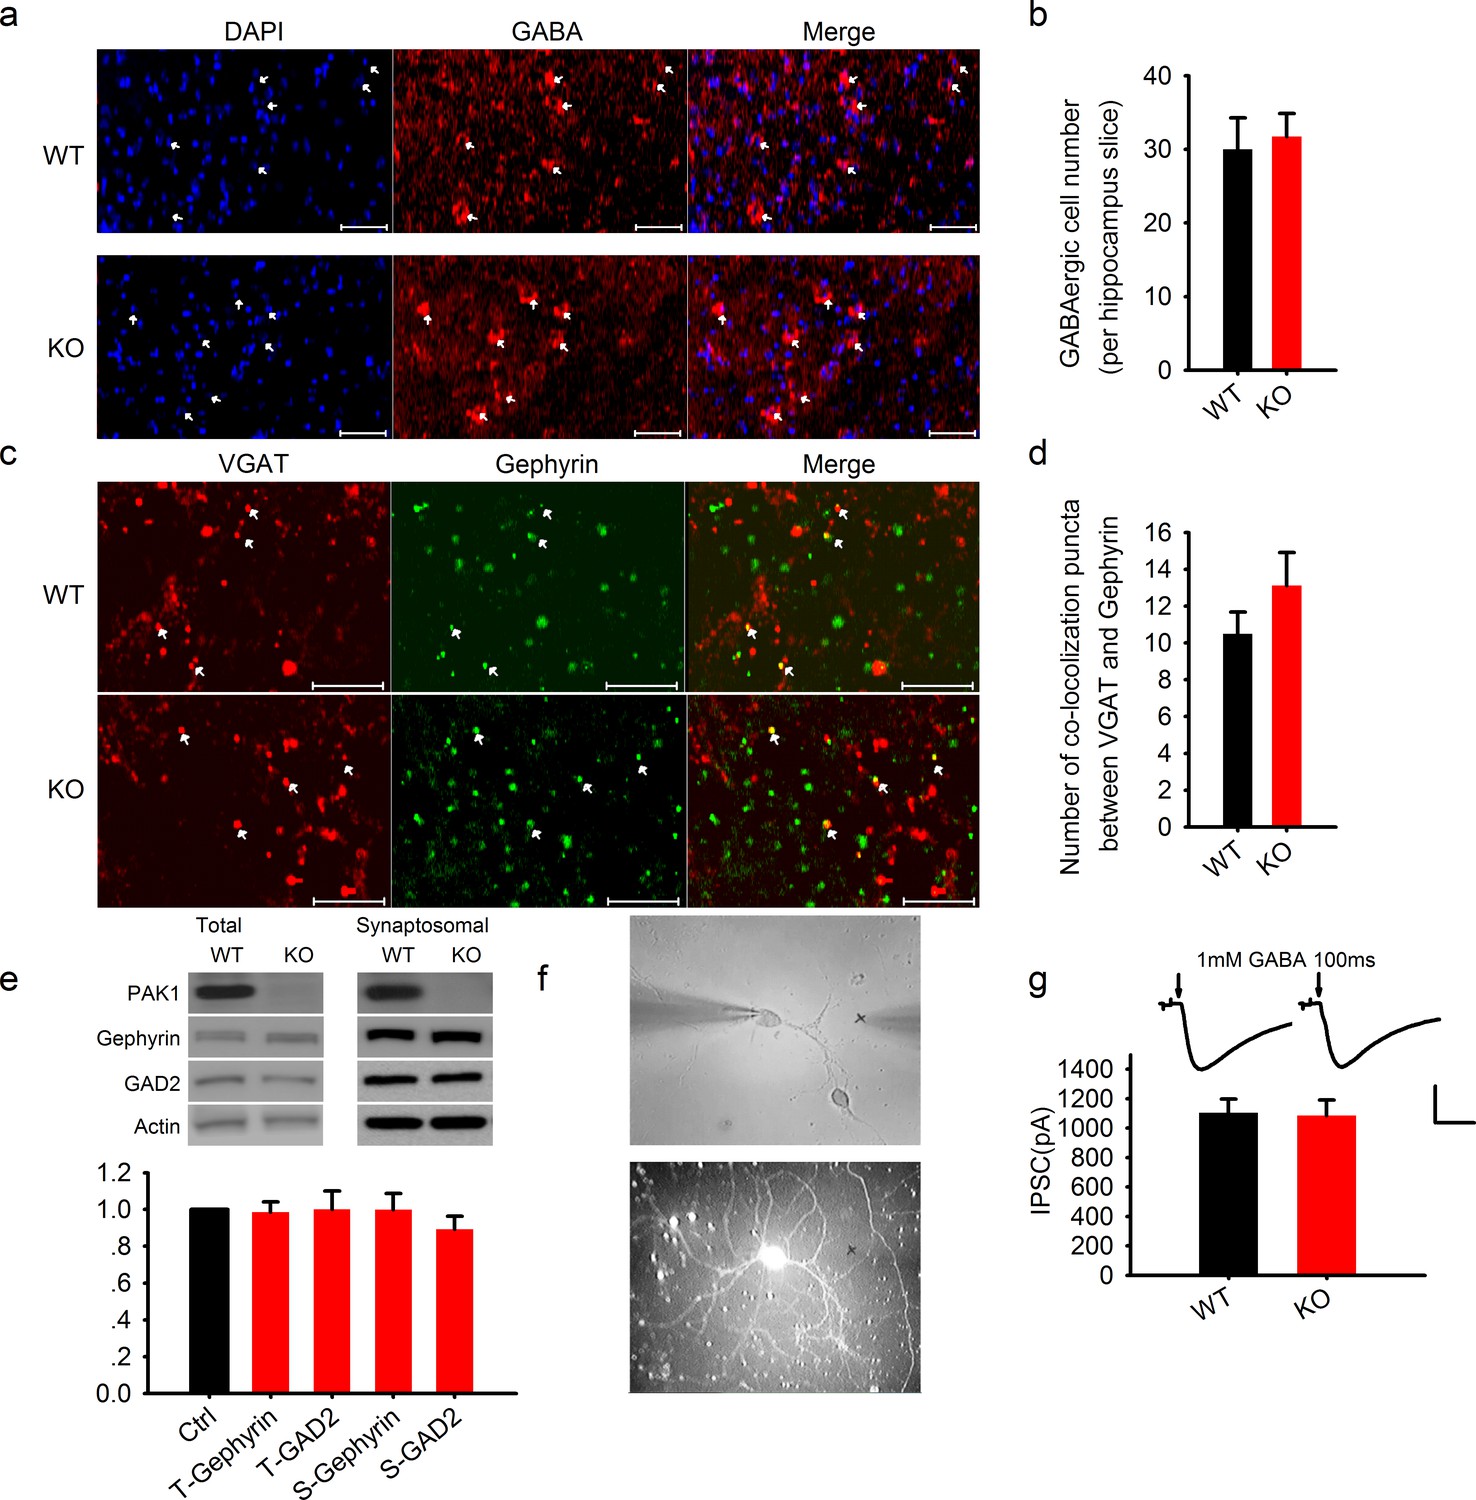
Normal GABAergic neurons, synapses, GABA receptor function and postsynaptic actin network in PAK1 KO mice.
(a) Confocal images of hippocampal sections stained with the nucleus marker DAPI and GABA and summary graph (b) showing similar number of GABAergic neurons in PAK1 KO and WT control mice (WT = 30 ± 4.3 neurons/section, n = 8 (3); KO = 31.73 ± 3.1 6 neurons/section, n = 11 (4); p = 0.744; t-test). Scale bar: 100 μm. (c) Confocal images of hippocampal sections stained with the GABAergic presynaptic marker VGAT and postsynaptic marker gephyrin and summary graph (d) showing normal synapse number in PAK1 KO mice (WT = 10.50 ± 1.18 puncta/image, n = 8 (4); KO = 13.13 ± 1.79, n = 8 (4); p=0.241; t-test). Scale bar: 10 μm. (e) Western blots of hippocampal lysate and summary graph showing no differences in the level of total (T) and synaptosomal (S) GAD2 and gephyrin between PAK1 KO and WT control mice (KO T-gephyrin = 0.99 ± 0.06, n = 7 (7), p=0.797; T-GAD2 = 1.00 ± 0.10, n = 8 (8), p=0.990; S- gephyrin = 1.00 ± 0.09, n = 7 (7), p=0.986; S-GAD2 = 0.89 ± 0.07, n = 7 (7), p=0.158; t-tests). (f) Phase contrast (upper) and GFP (lower) images of cultured hippocampal neurons showing how the genotype of mixed neurons was identified based on the presence or absence of GFP; (g) Sample traces (upper) and summary graph (lower) showing no differences in the amplitude of responses evoked by 1 mM GABA puff (arrows) delivered to the cell body of the neurons (WT = 1103.74 ± 93.43 pA, n = 18 (3); KO = 1086.86 ± 104.94 pA, n = 18 (3); p=0.91; t-test). Scale bar: 500 pA/0.5 s.
Figure 4—figure supplement 1
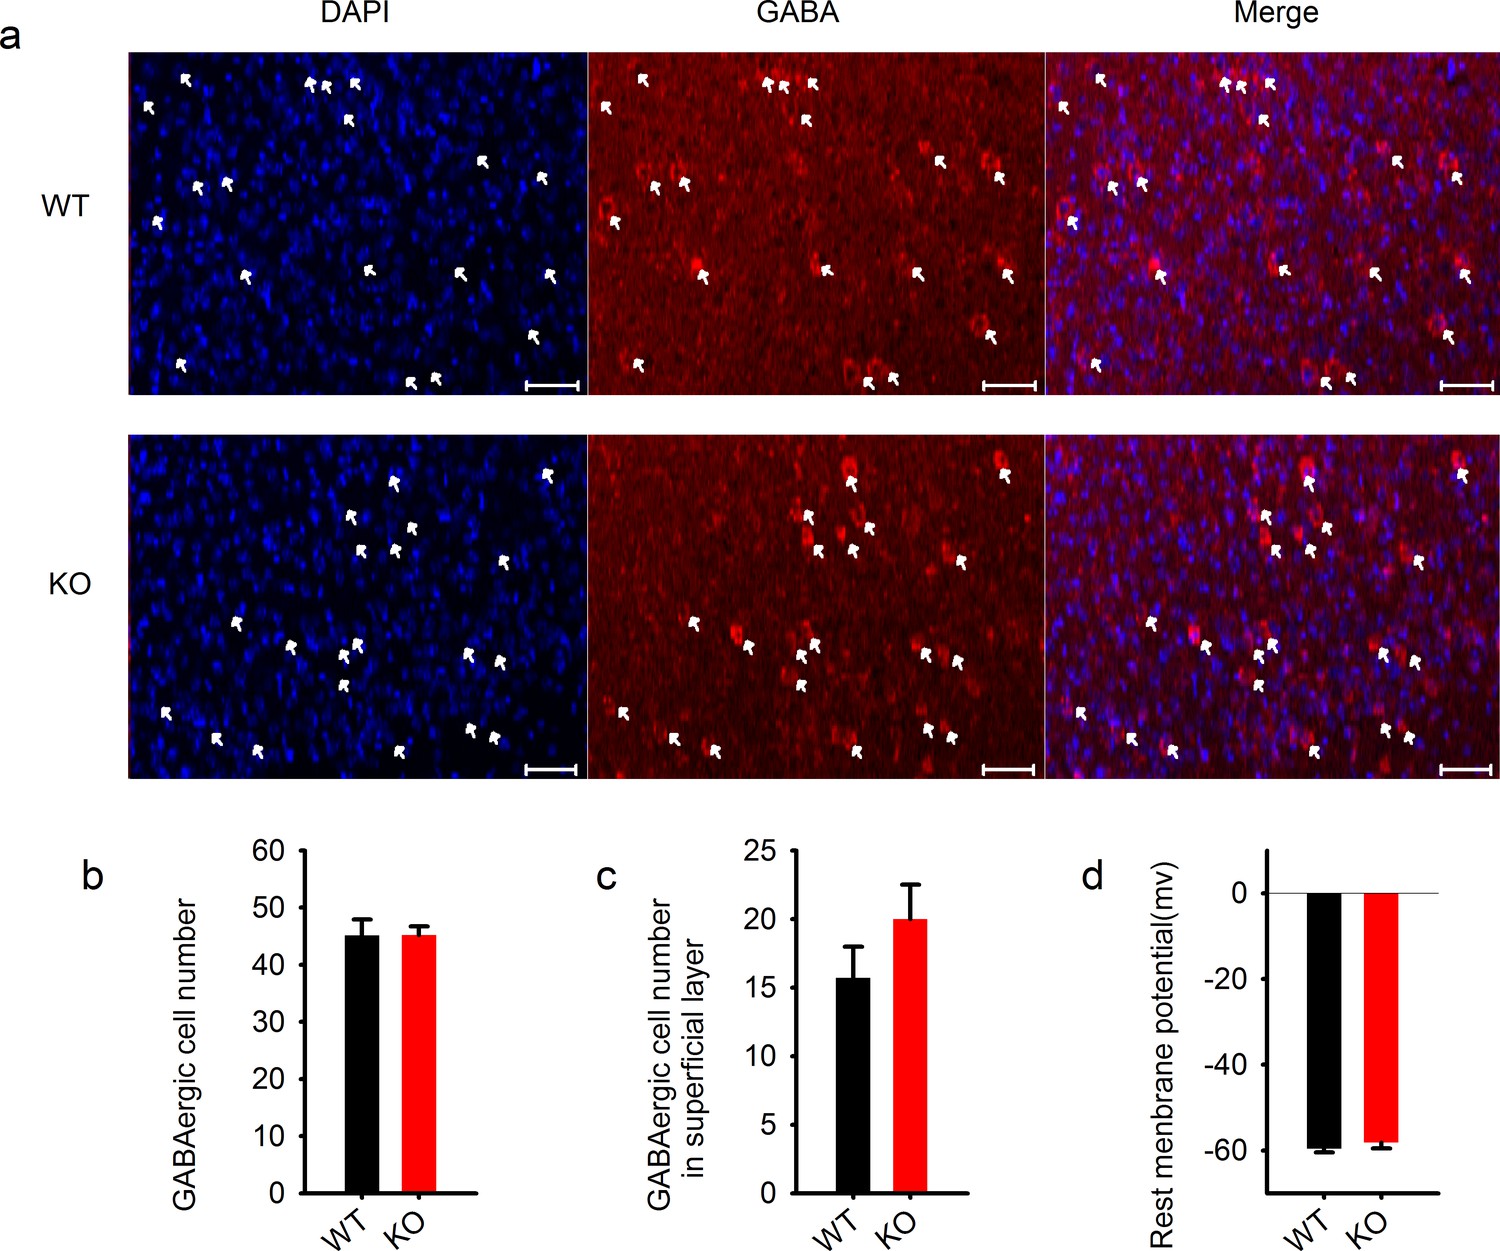
Normal GABAergic neurons and synapses in the cortex.
https://doi.org/10.7554/eLife.14653.015
Figure 5
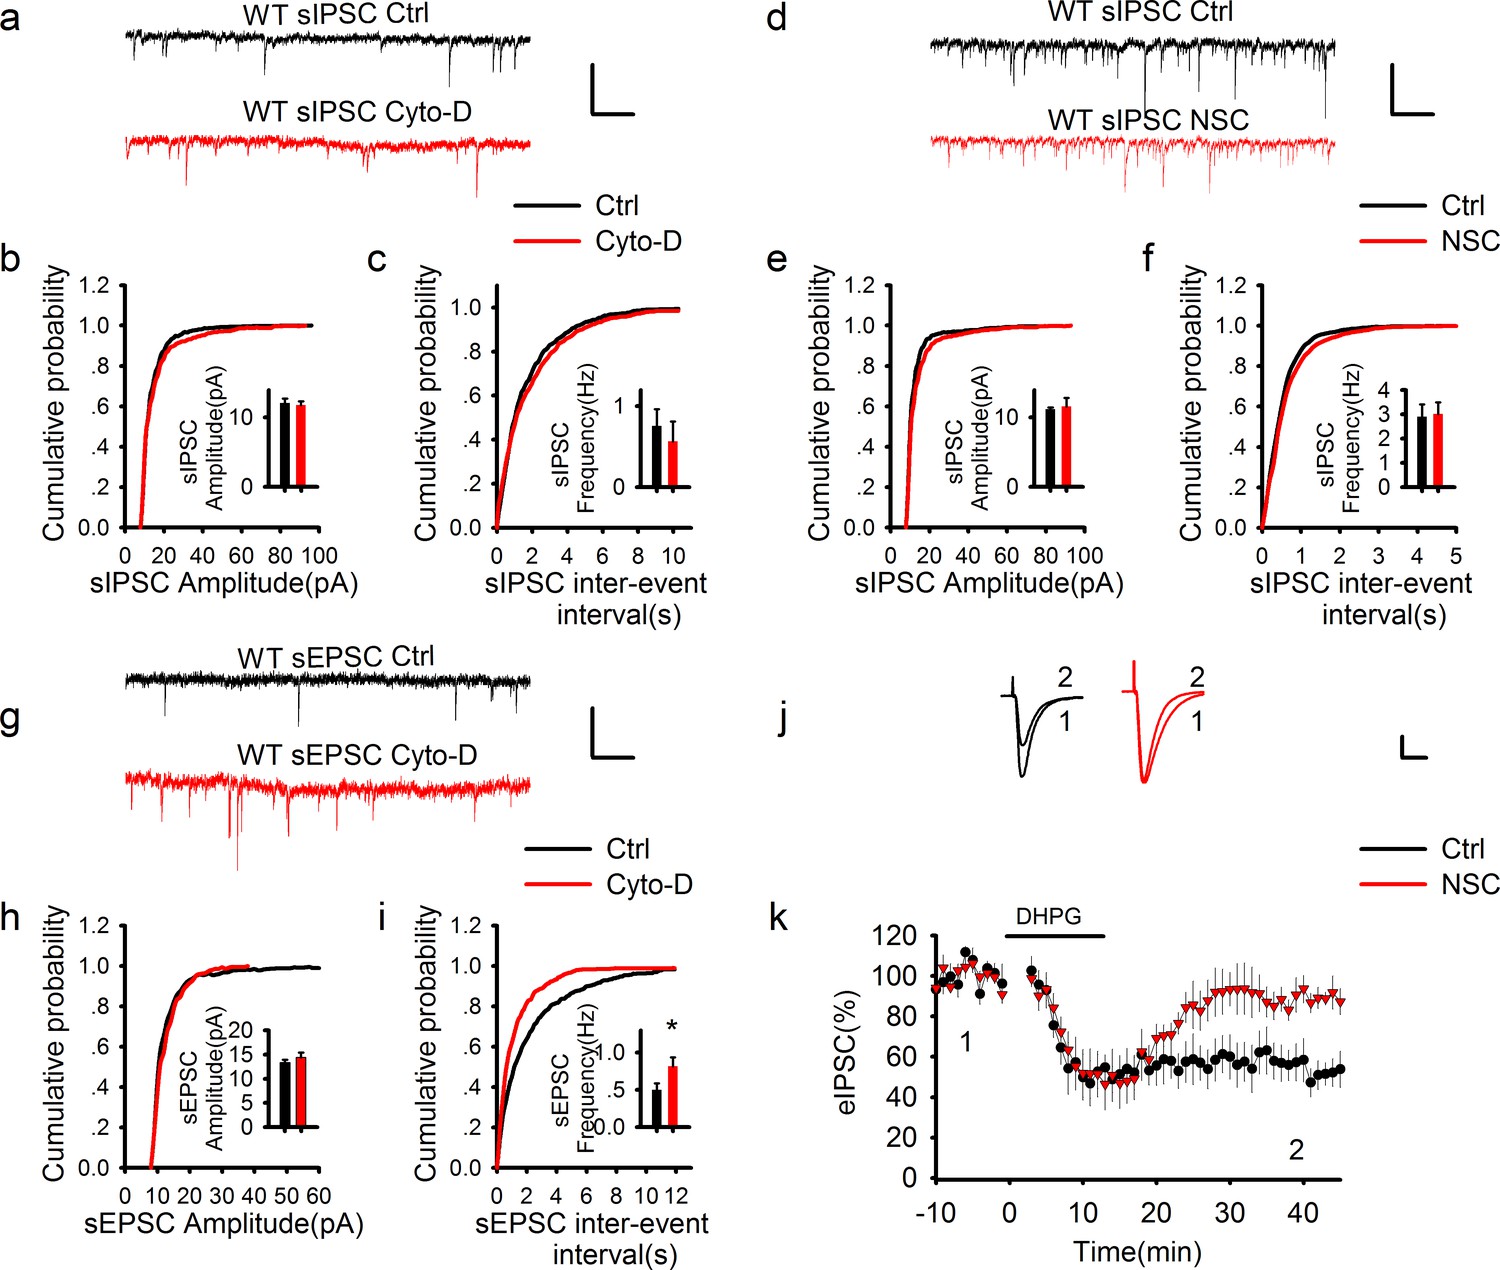
GABAergic transmission is independent of postsynaptic actin cytoskeleton.
(a–f) Sample traces of sIPSCs and summary graphs showing neither the actin polymerization inhibitor cytochalasin D (a–c) nor Rac1 inhibitor NSC23766 (d–f) had an effect on the amplitude (b: DMSO = 12.09 ± 0.65pA, n = 6 (3); Cyto-D = 11.82 ± 0.54 pA, n = 6 (3); p=0.757; e: Ctrl = 11.21 ± 0.26 pA, n = 6 (3); NSC = 11.57 ± 1.29 pA, n = 7 (3); p=0.806; t-tests) or frequency (c: DMSO = 0.79 ± 0.25 Hz, n = 6 (3); Cyto-D = 0.57 ± 0.24 Hz, n = 6 (3); p=0.538; f: Ctrl = 2.90 ± 0.51 Hz, n = 6 (3); NSC = 3.01 ± 0.48 Hz, n = 7 (3); p=0.867; t-tests). Scale bar: 20 pA/1 s. (g–i) Sample traces of sEPSCs and summary graphs showing actin polymerization inhibitor cytochalasin D had no effect on the amplitude (h: Ctrl = 13.48 ± 0.91 pA, n = 8 (3); NSC = 15.48 ± 1.33 pA, n=6 (3); p=0.248; t-test), but significantly increased the frequency of eEPSCs (i: Ctrl = 0.47 ± 0.09 Hz, n = 8 (3); NSC = 0.95 ± 0.17 Hz, n = 6 (3); *p=0.034; t-test). (j, k) Representative traces and summary graph of evoked EPSC (eEPSC) showing that the Rac1 inhibitor NSC23766 blocked DHPG-induced LTD (Ctrl = 52.04 ± 7.33%, n = 5 (5); NSC = 90.03 ± 5.21%, n=5 (5); *p=0.027; t-test). Scale bar: 25 pA/25 ms.
Figure 6 with 1 supplement
PAK1 disruption enhances endocannabinoid signaling.
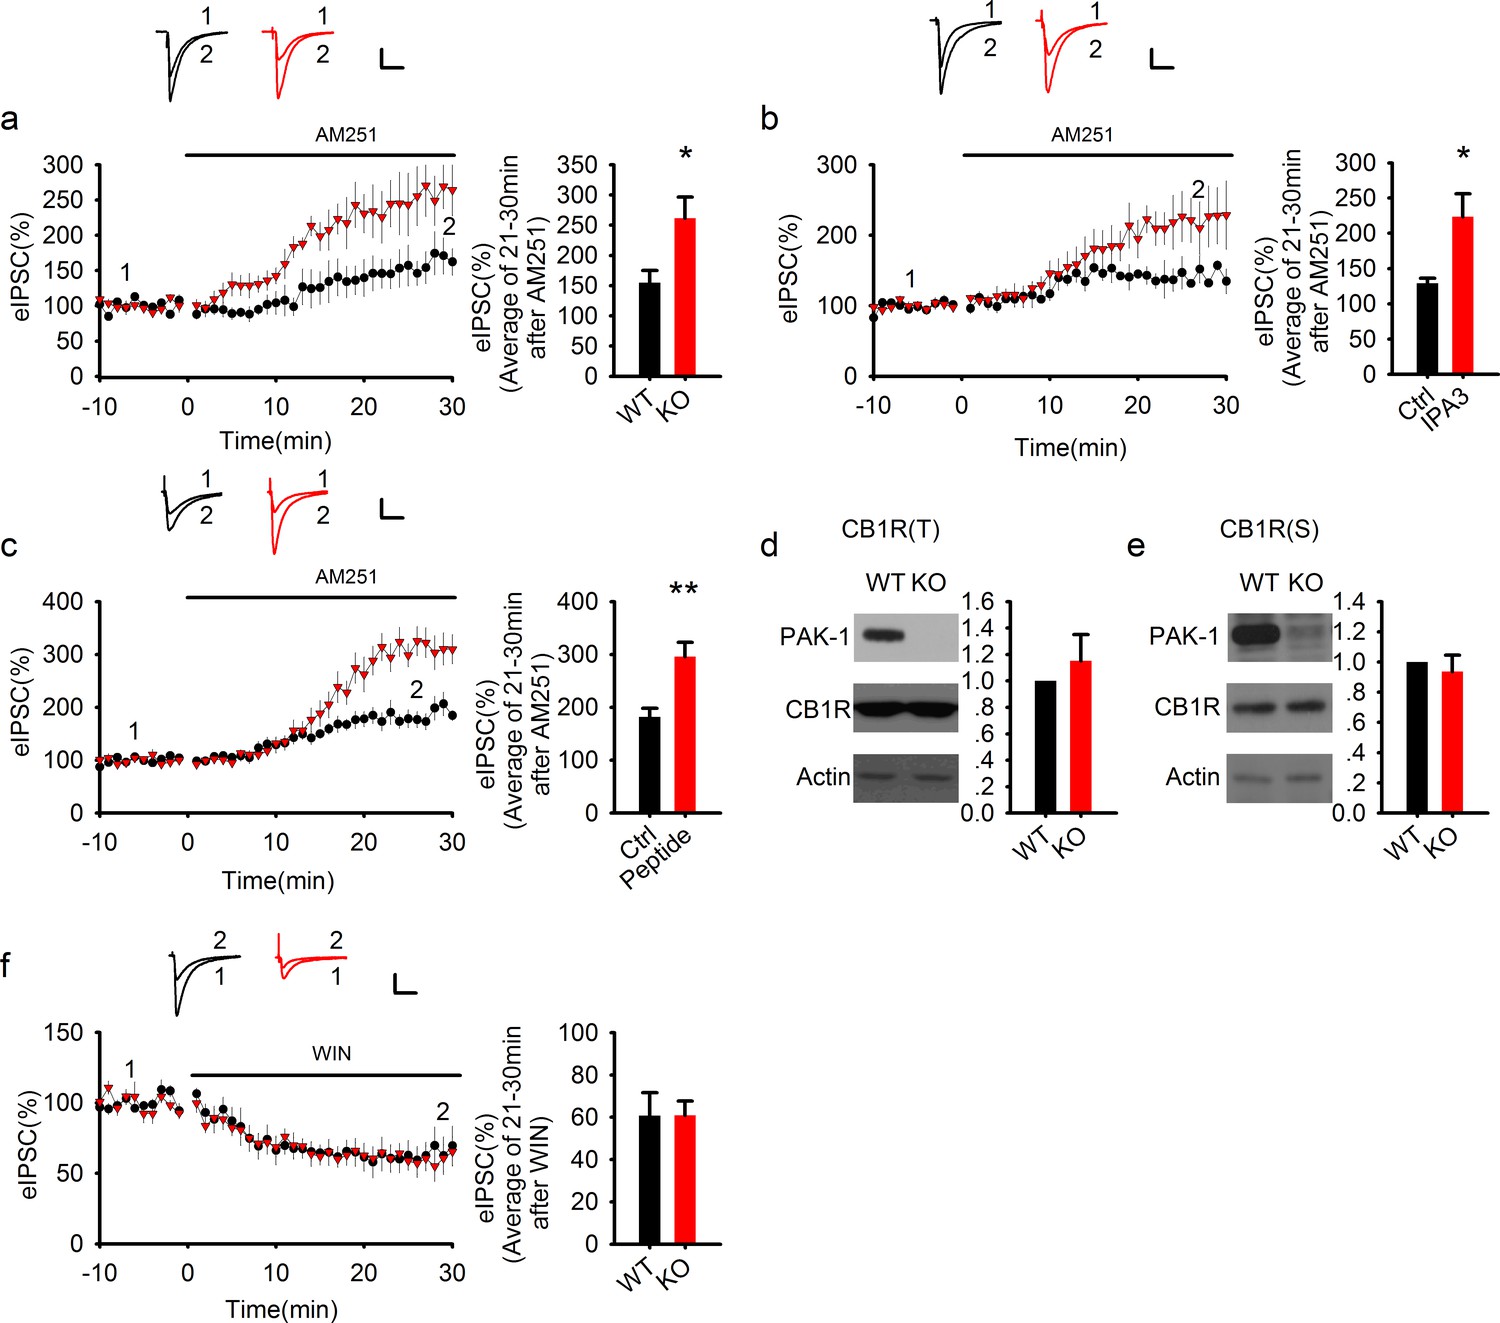
(a) Sample traces of eIPSC and averaged data showing that bath application of the CB1 receptor antagonist AM251 potentiated the amplitude of eIPSC significantly more in PAK1 KO compared to WT control (genotype: F(1, 11) = 7.51, *p=0.02; time: F(3, 43) = 26.833, ***p <0.001; repeated measures two-way ANOVA [also see Figure 6—source data 1]; at 21-30 min post AM251 application: WT = 154.77 ± 20.57%, n = 7 (5); KO = 261.41 ± 35.00%, n = 6 (4), *p=0.02; t-test). (b) Sample traces of eIPSC and averaged data showing that postsynaptic infusion of the PAK1 inhibitor IPA3 (for 30 min) was sufficient to enhance the subsequent potentiating effect of AM251 on eIPSC (genotype: F(1, 11) = 4.919, *p=0.049; time: F(3, 33) = 15, p<0.001; repeated measures two-way ANOVA [also see Figure 6—source data 2]; at 21-30 min post AM251 application: Ctrl = 129.17 ± 7.20%, n = 6 (5); IPA3 = 227.26 ± 38.26%, n = 7 (5); *p=0.024; t-test). Baseline responses (-10-0 min) shown here were taken 30 min after whole-cell break-in. (c) Sample traces of eIPSC and averaged data showing that postsynaptic infusion of the PAK1 inhibitory peptide (for 30 min) was sufficient to enhance the subsequent potentiating effect of AM251 on eIPSC (genotype: F(1, 11) = 10.254, **p=0.008; time: F(3, 33) = 70.824, ***p<0.001; repeated measures two-way ANOVA [also see Figure 6—source data 3]; at 21–30 min post AM251 application: Ctrl = 181.89 ± 15.94%, n = 7 (5); peptide = 295.71 ± 27.40%, n = 6 (4); ***p=0.001; t-test). Baseline responses (-10-0 min) shown here were taken 30 min after whole-cell break-in. (d, e) Western blots of hippocampal lysate and summary graphs showing that both total (d) and synaptosomal (e) CB1R protein levels were unaltered in PAK1 KO mice (KO total = 1.15 ± 0.20, n = 7 (7); p=0.468 normalized and compared to the WT; KO synaptosomal = 0.94 ± 0.11, n = 8 (8); p=0.567 normalized and compared to the WT; t-tests). (f) Sample traces of eIPSC and averaged data showing that bath application of the CB1 receptor agonist WIN depressed eIPSC to the same degree in PAK1 KO and WT control (genotype: F(1, 8) = 0.008, p=0.932; time: F(3, 24) = 31.556, ***p<0.001; repeated measures two-way ANOVA [also see Figure 6—source data 4]; at 21-30 min post WIN application: WT = 60.78 ± 10.78%, n = 5 (5); KO = 60.88 ± 6.73%, n = 5 (5); p=0.977; t-test). All scale bars: 40 pA/25 ms.
-
Figure 6—source data 1
Statistical data summary for Figure 6a: Effect of AM251 on eIPSC in WT and PAK1 KO using repeated measures two-way ANOVA.
- https://doi.org/10.7554/eLife.14653.018
-
Figure 6—source data 2
Statistical data summary for Figure 6b: Effect of AM251 on eIPSC in the presence or absence of IPA3 using repeated measures two-way ANOVA.
- https://doi.org/10.7554/eLife.14653.019
-
Figure 6—source data 3
Statistical data summary for Figure 6c: Effect of AM251 on eIPSC in the presence or absence of PAK1 inhibitory peptide using repeated measures two-way ANOVA.
- https://doi.org/10.7554/eLife.14653.020
-
Figure 6—source data 4
Statistical data summary for Figure 6f: Effect of WIN on eIPSC in WT and PAK1 KO using repeated measures two-way ANOVA.
- https://doi.org/10.7554/eLife.14653.021
Figure 6—figure supplement 1
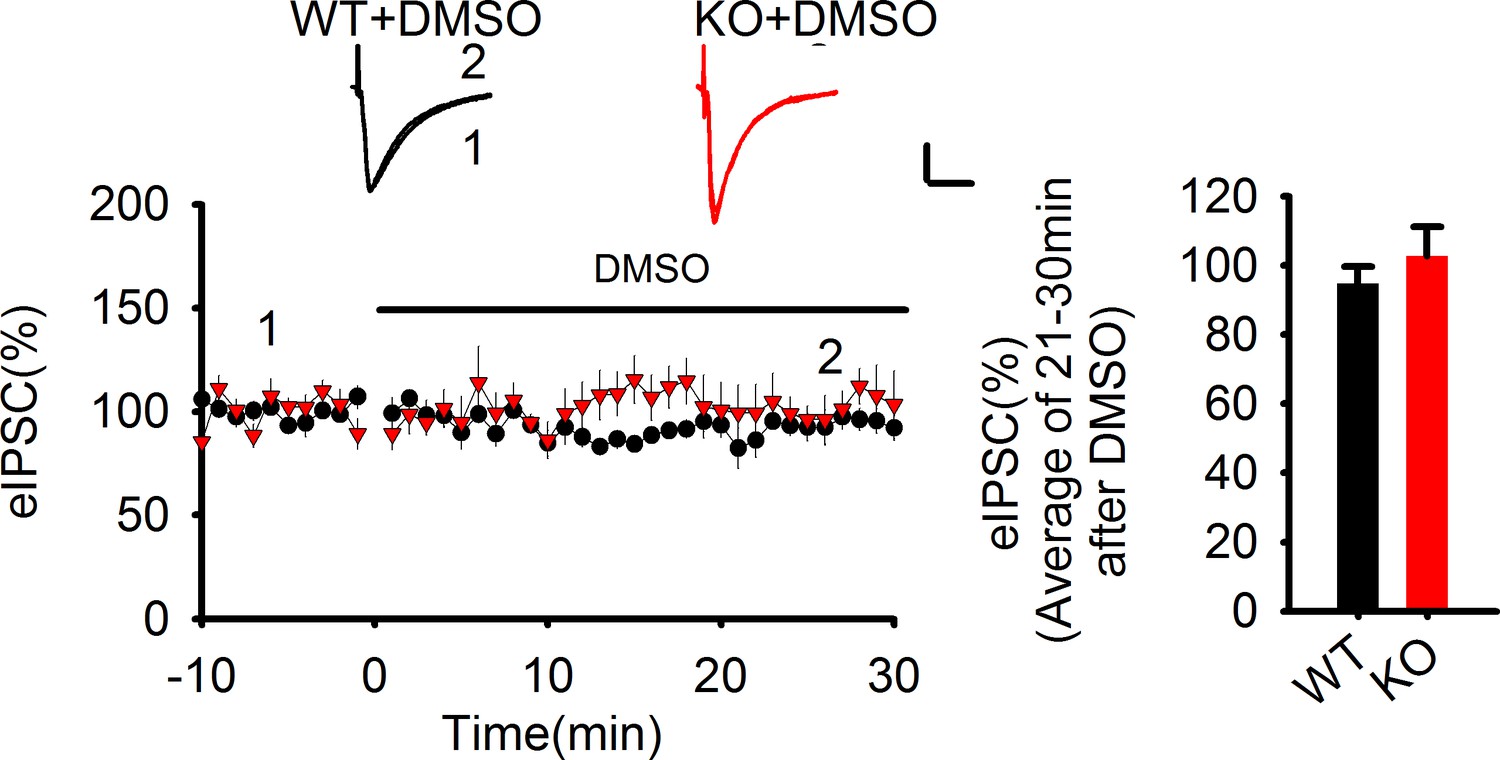
The lack of effect of DMSO on eIPSCs.
https://doi.org/10.7554/eLife.14653.022-
Figure 6—figure supplement 1—source data 1
Statistical data summary for Figure 6—figure supplement 1: Lack of effect of DMSO on eIPSC using repeated measures two-way ANOVA.
- https://doi.org/10.7554/eLife.14653.023
Figure 7 with 1 supplement
Elevated AEA and reduced COX-2 in PAK1 KO mice.
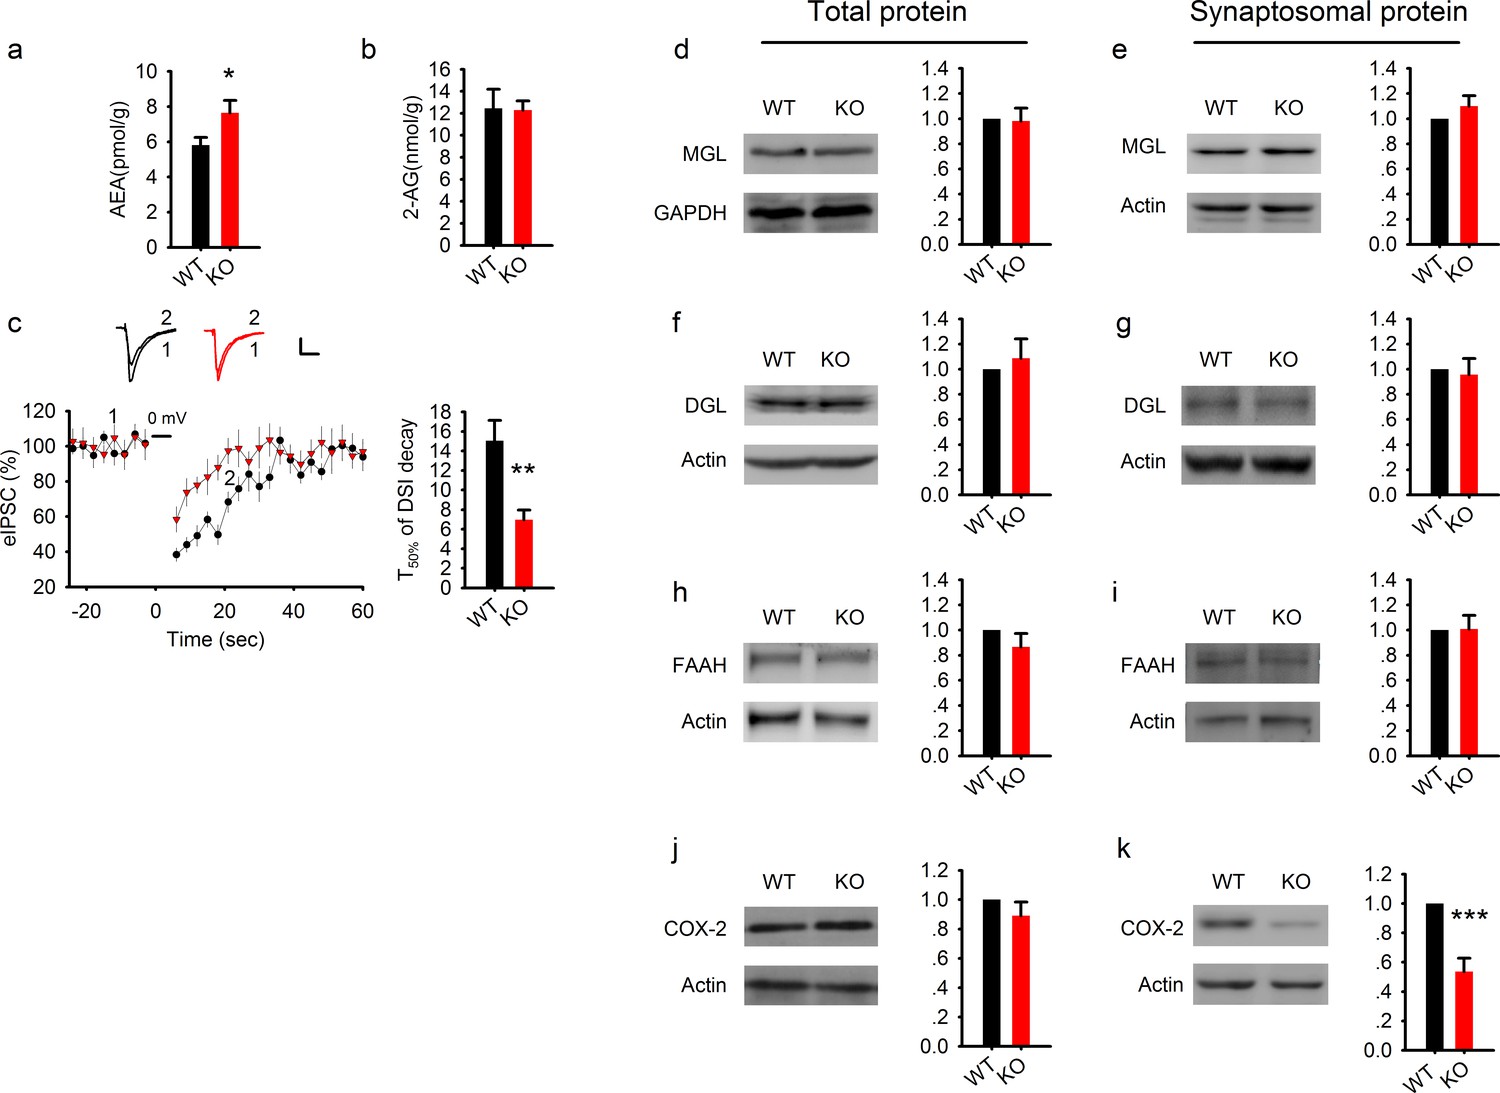
(a) Summary graph showing a significant increase in hippocampal tissue AEA in PAK1 KO compared to WT control (WT = 5.82 ± 0.44 pmol/g, n = 11 (11); KO = 7.64 ± 0.70 pmol/g, n = 13 (13), *p=0.046; t-test). (b). Summary graph showing no differences in hippocampal tissue 2-AG between PAK1 KO and WT control (WT = 12.46 ± 1.73 nmol/g, n = 11 (11); KO = 12.30 ± 0.82 nmol/g, n = 13 (13), p=0.932; t-test). (c) Sample traces of eIPSC and averaged data showing reduced DSI in PAK1 KO compared to WT control (time to reach 50% of baseline response T50%: WT = 15.06 ± 2.06s, n = 9 (5); KO = 6.98 ± 0.99s, n = 9 (3); **p=0.003; t-test). (d) Western blots of hippocampal lysate and summary graphs showing no differences in total MGL protein levels between PAK1 KO and WT control (KO = 0.98 ± 0.10, n = 6 (6), p=0.854 normalized and compared to WT; t-test). (e) Western blots of hippocampal synaptosomal protein fraction and summary graph showing no difference in the amount of MGL protein between PAK1 KO and WT control (KO = 1.01 ± 0.09, n = 7 (7); p=0.253 normalized and compared to WT; t-test). (f) Western blots of hippocampal lysate and summary graph showing no differences in total DGL protein levels between PAK1 KO and WT control (KO = 1.09 ± 0.15, n = 6 (6), p=0.583 normalized and compared to WT; t-test). (g) Western blots of hippocampal synaptosomal protein fraction and summary graph showing no difference in the amount of DGL protein between PAK1 KO and WT control (KO = 0.96 ± 0.13, n = 9 (9); p=0.738 normalized and compared to WT; t-test). (h) Western blots of hippocampal lysate and summary graph showing no differences in total FAAH protein levels between PAK1 KO and WT control (KO = 0.87 ± 0.11, n = 5 (5), p=0.247 normalized and compared to WT; t-test). (i) Western blots of hippocampal synaptosomal protein fraction and summary graph showing no difference in the amount of FAAH protein between PAK1 KO and WT control (KO = 1.01 ± 0.11, n = 6 (6); p=0.937 normalized and compared to WT; t-test). (j) Western blots of hippocampal lysate and summary graphs showing no differences in total COX-2 protein levels between PAK1 KO and WT control (KO = 0.89 ± 0.09, n = 7 (7), p=0.263 normalized and compared to WT; t-test). (k) Western blots of hippocampal synaptosomal protein fraction and summary graph showing reduced COX-2 protein in PAK1 KO compared to WT control (KO = 0.54 ± 0.09, n = 10 (10); ***p<0.001 normalized and compared to WT; t-test).
Figure 7—figure supplement 1
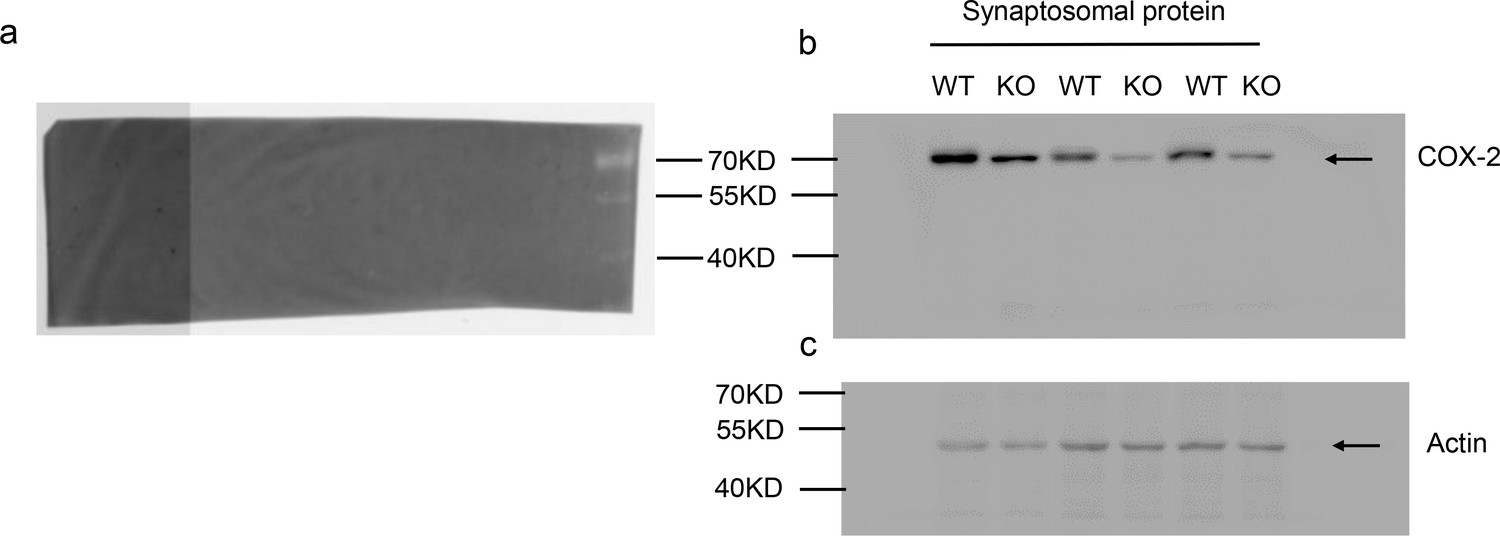
Reduced synaptosomal COX-2 in PAK1 KO hippocampus.
https://doi.org/10.7554/eLife.14653.025
Figure 8
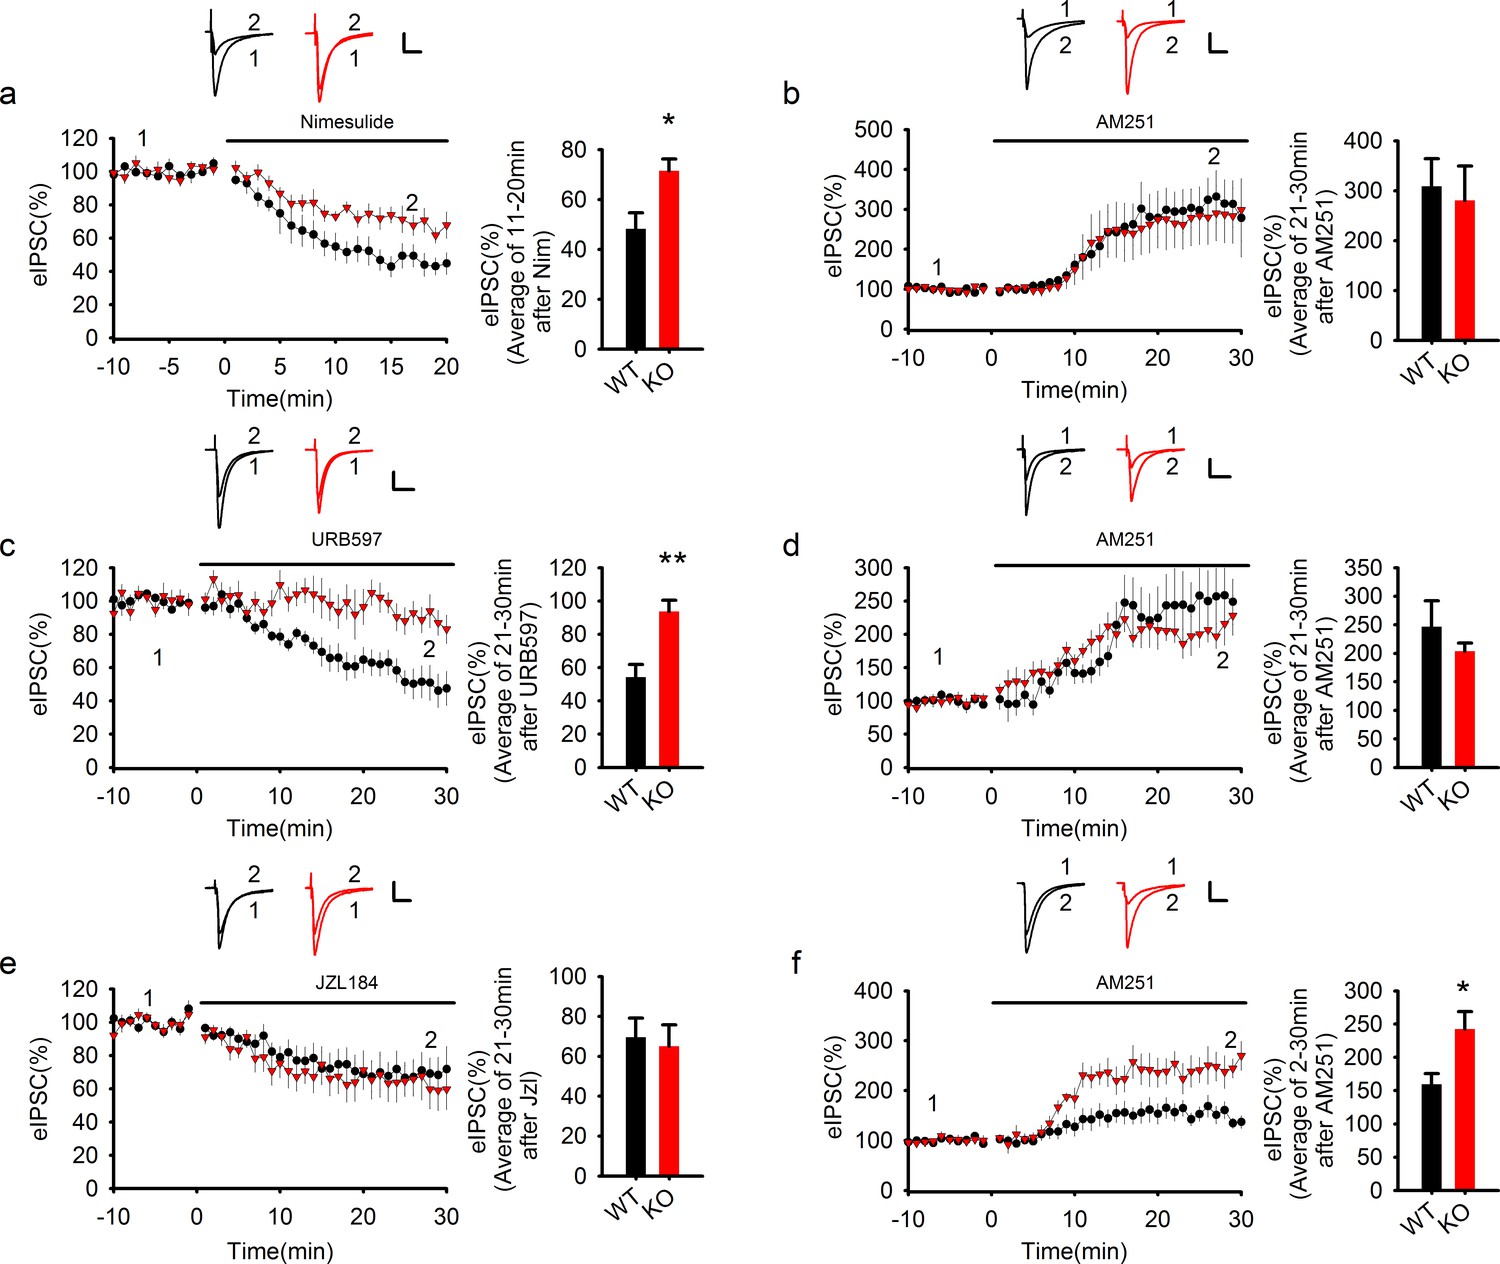
COX-2 inhibition recapitulates the effect of PAK1 disruption.
(a) Sample traces and averaged data of eIPSCs showing that bath application of the COX-2 inhibitor Nim depressed eIPSCs in WT, but this depression was significantly reduced in PAK1 KO neurons (genotype: F(1, 12) = 7.639, *p=0.017; time: F(2, 24) = 87.676, ***p<0.001; repeated measures two-way ANOVA [also see Figure 8—source data 1]; at 11-20 min post Nim application: WT = 48.26 ± 6.42%, n = 7 (3); KO = 71.51 ± 4.75%, n = 7 (3); *p=0.013; t-test). Scale bar: 30 pA/25 ms. (b) Sample traces and averaged data showing that following the Nim treatment, AM251 potentiated eIPSCs to the same degree in WT and PAK1 KO neurons (genotype: F(1, 9) = 0.044, p=0.839; time: F(3, 27) = 15.222; ***p<0.001; repeated measures two-way ANOVA [also see Figure 8—source data 2]; at 21-30 min post AM251 application: WT = 308.58 ± 55.37%, n = 5 (4); KO = 280.53 ± 69.32%, n = 6 (5); p=0.766; t-test). Scale bar: 60 pA/25 ms. Baseline responses (-10-0 min) shown here were taken 30 min after the onset of the Nim treatment. Nim was present throughout the entire experiment. (c) Sample traces and averaged data of eIPSCs showing that bath application of the FAAH inhibitor URB597 depressed eIPSCs in WT, but this depression was significantly reduced in PAK1 KO neurons (genotype: F(1, 13) = 13.830, **p=0.003; time: F(3, 39) = 14.122, ***p<0.001; repeated measures two-way ANOVA [also see Figure 8—source data 3]; at 21-30 min post URB597 application: WT = 54.19 ± 7.59%, n = 7 (5); KO = 93.74 ± 6.80%, n = 8 (3); **p=0.002; t-test). Scale bar: 70 pA/25 ms. (d) Sample traces and averaged data showing that following the URB597 treatment, AM251 potentiated eIPSCs to the same degree in WT and PAK1 KO neurons (genotype: F(1, 8) = 0.055, p=0.821; time: F(3, 24) = 23.459, ***p<0.001; repeated measures two-way ANOVA [also see Figure 8—source data 4]; at 21-30 min post AM251 application: WT = 246.61 ± 45.34%, n = 5 (3); KO = 208.59 ± 17.52%, n = 5 (4); p=0.391; t-test). Scale bar: 60 pA/25 ms. Baseline responses (-10-0 min) shown here were taken 30 min after the onset of the URB597 treatment. URB597 was present throughout the entire experiment. (e) Sample traces and averaged data showing no differences in eIPSC depression by the MGL inhibitor JZL184 between PAK1 KO and WT control (genotype: F(1, 16) = 0.265, p=0.614; time: F(3, 48) = 17.292, ***p<0.001; repeated measures two way ANOVA [also see Figure 8—source data 5]; at 21-30 min post JZL184 application: WT = 69.53 ± 9.60%, n = 10 (8); KO = 64.99 ± 10.76%, n = 8 (6); p=0.757; t-test). Scale bar: 35 pA/25 ms. (f) Sample traces and averaged data showing that following JZL184 treatment, AM251 still induced eIPSC potentiation significantly more in PAK1 KO compared to WT control (genotype: F(1, 9) = 7.770, *p=0.021; time: F(3, 27) = 30.146, ***p<0.001; repeated measures two-way ANOVA [also see Figure 8—source data 6]; at 21–30 min post AM251 application: WT = 159.76 ± 16.08%, n = 6 (6); KO = 242.60 ± 26.03%, n = 5 (4); *p=0.020; t-test). Baseline responses (-10-0 min) shown here were taken 30 min after the onset of the JZL184 treatment. JZL184 was present throughout the entire experiments. Scale bar: 60 pA/25 ms.
-
Figure 8—source data 1
Statistical data summary for Figure 8a: Effect of Nimesulide on eIPSC in WT and PAK1 KO using repeated measures two-way ANOVA.
- https://doi.org/10.7554/eLife.14653.027
-
Figure 8—source data 2
Statistical data summary for Figure 8b: Effect of AM251 on eIPSC after Nimesulide treatment in WT and PAK1 KO using repeated measures two-way ANOVA.
- https://doi.org/10.7554/eLife.14653.028
-
Figure 8—source data 3
Statistical data summary for Figure 8c: Effect of URB597 on eIPSC in WT and PAK1 KO using repeated measures two-way ANOVA.
- https://doi.org/10.7554/eLife.14653.029
-
Figure 8—source data 4
Statistical data summary for Figure 8d: Effect of AM251 on eIPSC after URB597 treatment in WT and PAK1 KO using repeated measures two-way ANOVA.
- https://doi.org/10.7554/eLife.14653.030
-
Figure 8—source data 5
Statistical data summary for Figure 8e: Effect of JZL184 on eIPSC in WT and PAK1 KO using repeated measures two-way ANOVA.
- https://doi.org/10.7554/eLife.14653.031
-
Figure 8—source data 6
Statistical data summary for Figure 8f: Effect of AM251 on eIPSC after JZL treatment in WT and PAK1 KO using repeated measures two-way ANOVA.
- https://doi.org/10.7554/eLife.14653.032
Figure 9
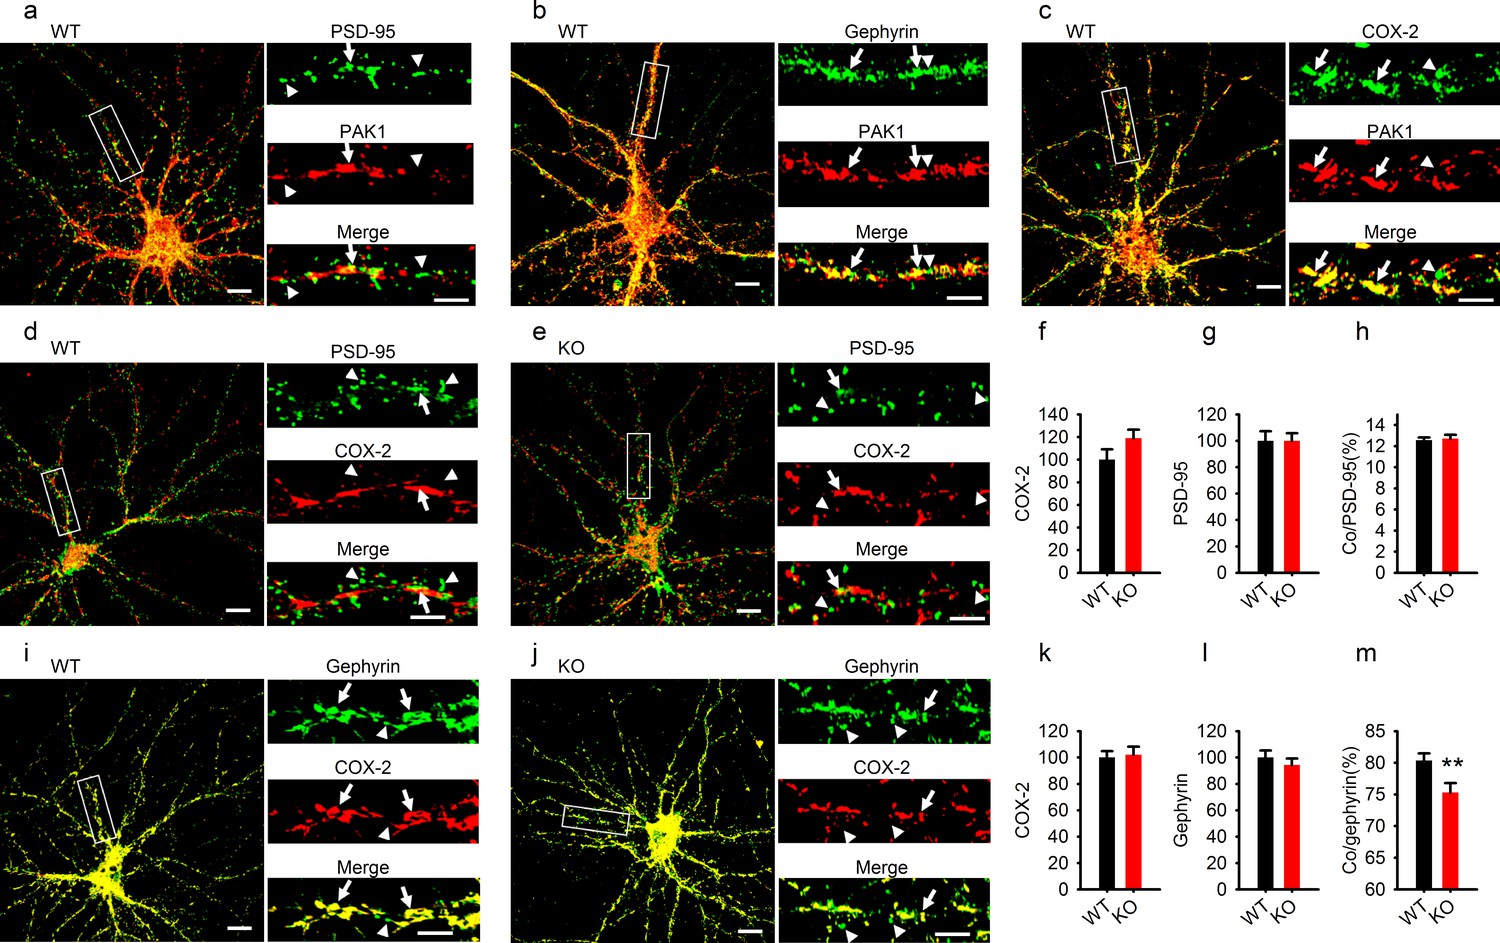
Reduced COX-2 localization at GABAergic synapses in PAK1 KO neurons.
(a–c) Cultured hippocampal neurons costained for PAK1 and the excitatory marker PSD-95 (a), the GABAergic marker gephyrin (b) or COX-2 (c) showing PAK1 colocalization with PSD-95, gephyrin and COX-2. (dh) Cultured hippocampal neurons costained for COX-2 and PSD9-5 in WT (d) and PAK1 KO neurons (e) and summary graphs (fh) showing no differences between genotypes in total COX-2 (f, WT = 100 ± 9.11, n = 21 (3); KO = 119.08 ± 7.50, n = 16 (3); p=0.131; t-test), total PSD-95 (g, WT = 100 ± 7.33, n = 21 (3); KO = 100.03 ± 5.68, n = 16 (3); p=0.997; t-test) and COX-2 colocalized with PSD-95 (h, WT = 12.55 ± 0.26%, n = 21 (3); KO = 12.72 ± 0.35%, n = 16 (3); p=0.700; t-test). (im) Cultured hippocampal neurons costained for COX-2 and gephyrin in WT (i) and PAK1 KO neurons (j) and summary graphs (km) showing no changes in total COX-2 (k, WT = 100 ± 4.90, n = 17 (3); KO = 102.09 ± 6.14, n = 15 (3); p=0.792; t-test) or total gephyrin (l, WT = 100 ± 5.31, n = 17 (3); KO = 94.29 ± 4.91, n = 15 (3); p=0.432; t-test), but reduced COX-2 colocalized with gephyrin (m, WT = 80.35 ± 1.14, n = 17 (3); KO = 75.32 ± 1.47, n = 15 (3); **p=0.008; t-test). Scale bars: 10 μm for whole neuron images and 5 μm for the enlarged dendritic fragments. Arrows indicate colocalization and arrowheads for no colocalization.
Figure 10
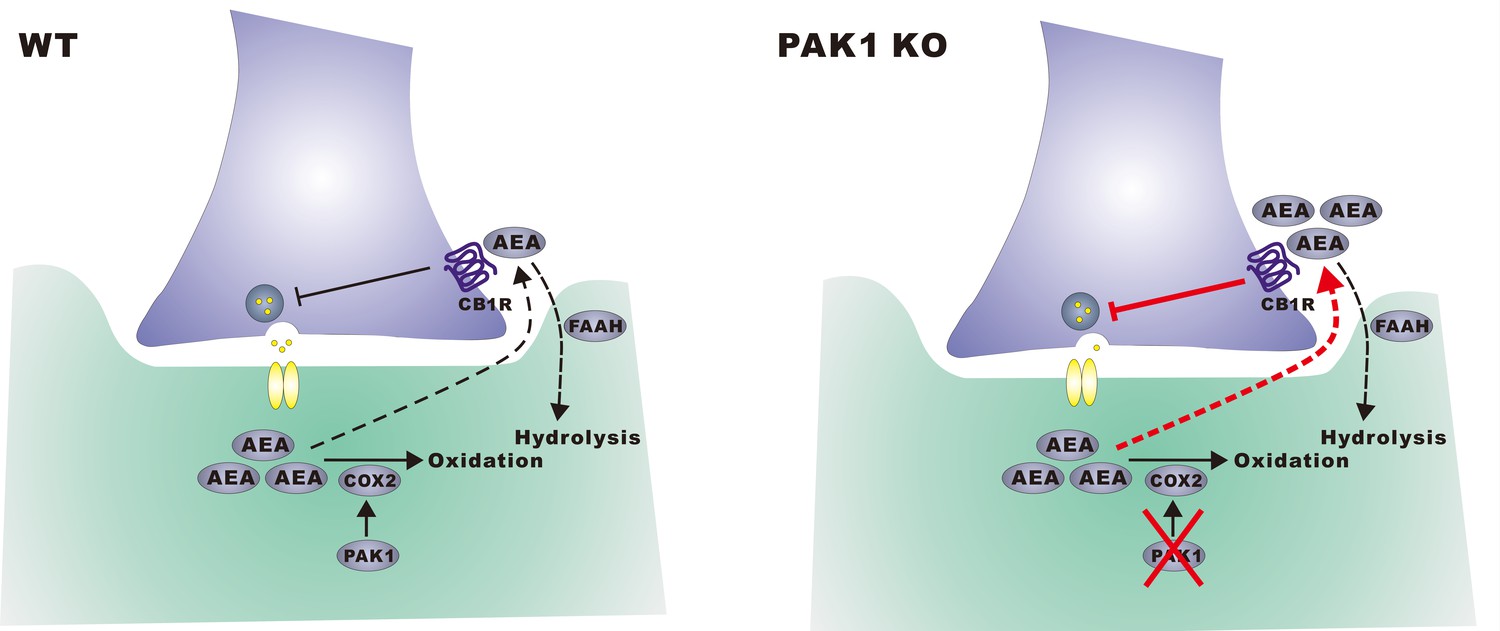
A hypothetical model.
In wild type neurons, constitutively active PAK1 is required for maintaining a sufficient level of synaptic COX-2 to keep AEA low, thus less suppression of GABA release and normal inhibitory transmission. In the absence of PAK1, synaptic COX-2 is reduced, which leads to accumulation of AEA, increased suppression of GABA release and impaired inhibitory transmission and E/I balance.
Download links
A two-part list of links to download the article, or parts of the article, in various formats.
Downloads (link to download the article as PDF)
Open citations (links to open the citations from this article in various online reference manager services)
Cite this article (links to download the citations from this article in formats compatible with various reference manager tools)
p21-activated kinase 1 restricts tonic endocannabinoid signaling in the hippocampus
eLife 5:e14653.
https://doi.org/10.7554/eLife.14653


