ELKS controls the pool of readily releasable vesicles at excitatory synapses through its N-terminal coiled-coil domains
- Harvard Medical School, United States
Figures
Figure 1 with 2 supplements
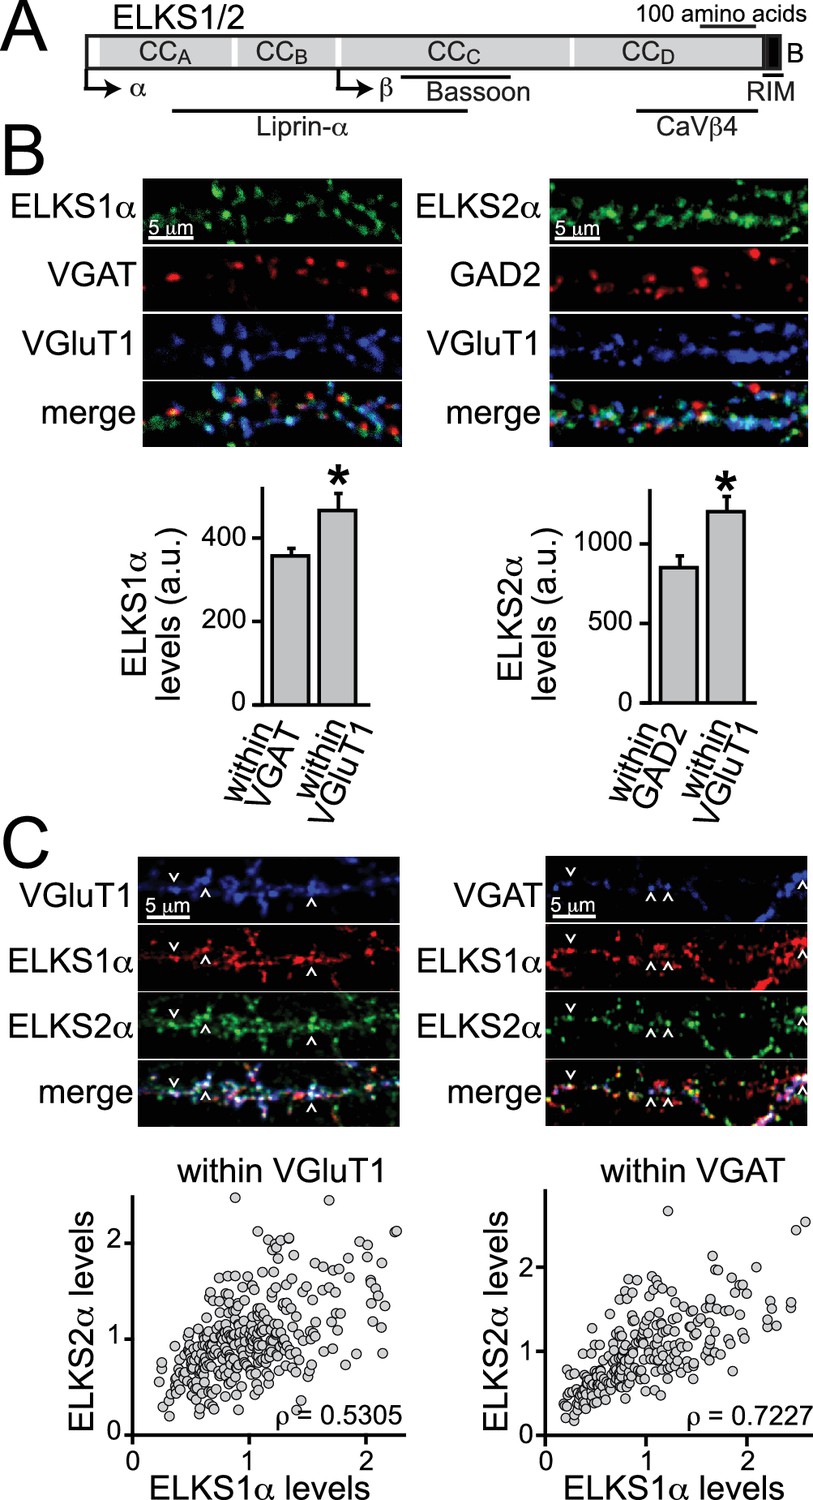
ELKS1α and ELKS2α are co-expressed at excitatory synapses.
(A) Schematic of ELKS protein structure. Arrows: transcriptional start sites of α- and β-ELKS, CCA-D: coiled-coil regions A - D (ELKS1: CCA1MYG…SKI208, CCB 209TIW…ENN358, CCC 359MLR…EAT696, CCD697LEA…EEE988; ELKS2: CCA1MYG…ARM204, CCB205SVL…ENI362, CCC363HLR…NIE656, CCD657DDS…DEE917, B: PDZ-binding sequence (ELKS1: 989GIWA992, ELKS2: 918GIWA921) of the ELKS-B C-terminal splice variant. Binding regions for interacting active zone proteins are indicated with black bars. (B) Sample images and quantification of ELKS1α (left) and ELKS2α (right) expression levels at excitatory and inhibitory synapses. VGAT or GAD2 (red, inhibitory synapses) and VGluT1 (blue, excitatory synapses) staining was used to define regions of interest (ROIs), respectively (control n = 4 independent cultures, cDKO n = 4, 10 images were averaged per culture). All data are means ± SEM; *p≤0.05 as determined by Student's t test. (C) Sample images (top) and correlation of expression levels of ELKS1α and ELKS2α (bottom) at excitatory (left) and inhibitory (right) synapses. Arrowheads indicate example puncta used to define ROIs. Data points represent the fluorescent intensity of ELKS1α within an ROI plotted against the ELKS2α signal in the same ROI. Within a single channel, individual puncta are normalized to the average intensity across all puncta (excitatory synapses: 329 ROIs/30 images/3 independent cultures; inhibitory synapses: 250/30/3). ρ: Spearman rank correlation between ELKS1α and ELKS2α.
Figure 1—figure supplement 1
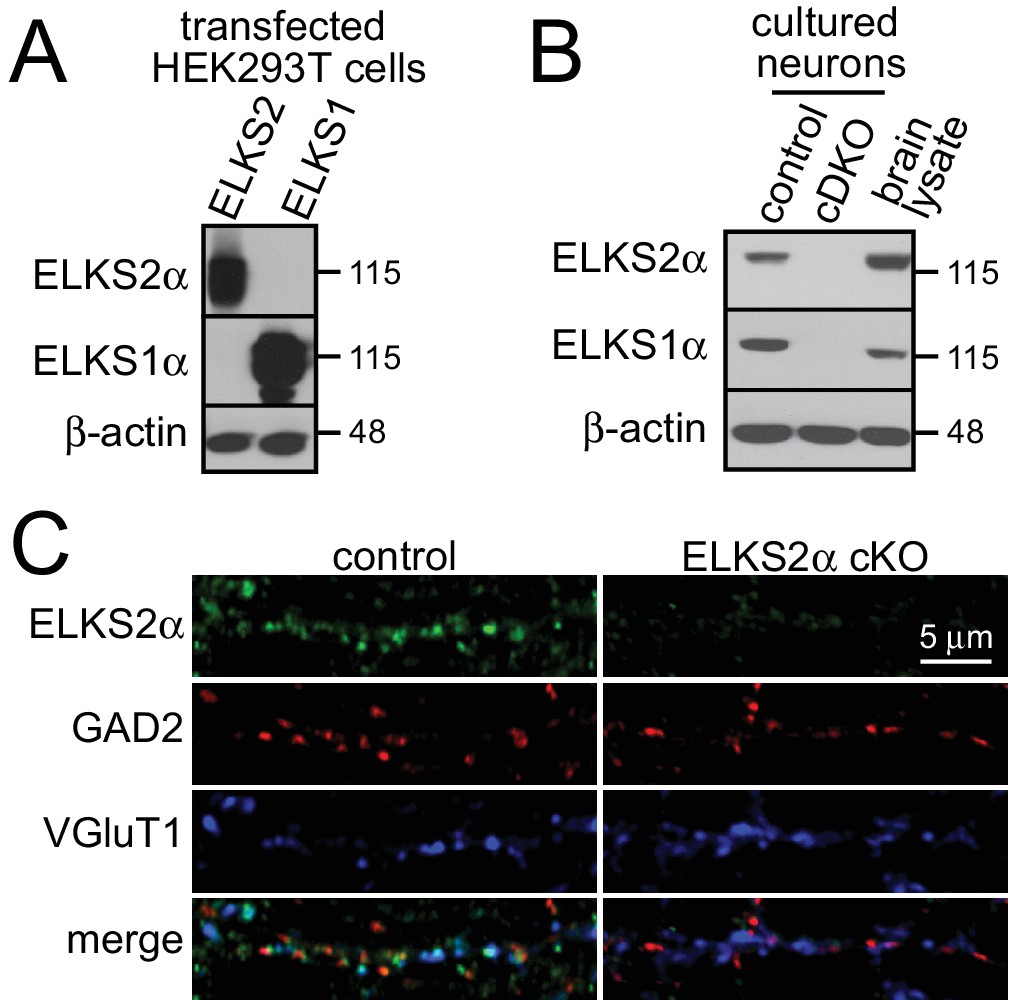
ELKS antibody specificity.
(A) Western blot for testing specificity of ELKS2α (1029, top) and ELKS1α (E-1, middle) antibodies against samples of HEK293T cells transfected with ELKS1αB or ELKS2αB cDNAs. The ELKS2α specific antibodies were raised in rabbits to a non-conserved sequence between ELKS1 and ELKS2 (109LSHTDVLSYTDQ120), the E-1 antibody is commercially available. β-actin was used as a loading control. (B) Western blot testing reactivity of ELKS2α (top) and ELKS1α (middle) in cultured cDKO and control hippocampal neurons and whole brain homogenate. β-actin was used as a loading control. (C) ELKS2α antibodies were affinity purified using the ELKS2 peptide and characterized via immunostaining in cultured control and ELKS2α cKO neurons. ELKS2α cKO neurons were generated from ELKS2αfloxed mice (Kaeser et al., 2009), and neurons were stained for ELKS2α (1029), GAD2, and VGluT1.
Figure 1—figure supplement 2
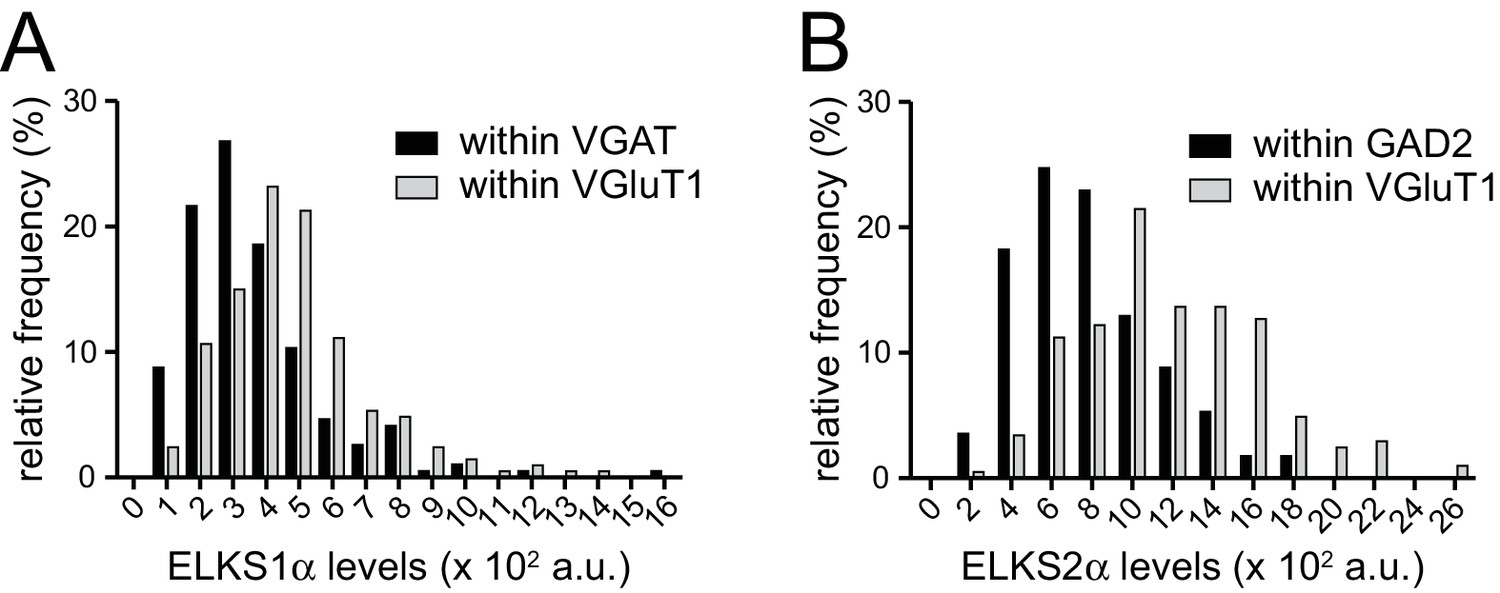
Frequency distributions of ELKS1α and ELKS2α at excitatory and inhibitory synapses.
(A) Histogram displaying the frequency distribution of ELKS1α intensity within VGAT (black bars, n = 194 ROIs/40 images/4 independent cultures) or VGluT1 (grey bars, n = 207/40/4) labeled puncta. (B) Histogram displaying the frequency distribution of ELKS2α intensity within GAD2 (black bars, n = 170/40/4) or VGluT1 (grey bars, n = 205/40/4) labeled puncta. The analysis shown in this figure uses the data presented in the Figure 1B.
Figure 2 with 1 supplement

ELKS1α/2α control neurotransmitter release at excitatory synapses.
(A–C) Sample traces and quantification of IPSC (A), AMPAR-EPSC (B), and NMDAR-EPSC (C) amplitudes and rise times in control and ELKS1α/2α cDKO neurons. Bar graphs show quantification of the peak amplitude (middle) and quantification of the rise time from 20% to 80% of the peak amplitude (right, A: control n = 18 cells/4 independent cultures, cDKO n = 18/4; B: control n = 18/4, cDKO n = 16/4; C: control n = 15/3, cDKO n = 15/3). (D) Sample traces (top) and quantification (bottom) of mEPSC frequency, amplitude, and 20–80% rise time (control n = 16/3, cDKO n = 15/3). Sample traces on the top left show 10 s of recording time. Sample traces on the top right are the overlayed averaged events from an individual cell in each condition normalized for amplitude. All data are means ± SEM; *p≤0.05, **p≤0.01, ***p≤0.001 as determined by Student's t test.
Figure 2—figure supplement 1
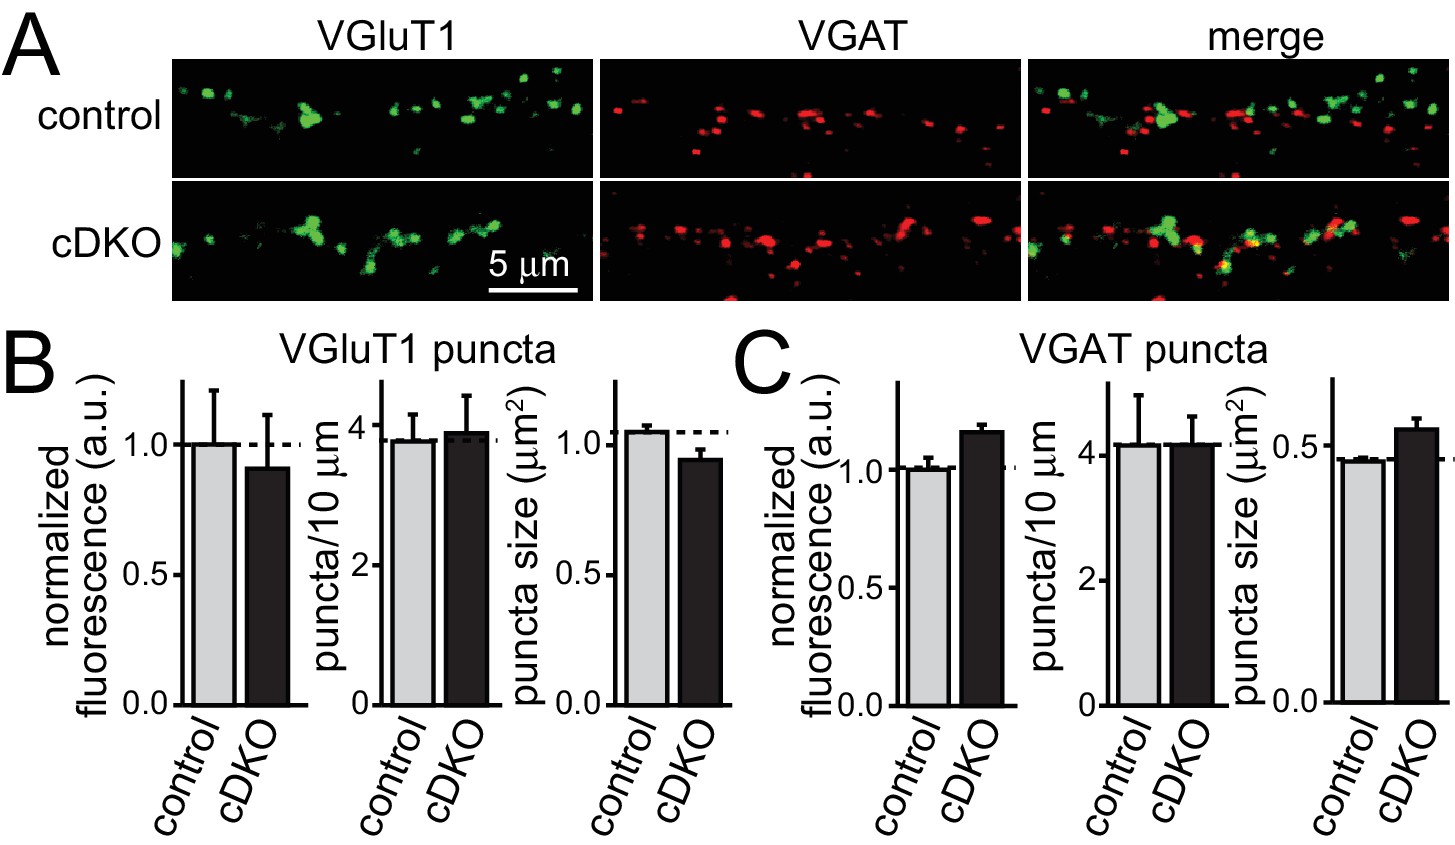
No change in synapse number in ELKS1α/2α cDKO cultures.
(A) Sample images of excitatory (green) and inhibitory (red) synapses in control and cDKO neurons. (B and C) Quantification for excitatory (B) and inhibitory (C) synapses of fluorescence intensity, synapse number (puncta/10 μm), and puncta size (control n = 3 independent cultures, cDKO n = 3, 10 images per culture were averaged per condition). All data are means ± SEM.
Figure 3 with 1 supplement
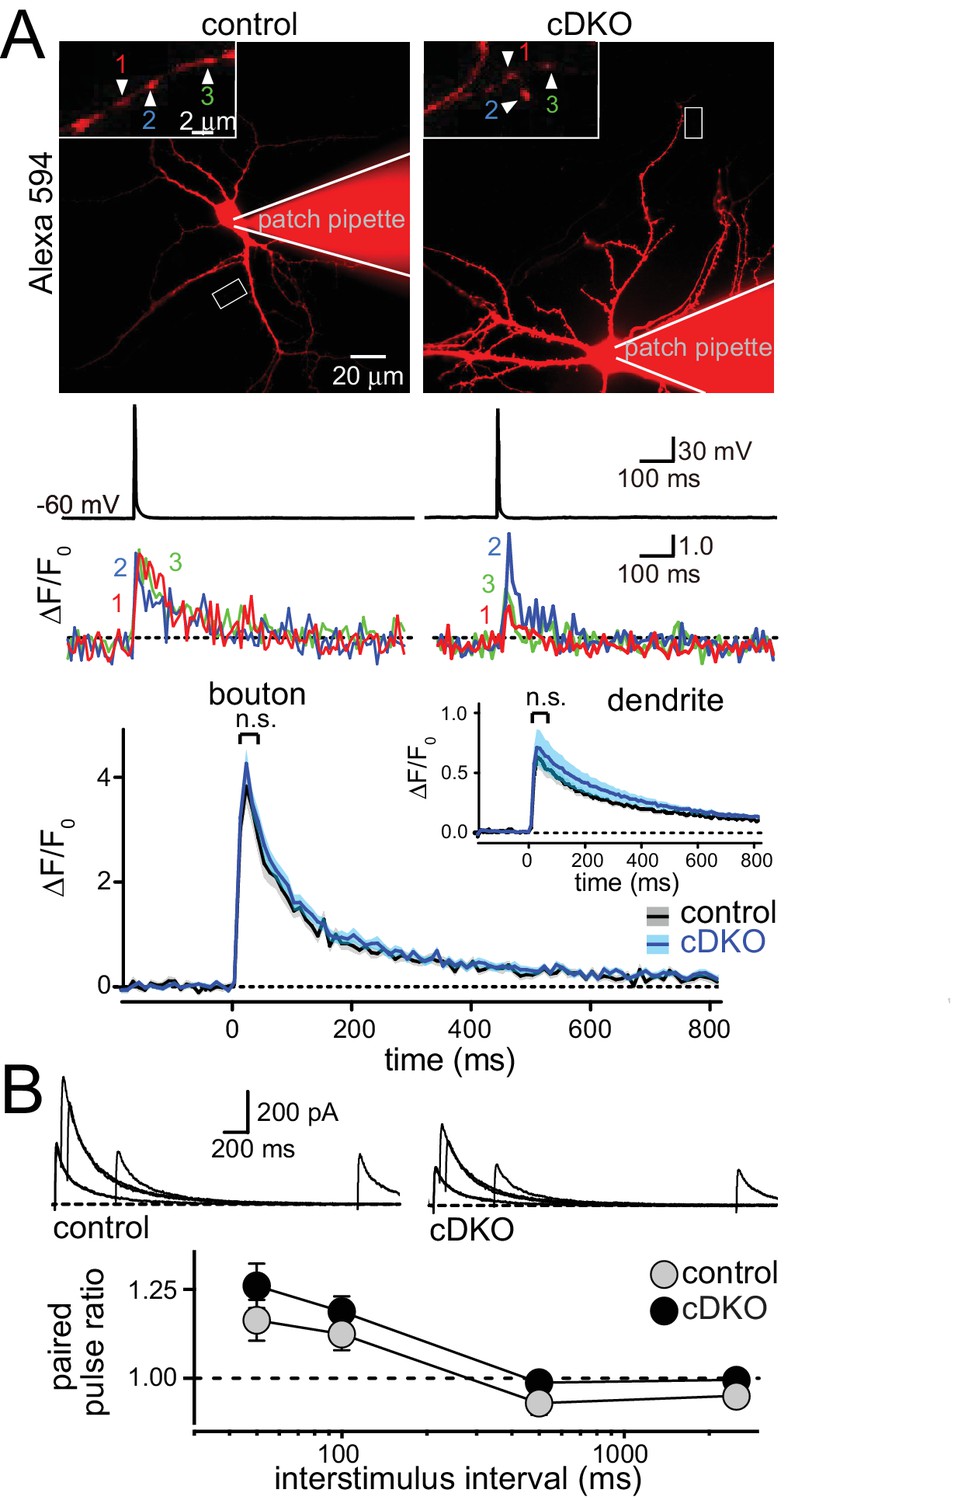
ELKS1α/2α do not control Ca2+ influx and release probability in excitatory nerve terminals.
(A) Sample images (top, imaged boutons are numbered and color coded), action potential and imaging traces (middle) and summary plots (bottom) of single action potential-induced Ca2+ transients imaged by Fluo-5F fluorescence in presynaptic boutons are shown, the inset shows the same plot for dendrites. Data are shown as mean (line) ± SEM (shaded area) and analyzed by two-way ANOVA: genotype, n.s.; time, ***p<0.001; interaction, n.s. (Boutons: control n = 60 boutons/6 cells /4 independent cultures, cDKO n = 80/8/4; dendrites: control n = 6 dendrites/6 cells/4 independent cultures, cDKO n = 8/8/4). (B) Sample traces (top) and quantification of paired pulse ratios (PPRs, bottom) of evoked NMDAR-EPSCs. Example traces showing overlayed responses to pairs of stimuli at 50, 100, 500, and 2500 ms interstimulus intervals. PPRs (amplitude 2/amplitude 1) are plotted against the interstimulus interval. Significance as analyzed by two-way ANOVA: genotype, n.s.; interstimulus interval, ***p<0.001; interaction, n.s. (control n = 17 cells/3 independent cultures, cDKO n = 19/3).
Figure 3—figure supplement 1
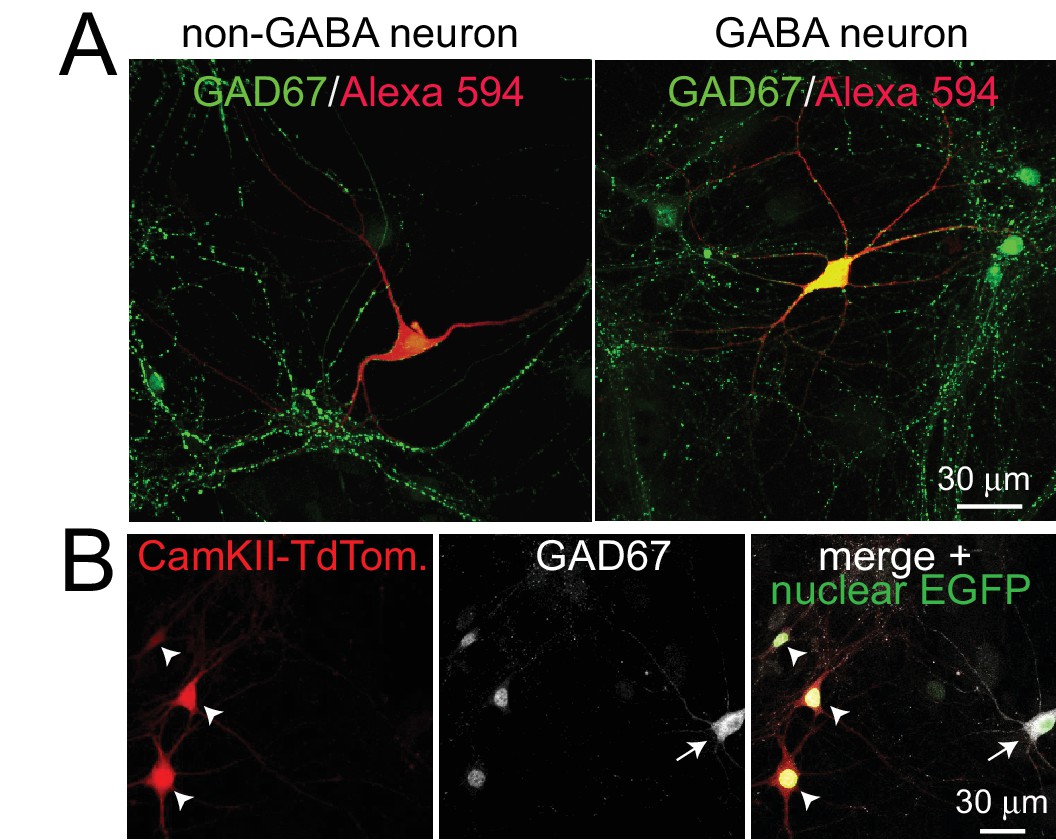
Post-hoc identification of excitatory neurons after presynaptic Ca2+ imaging.
(A) In each presynaptic Ca2+ imaging experiment, cultured neurons were stained post-hoc with GAD67 antibodies to label the soma and neurites of inhibitory neurons, and the imaged neurons were identified by the Alexa 594 fill (red). The left panel shows an example of non-GABA neuron (negative for GAD67) and the right panel a GABA neuron (positive for GAD67). (B) In an independent experiment, excitatory neurons were marked with a lentivirus expressing TdTomato (arrowheads) under a CaMKII promoter in addition to a lentivirus that labeled all neurons with nuclear EGFP (merged image). Inhibitory neurons were identified by somatic and dendritic GAD67 staining (arrow, GAD67 antibodies have a nuclear background staining in all neurons). Of the 114 neurons we analyzed, 80 were TdTomato positive (excitatory), 23 were GAD67 positive (inhibitory), and 11 were negative for both markers. Thus, 80 out of 91 of the GAD67 negative neurons were identified as excitatory neurons. The remaining neurons may be excitatory, inhibitory, or modulatory.
Figure 4

ELKS1α/2α control RRP at excitatory synapses.
(A) Sample traces showing AMPAR-EPSCs in response to superfusion with 500 mOsm sucrose (left). The bar graph on the right shows the AMPAR-EPSC charge transfer, quantified as the area under the curve during the first ten seconds of the response (control n = 30/3, cDKO n = 29/3). (B) Sample traces (left) of NMDAR-EPSCs during a short action potential train (10 stimuli at 20 Hz). The charge transfer during the train and in the two seconds immediately after the train is quantified separately on the right (control n = 14/3, cDKO n = 14/3). All data are means ± SEM; *p≤0.05, **p≤0.01 as determined by Student's t test.
Figure 5 with 2 supplements
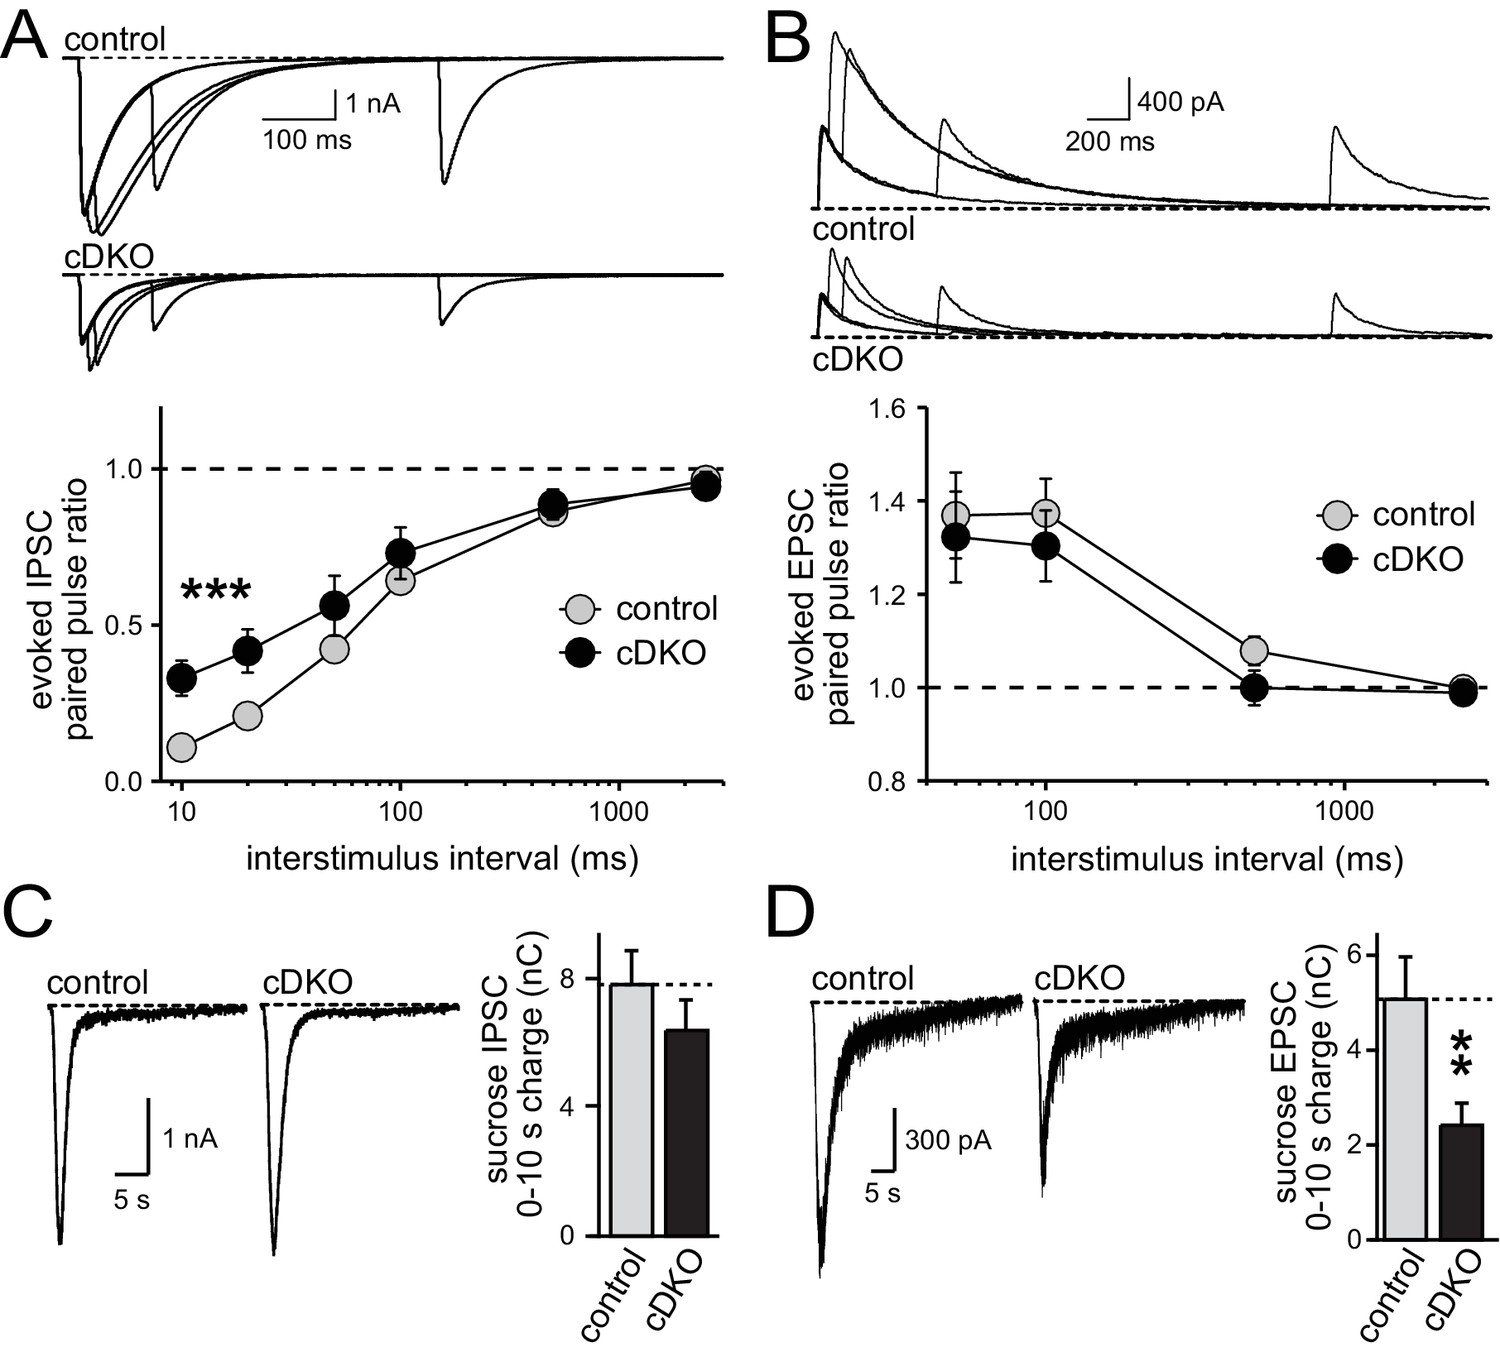
Direct comparison of IPSC and EPSC phenotypes of ELKS1α/2α cDKO.
(A) Example traces (top) showing overlayed IPSC responses to pairs of stimuli at 10, 20, 100, and 500 ms interstimulus intervals. Paired-pulse ratios (amplitude 2/amplitude 1) are plotted against the interstimulus interval (10, 20, 50, 100, 500, and 2500 ms intervals). Significance as analyzed by two-way ANOVA: genotype, ***p<0.001; interstimulus interval, ***p<0.001; interaction, n.s. Holm-Sidak post-hoc test: 10 ms, *p<0.05; 20 ms, *p<0.05 (control n = 15 cells/3 independent cultures, cDKO n = 15/3). (B) Example traces (top) showing overlayed EPSC responses to pairs of stimuli at 50, 100, 500, and 2500 ms interstimulus intervals. Paired-pulse ratios (amplitude 2/amplitude 1) are plotted against the interstimulus interval (50, 100, 500, and 2500 ms intervals). Significance as analyzed by two-way ANOVA: genotype, n.s.; interstimulus interval, ***p<0.001; interaction, n.s. (control n = 15/3, cDKO n = 15/3). (C) Sample traces showing IPSCs in response to superfusion with 500 mOsm sucrose (left) and quantification (right) of IPSC charge transfer during the first ten seconds of the response (control n = 15/3, cDKO n = 15/3). (D) Sample traces showing EPSCs in response to superfusion with 500 mOsm sucrose (left) and quantification (right) of EPSC charge transfer during the first ten seconds of the response (control n = 15/3, cDKO n = 15/3). Data are means ± SEM; **p≤0.01 as determined by Student's t test.
Figure 5—figure supplement 1
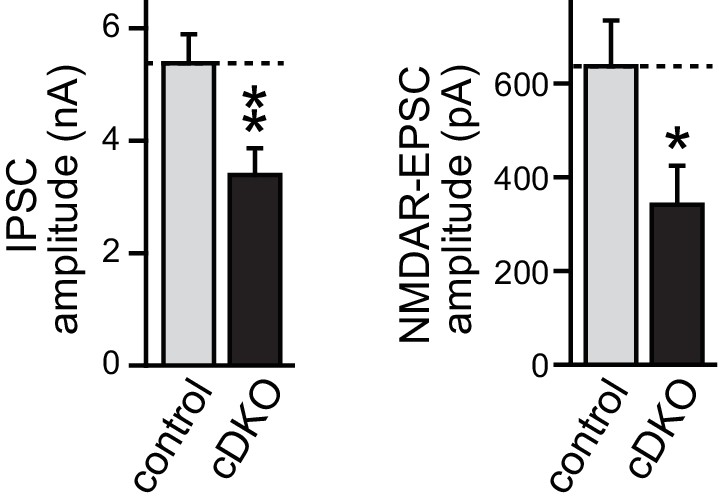
Direct comparison of IPSC and EPSC amplitudes of ELKS1α/2α cDKO.
Quantification of IPSC (left) and NMDAR-EPSC (right) amplitudes in control and cDKO neurons from the same cultures (control n = 15 cells /3 independent cultures, cDKO n = 15/3). All data are means ± SEM; *p≤ 0.05, **p≤0.01 as determined by Student's t test.
Figure 5—figure supplement 2
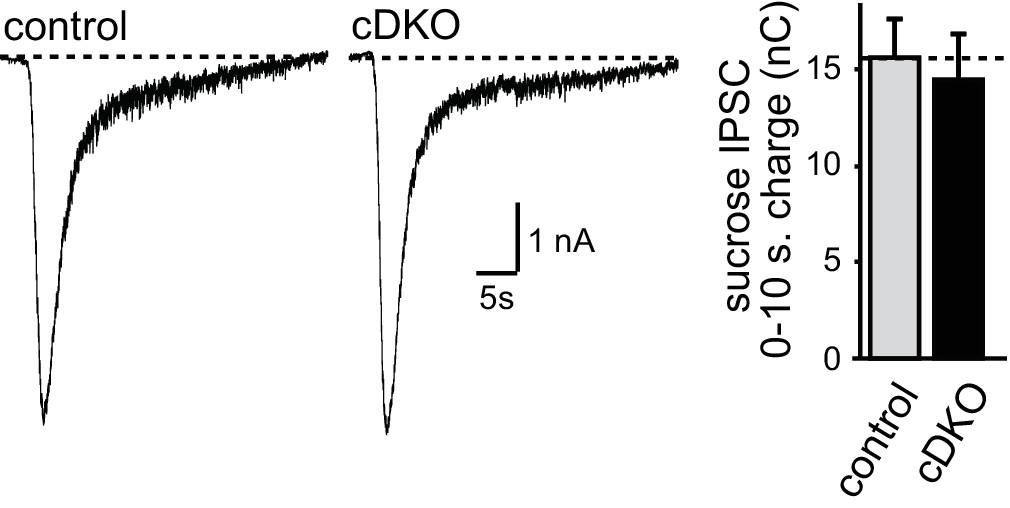
Inhibitory RRP size in ELKS1α/2α cDKO neurons.
(A) Sample traces showing IPSCs in response to superfusion with 500 mOsm sucrose (left) and quantification (right) of IPSC charge transfer during the first ten seconds of the response (control n = 9 cells/3 independent cultures, cDKO n = 9/3). All data are means ± SEM.
Figure 6
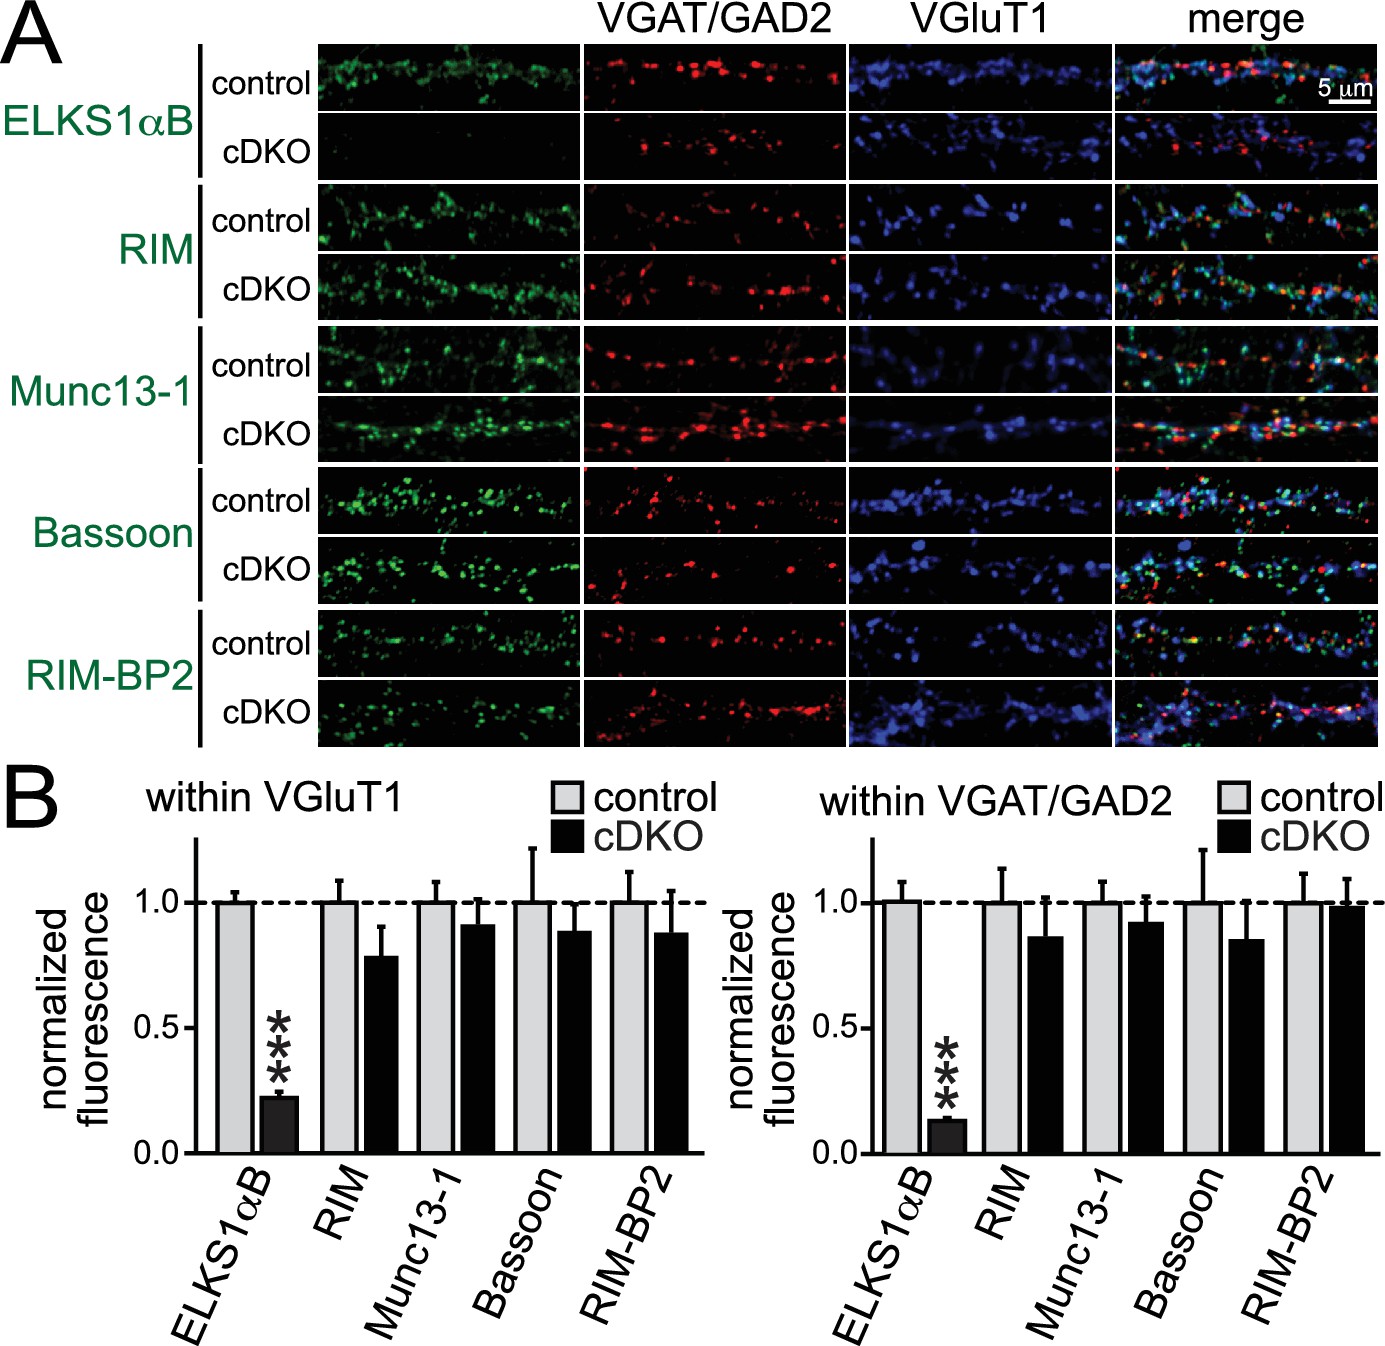
Active zone composition in ELKS1α/2α cDKO synapses.
(A) Sample images of control and ELKS1α/2α cDKO neurons stained with antibodies against active zone proteins. Inhibitory synapses were marked with VGAT (for ELKS, RIM and Bassoon) or GAD2 (for Munc13-1 and RIM-BP2), excitatory synapses were marked with VGluT1. (B) Quantification of active zone proteins within ROIs defined by excitatory (left) or inhibitory (right) synaptic markers (RIM: control n = 4 independent cultures, cDKO n = 4; Munc13-1: control n = 4, cDKO n = 4; Bassoon: control n = 3, cDKO n = 3; RIM-BP2: control n = 3, cDKO n = 3; in each culture, 10 images were averaged per culture and genotype). Data are means ± SEM; ***p≤0.001 as determined by Student's t test.
Figure 7 with 1 supplement

C-terminal ELKS sequences do not support RRP in ELKS1α/2α cDKO neurons.
(A) Schematic of ELKS1 rescue constructs; CCA-D: coiled-coil regions A-D, B: PDZ-binding motif; H: human influenza hemagglutinin (HA) tag, deleted sequences are illustrated as dashed lines. (B) Sample traces (left) and quantification (right) of the AMPAR-EPSC charge in response to hypertonic sucrose application, measured as area under the curve during the first ten seconds after the start of the stimulus (control n = 26 cells/5 independent cultures, cDKO n = 27/5, cDKO + ELKS1αB n = 21/5, cDKO + ELKS1-△CCDB n = 23/5, cDKO + ELKS1-△CCD n = 21/5). All data are means ± SEM; *p≤0.05 as determined by one-way ANOVA followed by Holm-Sidak multiple comparisons post-hoc test comparing each condition to cDKO.
Figure 7—figure supplement 1
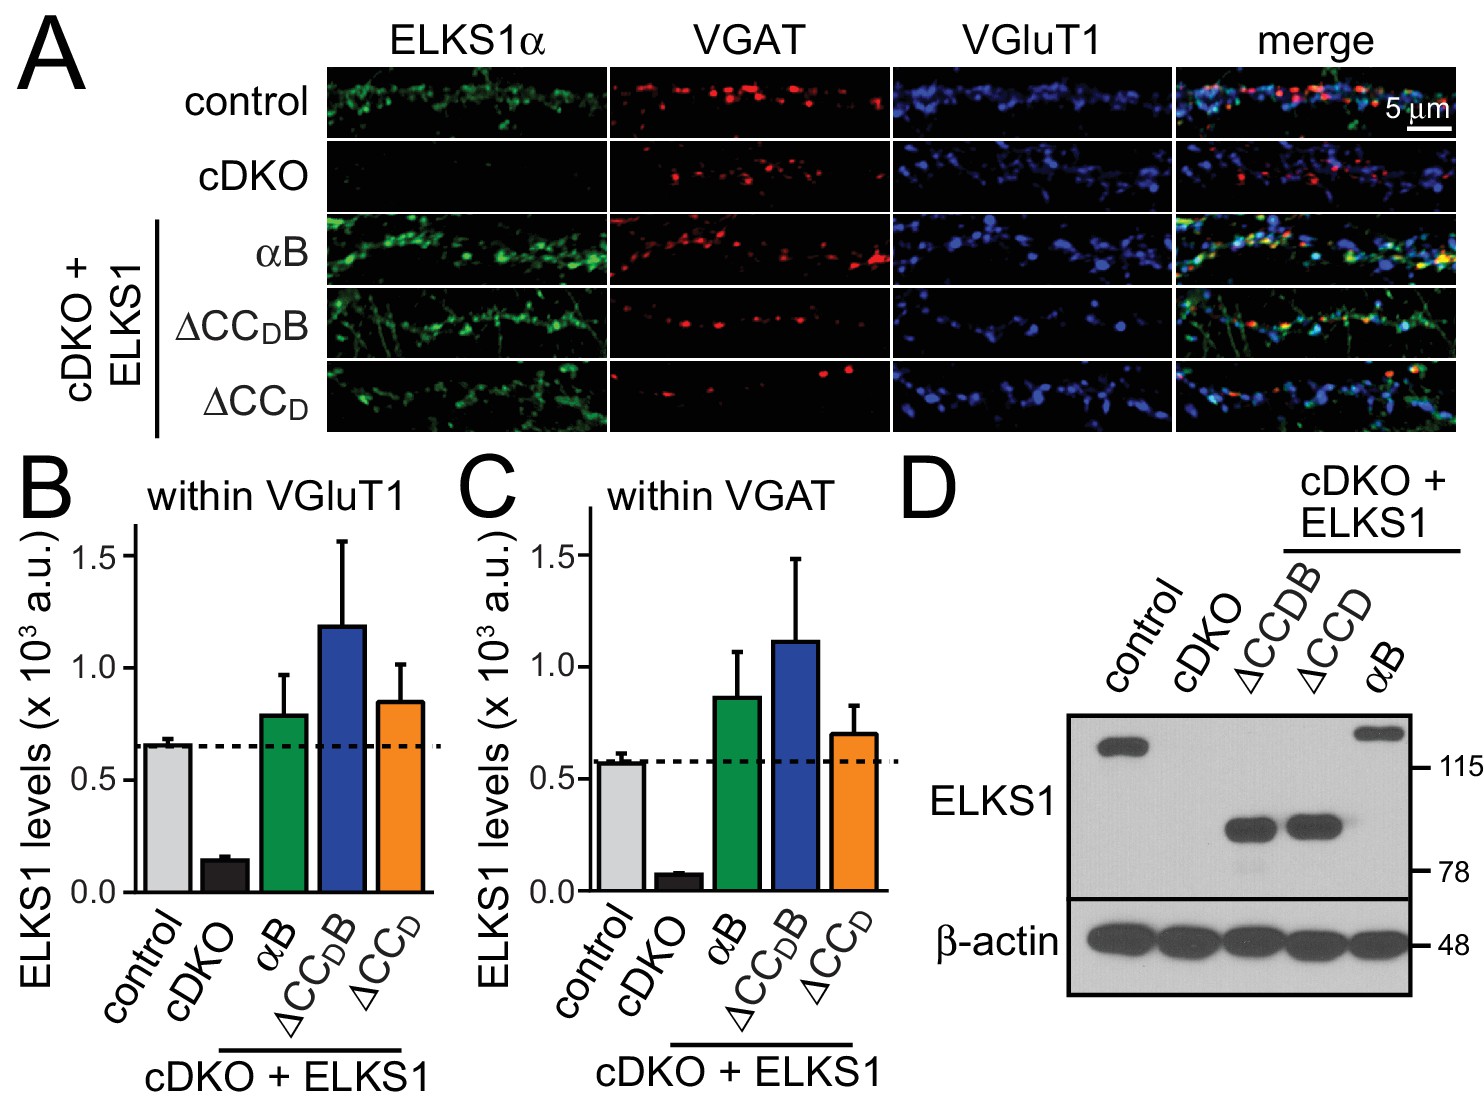
Expression and localization of ELKS1 C-terminal rescue constructs.
(A) Sample images of control, cDKO, and cDKO + rescue neurons stained with antibodies against ELKS1α (E-1), the inhibitory synapse marker VGAT, and the excitatory synapse marker VGluT1. (B,C) Quantification of ELKS1 fluorescent intensity within ROIs defined by VGluT1 (B) or VGAT (C) signals (control n = 3 independent cultures, cDKO n = 3, cDKO + ELKS1αB n = 3, cDKO + ELKS1-△CCDB n = 3, cDKO + ELKS1-△CCD n = 3, 5–10 images per culture were averaged per condition). Data are shown as means ± SEM. (D) Representative western blot of control, cDKO, and cDKO + rescue neurons used for recording in Figure 7. Samples were blotted using an ELKS1α specific antibody (E-1) and β-actin was used as a loading control.
Figure 8 with 2 supplements
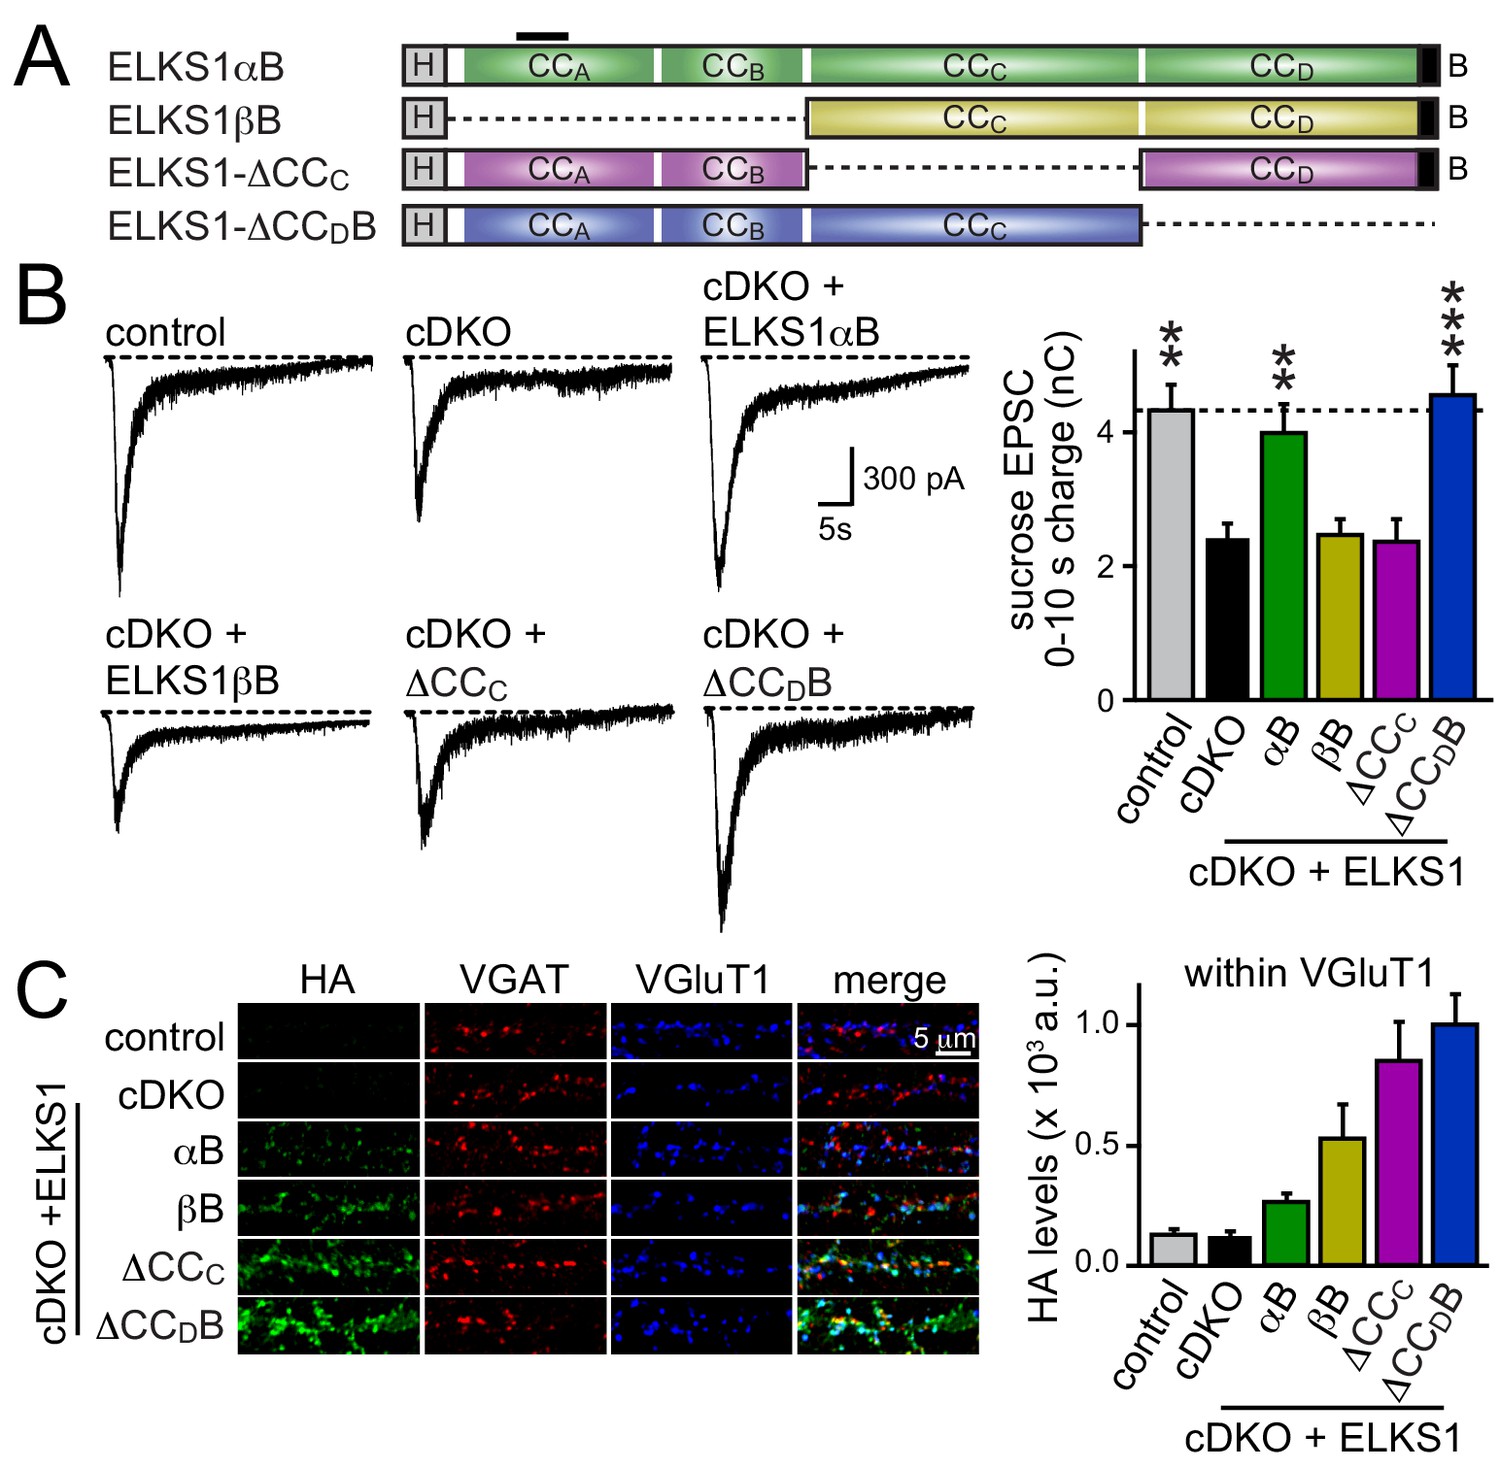
N-terminal coiled-coil domains of ELKS control RRP size at excitatory synapses.
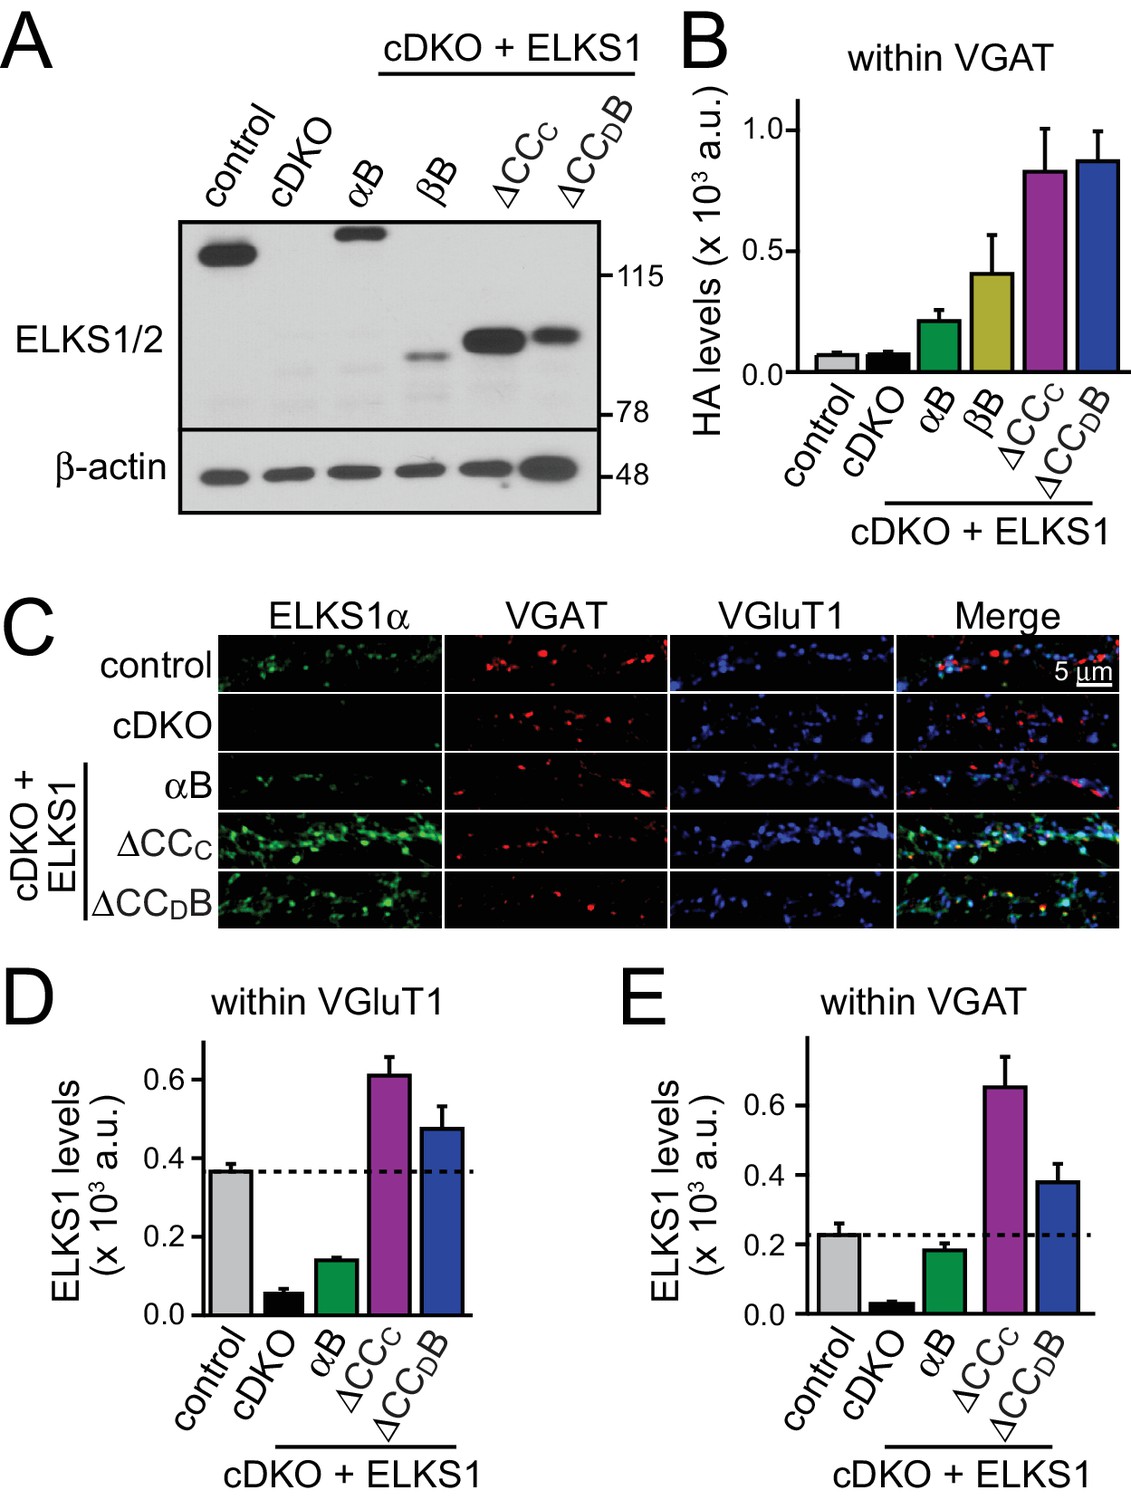
(A) Schematic of ELKS1 rescue constructs; CCA-D: coiled-coil regions A-D, B: PDZ-binding motif; H: human influenza hemagglutinin (HA) tag, black bar: antigen recognized by the ELKS1α antibody (E-1) used in figure supplement 1C. Deleted sequences are illustrated as dashed lines, (B) sample traces (left) and quantification (right) of the AMPAR-EPSC charge in response to hypertonic sucrose application, measured as area under the curve during the first ten seconds after the start of the stimulus (control n = 21 cells/4 independent cultures, cDKO n = 22/4, cDKO + ELKS1αB n = 19/4, cDKO + ELKS1βB n = 18/4, cDKO + ELKS1-△CCC n = 20/4, cDKO + ELKS1-△CCDB n = 21/4). (C) Sample images (left) of control, cDKO, and cDKO + rescue neurons stained with antibodies against HA. Quantification (right) of HA fluorescent intensity within ROIs defined by VGluT1 (control n = 3 independent cultures, cDKO n = 3, cDKO + ELKS1αB n = 3, cDKO + ELKS1βB n = 3, cDKO + ELKS1-△CCC n = 3, cDKO + ELKS1-△CCDB n = 3, 5–10 images were averaged per culture and genotype). All data are means ± SEM; **p≤0.01, ***p≤0.001 as determined by one-way ANOVA followed by Holm-Sidak multiple comparisons post-hoc test comparing each condition to cDKO.
Figure 8—figure supplement 1
Expression and localization of ELKS1 full length rescue constructs.
(A) Representative western blot of control, cDKO, and cDKO + rescue neurons used for recording in Figure 8. Samples were blotted using a pan-ELKS antibody (P224) and β-actin was used as a loading control. (B) Quantification of HA staining fluorescent intensity within ROIs defined by VGAT signals (control n = 3 independent cultures, cDKO n = 3, cDKO + ELKS1αB n = 3, cDKO + ELKS1βB n = 3, cDKO + ELKS1-△CCc n = 3, cDKO + ELKS1-△CCDB n = 3, 5–10 images per culture were averaged per condition). Data are shown as means ± SEM. (C) Representative images of staining with ELKS1α antibodies (E-1) in control, cDKO, and cDKO + rescue neurons. Note that ELKS1βB lacks the antigen for the ELKS1α antibody (E-1). (D and E) Quantification of ELKS1 fluorescent intensity within ROIs defined by VGluT1 (D) or VGAT (E) (control n = 3 independent cultures, cDKO n = 3, cDKO + ELKS1αB n = 3, cDKO + ELKS1-△CCC n = 3, cDKO + ELKS1-△CCDB n = 3, 5–10 images were averaged per culture and genotype). All data are means ± SEM.
Figure 8—figure supplement 2
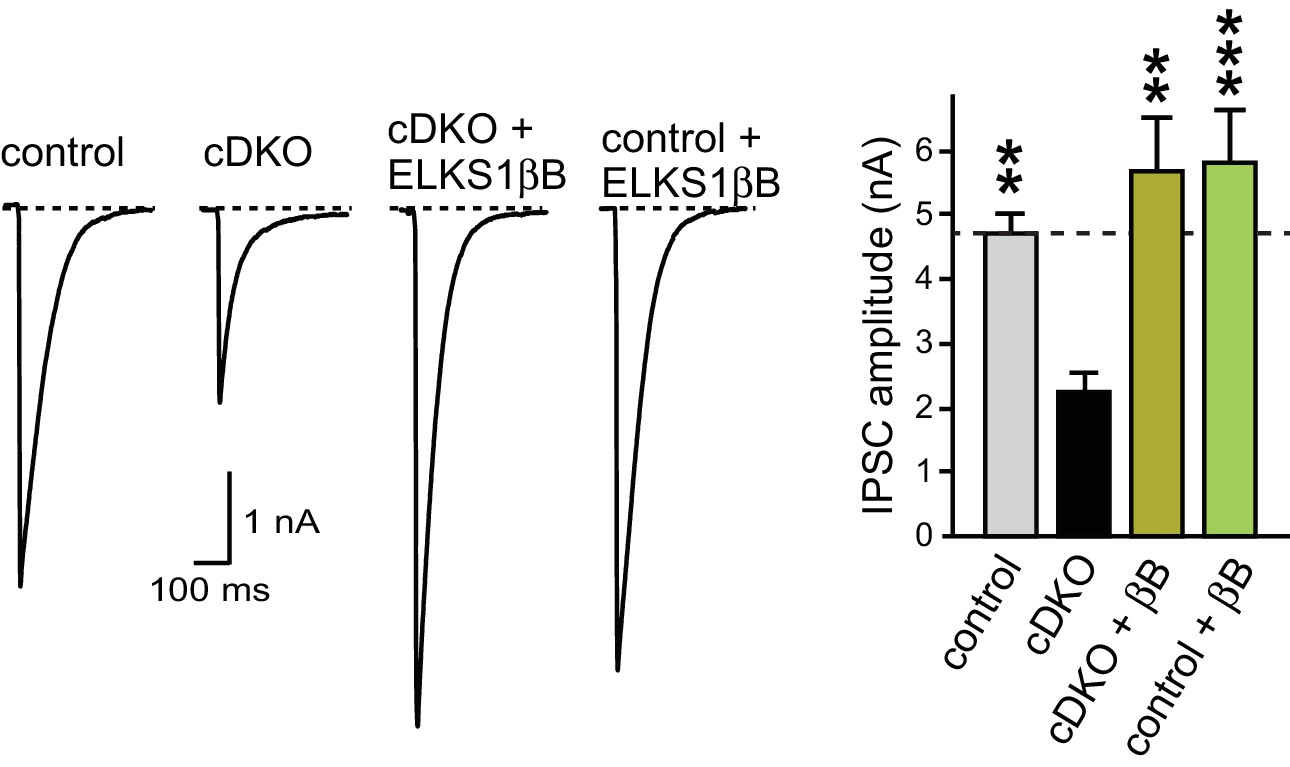
Rescue of action potential evoked IPSCs with ELKS1βB.
Sample traces (left) and quantification (right) of the IPSC amplitude in control, cDKO, cDKO + ELKS1βB, and control + ELKS1βB (control n = 11 cells/3 independent cultures, cDKO n = 11/3, cDKO + ELKS1βB n = 10/3, control + ELKS1βB n = 12/3). All data are means ± SEM; **p≤0.01, ***p≤0.001 as determined by one-way ANOVA followed by Holm-Sidak multiple comparisons post-hoc test comparing each condition to cDKO. Holm-Sidak multiple comparisons post-hoc tests comparing each condition to control did not reveal significant differences except for control vs. cDKO, *p≤0.05.
Download links
A two-part list of links to download the article, or parts of the article, in various formats.
Downloads (link to download the article as PDF)
Open citations (links to open the citations from this article in various online reference manager services)
Cite this article (links to download the citations from this article in formats compatible with various reference manager tools)
ELKS controls the pool of readily releasable vesicles at excitatory synapses through its N-terminal coiled-coil domains
eLife 5:e14862.
https://doi.org/10.7554/eLife.14862


