Cell-specific synaptic plasticity induced by network oscillations
- Charité -Universitätsmedizin Berlin, Germany
- The NeuroCure Cluster of Excellence, Germany
- Bernstein Center for Computational Neuroscience, Germany
Figures
Figure 1
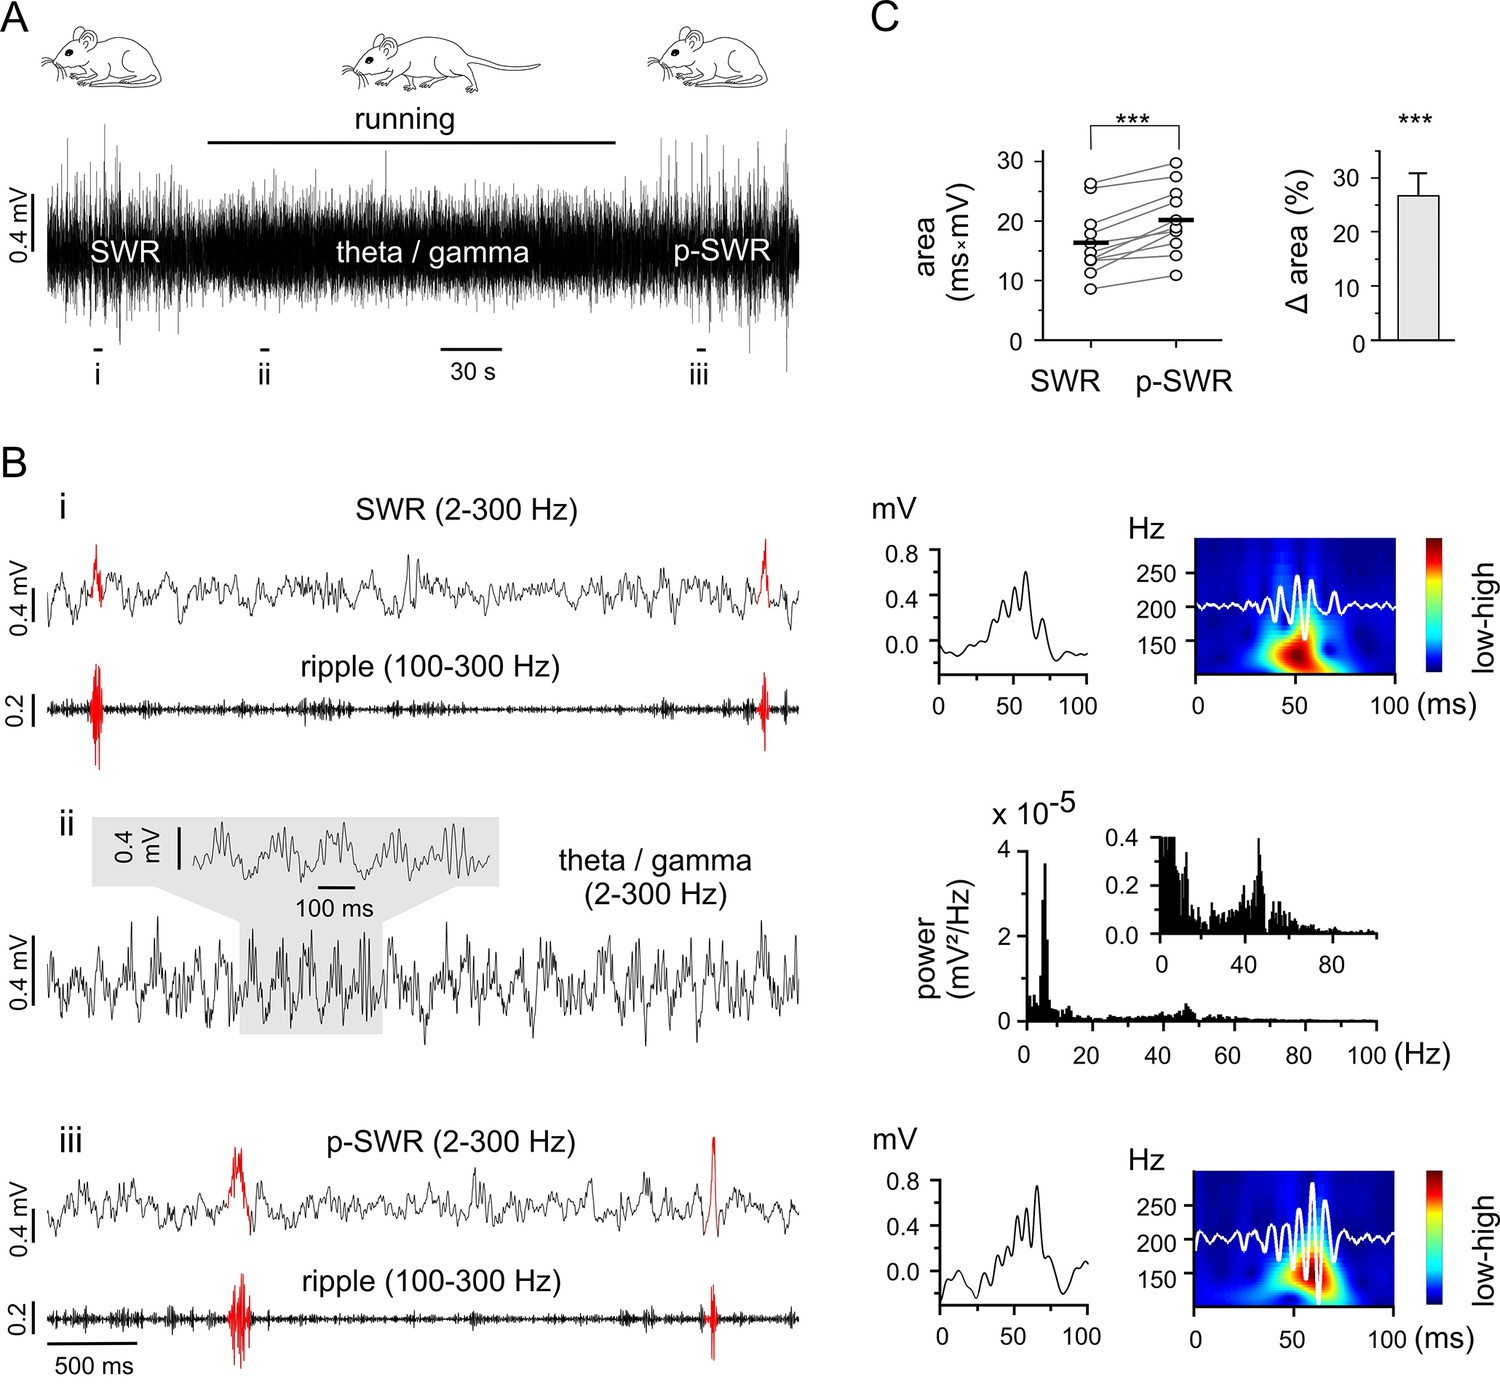
Theta-nested gamma rhythms enhance hippocampal SWRs in vivo.
(A) Representative LFP recording in an awake mouse illustrates the occurrence of different network states in a behavioral-dependent manner. The initial spontaneous SWRs during a quiet state (left, SWR) are replaced by a running-associated theta-nested gamma rhythm (middle), followed by another rapid reversal to SWRs (right, p-SWR). Note the higher amplitude of the p-SWRs. Prolonged running period is marked by the black bar above. (B) (i, ii, iii) Left, three example excerpts from the trace in (A) at higher temporal resolution. (i) Left, the initial quiet state example band-pass filtered at 2–300 Hz and 100–300 Hz to illustrate the SWRs and the corresponding ripple component, respectively. Two SWRs are accentuated in red. Right, a single SWR together with its wavelet transform (color-coded power spectral density with superimposed corresponding ripple trace in white). (ii) Left, the theta-nested gamma example with a small excerpt shown above. Right, the corresponding spectral analysis demonstrates the predominant theta (7.3 Hz) and gamma (46.3 Hz) peak. (iii), the p-SWR with the same type of illustration as for the SWR shown in (i). (C) Left, a direct comparison of the mean values of SWR areas before and after the intervening gamma episode (n = 11, 4 mice) highlight a significant increase in SWR areas (p=0.0006, Wilcoxon signed rank test). The respective grand means are indicated by the horizontal bold bars. Right, the corresponding percentage increase of mean SWR areas.
Figure 2
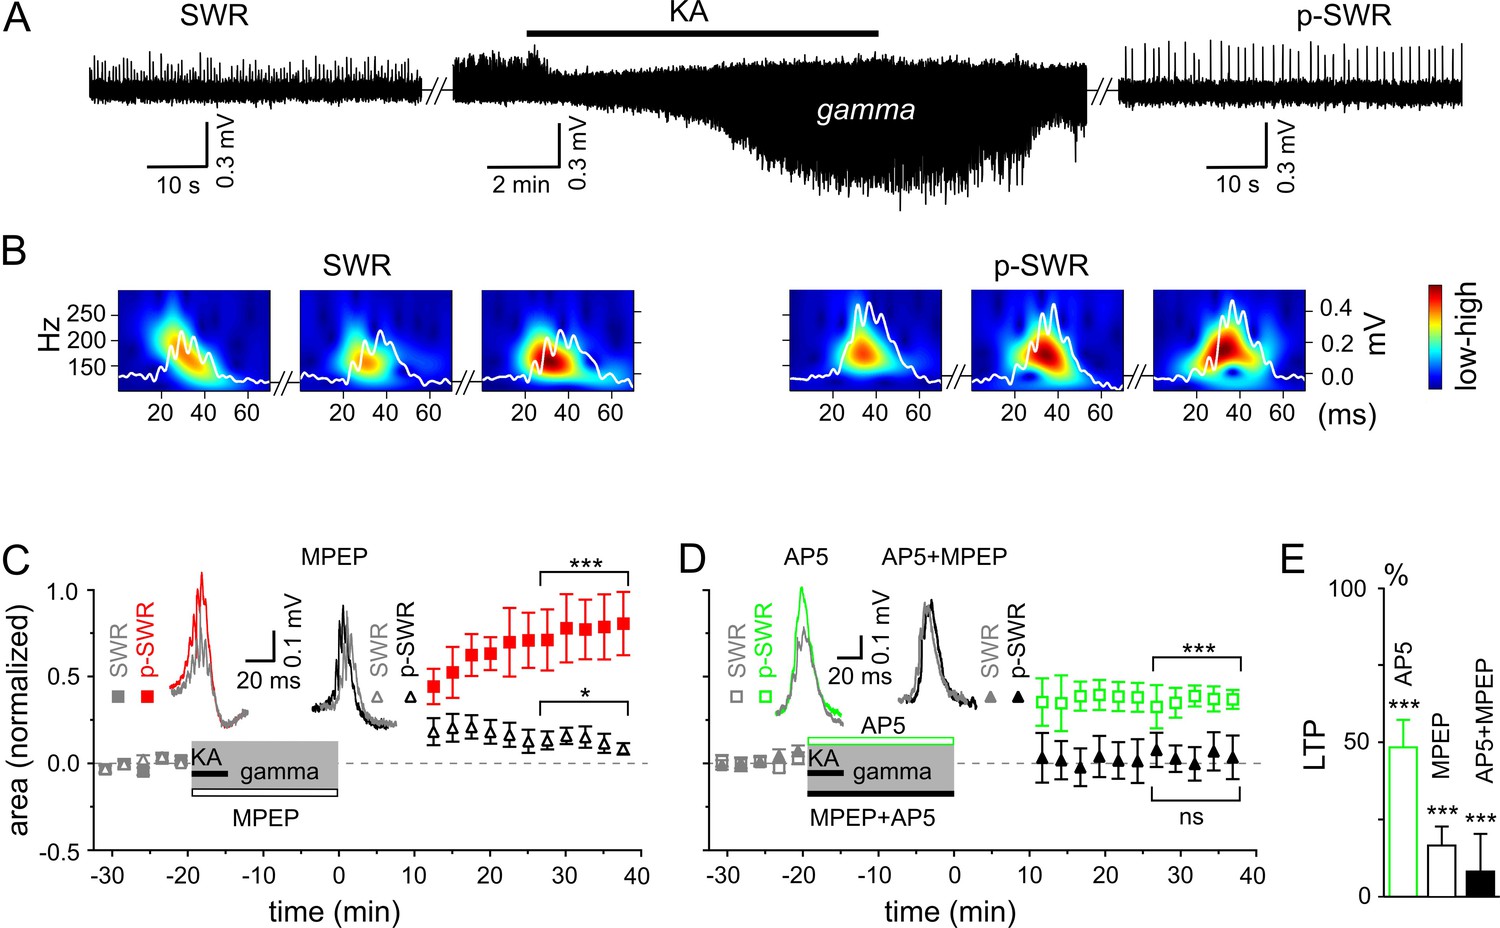
Gamma rhythms promote long-lasting alterations in the network activity.
(A) SWRs recorded in the stratum pyramidale of the CA3 region occurred spontaneously (left), disappeared shortly after bath application of KA (middle) and reappeared with a significantly higher amplitude after KA washout (right). (B) Example of the wavelet transform (color-coded power spectral density) for three consecutive highlighted SWRs (white trace) before (SWR) and after (p-SWR) intermediate gamma oscillations. (C) p-SWR areas (red-filled squares) increased significantly compared to the SWR areas (gray-filled squares). MPEP (50 µM) administration largely prevented p-SWR area increase (black, open triangles). The time courses of drug applications are depicted schematically. The horizontal lines mark the p-SWR data points used for statistical analyses. The significance stars compare the pre-gamma data with the marked post-gamma data. The number of asterisks indicates the significance level (Student's t-test). Insert, examples of SWR (gray) and p-SWR (red and black) without (left) and with MPEP (right) administration during gamma rhythms. (D) Effects of AP5 (50 µM, green open squares) and MPEP+AP5 (black filled triangles) on SWR area increase. Insert, examples of corresponding SWR (gray) and p-SWR (green and black). (E) Gamma oscillation-induced SWR area increase (LTP) is reduced significantly by administration of AP5 (green open bar), MPEP (black open bar) and MPEP+AP5 (black filled bar).
Figure 3
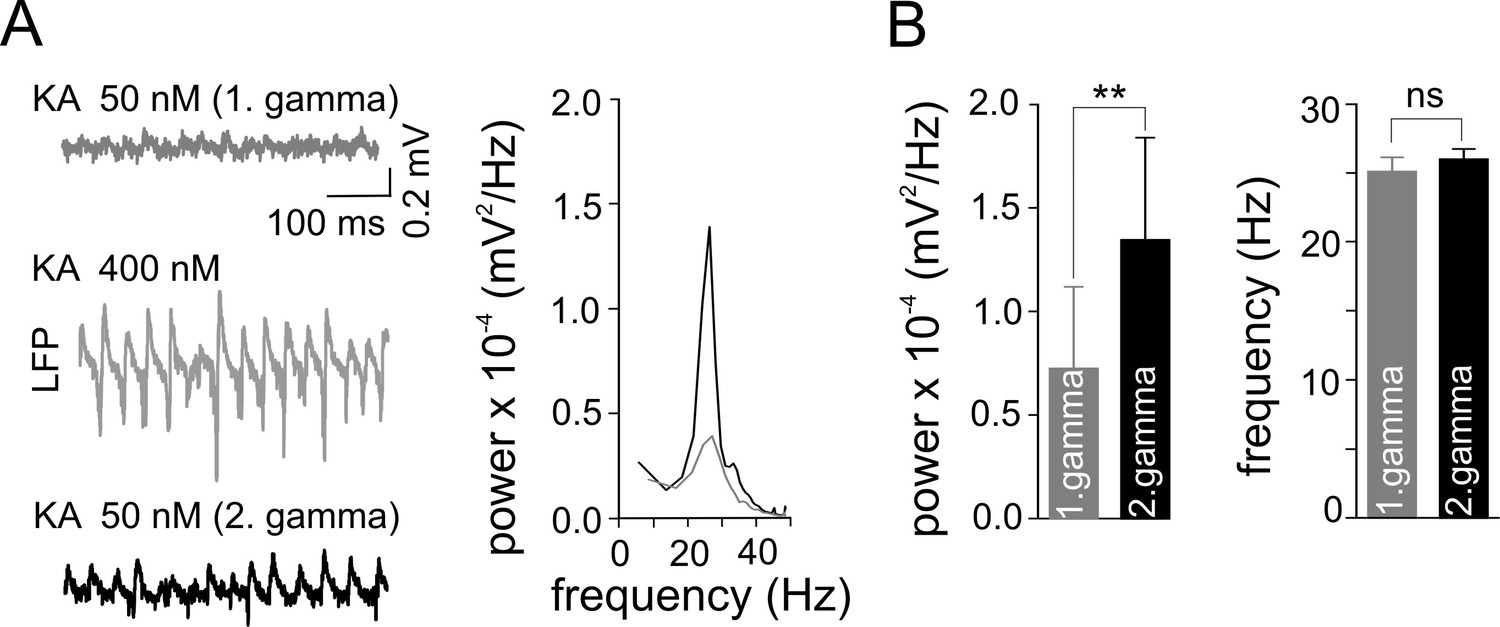
Gamma frequency oscillations promote changes in network activity.
(A) Brief ‘weak’ field gamma episodes were induced by bath application of 50 nM KA. After this test period, ‘conventional’ gamma frequency oscillations were induced by 400 nM KA application, followed by KA washout achieving a complete cessation of oscillatory gamma activity. In a third step, the network behavior was again tested with low KA concentration as applied in the first step. Left, a ‘weak’ gamma episode (top, gray: 1st ‘weak’ gamma) becomes significantly stronger (bottom, black: 2nd ‘weak’ gamma) after ‘conventional’ (‘KA 400 nM’) gamma oscillations. Right, corresponding spectral analysis of 1st and 2nd ‘weak’ gamma. (B) Summary bar charts of peak power and frequency obtained before (1st ‘weak’ gamma) and after ‘conventional’ gamma (2nd ‘weak’ gamma). Spectral power of gamma rhythms increased from 0.72 x 10⁻⁴ ± 0.39 x 10⁻⁴ mV2/Hz to 1.34 x 10⁻⁴ ± 0.50 x 10⁻⁴ mV2/Hz (n = 10, p=0.003) while frequency remained unchanged, illustrating that the intervening gamma episode has a reinforcing effect.
Figure 4
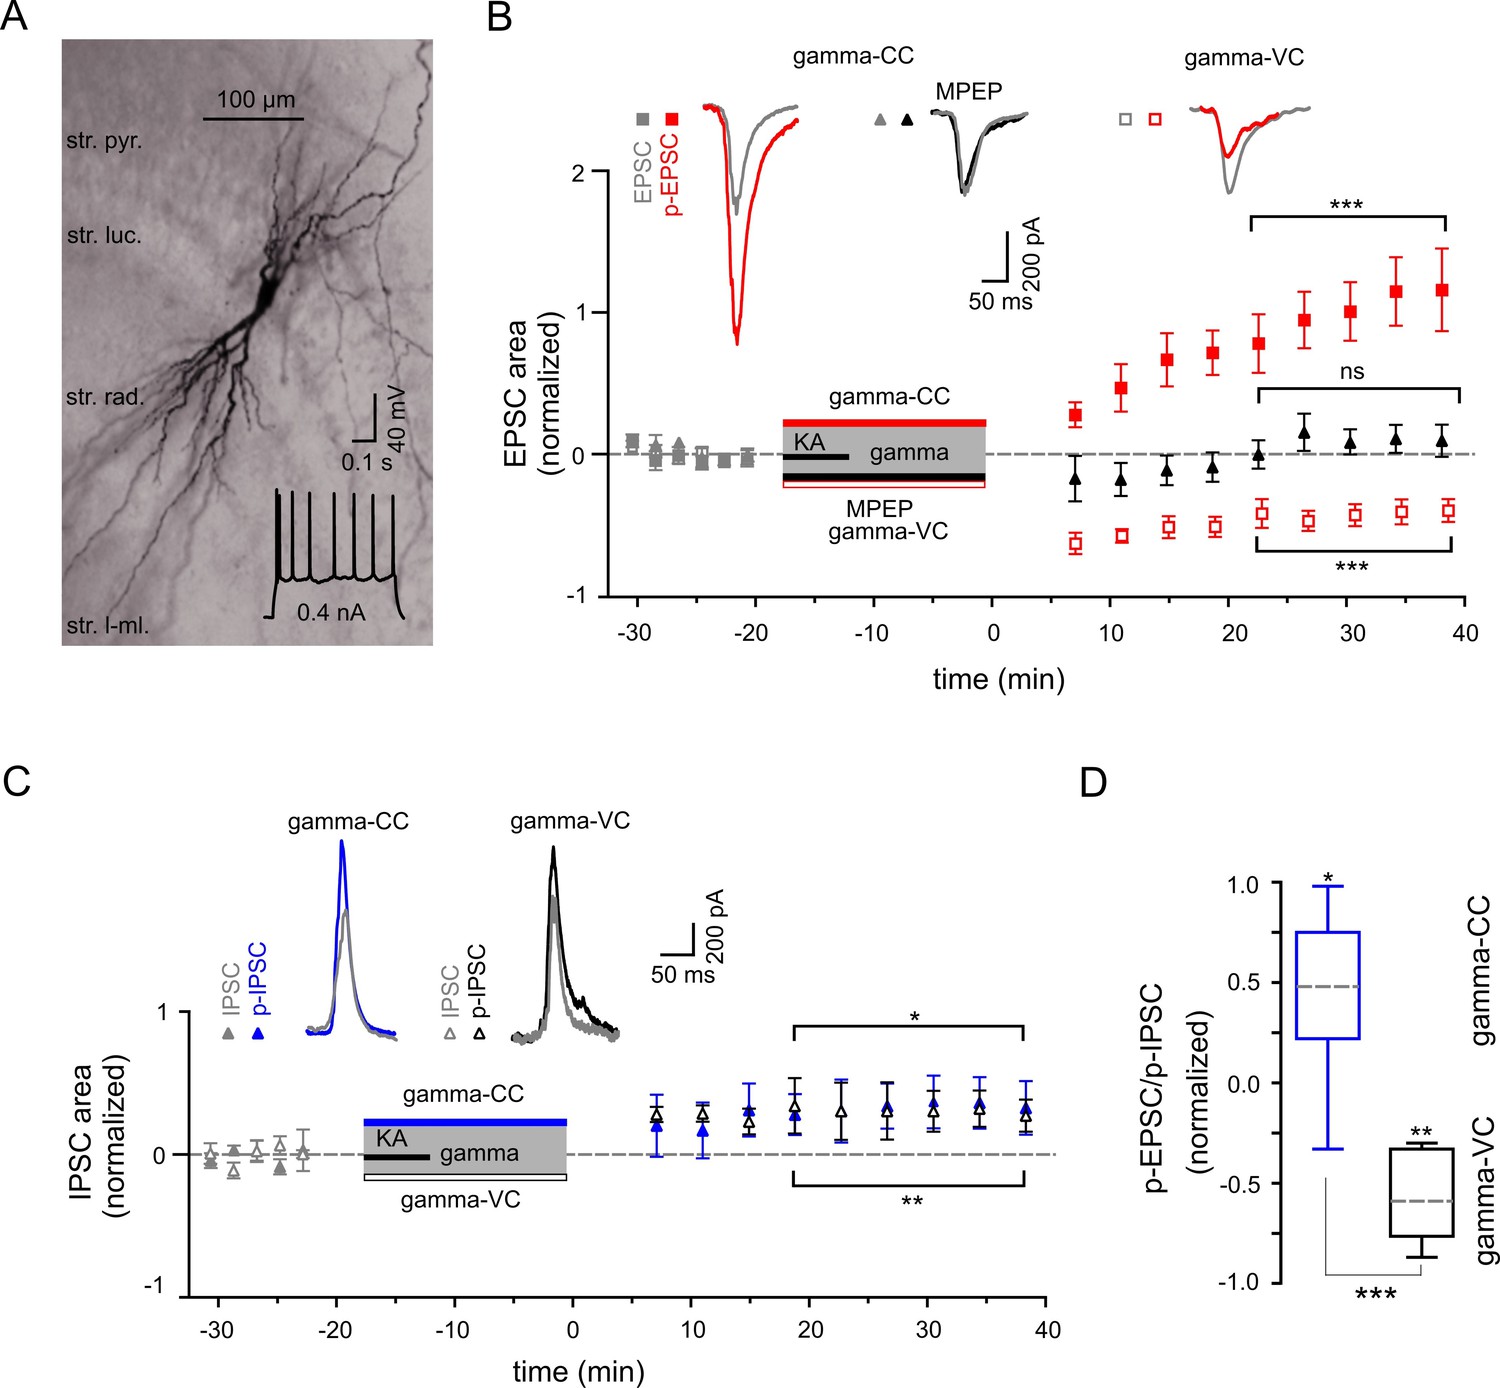
Gamma frequency oscillations support long-lasting synaptic plasticity.
(A) Light micrograph of an example CA3 PC. Insert: The regular firing pattern of this PC in response to a depolarizing current injection. (B) The area of SWR-associated EPSC increases significantly after gamma frequency oscillations (gray and red filled squares for EPSCs and p-EPSC, respectively). Administration of MPEP (50 µM) prevents the increase of p-EPSC (gray and black filled triangles illustrate EPSC and p-EPSC, respectively). Holding PCs in voltage clamp configuration at −70 mV during gamma frequency oscillations leads to a significant decrease in EPSC area (gray and red open squares for EPSC and p-EPSC, respectively). The significance stars compare the pre-gamma data with the marked post-gamma data. Insert: Representative examples of EPSC (gray) and p-EPSC recorded without (left, red) and with MPEP (middle, black), as well as using voltage clamping of cells during gamma rhythms (right, red, gamma-VC). (C) SWR-associated IPSCs exhibit a moderate increase in area in PCs held in both current- (filled gray and blue triangles) and voltage-clamp mode (open gray and black triangles for IPSC and p-IPSC, respectively) during gamma rhythms. Inserts: Representative examples of corresponding IPSC (gray) and p-IPSC (gamma-CC, blue and gamma-VC, black). (D) Contra-directional change in p-EPSC to p-IPSC ratio for PCs held in current- (gamma-CC) vs. voltage-clamp mode (gamma-VC) during gamma rhythms (normalized to pre-gamma values).
Figure 5
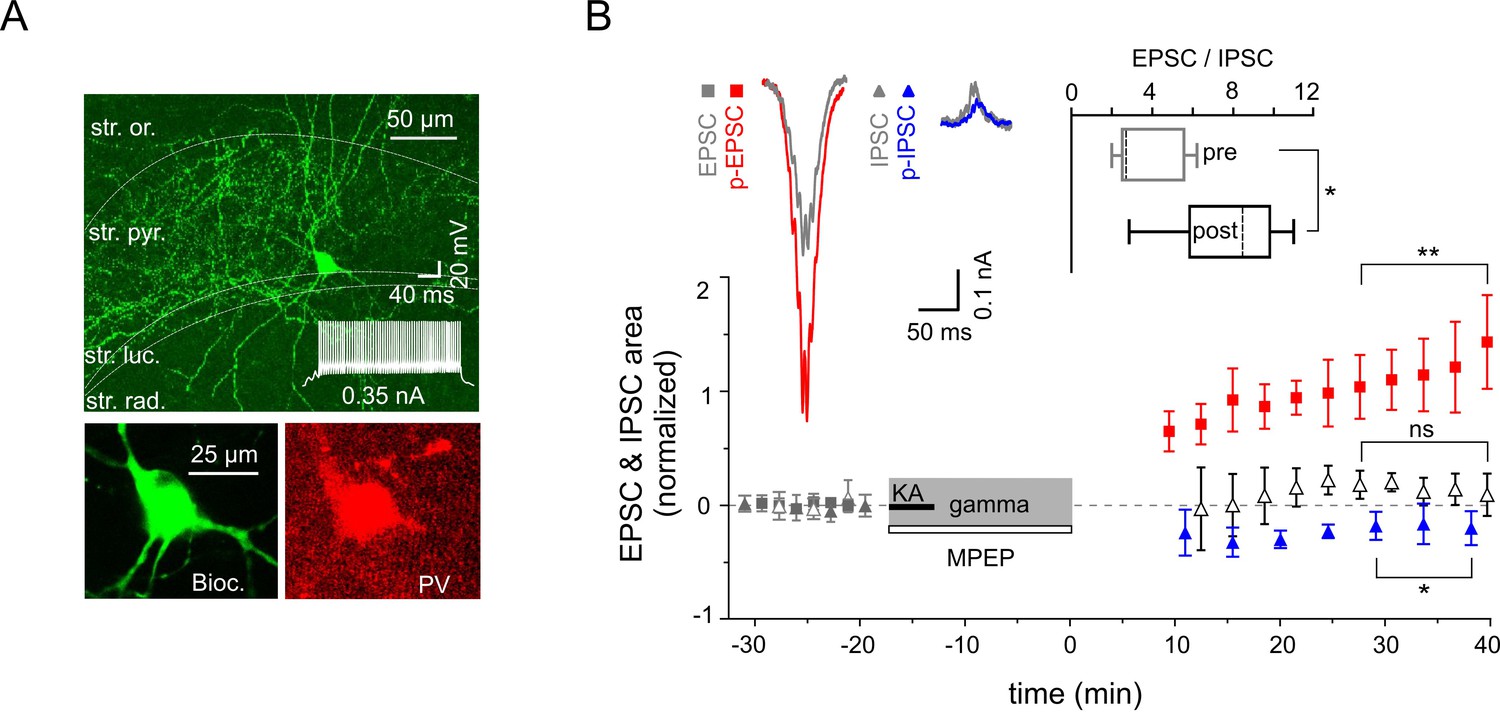
Increased excitability of fast spiking PV-expressing interneurons.
(A) Top: A confocal image of a typical PV-expressing IN filled with biocytin. Insert: Fast firing pattern in response to depolarizing current injection. Bottom: Immuno-reactivity of the biocytin filled cell for PV. (B) Normalized EPSC (gray squares), IPSC (gray triangles), p-EPSC (red squares) and p-IPSC (blue triangles) recorded from PV-positive INs held in current-clamp mode during gamma rhythms. Administration of MPEP (50 µM) prevents the increase of p-EPSC (gray and black open triangles illustrate EPSC and p-EPSC, respectively). The significance stars compare the pre-gamma data with the marked post-gamma data. Inserts: left, representative examples of EPSC and IPSC (gray) with corresponding p-EPSC (red) and p-IPSC (blue); right, the EPSC-to-IPSC ratio before (pre) and after (post) gamma rhythms demonstrates that the excitability significantly increases in PV-positive INs.
Figure 6
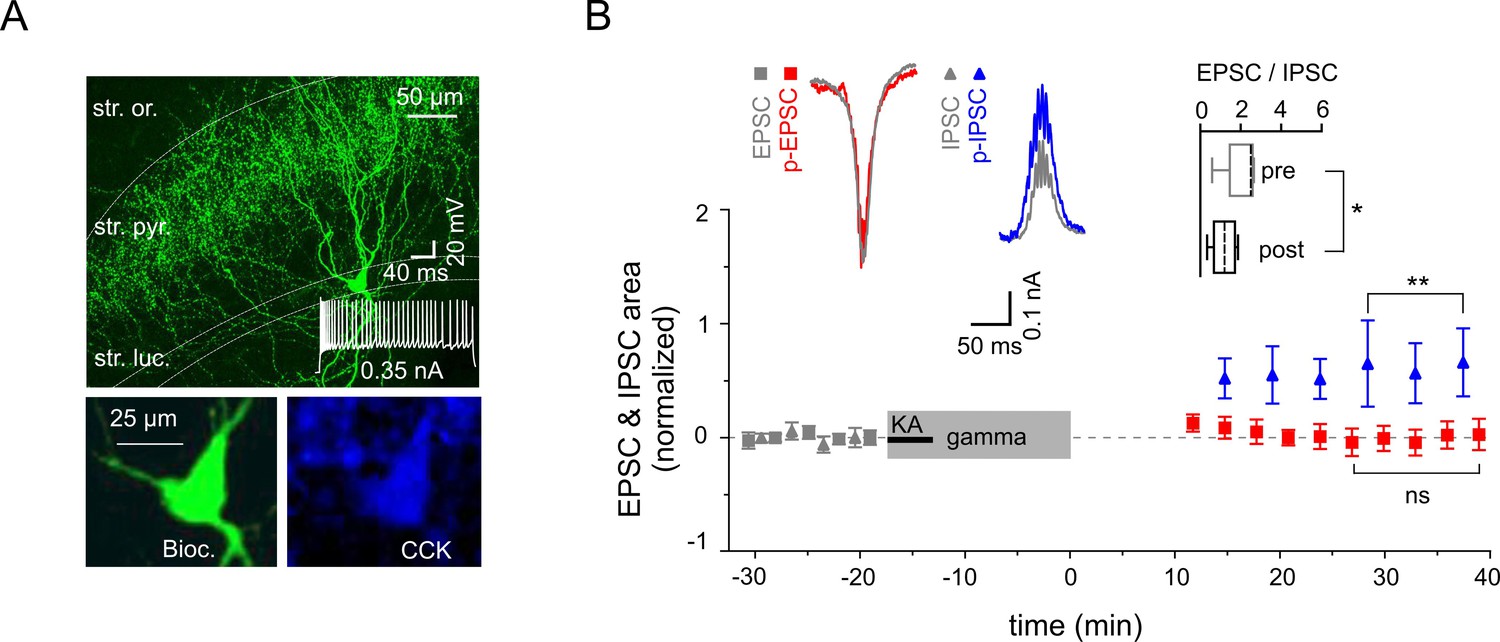
Reduced excitability of regular spiking CCK-expressing interneurons.
(A) Top: A confocal image of a typical CCK-expressing IN filled with biocytin. Insert: Regular firing patterns in response to depolarizing current injection. Bottom: Immuno-reactivity of the biocytin filled cell for CCK. (B) Normalized EPSC (gray squares), IPSC (gray triangles), p-EPSC (red squares) and p-IPSC (blue triangles) recorded from CCK-expressing INs held in current-clamp mode during gamma frequency oscillations. The significance stars compare the pre-gamma data with the marked post-gamma data. Inserts: Left, representative examples of EPSC and IPSC (gray) with corresponding p-EPSC (red) and p-IPSC (blue); right, the EPSC-to-IPSC ratio before (pre) and after (post) gamma rhythms demonstrates that the excitability significantly decreases in CCK-positive INs.
Download links
A two-part list of links to download the article, or parts of the article, in various formats.
Downloads (link to download the article as PDF)
Open citations (links to open the citations from this article in various online reference manager services)
Cite this article (links to download the citations from this article in formats compatible with various reference manager tools)
Cell-specific synaptic plasticity induced by network oscillations
eLife 5:e14912.
https://doi.org/10.7554/eLife.14912


