Wiz binds active promoters and CTCF-binding sites and is required for normal behaviour in the mouse
- La Trobe Institute for Molecular Science, Australia
- Leiden University Medical Centre, The Netherlands
- La Trobe University, Australia
Figures
Figure 1
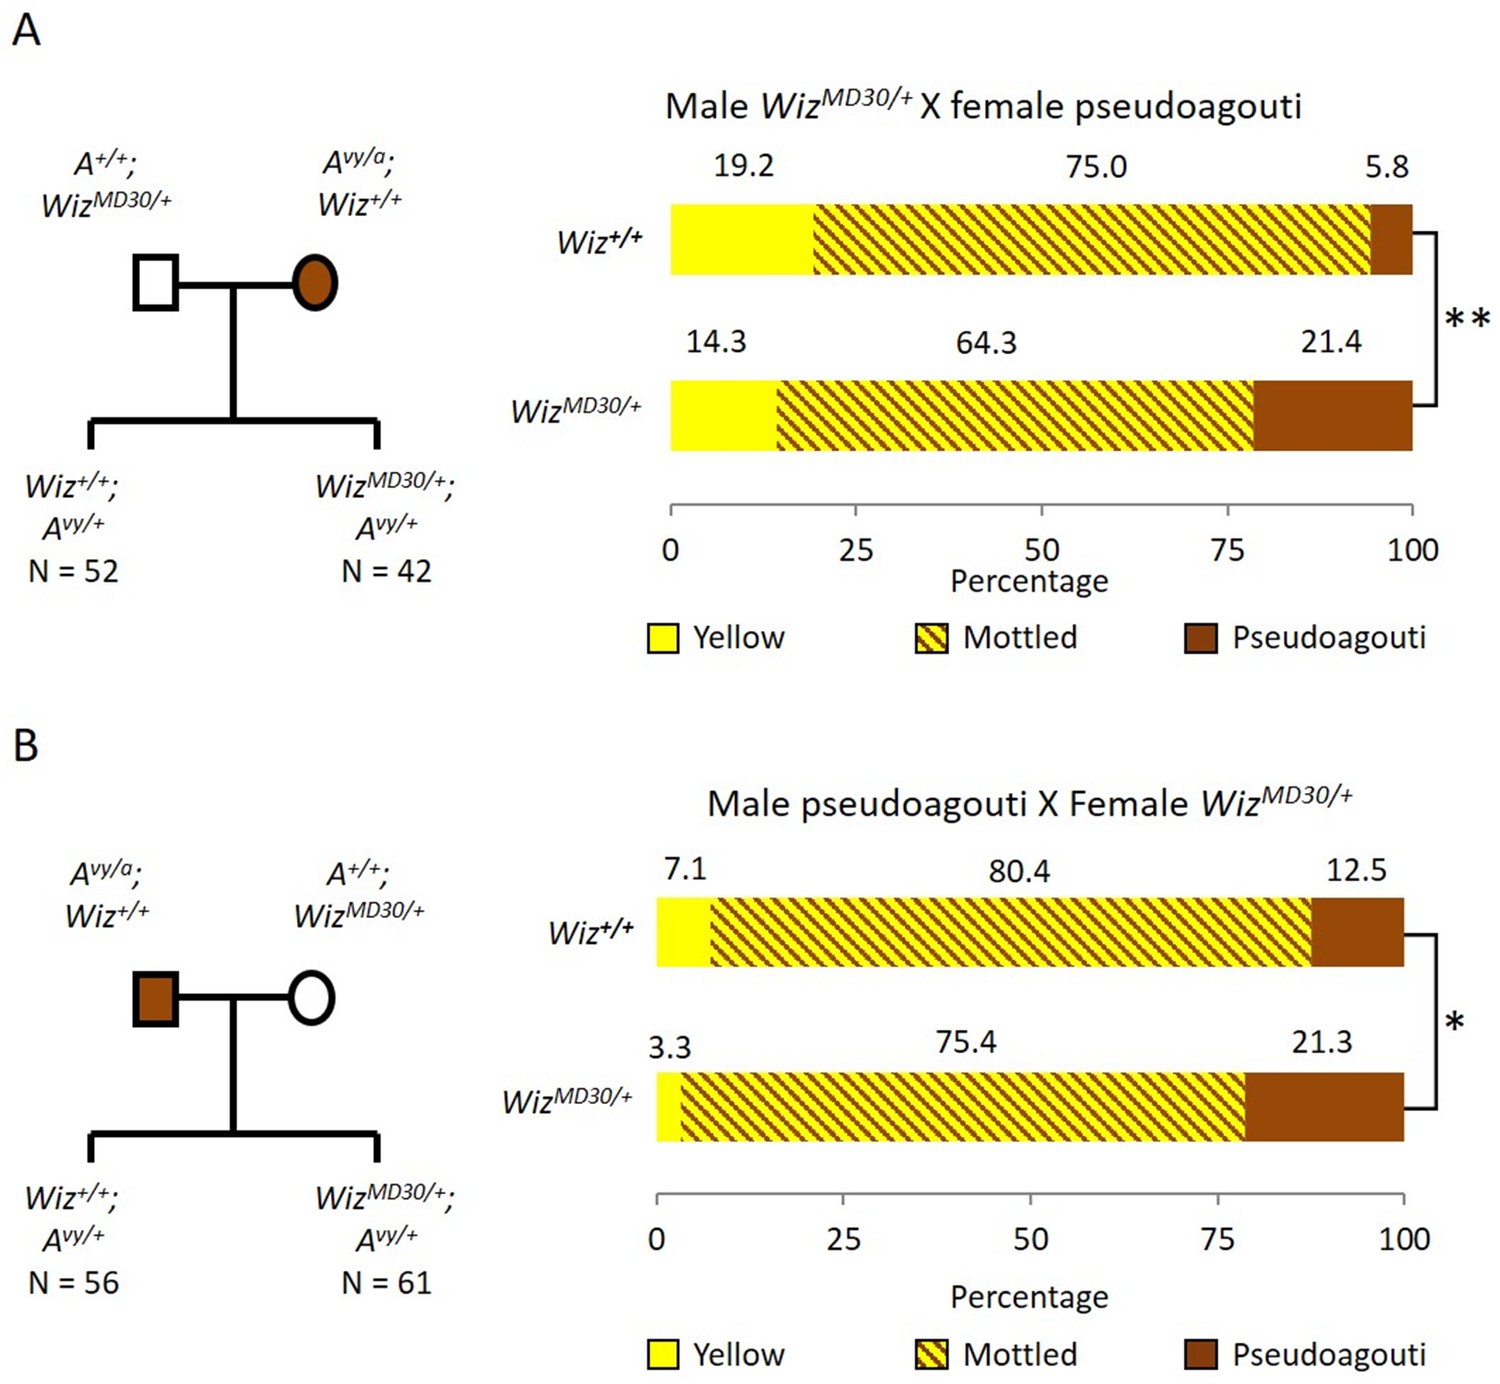
Wiz haploinsufficiency increases silencing at the Avy locus.
Pedigree charts (left) are shown for generating F1 mice heterozygous for the Avy allele and either wildtype or heterozygous for WizMommeD30. WizMommeD30/+ mice were crossed to pseudoagouti Avy/a mice, numbers of F1 mice in each cohort are indicated. The proportions of coat colours for F1 mice are shown (right) from a cross with either a WizMommeD30/+ sire (A) or dam (B). Chi-squared tests were carried out to determine significance, *p-value<0.05, **p-value<0.005.
Figure 2 with 1 supplement

Wiz binds across the genome and at promoter elements.
(A) ChIP-seq was performed for Wiz in the adult male cerebellum, a screenshot is shown of a random Wiz-enriched site (* indicated) with the two ChIP-seq replicates and input, from the ~40,000 significantly enriched peaks. Encode data for CTCF and H3K4me3 is also included. (B) Enrichment for Wiz in two cerebellum samples (Cb1 and Cb2) is shown by ChIP-qPCR, with primers located in regions not enriched for Wiz in ChIP-seq data and primers flanking the * indicated ChIP-seq peak from (A). Enrichment is represented as binding events detected per 1000 cells and are generated by running samples in parallel with known amounts of genomic DNA. Error bars indicate S.D. from 3 technical replicates. (C) The percentage is shown of Wiz peaks that overlap with the promoter (up to 2 kb from a TSS) and genic sequence of genes that were classified as active or silenced, according to RNA-seq data mapped to Ensembl genes annotations. (D) Wiz ChIP-seq (and Input) occupancy over all Ensembl gene bodies is shown as deep sequencing read density along the transcription unit, including 2 kb up and downstream of the transcriptional start and stop site. Genes were separated into either active or silenced transcriptional states, as in C.
-
Figure 2—source data 1
Anti-Wiz antibody co-immunoprecipitation.
(A) Nuclear lysates from either pooled E13.5 embryonic brain or 2 adult cerebellum replicates were subjected to antibody-based affinity purification and mass spectroscopy. The number of peptides are shown for each protein identified in both embryonic (values for 1 sample) and adult brain (values for each of the two samples) anti-Wiz antibody IP samples and absent in anti-IgG antibody controls run for each sample, with greater than 5 peptides in each IP. Proteins are ranked by the semi-quantitative number peptides in embryonic brain where Wiz expression is higher. The previously identified Wiz-Zfp644-EHMT1-EHMT2 complex is shaded.
- https://doi.org/10.7554/eLife.15082.004
Figure 2—figure supplement 1
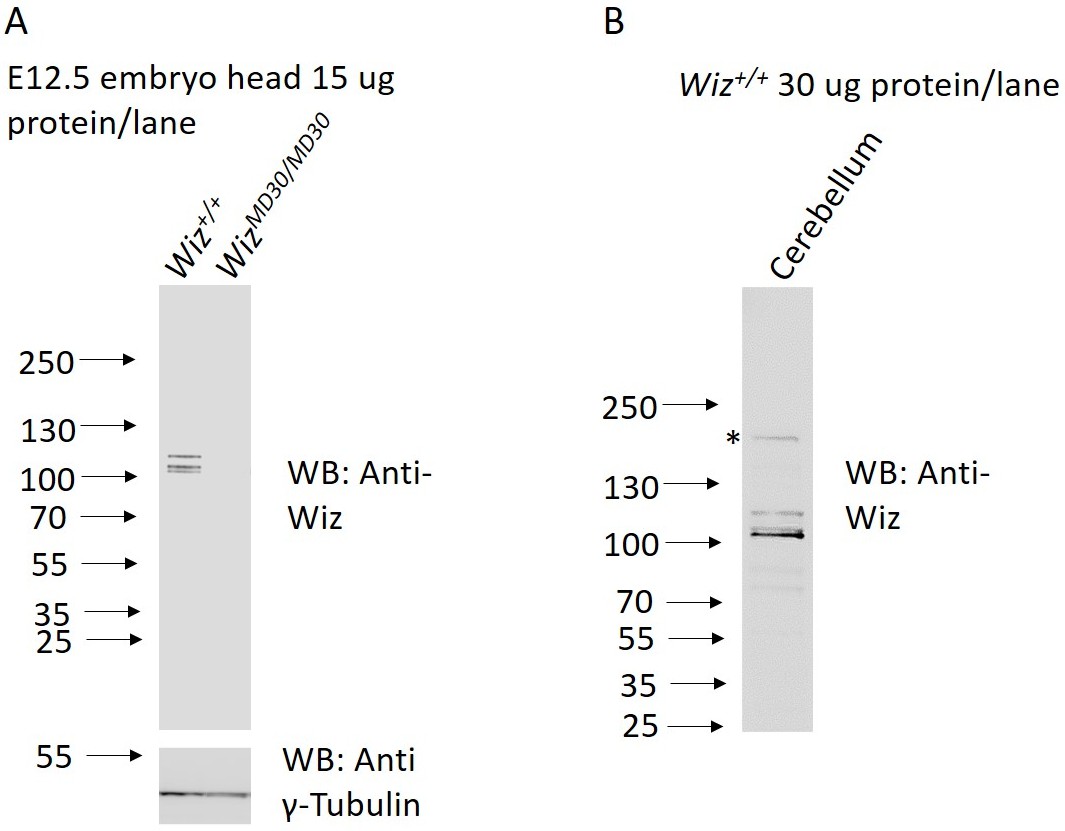
Anti-Wiz antibody western blotting.
(A) Western blotting for Wiz using an NBP180586 anti-Wiz antibody is shown for total protein lysates from E12.5 Wiz+/+ and WizMommeD30/MommeD30 embryo head. Three bands at ~100 kD represent Wiz isoforms, consistent with UCSC gene splice variants, in Wiz+/+ sample and are absent in WizMommeD30/ MommeD30 sample. Western blotting with an anti-γ-Tubulin antibody is shown as a loading control. (B) Anti-Wiz antibody staining in adult cerebellum, showing the short (~100–120 KDa) isoforms present in embryo head protein extract, as well as a long (~160 KDa) isoform previously reported to be expressed (Matsumoto et al., 1998).
Figure 3 with 1 supplement
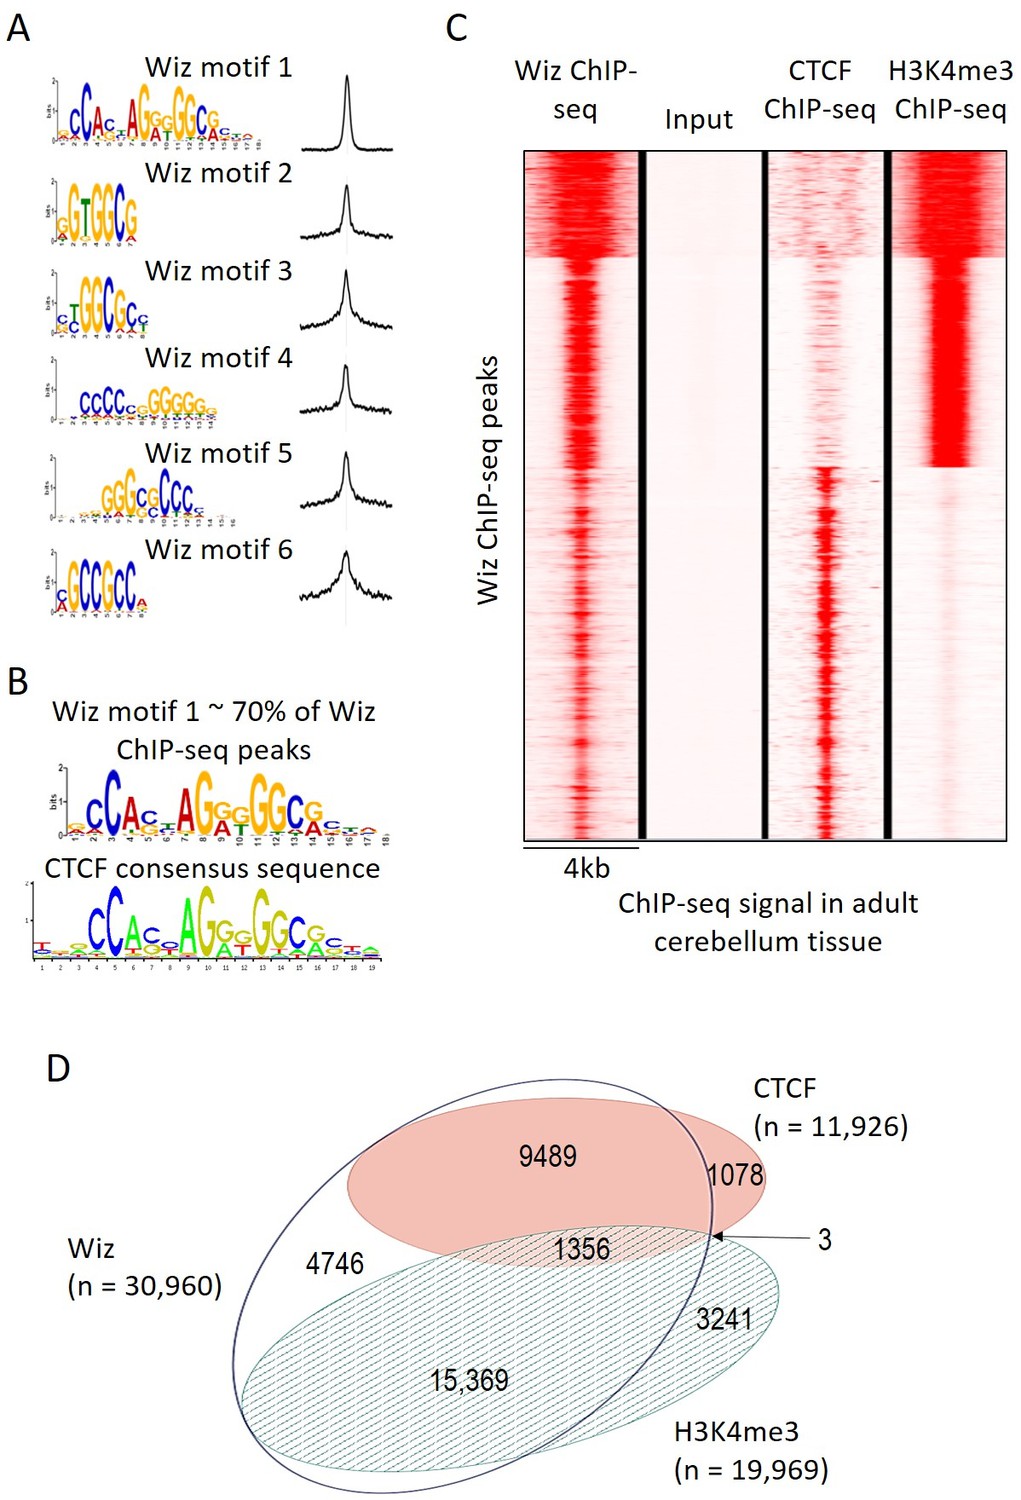
Wiz binding consensus shows a high degree of overlap with that for CTCF.
(A) The six most enriched motifs in Wiz ChIP-seq peaks (n = 39,781) and their distribution inside peaks are shown. (B) The most significant of these matches the CTCF-binding site consensus sequence (JASPAR CORE database - MA0139.1). (C) Read density for Wiz and the Encode CTCF and H3K4me3 ChIP-seq datasets were calculated across a 4 kb region centred on the ~40,000 Wiz ChIP-seq peaks. Input sequencing from the Wiz ChIP-seq experiment is also shown. Loci are clustered by the similarity of read density and datasets were normalized to the smallest sized library. (D) Venn diagram showing the overlap for Wiz, CTCF and H3K4me3 ChIP-seq peaks. An overlap was defined as at least one base of sequence occupied by a significantly enriched peak (p≤1 × 10⁻²⁰) from two datasets.
Figure 3—figure supplement 1
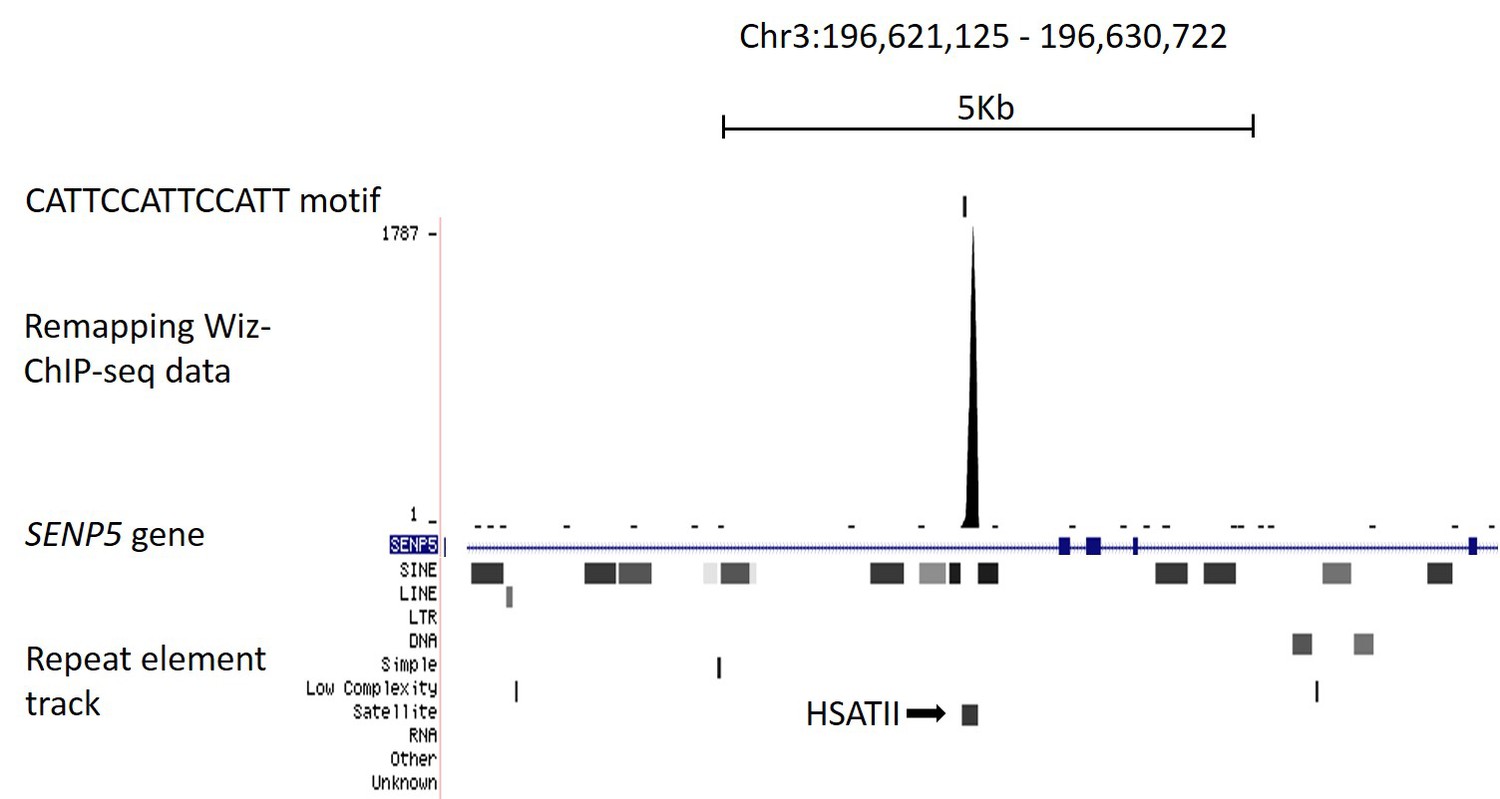
Remapping publically available Wiz ChIP-seq data.
(B) Shown is a UCSC genome browser screenshot of the SENP5 gene focussing on the consensus binding site (CATTCCATTCCATT motif) reported in Bian et al. (2015). The consensus binding site is indicated. Strong enrichment is seen for the Wiz ChIP-seq data, shown as a continuous read-depth score, at the CATTCCATTCCATT motif, though this occurs over a HSATII satellite element (shown in the repeat masker track) and is likely to be a mapping artefact.
Figure 4 with 1 supplement
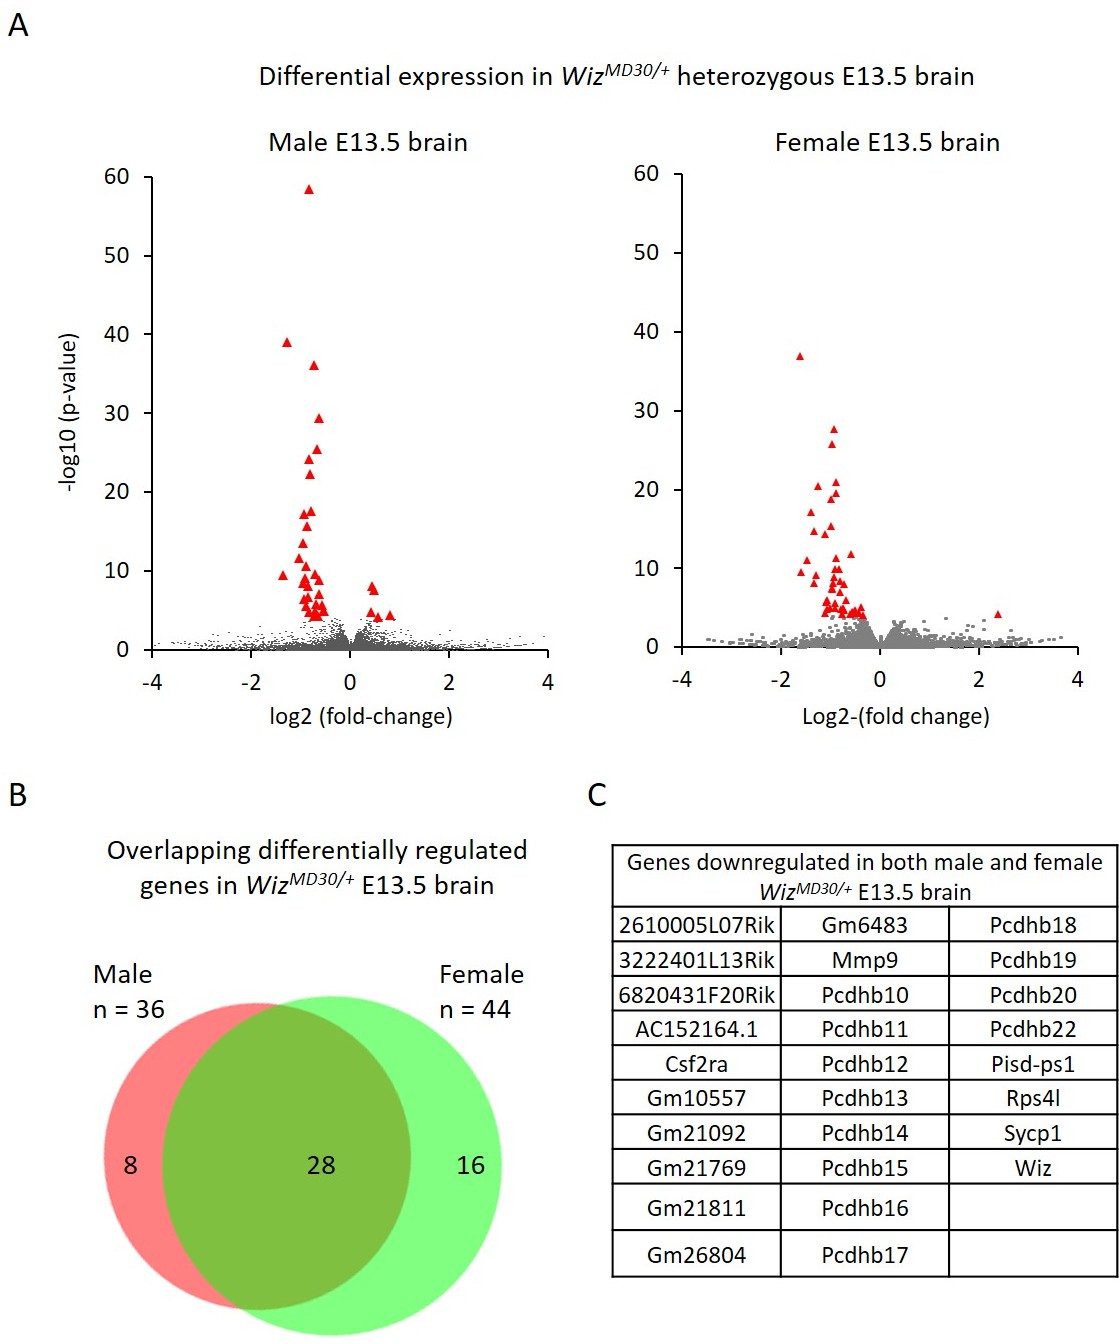
Differential gene expression in male and female WizMommeD30/+ E13.5 brains.
(A) Volcano plots show the log2 fold-change (x-axis) in the average expression of genes in WizMommeD30/+ E13.5 brains compared to Wiz+/+ E13.5 brains. Shown is data for males (left, n = 3 per genotype) and females (right, n = 2 per genotype). Significance is shown on a –log10 scale, those genes indicated in red are significantly differentially regulated with an adjusted p-value<0.05. (B) The overlap in differentially expressed genes is shown for the male and female embryonic brains, the majority of transcripts differentially expressed represent a common set between the sexes, listed in alphabetical order in (C), and all of these decrease in expression.
Figure 4—figure supplement 1
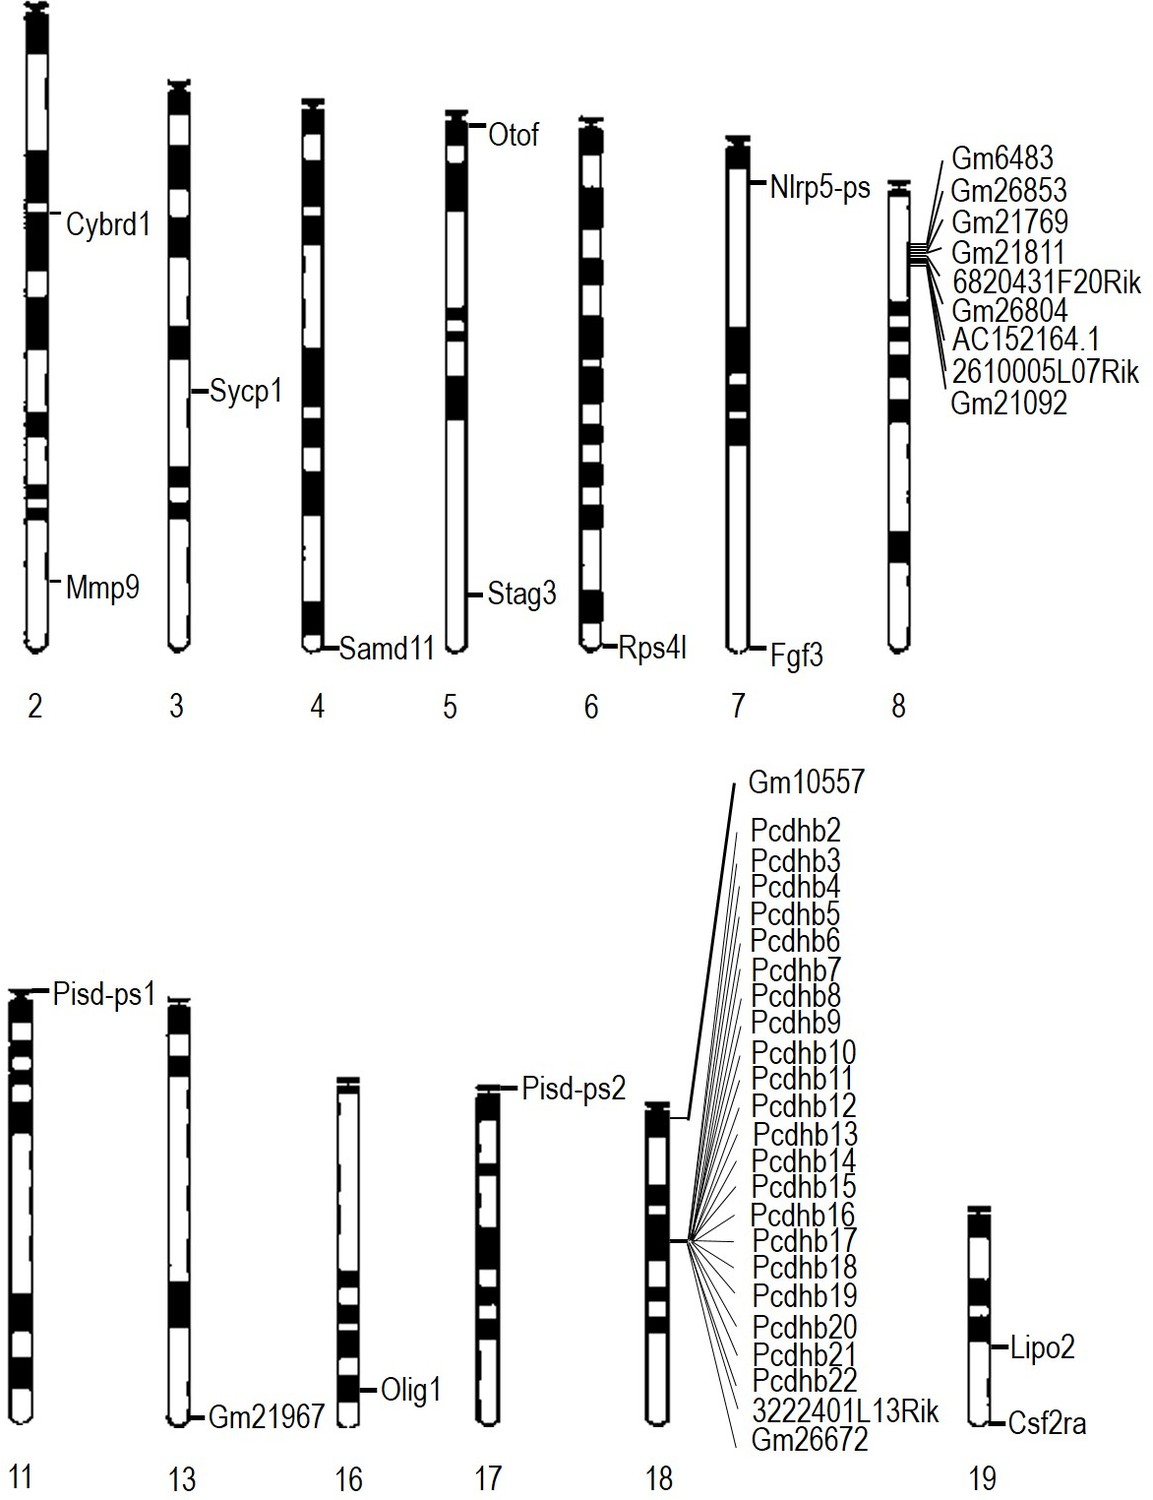
Location of differentially expressed genes in E13.5 WizMommeD30/+ brains.
The locations of down regulated genes differentially expressed in E13.5 brains of WizMommeD30/+ mice (combined from male and female datasets) are shown on mouse chromosomes. The Wiz gene is not shown.
Figure 5
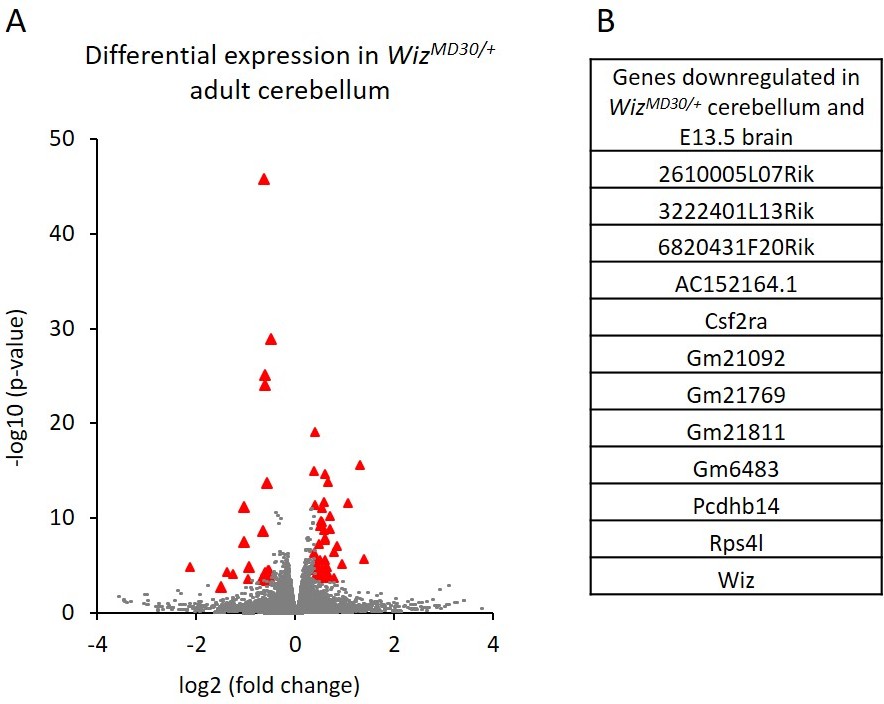
Differential gene expression in WizMommeD30/+ adult cerebellum.
(A) The log2 fold-change (x-axis) in the average expression of genes is shown for WizMommeD30/+ and Wiz+/+ cerebellum. Three male biological replicates were used per genotype. Significance is shown on a –log10 scale, those genes indicated in red are significantly differentially regulated. (B) A list of significantly differentially regulated genes in WizMommeD30/+ cerebellum that were also deregulated in E13.5 WizMommeD30/+ brains.
Figure 6
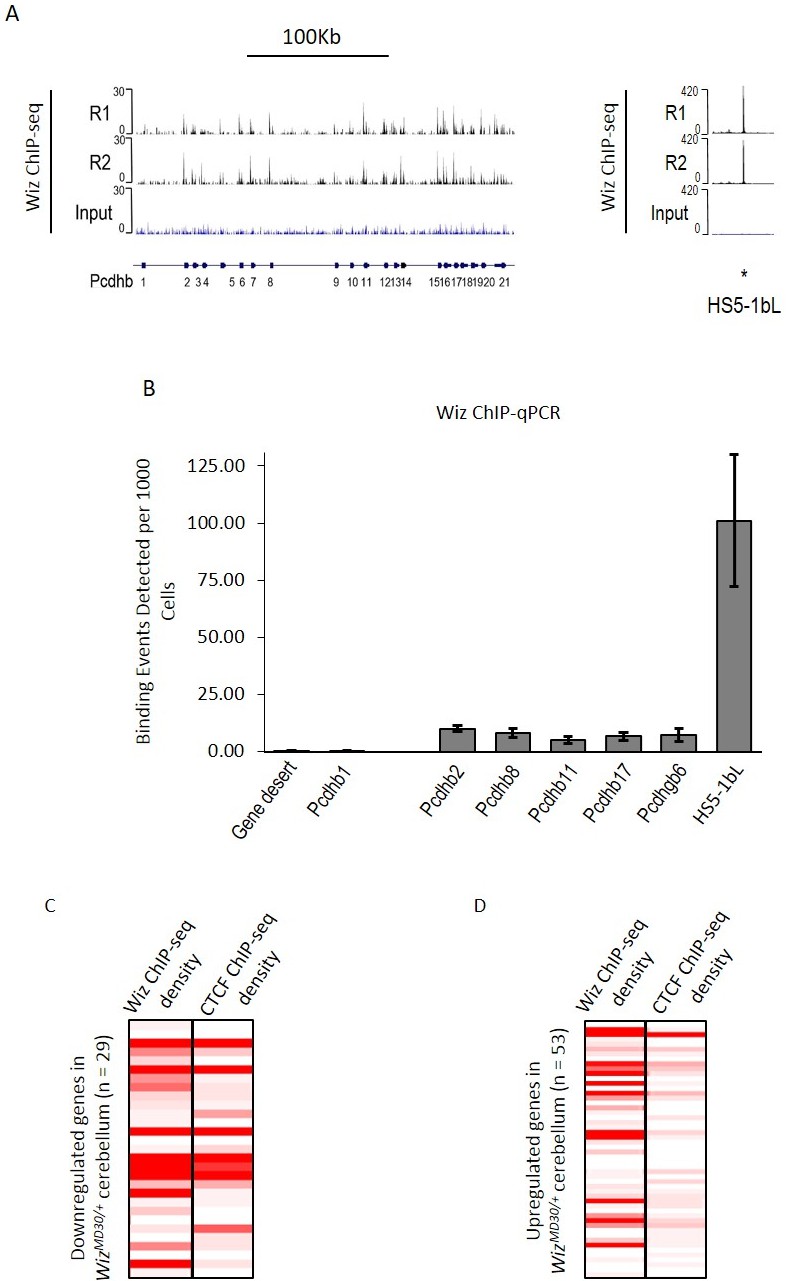
Wiz binding at the protocadherin β locus in the adult cerebellum.
(A) Genome browser screenshots of the protocadherin β locus and the HS5-1bL enhancer (*indicated) located ~400 Kb downstream. Shown are Wiz ChIP-seq data generated in the adult cerebellum as the read depth along the locus. Wiz binds promoters of the Pcdhb locus (left) and is enriched more at the downstream HS5-1bL enhancer (right), the relative binding of Wiz is indicated by the altered scale bar. The location of the Pcdhb genes, are indicated. (B) ChIP-qPCR was performed using the anti-Wiz antibody for two negative Wiz-enrichment sites, with primers located in a gene desert and at Pcdhb1, which was not enriched in ChIP-seq, and six positive Wiz-enrichment sites, including the promoters of four Pcdhb genes, the promoter of a Pcdhg gene and the downstream HS5-1bL enhancer. Enrichment is represented as binding events detected per 1000 cells and are generated by running samples in parallel with known amounts of genomic DNA. Error bars are the SEM from 3 biological replicates. (C) Shown is Wiz ChIP-seq read density in adult cerebellum as a heatplot for the 29 genes that decreased and (D) the 53 genes that increased, in expression in the cerebellum of WizMommeD30/+ mice. Also shown is CTCF ChIP-seq read density. ChIP-seq density was calculated for the 1 Kb surrounding the TSS of each gene and genes are ranked from the lowest to the highest fold change in each case. Datasets were normalized to the size of smallest library.
Figure 7 with 1 supplement
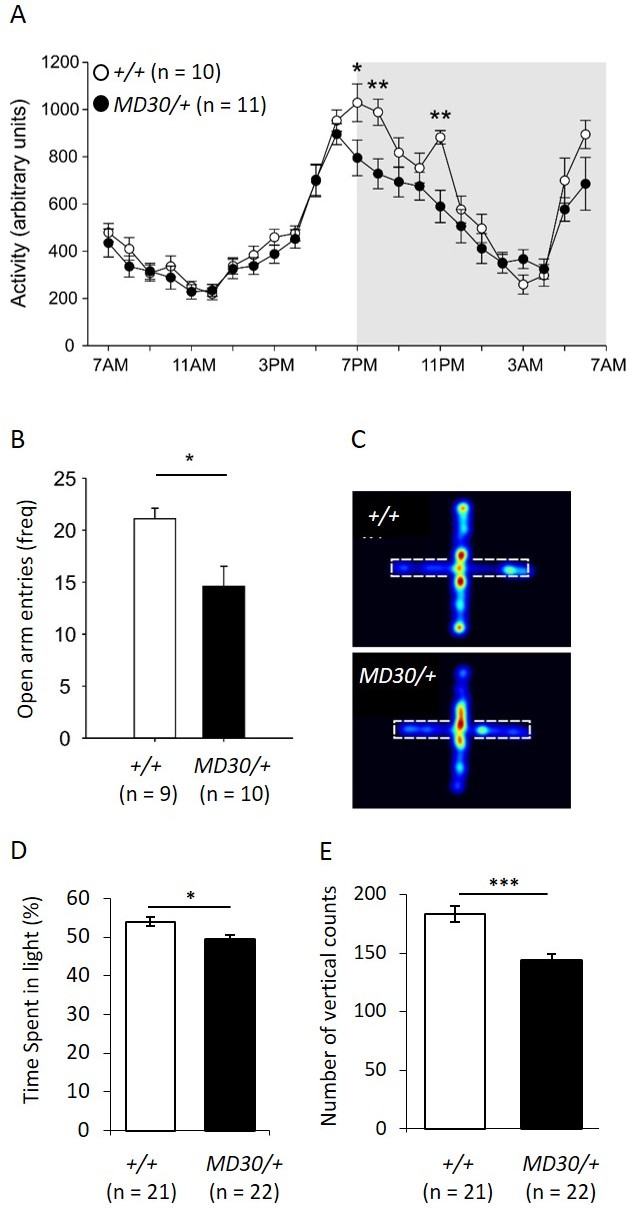
WizMommeD30/+ mice show decreased activity and increased anxiety-like behaviour.
(A) Line graph illustrating the average 24 hr activity profile from Wiz+/+ and WizMommeD30/+ mice, collapsed from 12 days of testing. The pattern of activity is broadly similar between the genotypes, though WizMommeD30/+ mice show decreased activity in the first two hours and the fifth hour of the active phase of the light/dark cycle. Grey box indicates the dark phase of the light/dark cycle. (B) Bar graph showing decreased open arm entries among WizMommeD30/+ mice compared with Wiz+/+ mice, after 5 min intervals on the EPM test. (C) Heat map of locomotor activity on the EPM from a representative Wiz+/+ mouse (top) and a representative WizMommeD30/+ mouse (bottom). Broken lines indicate the location of the closed arms of the EPM. (D) Percentage of time Wiz+/+ (n = 21) and WizMommeD30/+ (n = 22) mice spent in the light portion of a light-dark test. (E) The number of vertical counts (rearing) Wiz+/+ and WizMommeD30/+ mice showed in the light-dark test. Error bars represent ± SEM, *p-value <0.05, **p-value 0.005, ***p-value <0.0005.
Figure 7—figure supplement 1
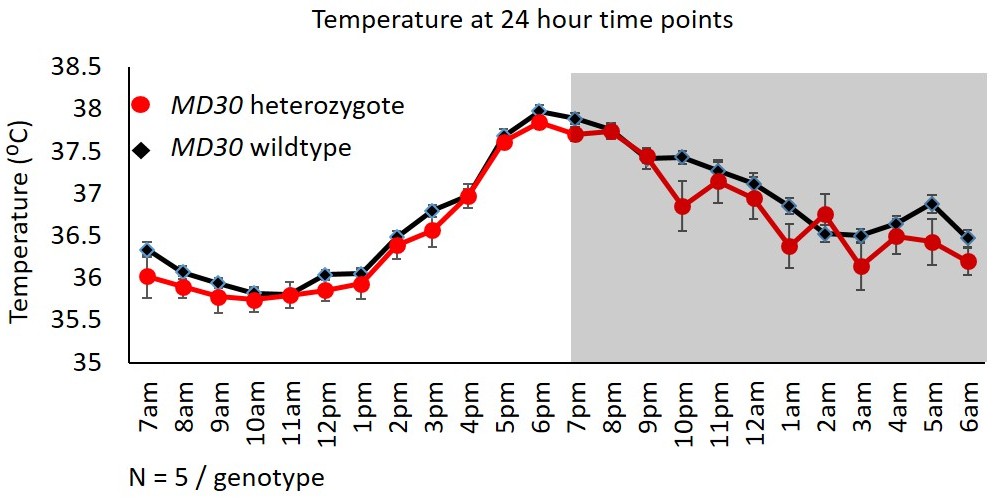
No difference in temperature in WizMommeD30/+ mice.
Telemetry data from across 3 days were collapsed into hourly intervals and the average temperature of Wiz+/+ (black data points) and WizMommeD30/+ (red data points) mice is shown. Lights on is indicated by light background and lights off is indicated by grey background. Numbers of mice for each cohort are indicated. Error bars are the SEM.
Additional files
-
Supplementary file 1
Wiz genome wide binding sites.
Wiz ChIP-seq binding peaks (mm10 genome build) identified in adult wildtype cerebellum (n = 2 Wiz ChIP-seq biological replicates, 1 input sample).
- https://doi.org/10.7554/eLife.15082.014
-
Supplementary file 2
Genes significantly differentially expressed in WizMommeD30/+ E13.5 male brain.
The average read count from both Wiz+/+and WizMommeD30/+ animals (n = 3 biological replicates per genotype) are shown, with the fold-change (WizMommeD30/+/Wiz+/+) and adjusted significance value for each gene predicted to be differentially expressed. Read counts are normalized for library size.
- https://doi.org/10.7554/eLife.15082.015
-
Supplementary file 3
Genes significantly differentially expressed in WizMommeD30/+ E13.5 female brain.
The average read count from both Wiz+/+ and WizMommeD30/+ animals (n = 2 biological replicates per genotype) are shown, with the fold-change (WizMommeD30/+/Wiz+/+) and adjusted significance value for each gene predicted to be differentially expressed. Read counts are normalized for library size.
- https://doi.org/10.7554/eLife.15082.016
-
Supplementary file 4
Genes significantly differentially expressed in WizMommeD30/+ cerebellum.
The average read count from both Wiz+/+ and WizMommeD30/+ animals (n = 3 biological replicates per genotype) are shown, with the fold-change (WizMommeD30/+ / Wiz+/+) and adjusted significance value for each gene predicted to be differentially expressed. Cells highlighted orange are protocadherin β cluster genes and cells highlighted green are cadherin 11-like cluster genes. Read counts are normalized for library size.
- https://doi.org/10.7554/eLife.15082.017
-
Supplementary file 5
Oligonucleotides used in the study.
- https://doi.org/10.7554/eLife.15082.018
Download links
A two-part list of links to download the article, or parts of the article, in various formats.
Downloads (link to download the article as PDF)
Open citations (links to open the citations from this article in various online reference manager services)
Cite this article (links to download the citations from this article in formats compatible with various reference manager tools)
Wiz binds active promoters and CTCF-binding sites and is required for normal behaviour in the mouse
eLife 5:e15082.
https://doi.org/10.7554/eLife.15082


