Microglia contribute to circuit defects in Mecp2 null mice independent of microglia-specific loss of Mecp2 expression
- Boston Children's Hospital, Harvard Medical School, United States
- University of Massachusetts Medical School, United States
- The Weizmann Institute of Science, Israel
- Broad Institute of MIT and Harvard, United States
Figures
Figure 1 with 2 supplements
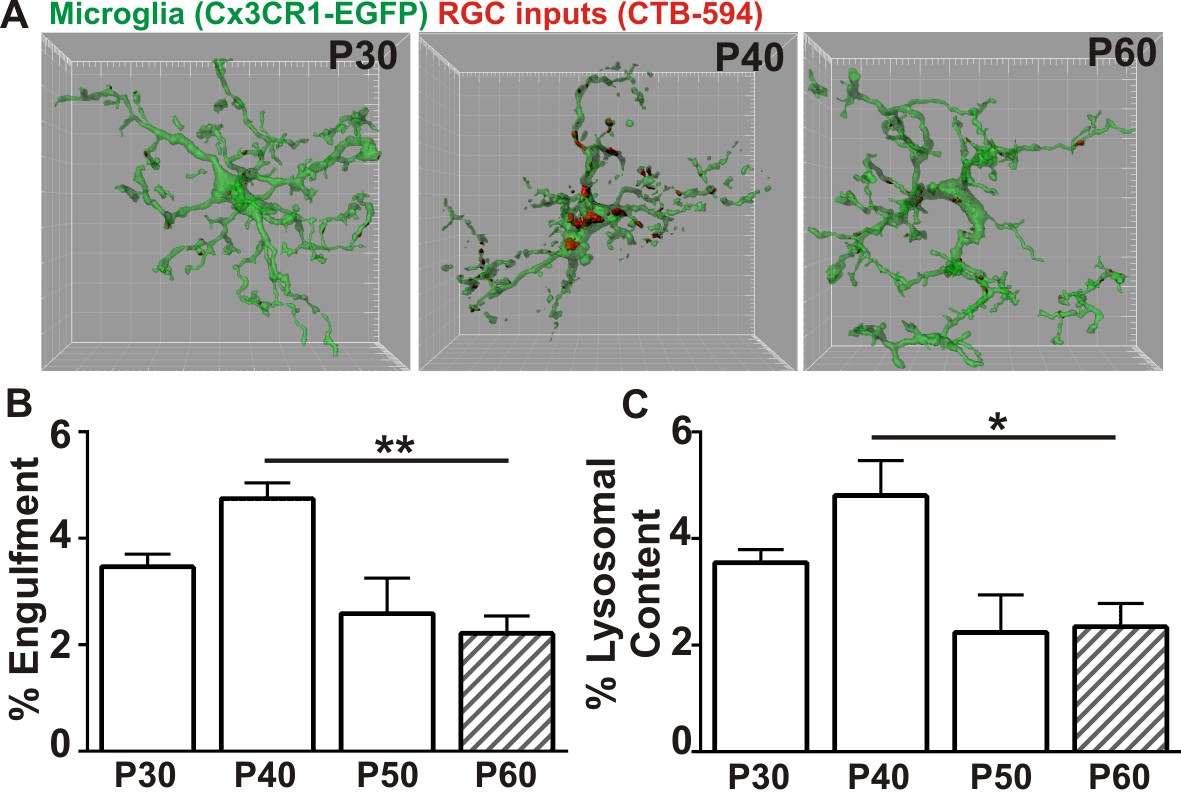
Microglia transiently engulf retinogeniculate presynaptic inputs in the juvenile P40 brain consistent with late stage synapse refinement.
(A) Representative surface rendered microglia (green) and engulfed retinogeniculate inputs (red) from P30, P40, and P60 LGN. See also Figure 1—figure supplement 2. Grid line increments = 5 µm. (B) Quantification of engulfment reveals a transient and significant increase in engulfment of RGC inputs within microglia at P40, an age consistent with late-stage synaptic refinement (Figure 1—figure supplement 1). (C) Accompanying increased engulfment, microglia also upregulate engulfment capacity at P40 as measured by lysosomal content within each microglia (CD68 immunoreactivity per cell). *p<0.05, **p<0.01 by one-way ANOVA, Dunnett’s post hoc test (all ages are compared to P60). All error bars represent SEM; N = 4–6 mice per age of mixed sex (equal ratios of males and females were used across ages).
Figure 1—figure supplement 1

Refinement of structural synapses in the late juvenile retinogeniculate system.
(A–B) Immunohistochemistry in P30 (A) and P60 (B) dLGN for vesicular glutamate transporter 2 (VG2) to label RGC-specific presynaptic terminals (ii, green in iv) and Homer1 to label postsynaptic densities (iii, red in iv). DAPI was used to label nuclei (i). Scale bar = 20 µm. (C–F) Quantification reveals a developmental decrease between P30 and P60 in structural VG2+ terminal size (C), VG2+ terminal density (D), and VG2+ synapse density (co-localized VG2 and Homer1) (F). (G–I) Quantification of immunohistochemistry for vesicular glutamate transporter 1 (VG1) to label corticothalamic-specific presynaptic terminals reveals no significant difference in VG1+ terminals (G–H) or VG1-containing synapses (I, colocalized VG1 and Homer1) in P30 vs P60 dLGN. *p<0.05 by Student’s t-test. All error bars represent SEM; N = 3–4 per age.
Figure 1—figure supplement 2
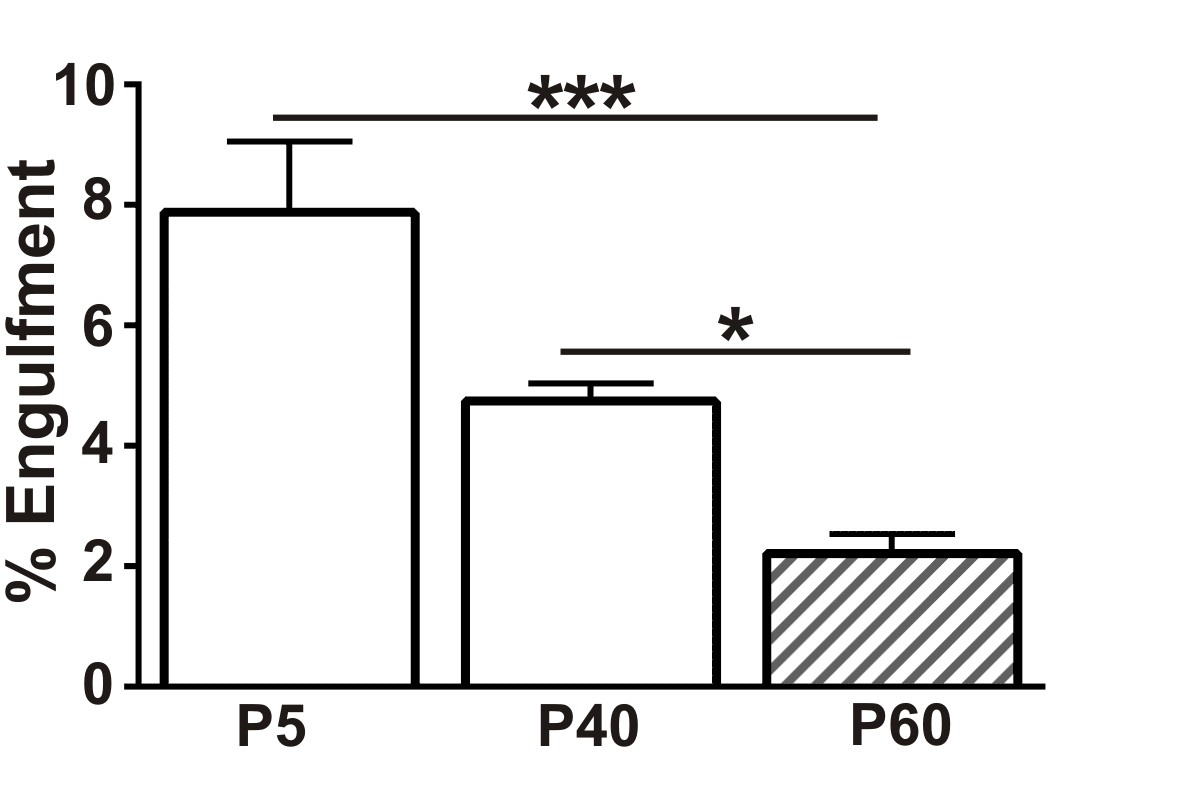
Presynaptic input engulfment in early and late phases of synaptic refinement in the developing retinogeniculate system.
Engulfment of retinogeniculate presynaptic inputs is significantly increased in P5 and P40 LGN compared to P50. *p<0.05, ***p<0.001 by one-way ANOVA, Dunnett’s post hoc test (all ages are compared to P60). All error bars represent SEM; N = 4–6 mice per age.
Figure 2 with 2 supplements
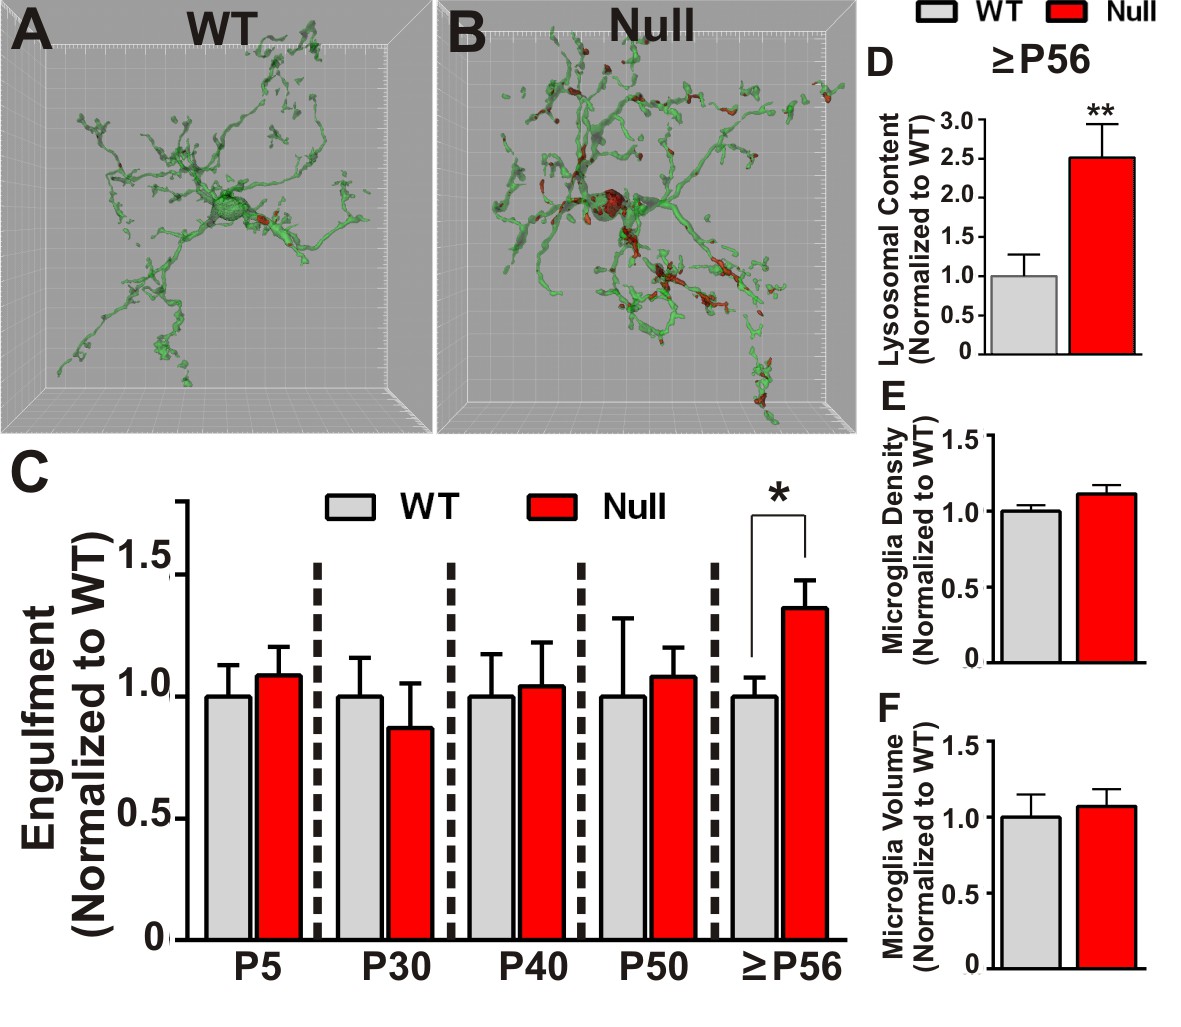
Microglia excessively engulf retinogeniculate presynaptic inputs in late phenotypic Mecp2 null mice.
(A–B) Representative surface rendered microglia (green) and engulfed RGC inputs (red) demonstrates enhanced engulfment of presynaptic inputs in ≥P56 (P56-P60) Mecp2 null dLGN (B) as compared to WT littermate controls (A). Grid line increments = 5 µm. (C) Quantification of engulfment across development reveals excessive engulfment of presynaptic inputs within ≥P56 Mecp2 null dLGN as compared to WT littermate controls in the absence of significant RGC cell death (Figure 2—figure supplement 1) or engulfment of other non-synaptic neuronal debris (Figure 2—figure supplement 2). *p<0.05 by multiple unpaired Student’s t-tests; N = 4–6 mice per age and genotype; all data are normalized to WT controls at each age. (D) Quantification of lysosomal content (CD68 immunoreactivity) within microglia in ≥P56 LGN reveals a significant increase in phagocytic capacity in Mecp2 null mice as compared to WT littermate controls. **p<0.01 by unpaired Student’s t-tests; N = 3 mice per genotype; data are normalized to WT control. (E–F) There is no significant difference in numbers or volume of microglia within the ≥P56 LGN by unpaired Student’s t-test; N = 3–5 mice per genotype; data are normalized to WT control. All error bars represent SEM.
Figure 2—figure supplement 1
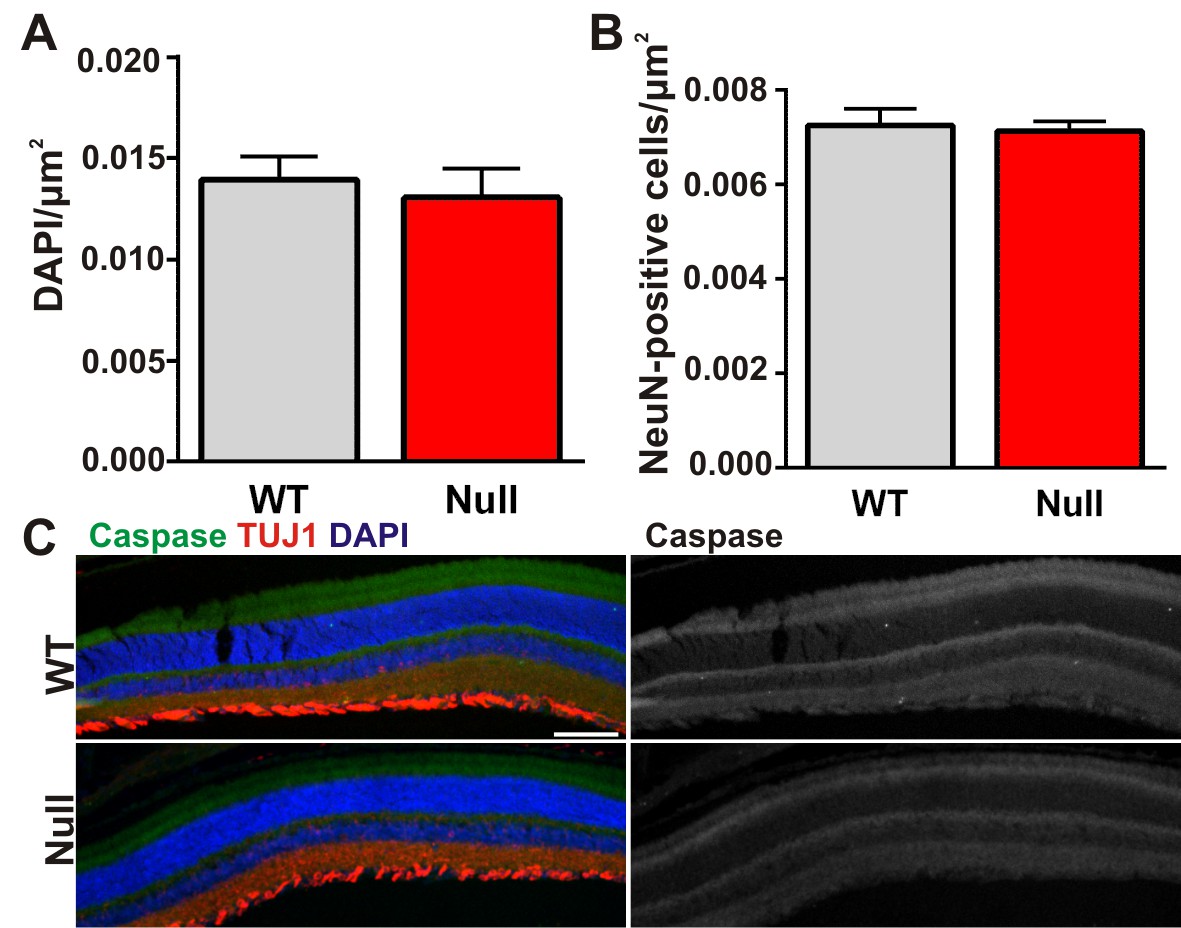
There is no significant cell death in the retinas of Mecp2 null mice.
(A–B) Quantification of total DAPI (A) and NeuN (B) cells in the retinal ganglion cell layer of the retina from ≥P56 Mecp2 WT (grey bars) and null (red bars) mice reveals no significant changes in cell numbers. All error bars represent SEM; N = 3 mice per genotype. (C) Immunohistochemistry in the Mecp2 WT (top) or null (bottom) retina for TUJ1 (red) to label the retinal ganglion cell layer or cleaved caspase (green) to label dead/dying cells. Cleaved caspase channel is visualized separately in far right panels for both genotypes. Cell death was never observed in either genotype. Data are representative of 3 mice per genotype. Scale bar = 100 µm.
Figure 2—figure supplement 2
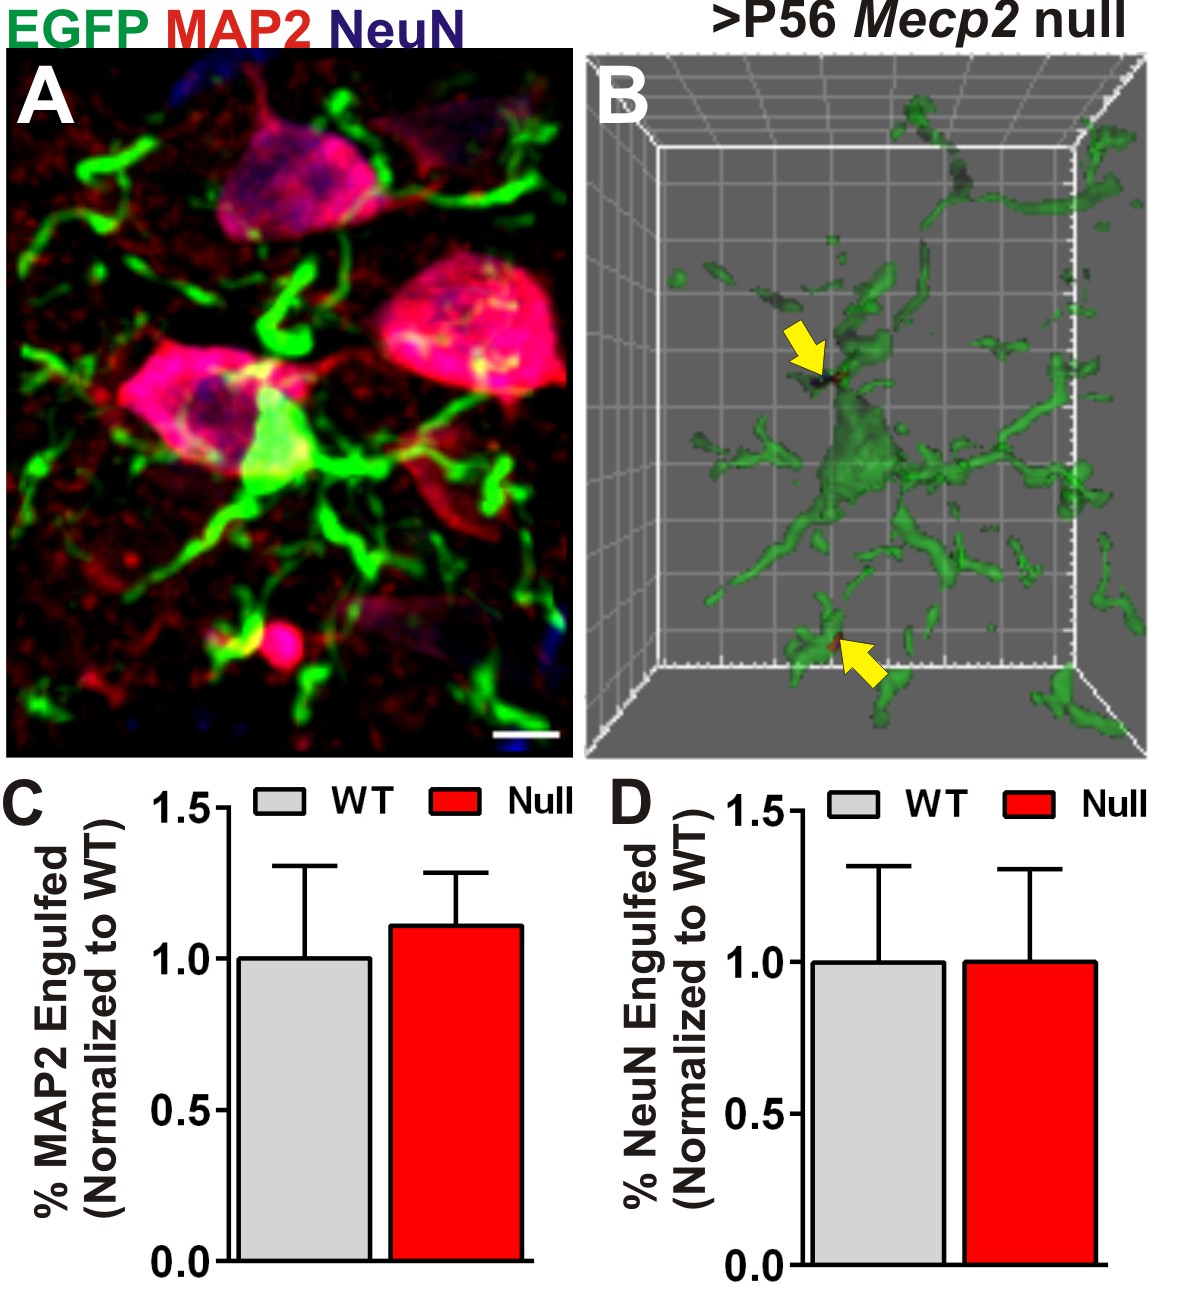
Engulfment is specific to presynaptic inputs.
(A) A representative maximum intensity projection of a microglia (EGFP, green) and neurons labeled with anti-NeuN (blue), and anti-MAP2 (red) in the ≥P56 (P56-P60) Mecp2 null LGN. Scale bar = 5 µm. (C) Surface rendering of the same microglia (A) and engulfed MAP2 and NeuN-positive debris (arrows). Grid line increments = 5 µm. (C–D) Quantification of engulfed MAP2 (C) or NeuN (D) immunoreactive neuronal debris reveals no significant difference between Mecp2 WT (grey bars) and null animals (red bars). Error bars represent SEM; N = 3 mice per genotype.
Figure 3 with 1 supplement
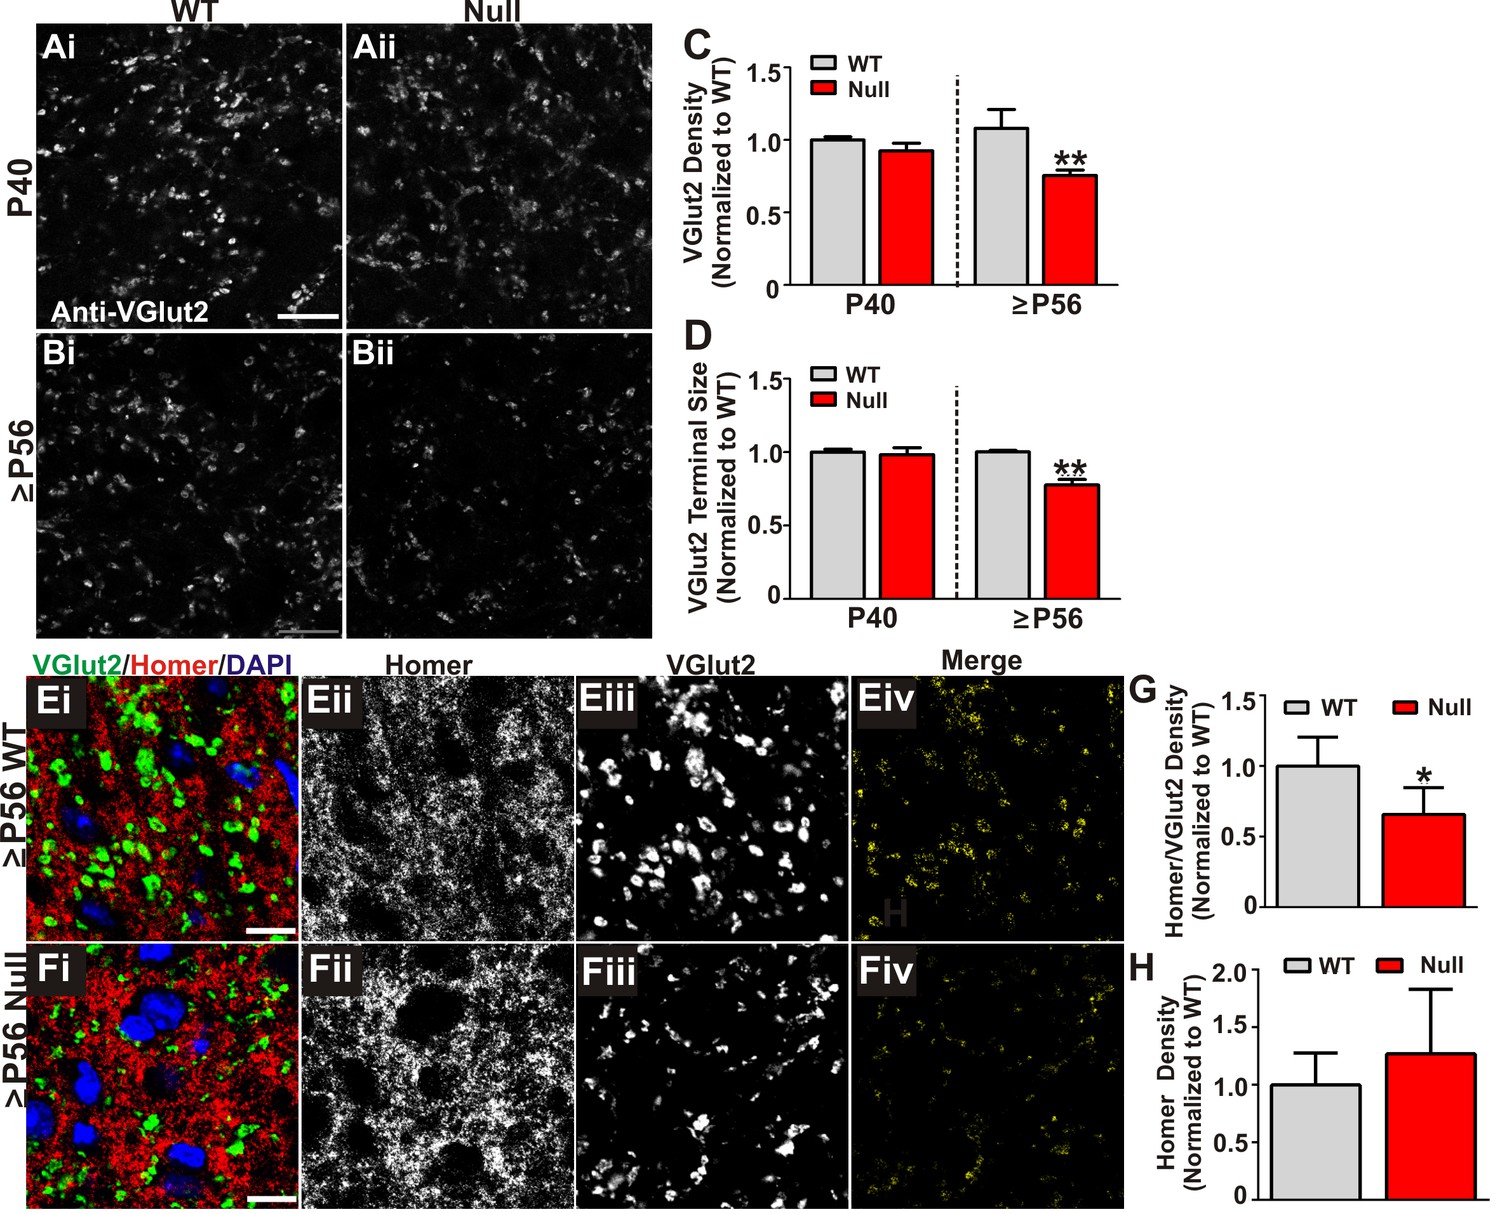
Retinogeniculate presynaptic terminals and synapses are reduced in late phenotypic ≥P56 Mecp2 null mice.
(A) Immunohistochemistry for VGlut2 to label retinogeniculate presynaptic terminals, in the dLGN of P40 (A) and ≥P56 (B, P56-P60) Mecp2 wild-type (WT; left column) and null (right column) littermates. Images are single planes of a confocal z-stack. Scale bar = 20 µm. (C–D) Quantification of RGC presynaptic terminal (VGlut2+ puncta) immunohistochemistry reveals a significant decrease in RGC-specific terminal density (C) and size (D) in ≥P56 Mecp2 null mice (red bars) as compared to WT littermate controls (grey bars). No significant difference was observed at P40. All data are normalized to WT control for each age. **p<0.01 unpaired Student’s t-test at each age; N = 3–4 mice per age and genotype; (E–F) Immunohistochemistry for VGlut2 (green) and the postsynaptic marker Homer1 (in the dLGN of ≥P56 Mecp2 WT (E) and null (F) littermates. Images are single planes from confocal z-stacks. The VGlut2 and Homer1 channels are separated in panels ii–iii. Panels Eiv and Fiv are colocalized VGlut2 and Homer1 puncta. Scale bar = 10 µm. (G–H) Quantification reveals a a significant decrease in RGC-specific synapses (colocalized VGlut2 and Homer) within the LGN of >P56 Mecp2 null mice (red bars) as compared to WT littermate controls (grey bars) (G) and no significant change in the density of the postsynaptic protein Homer1 (H). No significant difference in density was observed in corticogeniculate-specific, VGlut1-positive synapses within the LGN or VGlut2 or VGlut1-containing synapses within a neighboring thalamice nuceli (Figure 3—figure supplement 1). *p<0.05 by Student’s paired t-test.; N = 5 mice per genotype; all data are normalized to WT control. All error bars represent SEM.
Figure 3—figure supplement 1
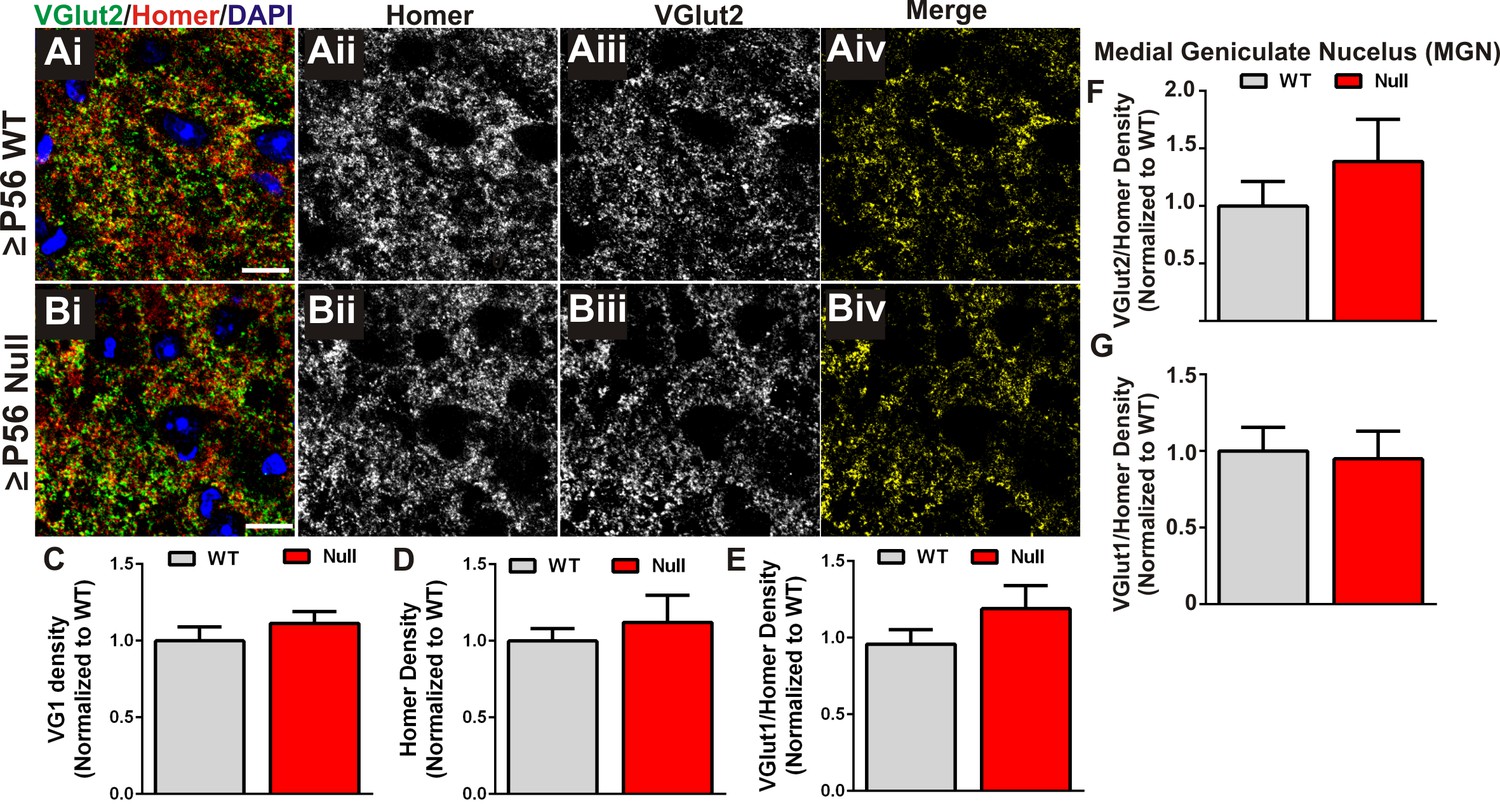
Presynaptic terminal and synapse loss are specific to retinogeniculate synapses.
(A–B) Immunohistochemistry for the corticogeniculate presynaptic terminal marker VGlut1 (green) and the postsynaptic marker Homer in the dLGN of ≥P56 Mecp2 WT (A) and null (B) littermates. Images are single planes from confocal z-stacks. The VGlut1 and Homer channels are separated in panels ii-iii. Colocalized VGlut1 and Homer puncta are visualized in panels Aiv and Biv. Scale bar = 10 µm. (C–E) Quantification reveals no significant difference in the density of VGlut1-positive terminals (C), Homer-positive postsynaptic densities (D), or colocalized VGlut1/Homer puncta (E) in the LGN of ≥P56 Mecp2 null mice (red bars) as compared to WT littermate controls (grey bars). (F–G) Quantification of density of VGlut2 (F) and VGlut1 (G) presynaptic terminals in the medial geniculate nucleus (MGN) of ≥P56 Mecp2 WT (grey bars) and null (red bars) mice reveals no significant changes in terminal density in this neighboring thalamic nuclei. All error bars represent SEM; N = 4–5 mice per genotype.
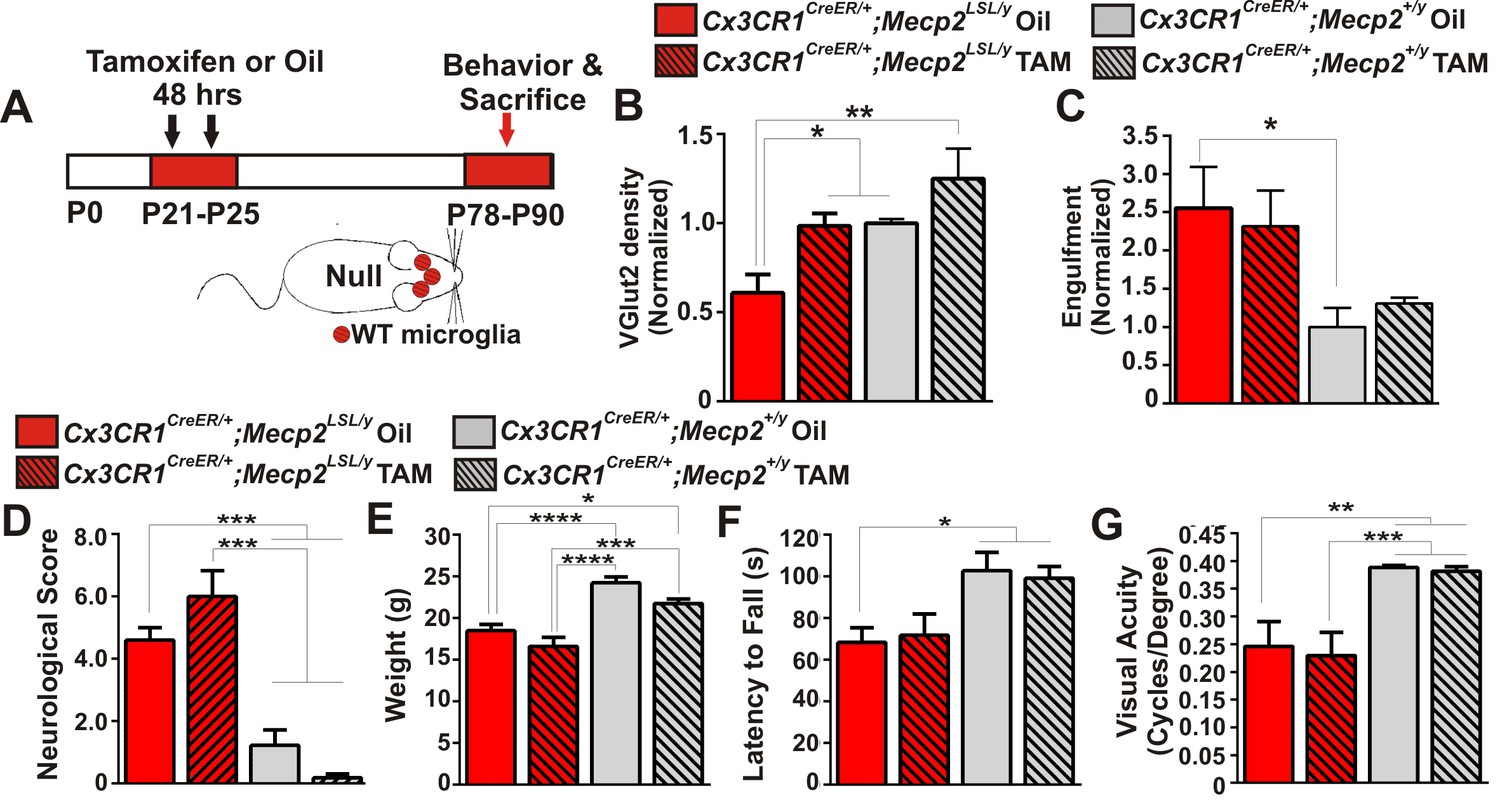
Figure 4 with 1 supplement
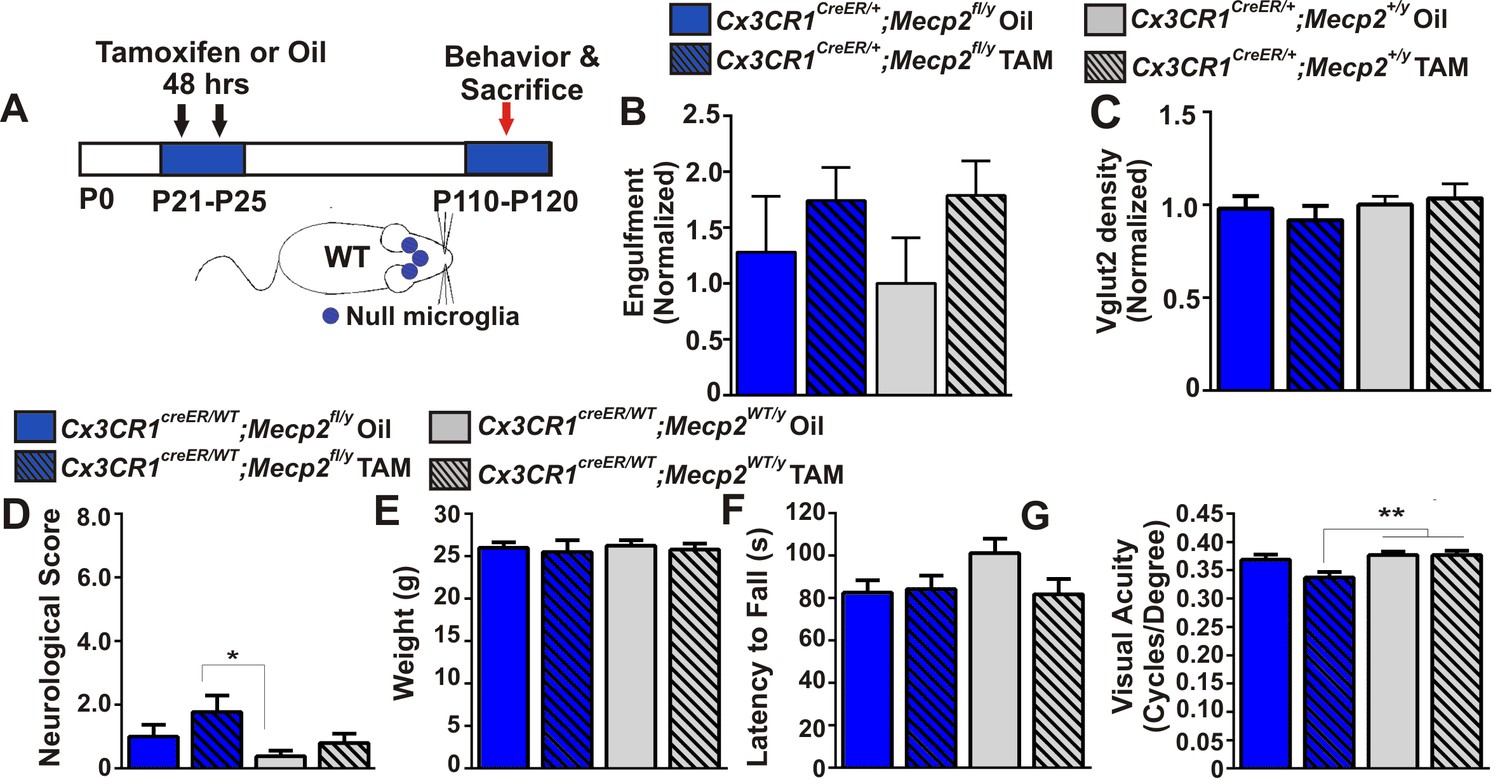
Excessive engulfment, synapse loss, and phenotypic regression are not induced following microglia-specific loss of Mecp2 expression.
(A) Paradigm for inducing recombination in which mice receive 2 tamoxifen or vehicle (oil) injections 48 hr apart between P21 and P25 (Figure 4—figure supplement 1). Behavior and postmortem analyses are subsequently performed in P110-P120 mice. (B–C) Quantification of engulfment (B) and VGlut2 terminal density (C) in the LGN of oil (solid bars) or tamoxifen (Tam, hashed bars)-treated mice expressing Cx3cr1CreER/+;Mecp2fl/y (blue bars) or Cx3cr1CreER/+;Mecp2+/y (grey bars) reveals no significant effect when Mecp2 expression is specifically ablated in microglia (Cx3cr1CreER/+;Mecp2fl/y Tam, blue hashed bars) compared to all control groups. N = 4–6 mice per genotype (D–G). Quantification of neurological scores, weight loss, latency to fall from a rotarod, and behavioral visual acuity (optometry) in oil (solid bars) or tamoxifen (Tam, hashed bars)-treated mice expressing Cx3cr1CreER/+;Mecp2fl/y or Cx3cr1CreER/+;Mecp2+/y. There is no significant difference between mice with Mecp2-deficient microglia (Cx3cr1CreER/+;Mecp2fl/y Tam, blue hashed bars) versus the same genotype treated with oil (Cx3cr1CreER/+;Mecp2fl/y Oil blue solid bars) in any assays. However, there is a small but significant deficit in neurological score (D) and visual acuity (G) when comparing mice with Mecp2-deficient microglia (Cx3cr1CreER/+;Mecp2fl/y Tam, blue hashed bars) to WT controls (Cx3cr1CreER/+;Mecp2+/y, grey bars), an effect likely due to the hypomorphic Mecp2fl/y allele. *p<0.05, **p<0.01 by one-way ANOVA, Tukey’s post hoc test; N = 7–13 mice per genotype. All error bars represent SEM.
Figure 4—figure supplement 1
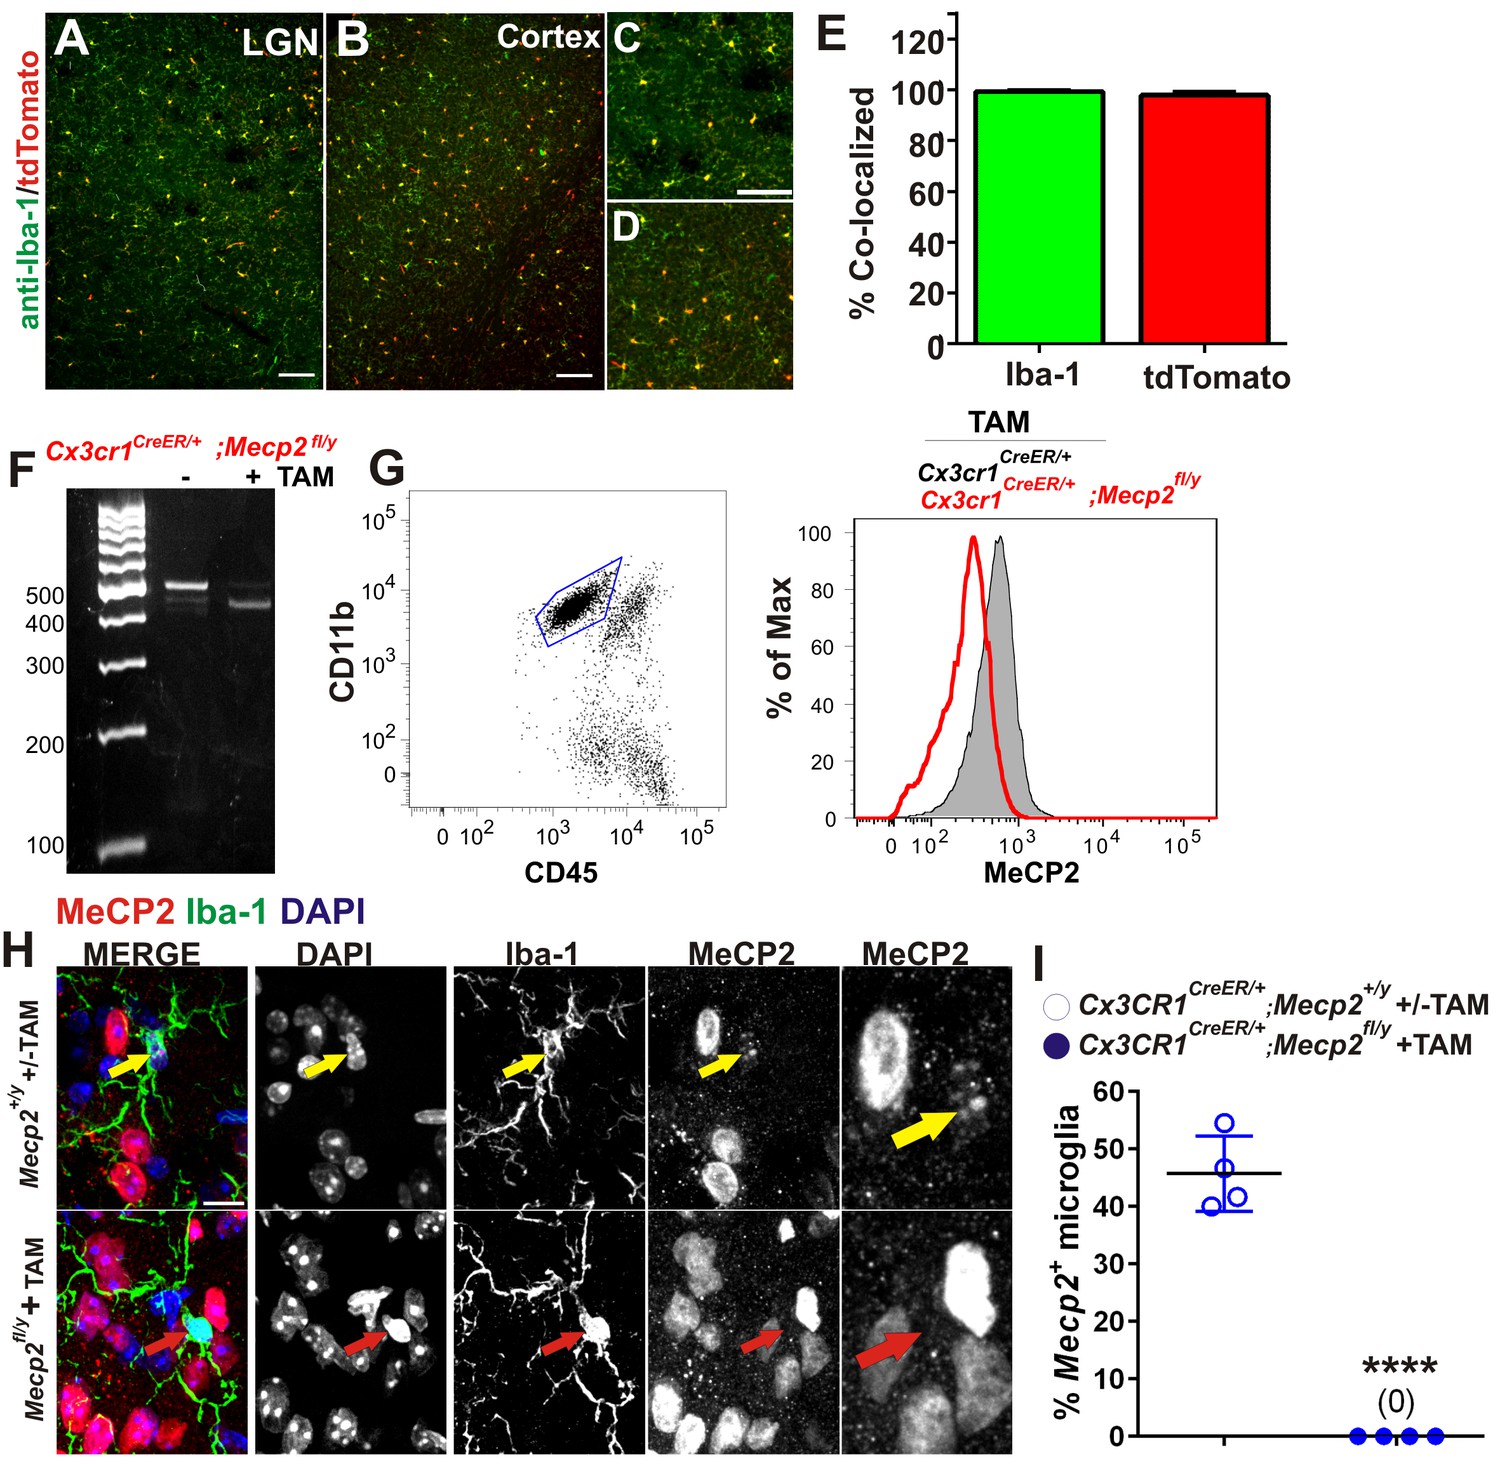
Validation of Cre-mediated recombination and Mecp2 deletion in microglia.
(A–E) Cx3CR1CreER mice were crossed with Ai9 (RCL-tdT) mice which harbor a targeted mutation of the Gt(ROSA)26Sor locus with a loxP-flanked STOP cassette that prevents transcription tdTomato. Mice were administered tamoxifen at P21-P25 and assessed for recombination >P80. (A–B) Images demonstrating colocalization between Iba-1 positive microglia (green) and tdTomato-positive cells (red) in the LGN and cortex. Scale bar = 100 µm. (C–D) Magnified regions from A and B. Scale bar = 100 µm. (E) Quantification of images reveals that nearly 100% of Iba-1 positive microglia were positive for tdTomato (green bar) and nearly 100% of td Tomato-positive cells were positive for Iba-1 (red bar). Error bars represent SEM; N = 3 mice. (F) PCR for the intact (~500) and the excised mecp2fl allele (~400 bp) on genomic DNA of microglia isolated from whole brains of Cx3cr1CreER/+:Mecp2fl/y mice, treated or non-treated tamoxifen (TAM) in vivo. (G) Flow cytometric analysis of microglia isolated from whole brains of TAM-treated Cx3cr1CreER/+; Mecp2+/yand Cx3cr1CreER;Mecp2fl/y mice reveals loss of Mecp2 protein in Cx3cr1CreER:Mecp2fl/y mice (red line). (H) Immunohistochemistry in the LGN for Mecp2 (C-terminal antibody was a generous gift from Dr. M. Greenberg) following antigen retrieval and amplification using HRP-conjugated secondary antibodies reveals Mecp2 protein (red) within the nucleus (DAPI, blue) of Iba-1-positive microglia in WT (top row) animals (yellow arrow) and loss of Mecp2 specifically in microglia (red arrow) following recombination in Cx3cr1CreER;Mecp2fl/y mice (P110-P120; bottom row). Merged and individual channels are shown as well as magnified region of Mecp2 channel (far right panels). Scale bar =10 µm. It should be noted that several other Mecp2 antibodies and staining conditions were attempted, but only this antibody and condition enabled us to detect Mecp2 protein even in WT microglia. (I) Quantification of Mecp2 expression in microglia reveals a significant loss of Mecp2 protein following recombination in Cx3cr1CreER;Mecp2fl/y mice. ****p<0.0001 by Student’s t-test. Error bars represent SEM; N = 3 mice per genotype.
Figure 5 with 1 supplement
Mecp2 expression in microglia is largely insufficient to attenuate excessive engulfment, synapse loss, or phenotypic regression in Mecp2 null mice.
(A) Paradigm for inducing recombination in which mice receive 2 tamoxifen or oil injections 48 hr apart between P21 and P25. Behavior and postmortem analyses are subsequently performed in P78-P90 mice (Figure 5—figure supplement 1). (B–C) Quantification of engulfment (B) and VGlut2 terminal density (C) in the LGN of oil (solid bars) or tamoxifen (hashed bars)-treated mice expressing Cx3cr1CreER/+;Mecp2LSL/y (red bars) or Cx3cr1CreER/+;Mecp2+/y (grey bars). (B) There was a significant decrease in VGlut2 terminal density in mice null for Mecp2 in all cells (red solid bars) and this effect was attenuated when Mecp2 was expressed in microglia (red hashed bars), an effect which may have resulted from tamoxifen treatment which induces a trend towards increased VGlut2 density in WT mice (grey hashed bars). *p<0.05, **p<0.01 by one-way ANOVA, Tukey’s post hoc test; N = 4–6 mice per genotype. (C) In addition, there is a significant increase in engulfment in mice null for Mecp2 in all cells (red solid bars) compared to WT, oil-treated littermates (grey solid bars) and this effect was not significantly attenuated when Mecp2 was expressed in microglia (red hashed bars). However, expression of Mecp2 in microglia is no longer significant from controls, which suggests a modest effect. *p<0.05 by one-way ANOVA, Dunnett’s post hoc test (all genotypes compared to Cx3cr1CreER/+;Mecp2+/y Oil, grey bars; data are not significant by Tukey’s post hoc test); N = 3–5 mice per genotype. All error bars represent SEM. (D–G) Expression of Mecp2 in a null background (red hashed bars) has no significant effect on attenuation of deficits in neurological score (D) weight loss (E) latency to fall from a rotarod (F) or visual acuity (G) compared to mice null for Mecp2 in all cells (red bars). However, rotarod performance in Cx3cr1CreER/+;Mecp2LSL/y Tam mice (red hashed bar) was no longer significant from controls (grey hashed and solid bars), which suggests a modest effect. *p<0.05, **p<0.01, ***p<0.001, ****p<0.0001 by one-way ANOVA, Tukey’s post hoc test; N = 6–11 mice per genotype. All error bars represent SEM.
Figure 5—figure supplement 1
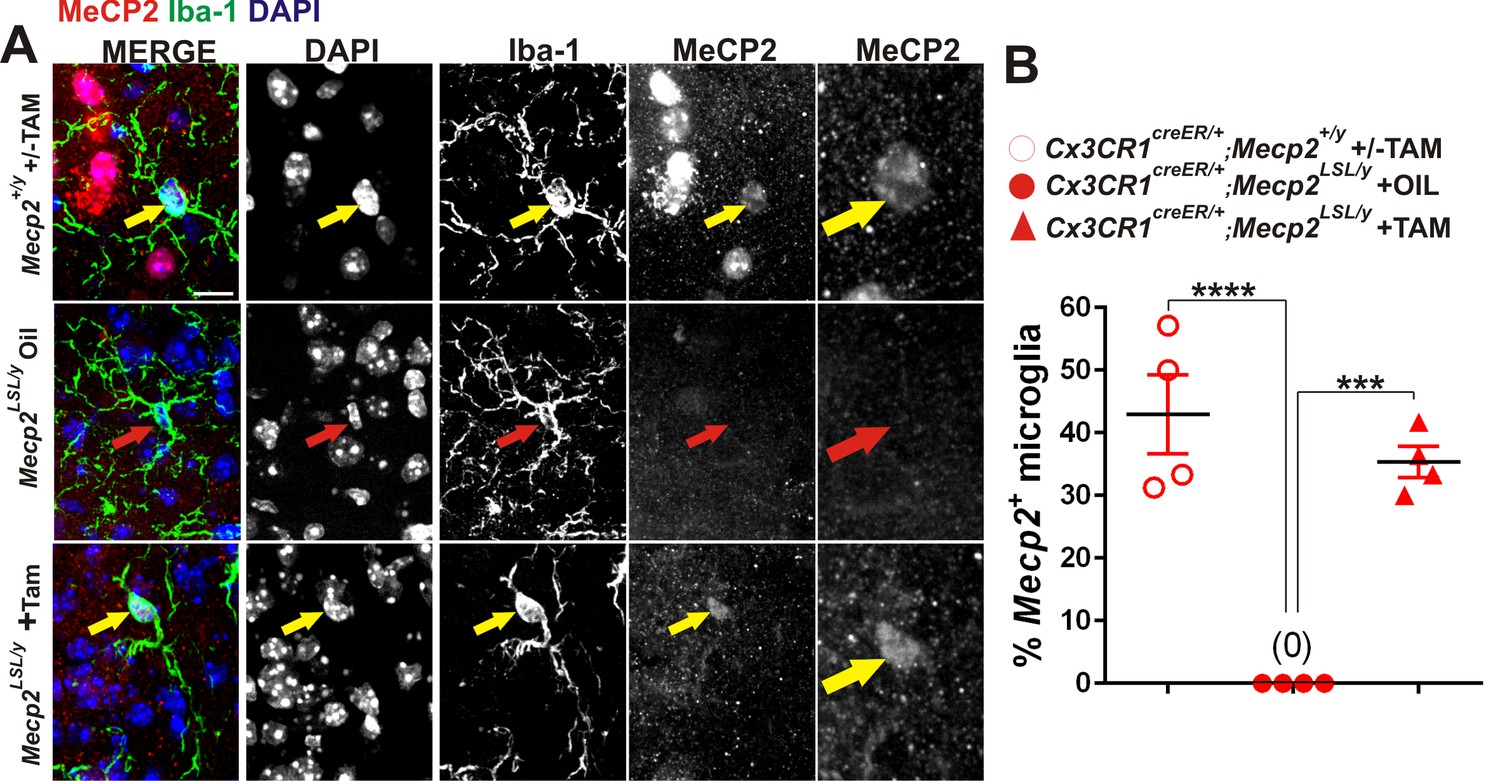
Validation of loss or gain of Mecp2 protein in dLGN microglia following Cre-mediated recombination.
(A) Immunohistochemistry in the LGN for Mecp2 (C-terminal antibody was a generous gift from Dr. M. Greenberg) following antigen retrieval and amplification using HRP-conjugated secondary antibodies reveals Mecp2 protein (red) within the nucleus (DAPI, blue) of Iba-1-positive microglia in WT (top row) and Cx3CR1CreER/+;Mecp2LSL/y (bottom row) animals treated with tamoxifen (yellow arrows) and loss of Mecp2 in all cells including microglia (red arrow) in Cx3cr1CreER;Mecp2fl/y mice treated with oil (middle row). Merged and individual channels are shown as well as magnified region of Mecp2 channel (far right panels). Scale bar = 10 µm. (B) Quantification of Mecp2 expression in microglia reveals a significant loss of Mecp2 protein in Cx3cr1CreER;Mecp2LSL/y mice treated with oil compared to Cx3CR1CreER/+;Mecp2+/y or Cx3CR1CreER/+;Mecp2LSL/y treated with tamoxifen. ****p<0.0001, ***p<0.001 by one-way ANOVA. Error bars represent SEM; N = 3 mice per genotype.
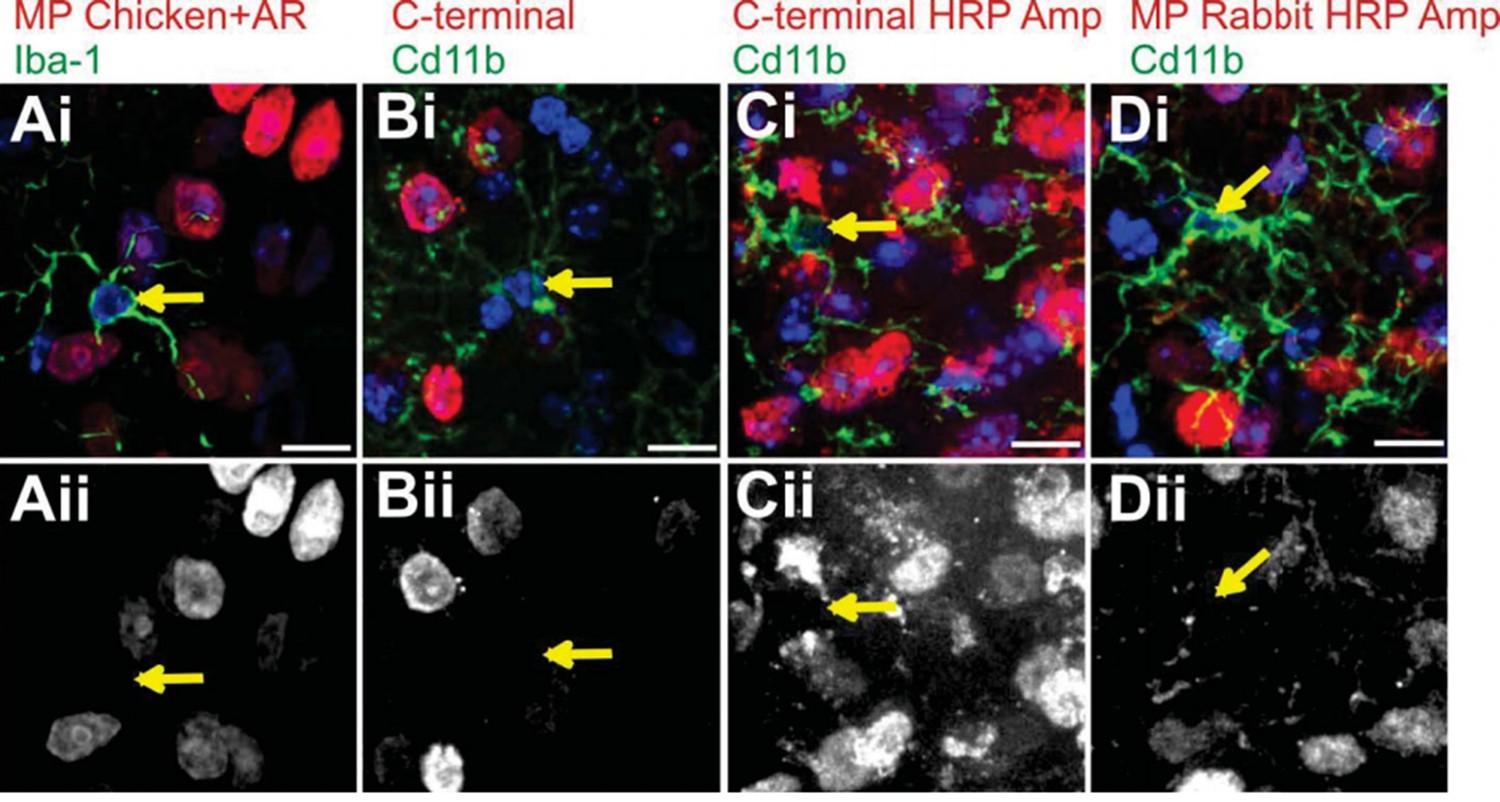
Author response image 1
Attempts to immunostain for Mecp2 protein in WT LGN microglia.
To validate loss or gain of Mecp2 expression, we first required an antibody to recognize Mecp2 protein in WT microglia. We made numerous attempts before we were able to detect adequate levels for analysis (see Figure 4—figure supplement 1 and Figure 5—figure supplement 1). Failed attempts are in LGN microglia are shown. Merge channels are on top row and the Mecp2 channel is in the bottom row. Arrows denote microglia nuclei and lack of Mecp2 immunostaining in bottom panel. (A) Immunostaining with a Millipore chicken anti- Mecp2 antibody with antigen retrieval (red in Ai, Aii) and anti-Iba-1 to label microglia. (B-C) Immunostaining with a C-terminal anti-Mecp2 antibody (gift from M. Greenberg from Harvard Medical School; red in Bi and Ci, Bii and Cii) and anti-Cd11b to label microglia without (B) and with (C) amplification using HRP. We were successful detecting Mecp2 in microglia with this antibody following antigen retrieval and HRP amplification (see Figure 4—figure supplement 1 and Figure 5—figure supplement 1). (D) Immunostaining with a Millipore rabbit anti-Mecp2 antibody with HRP amplification (red in Di, Dii) and anti-Cd11b to label microglia. All Scale bars =10 µm.
Author response image 2
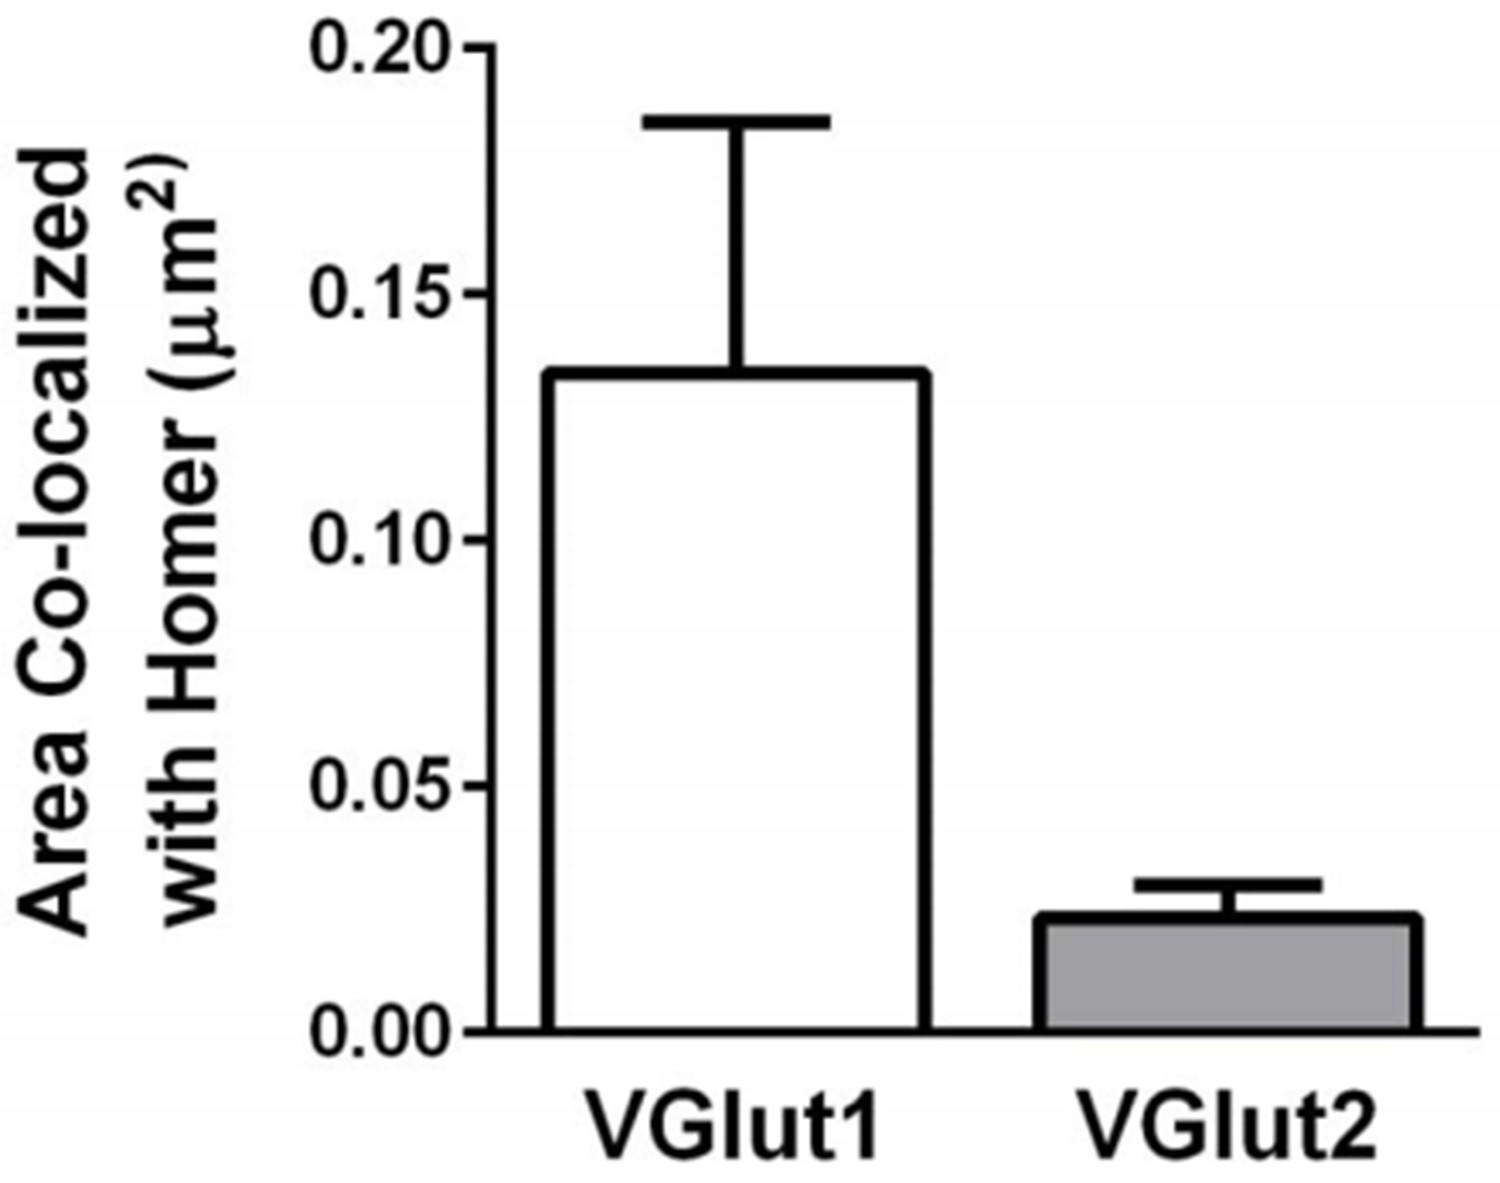
VGlut1-containing synapses are more abundant than VGlut2- containing synapses within the dLGN.
Quantification of the density of VGlut1 or VGlut2 immunoreactive puncta colocalized with Homer. Data were collected from 4-5 P60 wild-type mice. Error bars represent ± SEM.
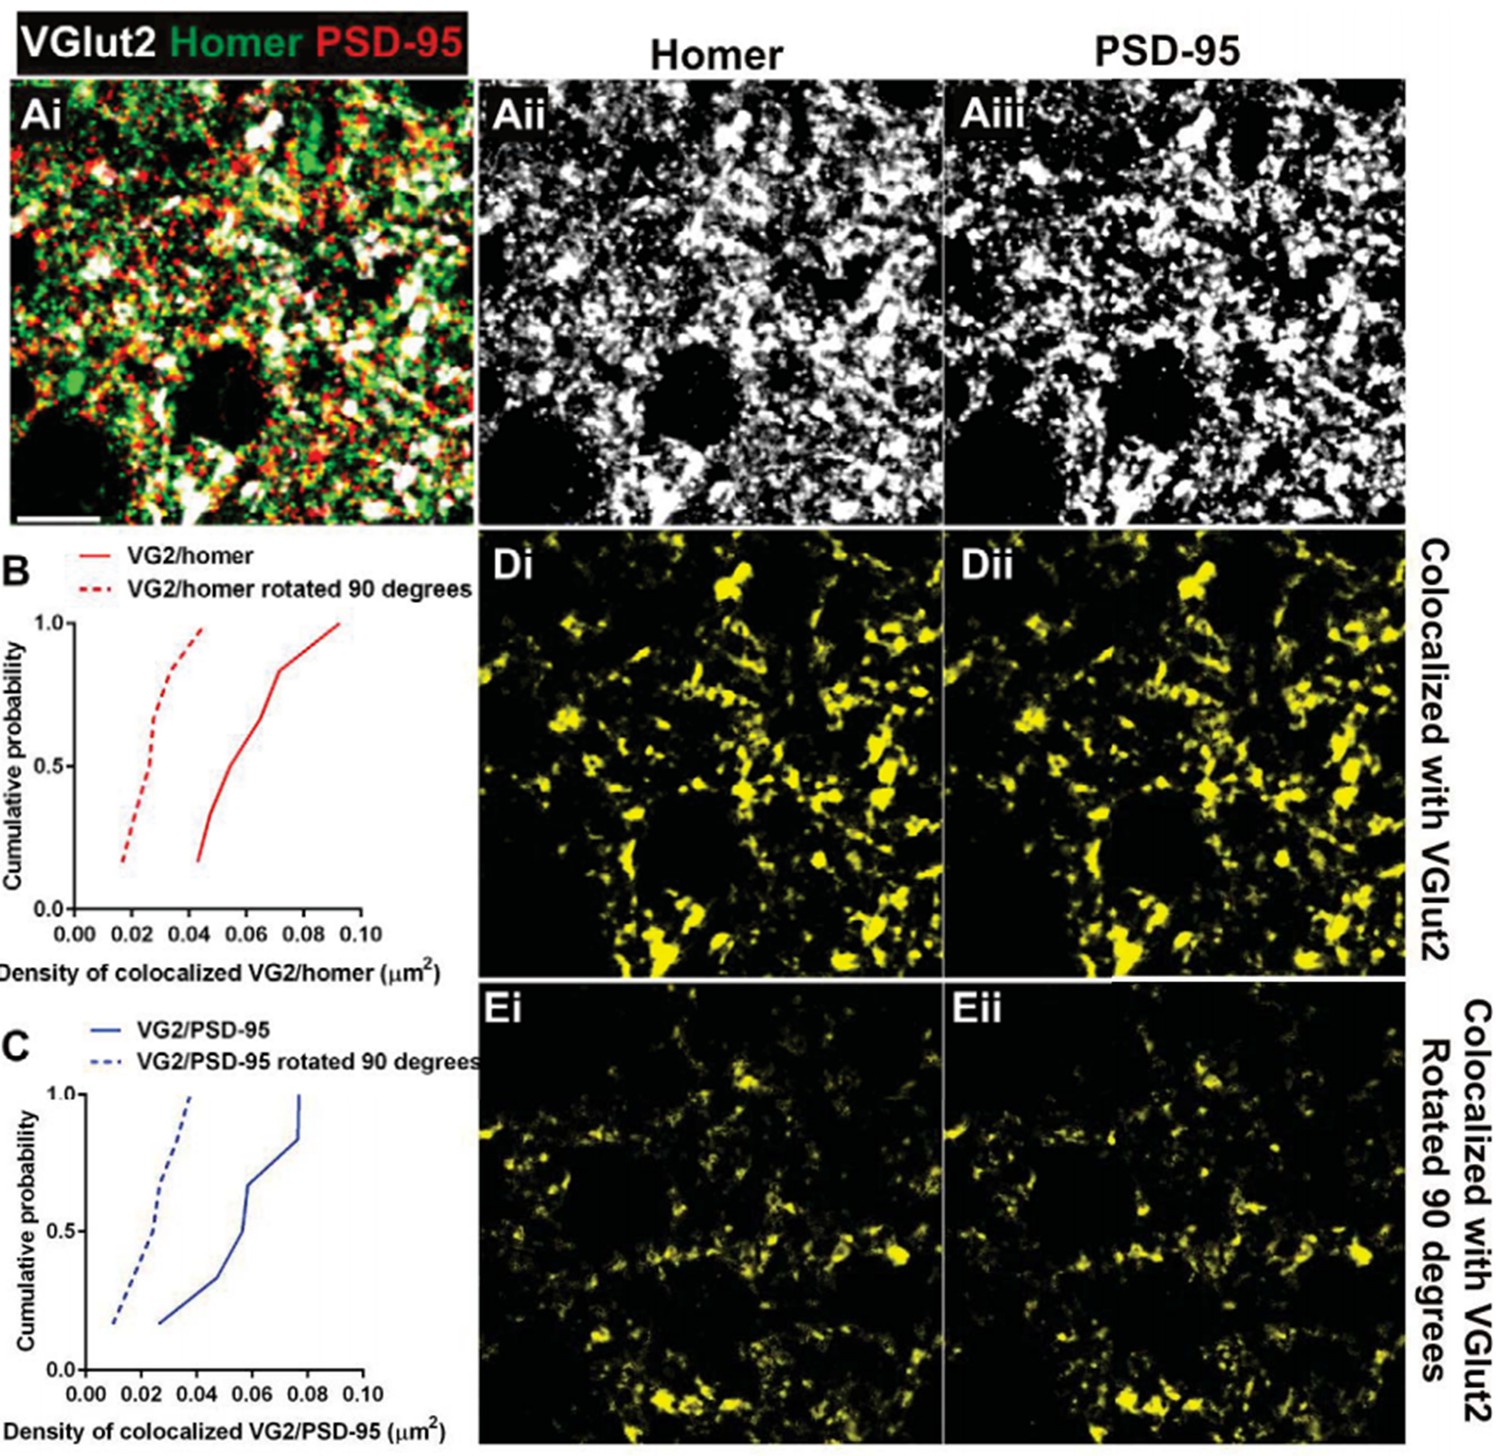
Author response image 3
Postsynaptic proteins colocalize with VGlut2 more frequently over chance.
(A) Single plane of a confocal z-stack in the adult wild-type dLGN immunostained with anti-VGlut2 (white), anti-Homer (green, Aii), and anti-PSD-95 (red, Aiii). Scale bar=10 µm. (B–C) Cumulative probability of co-localized Homer (B) or PSD- 95 (C) with VGlut2 before (solid line) or after 90 degree rotation (dashed line) of the VGlut2 channel. Colocalization of both postsynaptic proteins is more probable over chance (90 degree rotation). Data were collected and averaged across 3 adult wild- type animals (2 single plane images from the same region were collected and analyzed for each animal). D.Result of colocalization analysis between VGlut2 and Homer (Di) and VGlut2 and PSD-95 (Dii). Result of colocalization upon 90 degree rotation of the VGlut2 channel.
Download links
A two-part list of links to download the article, or parts of the article, in various formats.
Downloads (link to download the article as PDF)
Open citations (links to open the citations from this article in various online reference manager services)
Cite this article (links to download the citations from this article in formats compatible with various reference manager tools)
Microglia contribute to circuit defects in Mecp2 null mice independent of microglia-specific loss of Mecp2 expression
eLife 5:e15224.
https://doi.org/10.7554/eLife.15224


