A hierarchy of timescales explains distinct effects of local inhibition of primary visual cortex and frontal eye fields
- The University of Queensland, Australia
- QIMR Berghofer Medical Research Institute, Australia
- The University of Melbourne, Australia
- Metro North Mental Health Service, Australia
- School of Psychology, The University of Queensland, Australia
Figures
Figure 1 with 1 supplement

Schematic representation of the experimental protocol.
Participants initially underwent a high-resolution structural MR scan, which was used to define subject-specific coordinates for subsequent sites of TMS (see Materials and methods for further detail). In Experimental Session 1 and Experimental Session 2, participants undertook 12 min of resting-state functional magnetic resonance imaging (rsfMRI) immediately before and after inhibitory theta-burst stimulation (Huang et al., 2005) was applied to one of the two right hemisphere sites (occipital pole or frontal eye fields). All participants underwent stimulation of each of the two target sites across separate sessions. For safety reasons and to avoid carry-over effects of TMS across sessions, Experimental Sessions 1 and 2 were conducted on different days, separated by at least one week, but no more than three weeks (Huang et al., 2005). The order of stimulation of the two cortical sites was counterbalanced across participants. Abbreviations: T1= structural scan; TMS = transcranial magnetic stimulation.
Figure 1—figure supplement 1
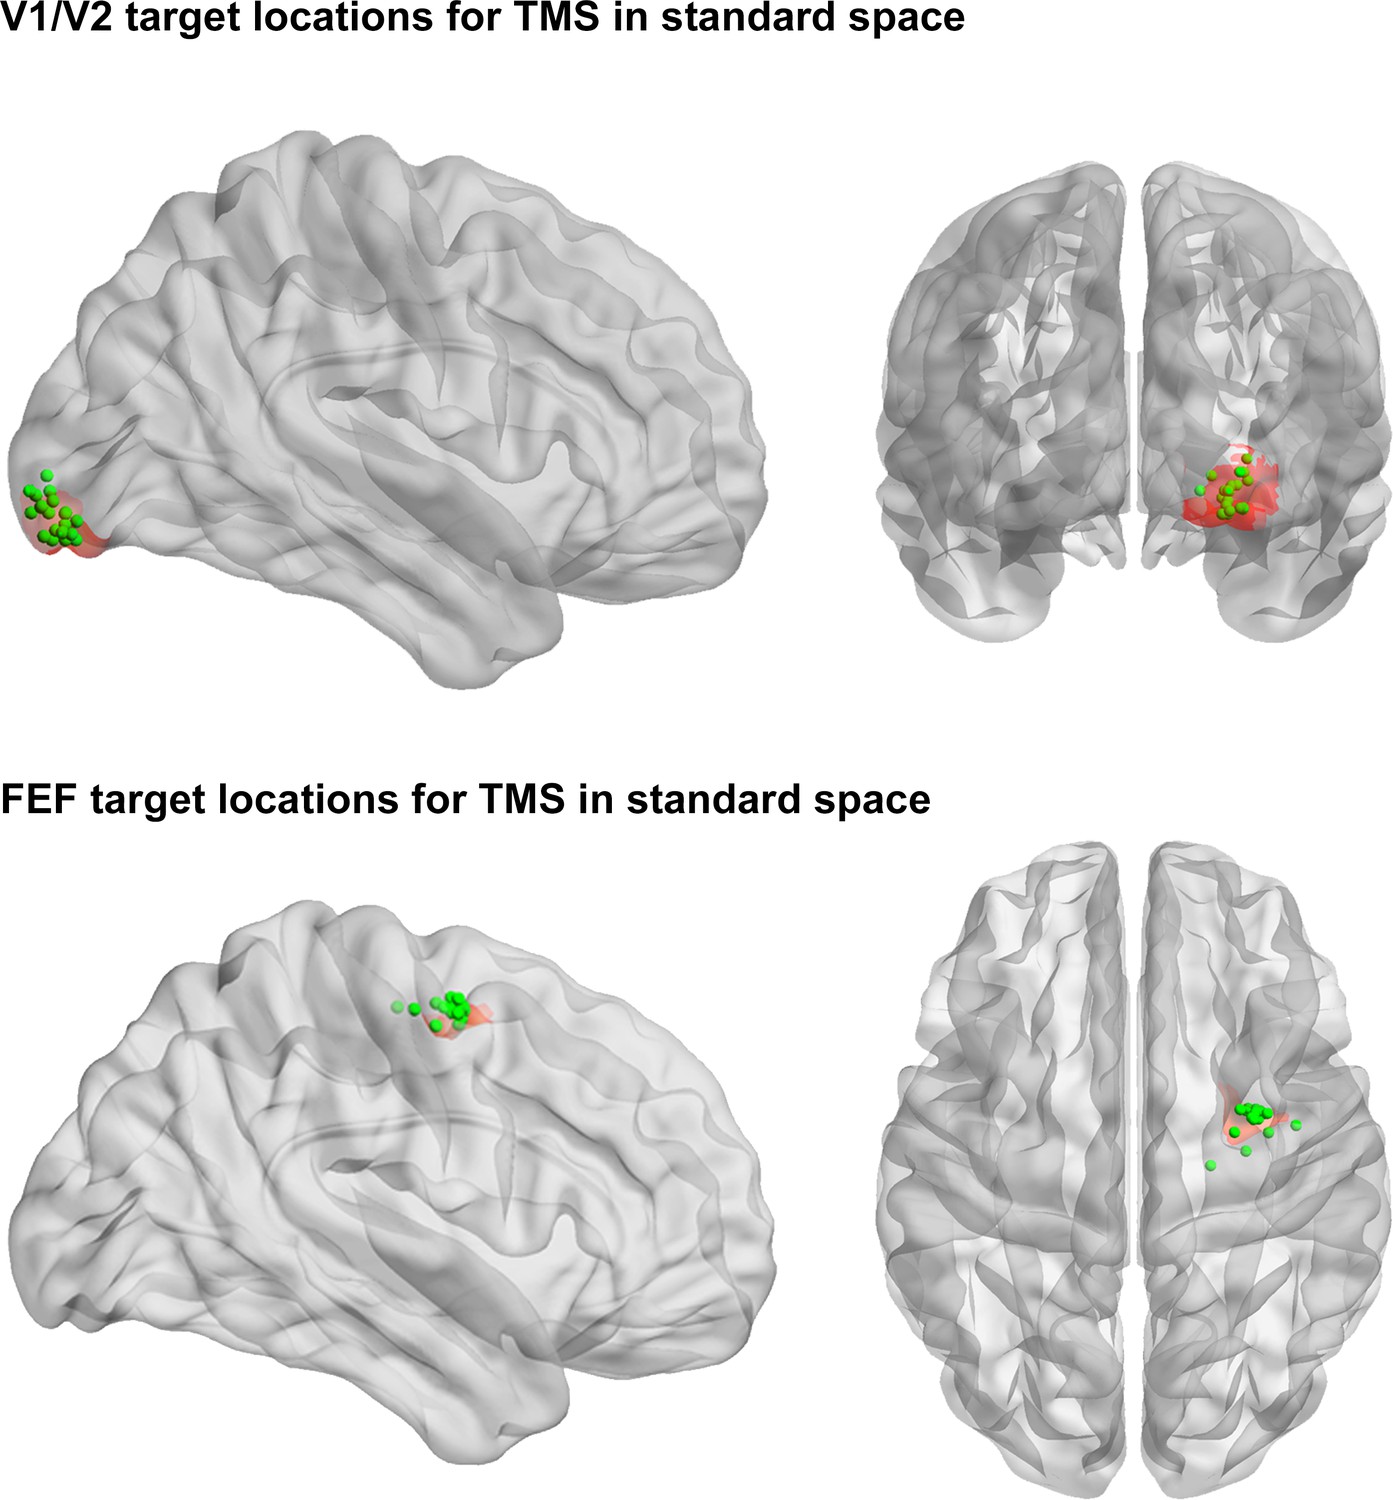
TMS target locations.
Green dots show centroids of TMS coil position for each participant in standard space. Red shading shows the 7.5 mm radius seed region used in the main analyses. Note that key results were replicated using larger seed regions (i.e., 10 mm and 15 mm radii).
Figure 2 with 2 supplements
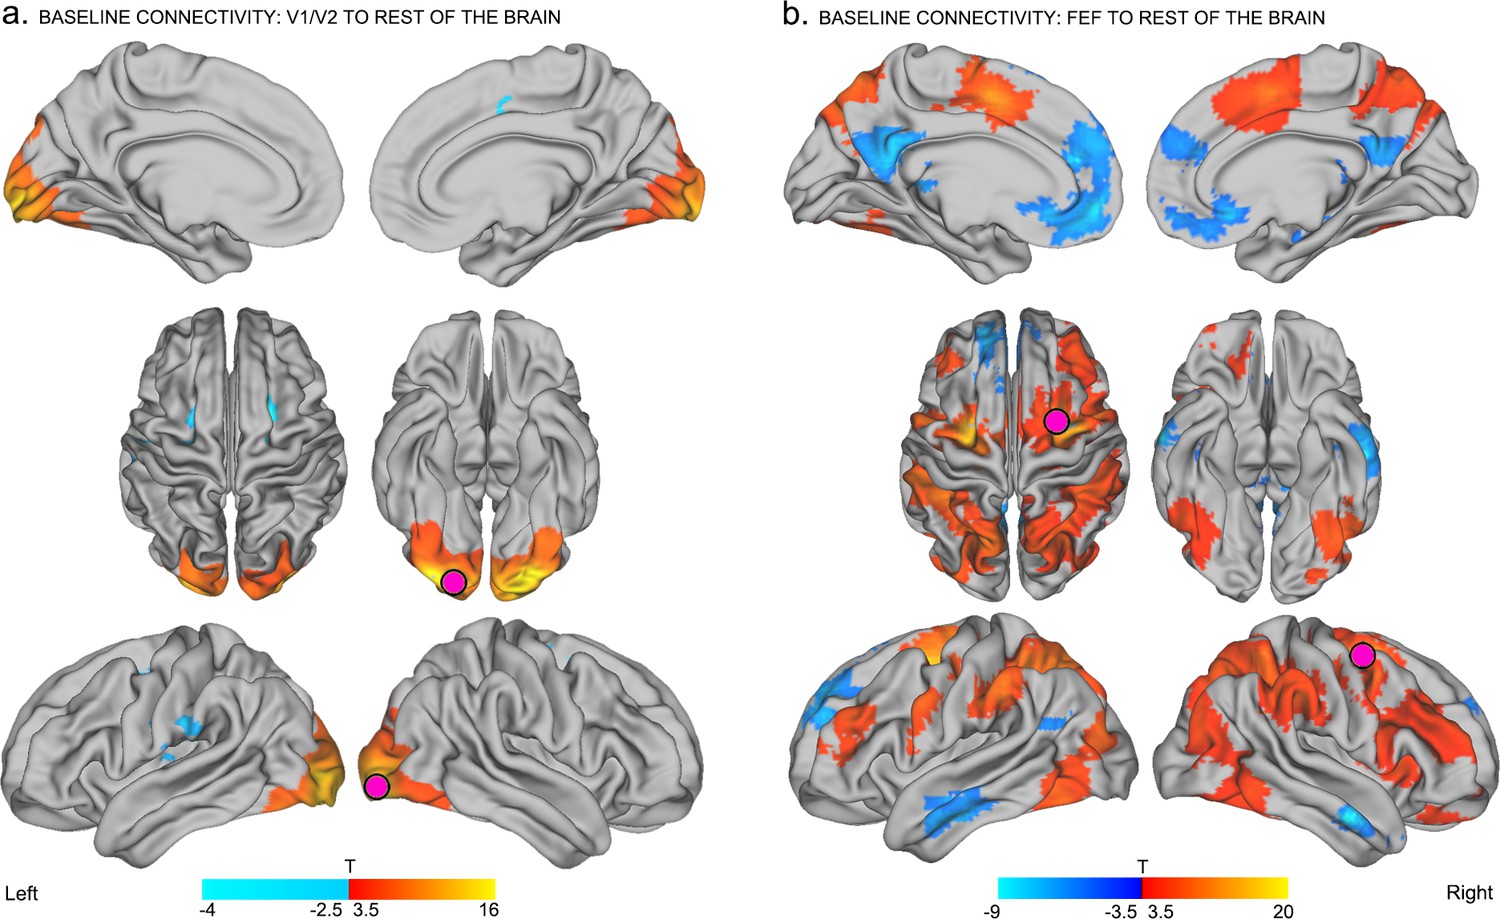
Baseline connectivity between TMS-targeted regions and the rest of the brain before stimulation.
(a) Regions with higher functional connectivity with early visual cortex at the right occipital pole (site of subsequent inhibitory TMS) in the baseline resting-state (i.e., before TMS). At baseline, activity in the frontal eye fields (FEF), left supramarginal gyrus, left inferior postcentral gyrus, and left insula was anticorrelated with activity in right early visual cortex (corresponding to the to-be-targeted region of the occipital pole; pink circle). (b) Regions with positive (red – yellow) and negative (blue – light blue) functional connectivity with the right FEF at baseline. The right FEF showed a diffuse pattern of connectivity encompassing frontal, parietal, and temporal cortical areas. Regions known to be part of the default-mode network (medial prefrontal cortex, posterior cingulate, angular gyrus, and medial temporal gyrus) were significantly anticorrelated with the right FEF at baseline. All results are p<0.05 FWE corrected at cluster level.
Figure 2—figure supplement 1
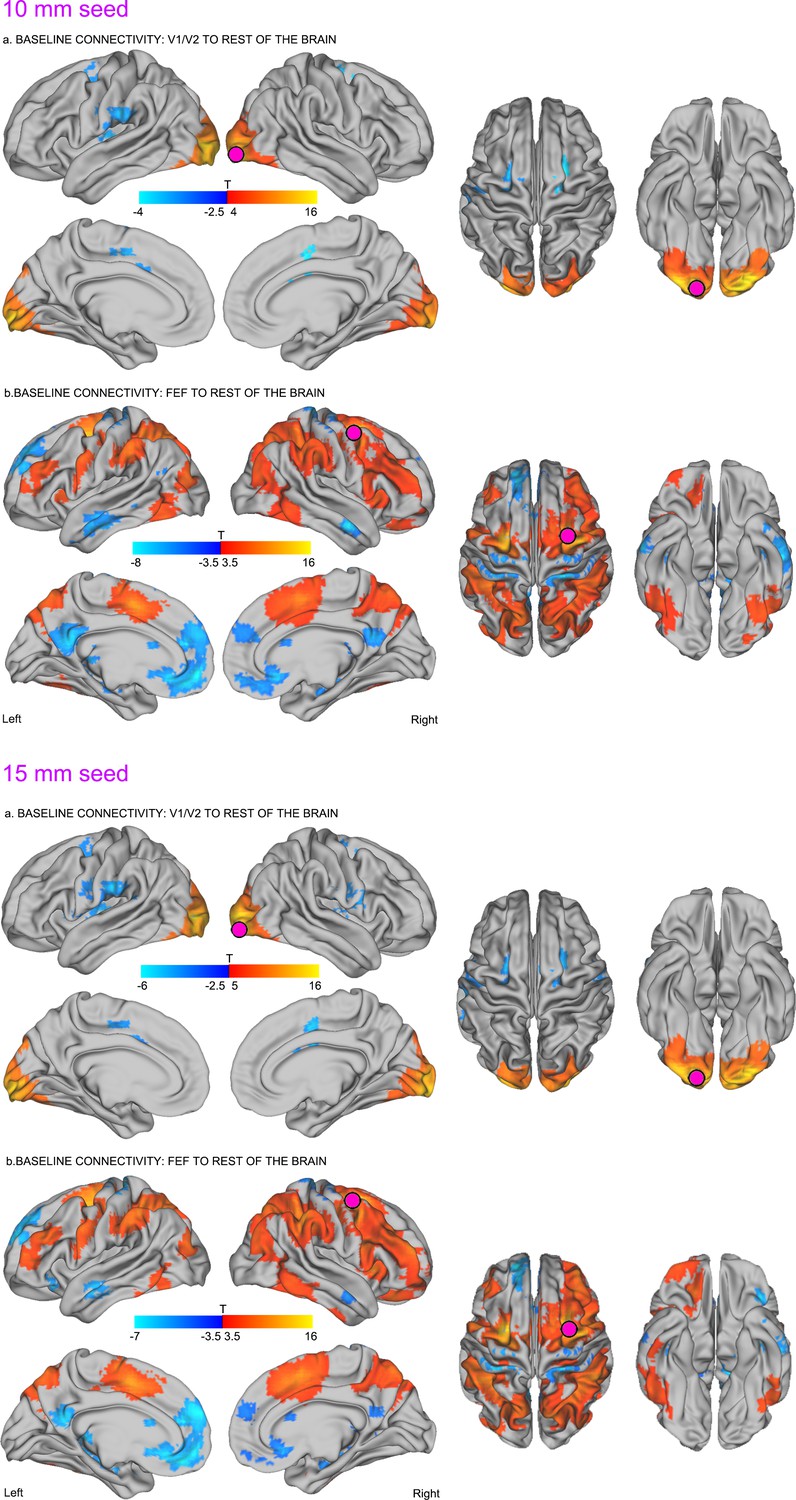
Effects of seed ROI size on baseline connectivity between TMS-targeted regions and the rest of the brain before stimulation.
https://doi.org/10.7554/eLife.15252.006
Figure 2—figure supplement 2
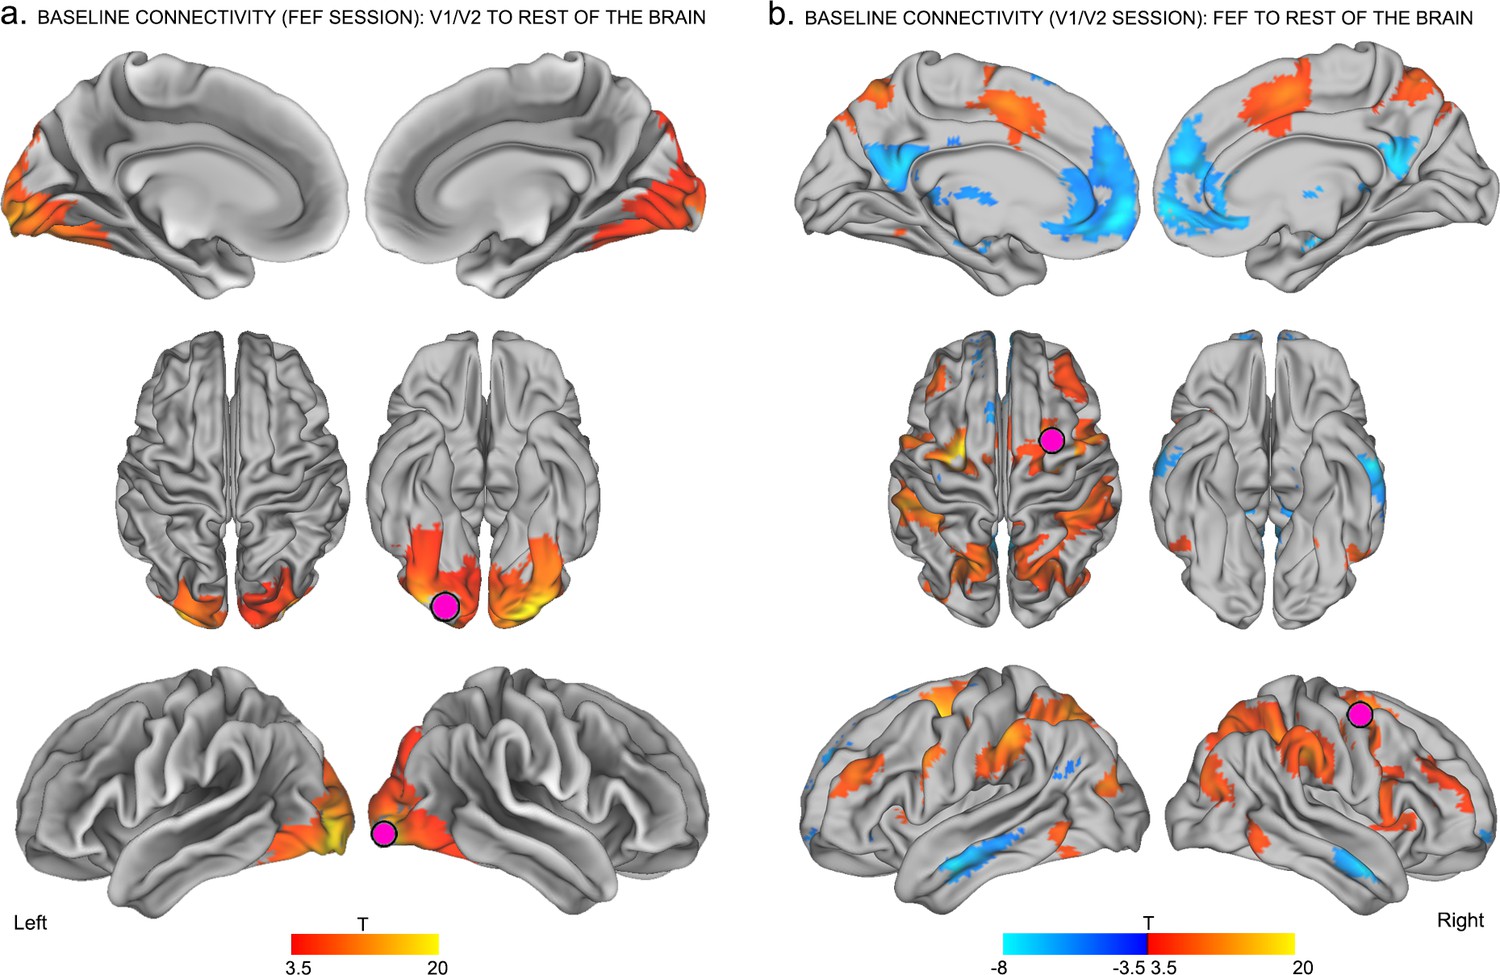
Control analyses on baseline connectivity between TMS-targeted regions and the rest of the brain.
Seed to voxel connectivity was performed using baseline images from the other experimental session (i.e., V1/V2 seed on FEF baseline data and vice versa).
Figure 3 with 5 supplements
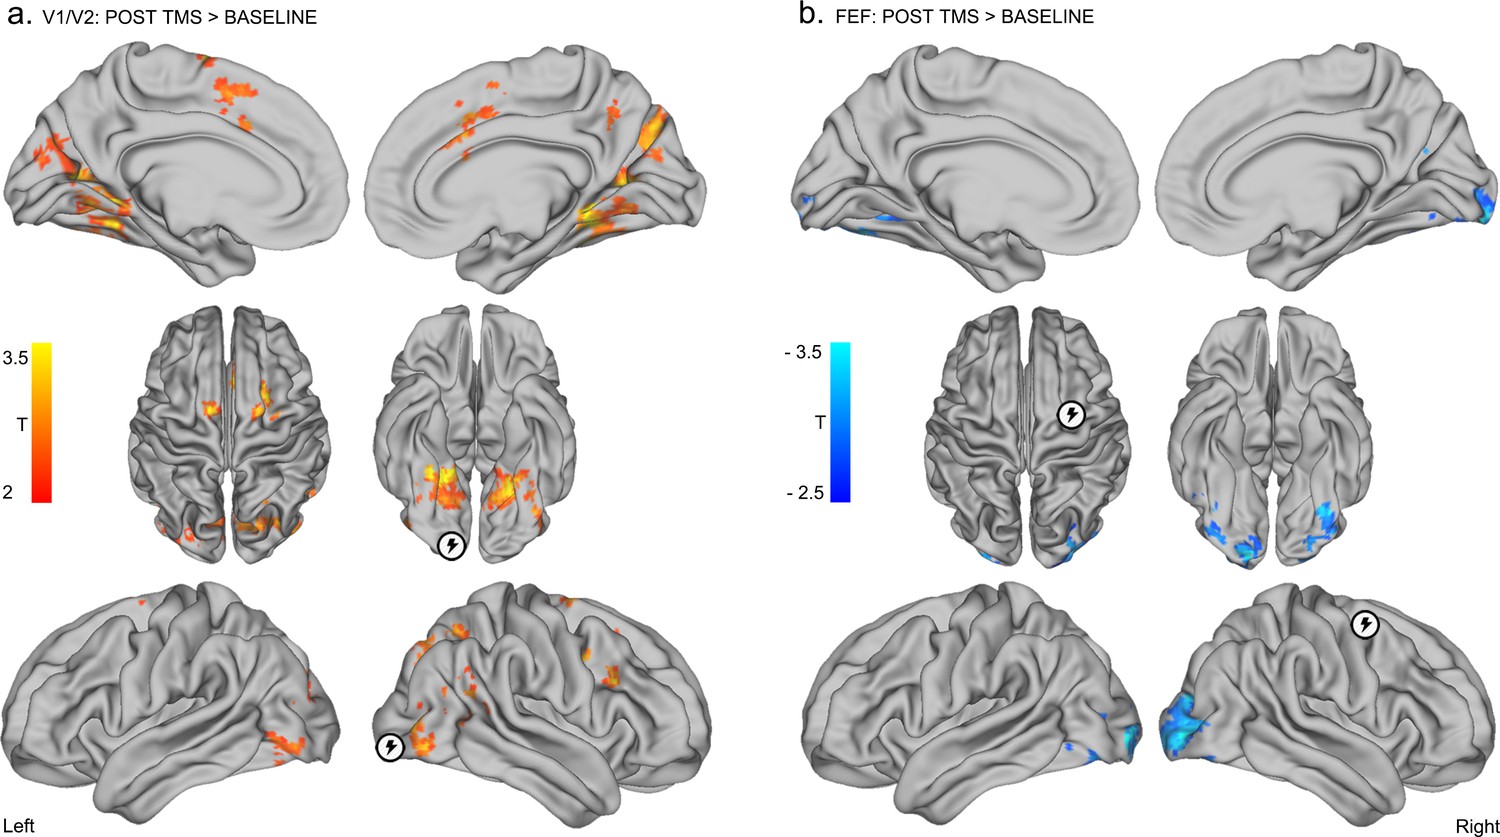
Distinct effects of local inhibitory TMS over early visual cortex and FEF.
(a) Inhibitory TMS of early visual cortex (right occipital pole; encircled lightning symbol) was associated with the emergence of positive correlations between BOLD signals in V1/V2 and bilateral FEF, and the emergence/increase of positive correlations between the V1/V2 seed region and bilateral occipital and parietal cortices (see Supplementary file 1 and 2 for details, p<0.05 FWE corrected at cluster level). (b) Inhibitory TMS of the right FEF (encircled lightning symbol) resulted in the reduction of positive correlations between this target region and bilateral occipital visual areas (p<0.05 FWE corrected at cluster level).
Figure 3—figure supplement 1
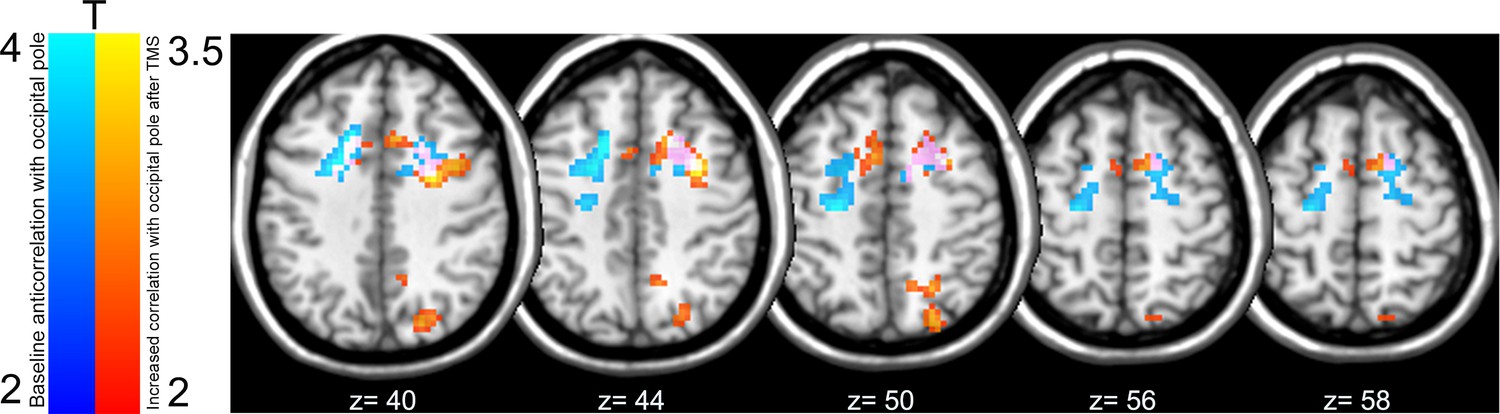
Overlap of baseline and post-TMS connectivity between the early visual cortex seed and FEF, bilaterally.
Analysis revealed frontal regions that were anti-correlated with BOLD signal activity in the right occipital pole at baseline (illustrated in blue), regions that increased their connectivity (i.e., emergence of positive correlations) with right early visual cortex following inhibitory TMS (red-orange), and regions that were both anti-correlated with the right occipital pole and increased their functional connectivity with this region following TMS (pink). Note that the FEF cluster showing positive correlations with V1/V2 following V1/V2 stimulation extends slightly inferiorly (up to Z = 36). All p< 0.05 FWE, cluster level.
Figure 3—figure supplement 2
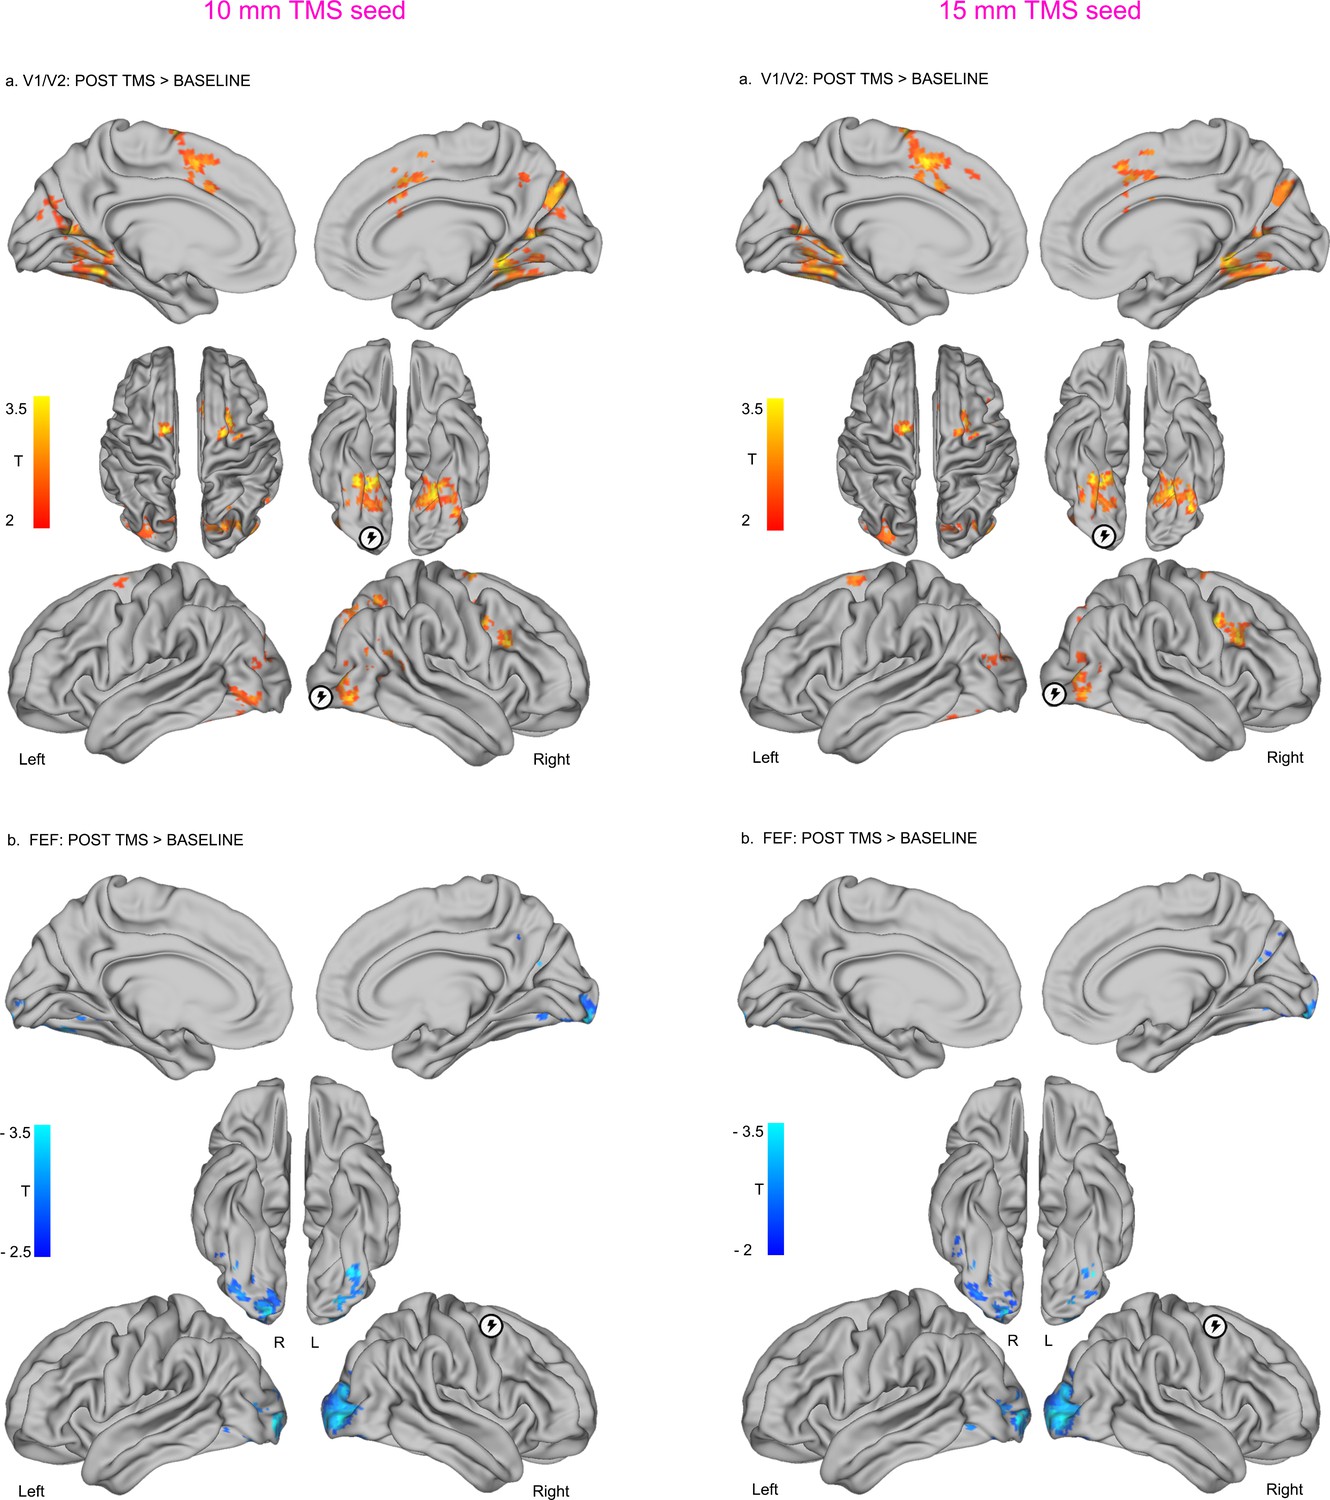
Impact of seed ROI size on effects of local inhibitory TMS over early visual cortex (V1/V2) and FEF.
https://doi.org/10.7554/eLife.15252.010
Figure 3—figure supplement 3
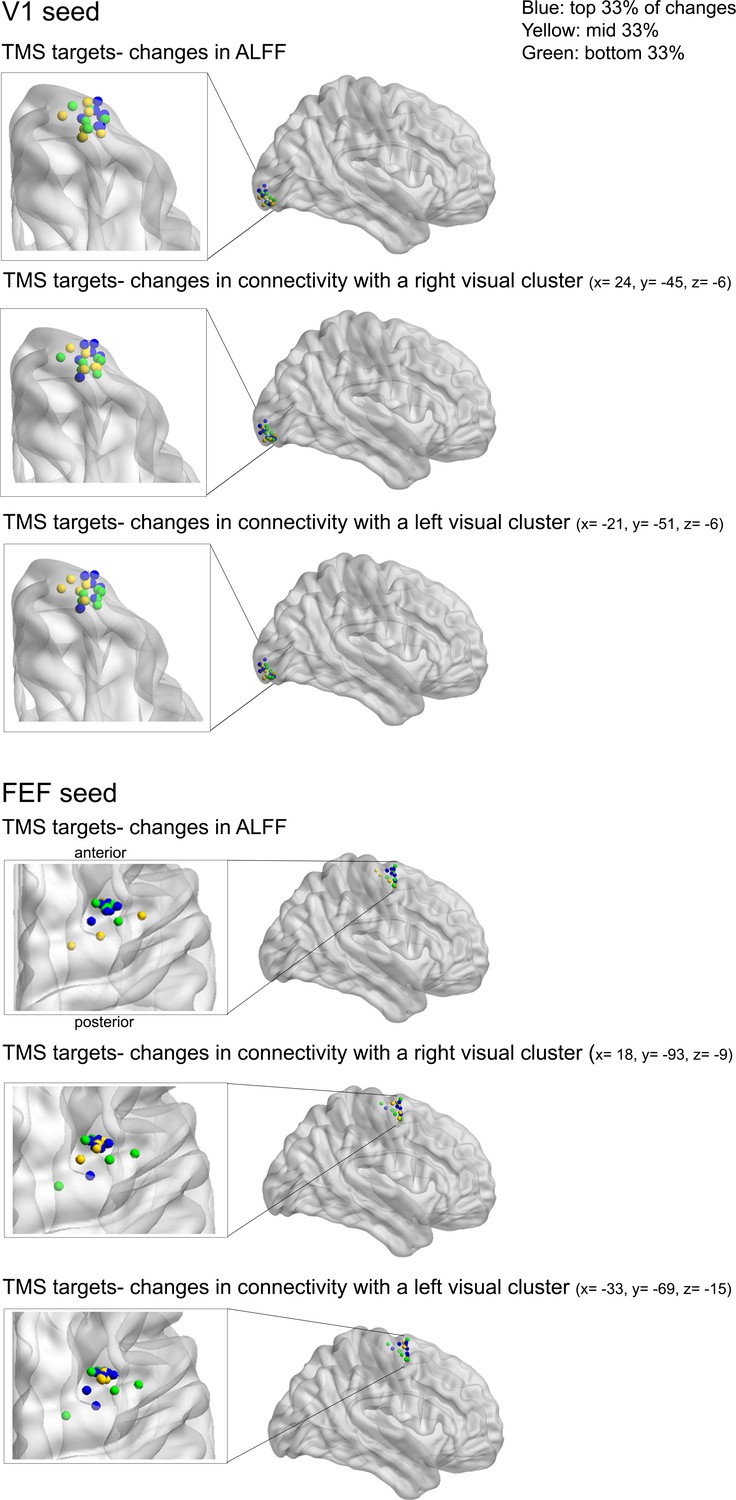
Relationship between TMS sites and changes in brain activity.
Assessment of possible relationships between the locations of TMS target sites, changes in the local amplitude of fluctuations in neural activity (ALFF) and changes in functional connectivity with cortical areas that showed a significant variation in functional connectivity following TMS (Figure 3). Blue spheres represent sites showing the highest changes in ALFF and functional connectivity following TMS (top 33% of changes).
Figure 3—figure supplement 4
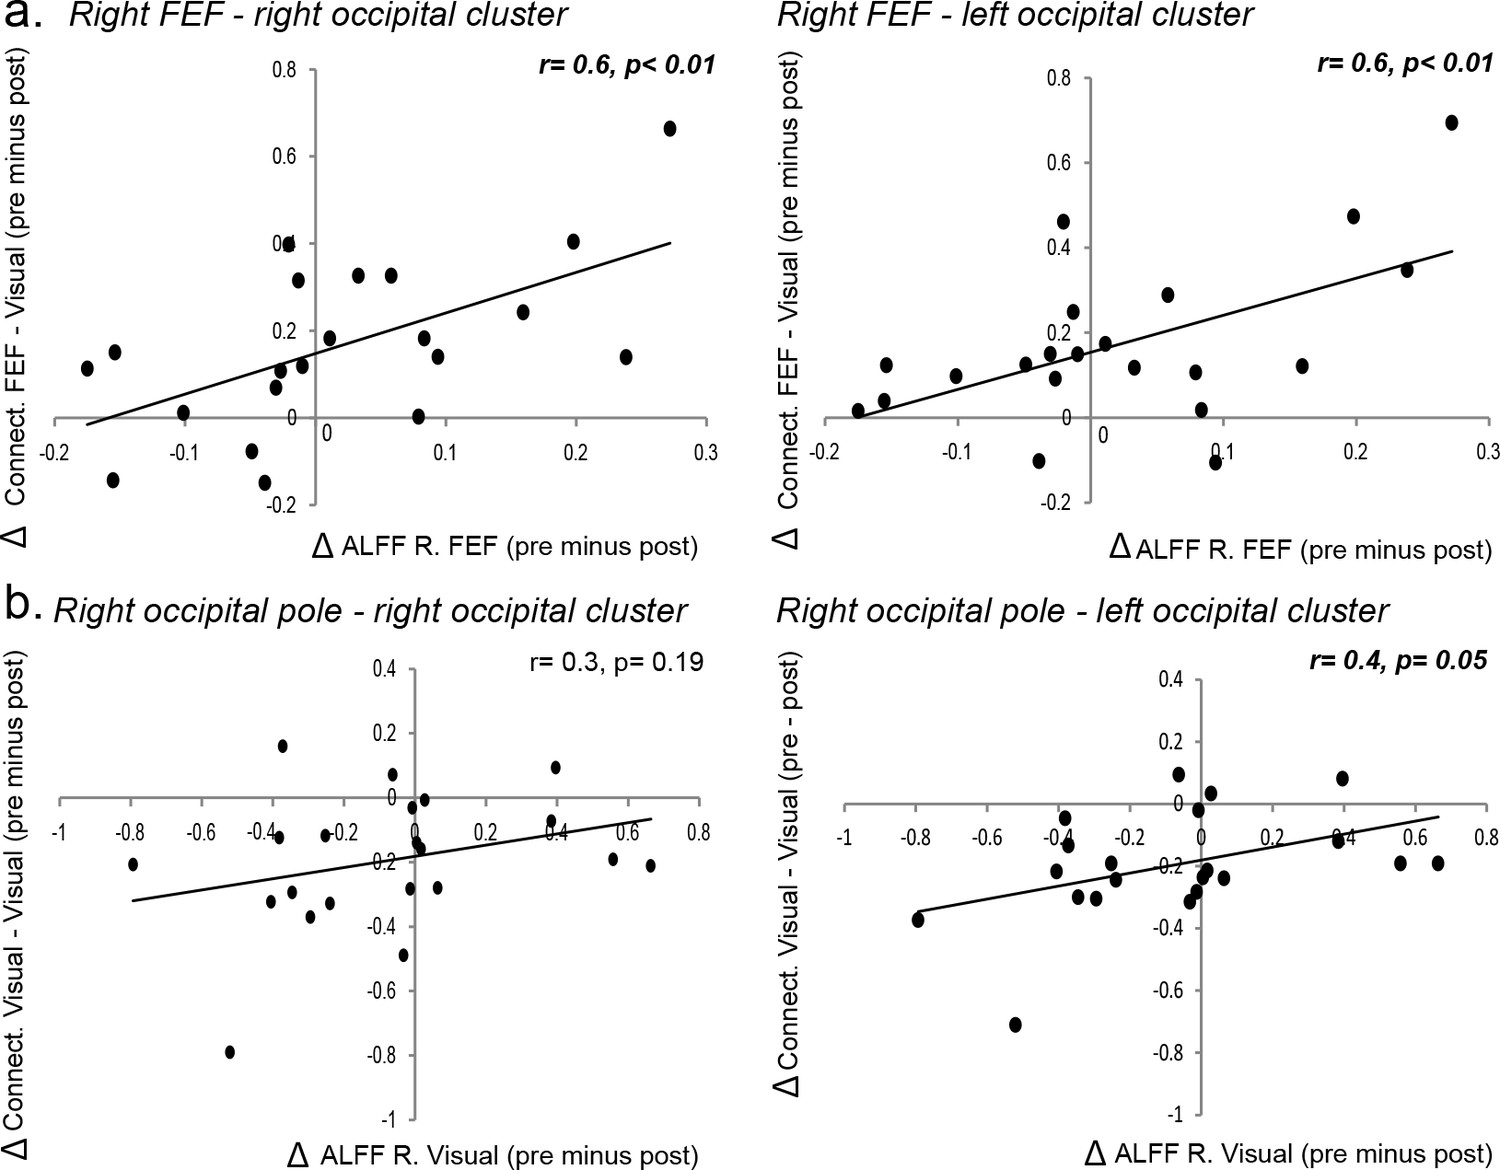
Relationship between local TMS-induced changes in neural activity and widespread modulation of functional connectivity.
The relationship between TMS-induced changes in the local amplitude of slow fluctuations in neural activity (ALFF, 0.01–0.1 Hz) and TMS-induced changes in functional connectivity between the right FEF target site and left/right visual clusters (as shown in Figure 3, details in the Supplementary file 1), respectively. (a) Reduction in ALFF following TMS was associated with greater anticorrelation (i.e., negative functional connectivity) between FEF and early visual cortices. (b) Reduction in ALFF over right early visual cortex following TMS was associated with increased positive functional connectivity between this region and occipito-parietal visual areas.
Figure 3—figure supplement 5
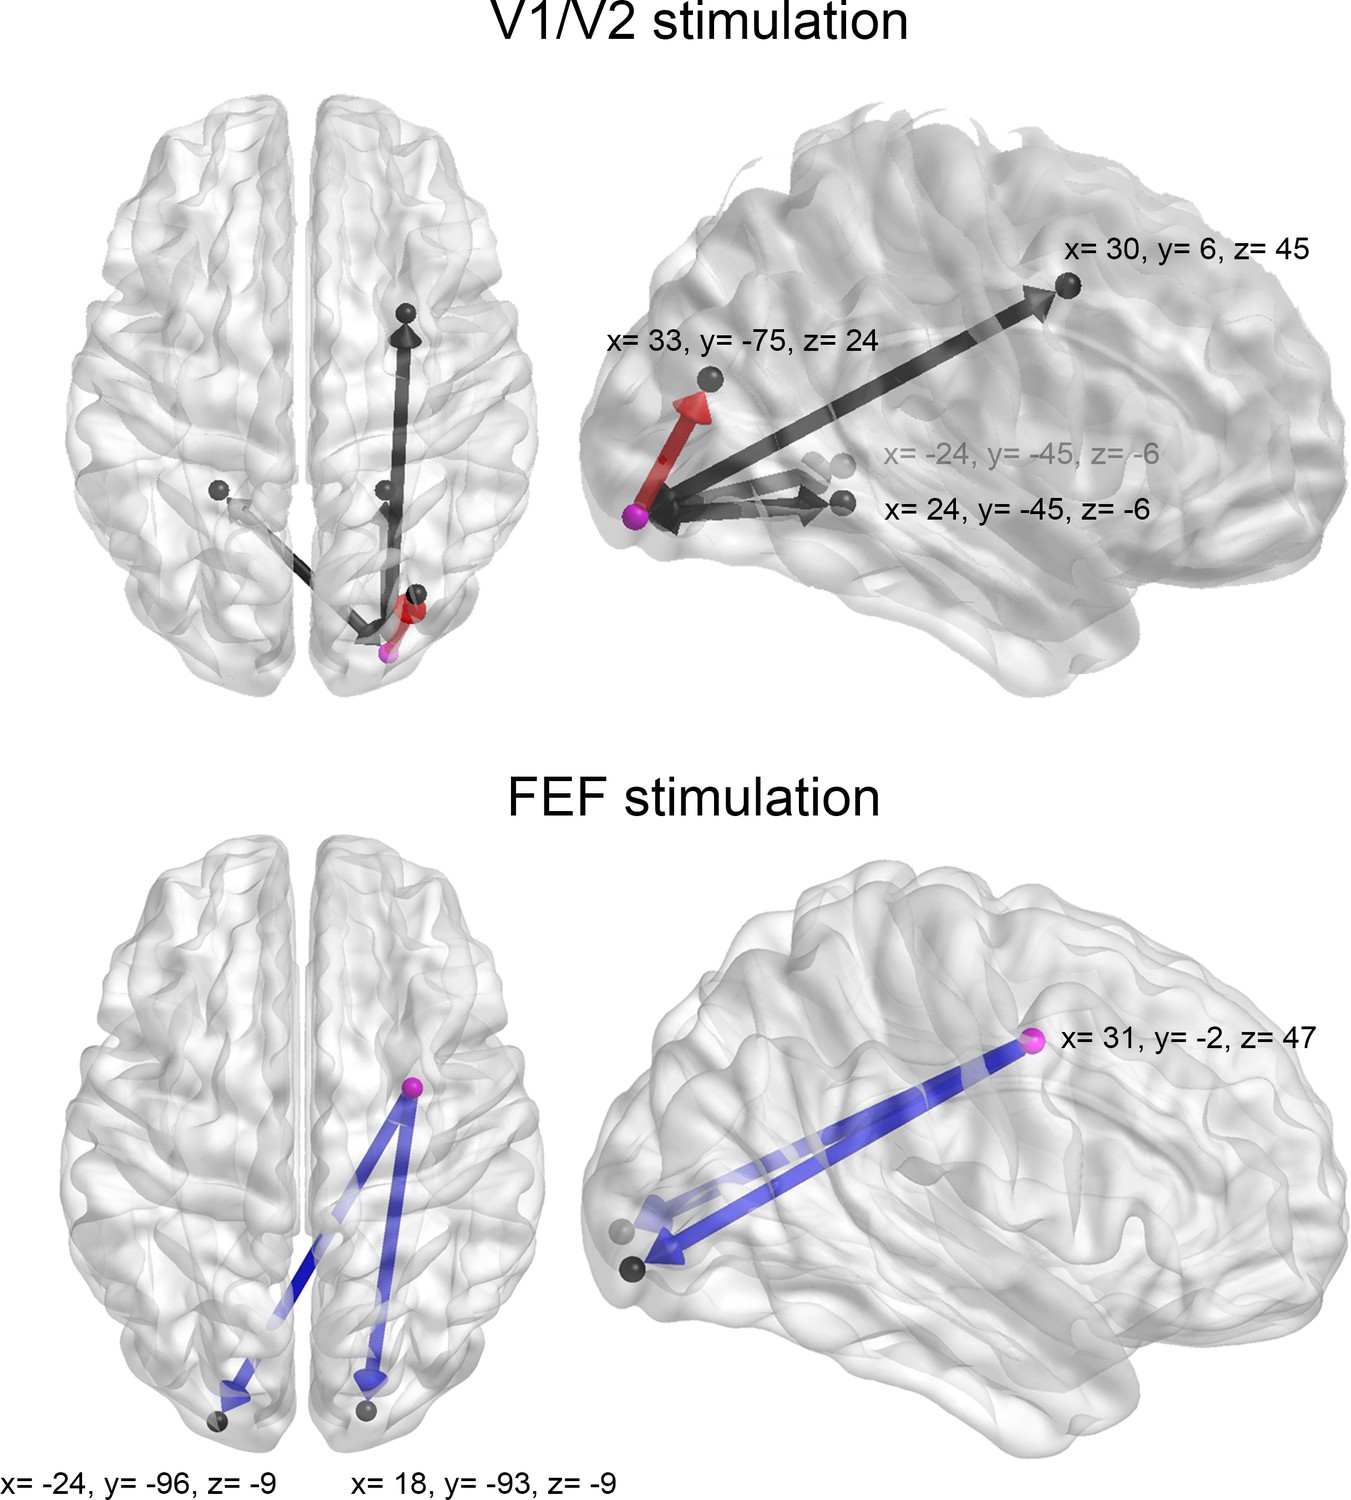
Dynamic Causal Modelling used to determine the direction of changes in functional connectivity following TMS of V1/V2 and FEF.
Each model encompassed bidirectional connections between the TMS target region (i.e., V1/V2 or FEF, purple spheres) and core cortical areas (black spheres) that showed a significant change in functional connectivity following focal inhibitory TMS (Figure 3, details in Supplementary file 1). Each region consisted of a sphere of 7.5 mm of radius centered on the depicted co-ordinates (MNI space). Connections that showed changes in the subject-specific parameters between the pre- and post-TMS sessions are shown in red (feedforward connectivity) and blue (feedback connectivity) (paired t-test, p<0.05).
Figure 4 with 4 supplements
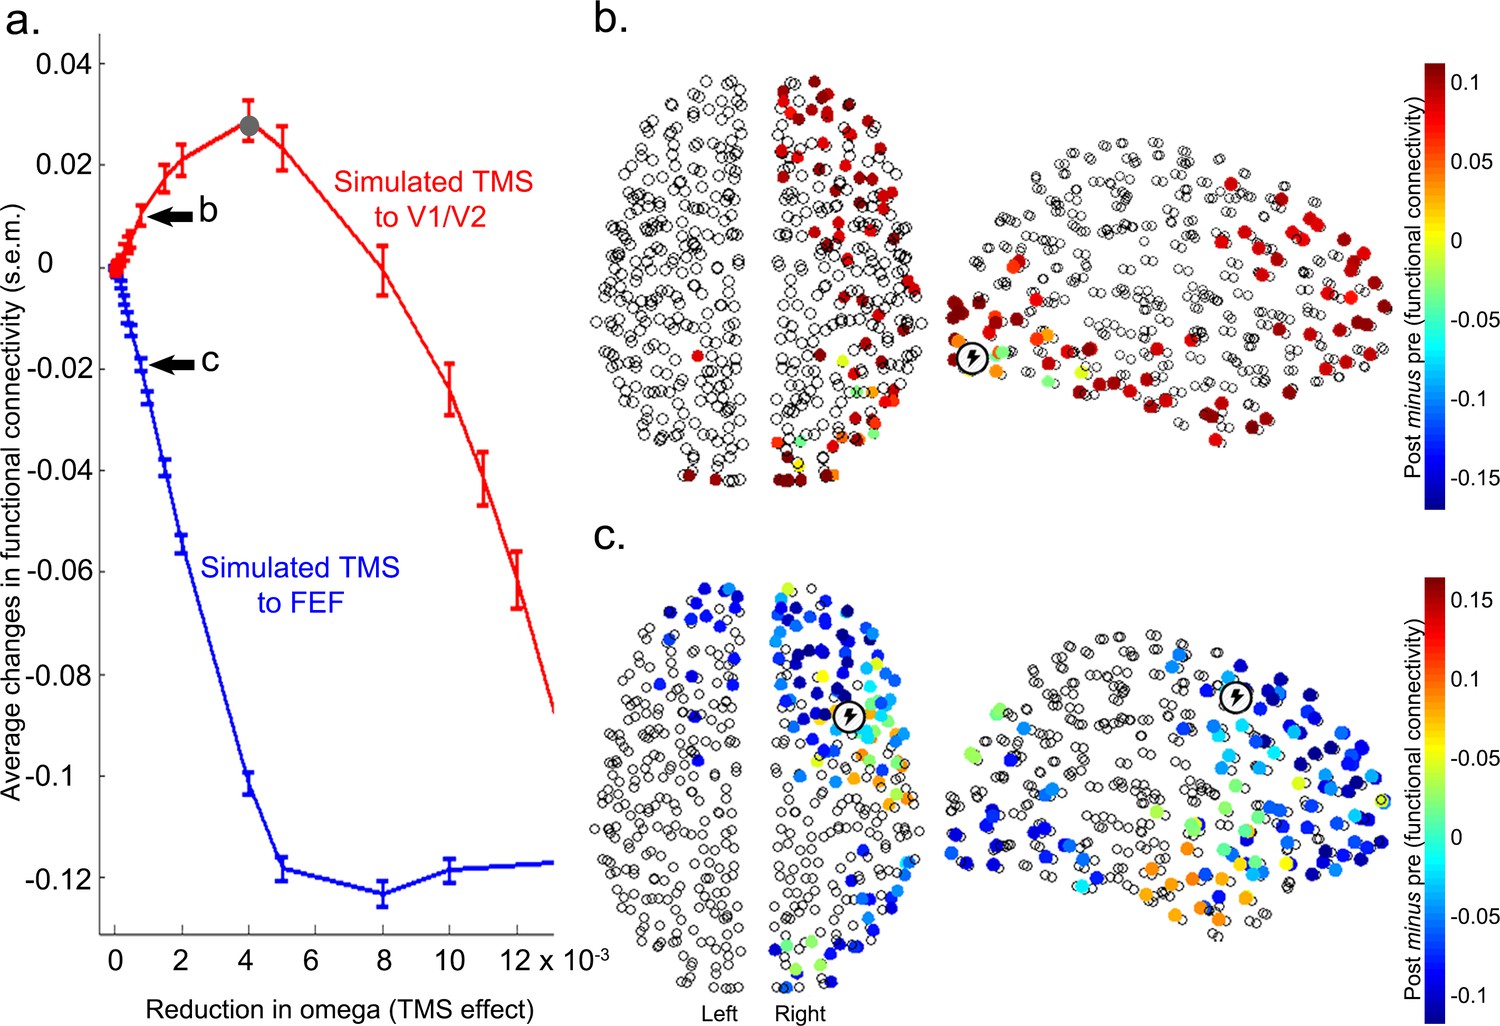
Modelling the effects of local inhibitory TMS on diffuse network connectivity.
(a) In line with the experimental results, computational modelling showed that inhibition of the intrinsic frequencies of V1/V2 and FEF (see Materials and methods) had opposite effects on how these regions were connected with the rest of the brain. Specifically, increasing inhibition of V1/V2 enhanced functional connectivity (i.e., positive correlations) with the rest of the brain until the natural frequency of V1/V2 matched the mean frequency of the whole brain (gray dot). Conversely, inhibition of FEF reduced its positive correlations, or enhanced its anticorrelations, with other brain regions (see also Figure 4—figure supplement 1). s.e.m.= standard error of the mean. (b) Following a reduction in its natural frequency, V1/V2 significantly increased its connectivity with other cortical regions comprising occipito-temporal and frontal areas (including FEF; Wilcoxon signed-rank test Bonferroni corrected for multiple comparisons, p<2 x 10⁻⁶). (c) A significant reduction in correlations and increase in anticorrelations between FEF and surrounding frontal areas, as well as visual occipito-temporal areas, was observed after slowing of the natural frequency of FEF (Wilcoxon signed-rank test, p<2 x 10⁻⁶). The reduction in omega for panels (b) and (c) was 0.0008.
Figure 4—figure supplement 1
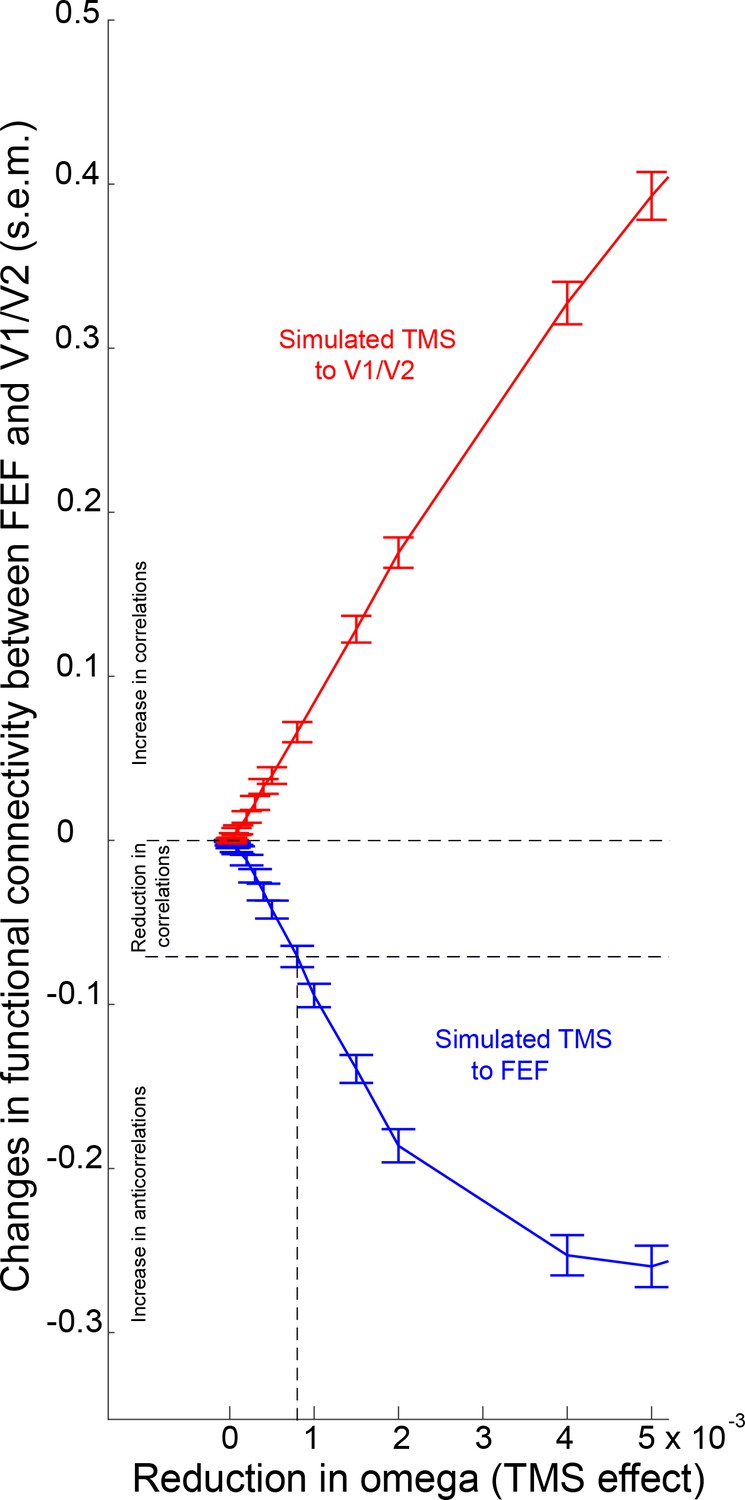
Effects of virtual inhibitory TMS on simulated functional connectivity between FEF and V1/V2.
The figure shows that virtual inhibition of V1/V2 (reduction in omega) results in increased functional connectivity between this area and FEF (red line). By contrast, reductions in omega greater than 0.0008 result in the emergence of anticorrelations between the two regions of interest (FEF and V1/V2; blue line).
Figure 4—figure supplement 2
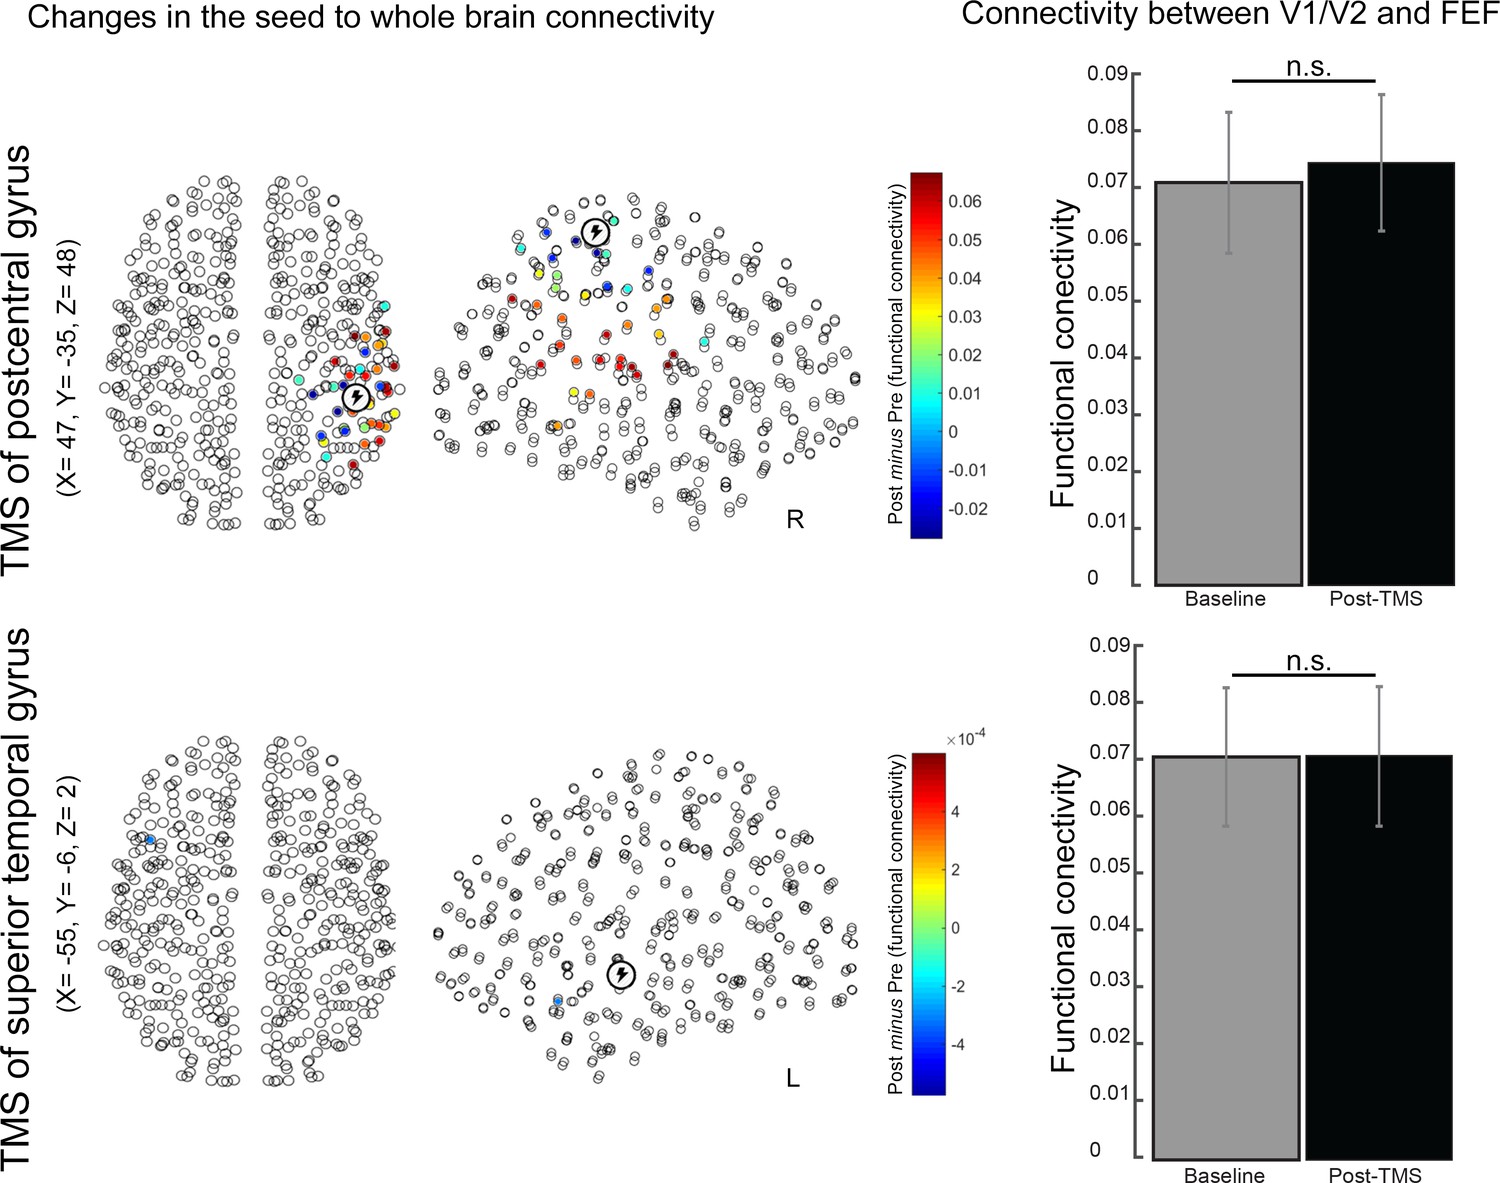
Effects of simulated TMS over two control regions - right postcentral gyrus (part of the sensorimotor network) and left superior temporal gyrus (part of the auditory network) – on functional connectivity.
Simulated inhibition of the right postcentral gyrus caused significant changes in connectivity with ipsilateral parietal and frontal regions. Conversely, inhibition of the left superior temporal gyrus caused a specific change in connectivity between this region and a region in the left temporal pole. Notably, functional connectivity between V1/V2 and FEF was not modulated following simulated inhibition of either of the two control sites (bar charts in the right panels).
Figure 4—figure supplement 3
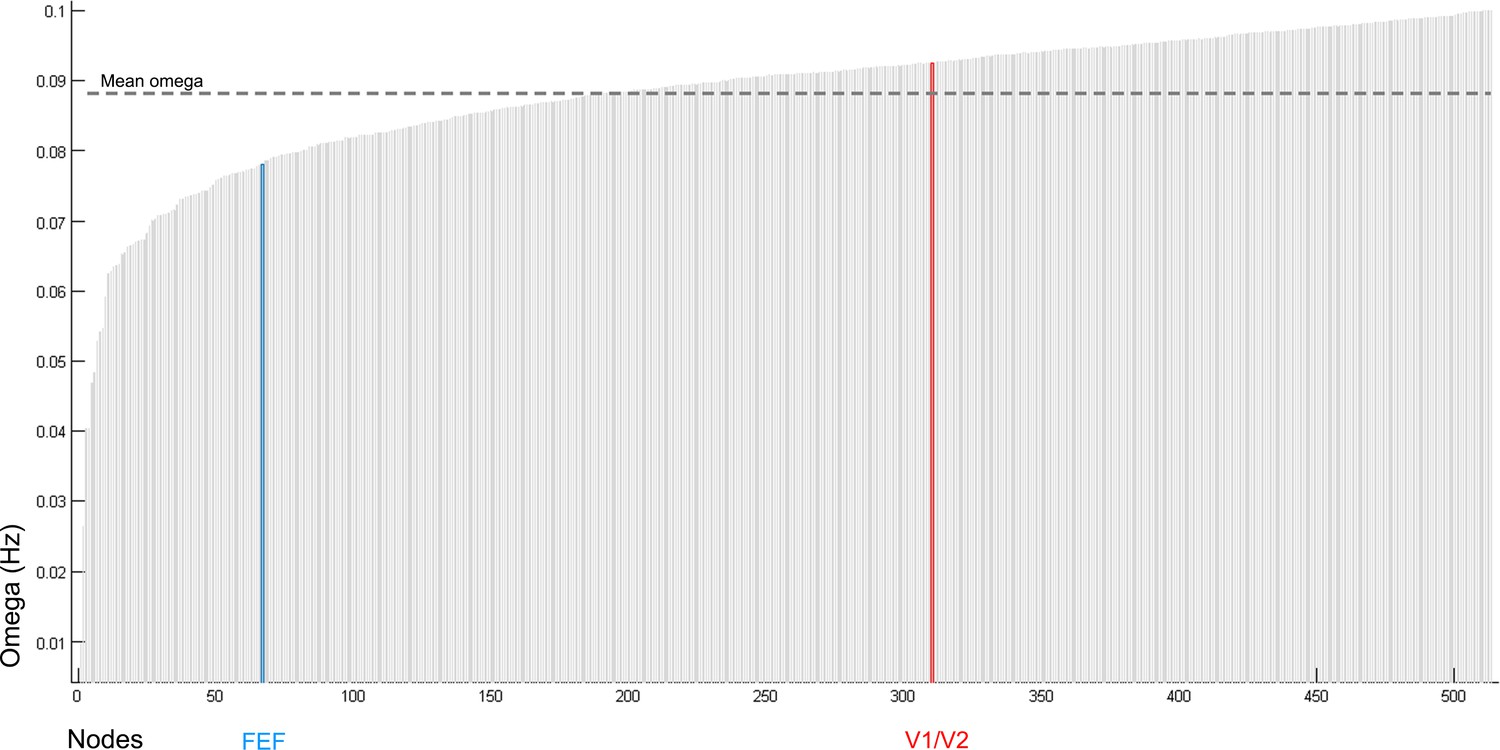
Baseline distribution of natural frequencies (omega) in the 513 nodes.
The x-axis represents the 513 nodes comprising the adopted brain parcellation. Baseline (i.e., pre-stimulation) values of omega (natural frequency expressed in Hz) are presented on the y-axis. Note that at baseline the natural frequency of FEF is slower than the natural frequency of V1/V2. Likewise, the value of omega for FEF is below the global mean whereas that for V1/V2 is above the global mean.
Figure 4—figure supplement 4
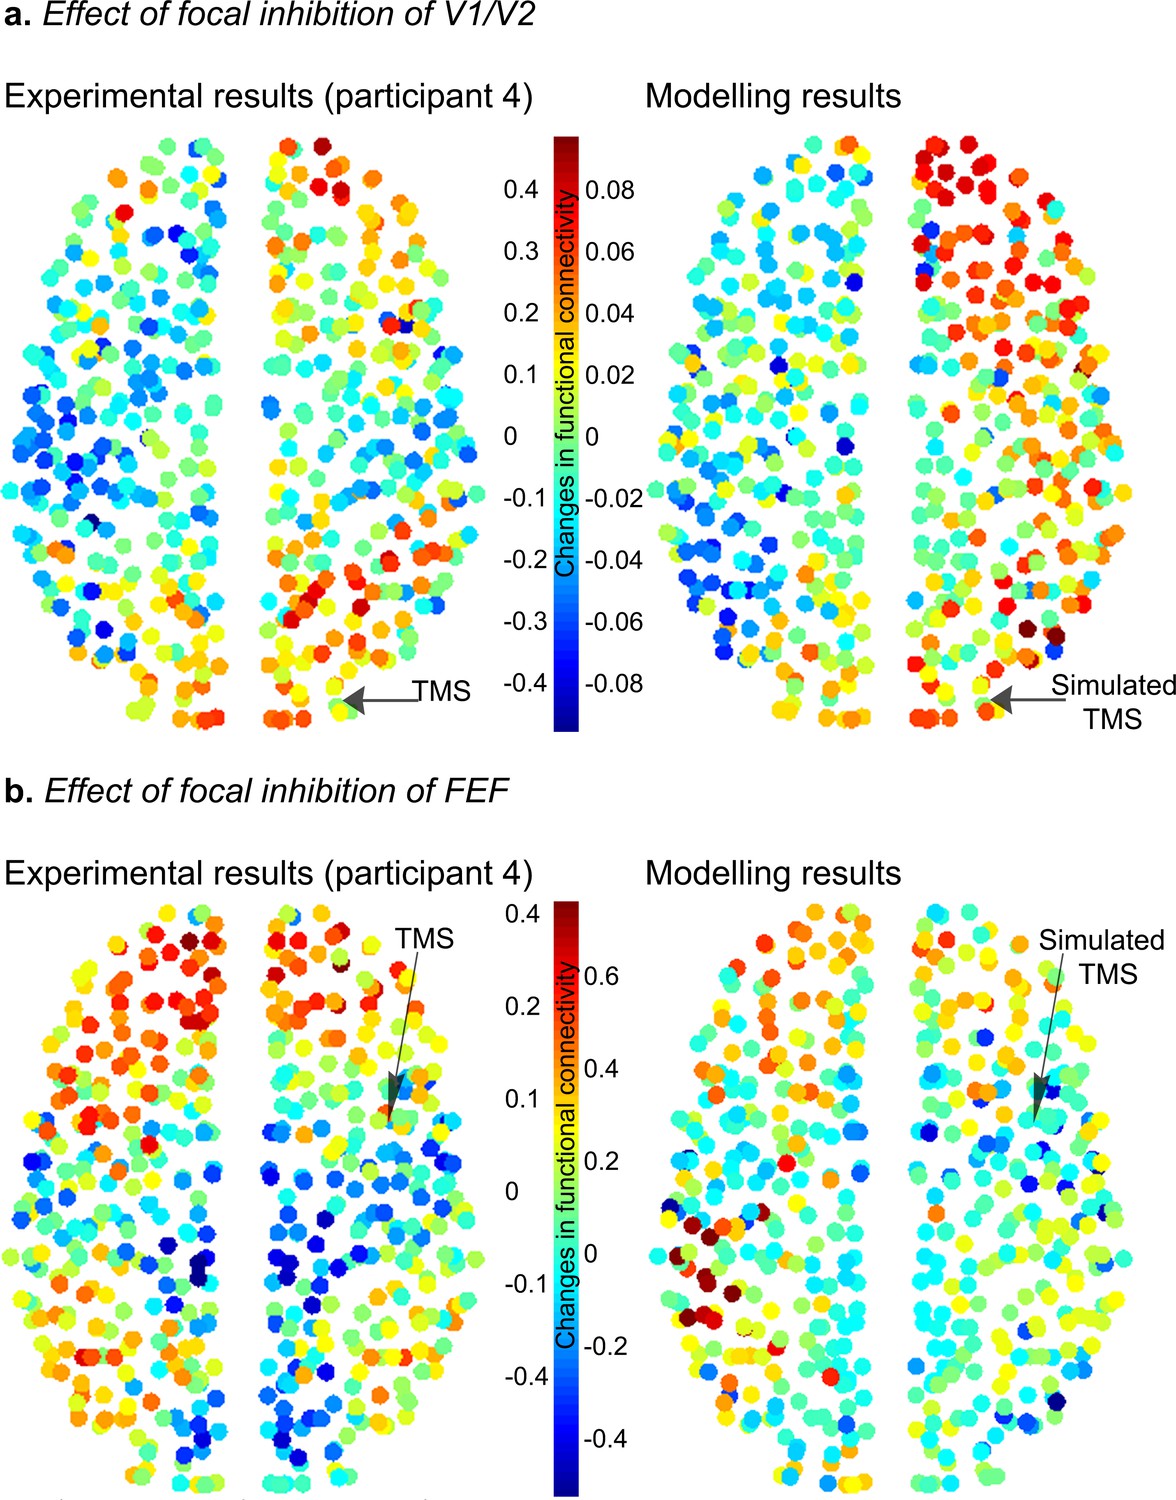
Effects of local inhibition on actual and simulated functional connectivity between the target region (V1/V2 or FEF) and the rest of the brain.
(a) Actual and simulated effects of stimulation of V1/V2. (b) Actual and simulated effects of stimulation of FEF. Raw (i.e., unthresholded) results are shown. Experimental results (left side of the figure) were generated using data from one participant who showed a consistent decrease in local BOLD signal amplitude (ALFF; see Results and Materials and methods) following TMS of V1/V2 and FEF. The simulation illustrates a representative trial. Overall, the figure shows that the model reproduces the spatial structure of the global changes in functional connectivity induced by local TMS. The reduction in omega for panel a was 0.0003 and for panel b was 0.0005.
Additional files
-
Supplementary file 1
Changes in TMS-targets to whole brain connectivity.
- https://doi.org/10.7554/eLife.15252.019
-
Supplementary file 2
Direction of changes between regions targeted with TMS and whole brain functional connectivity.
Group-level average values extracted from key regions showing a significant change in functional connectivity after inhibitory TMS (Figure 3). Standard error of the mean (in brackets) was calculated on single-subject connectivity values in each region. Regions consisted of a sphere of 7.5mm of radius centered on the co-ordinates indicated (MNI space).
- https://doi.org/10.7554/eLife.15252.020
-
Supplementary file 3
ALFF values.
- https://doi.org/10.7554/eLife.15252.021
-
Source code 1
Matlab code used to process electromyography signals.
- https://doi.org/10.7554/eLife.15252.022
Download links
A two-part list of links to download the article, or parts of the article, in various formats.
Downloads (link to download the article as PDF)
Open citations (links to open the citations from this article in various online reference manager services)
Cite this article (links to download the citations from this article in formats compatible with various reference manager tools)
A hierarchy of timescales explains distinct effects of local inhibition of primary visual cortex and frontal eye fields
eLife 5:e15252.
https://doi.org/10.7554/eLife.15252


