The leak channel NALCN controls tonic firing and glycolytic sensitivity of substantia nigra pars reticulata neurons
- Harvard Medical School, United States
- Broad Institute, United States
Figures
Figure 1
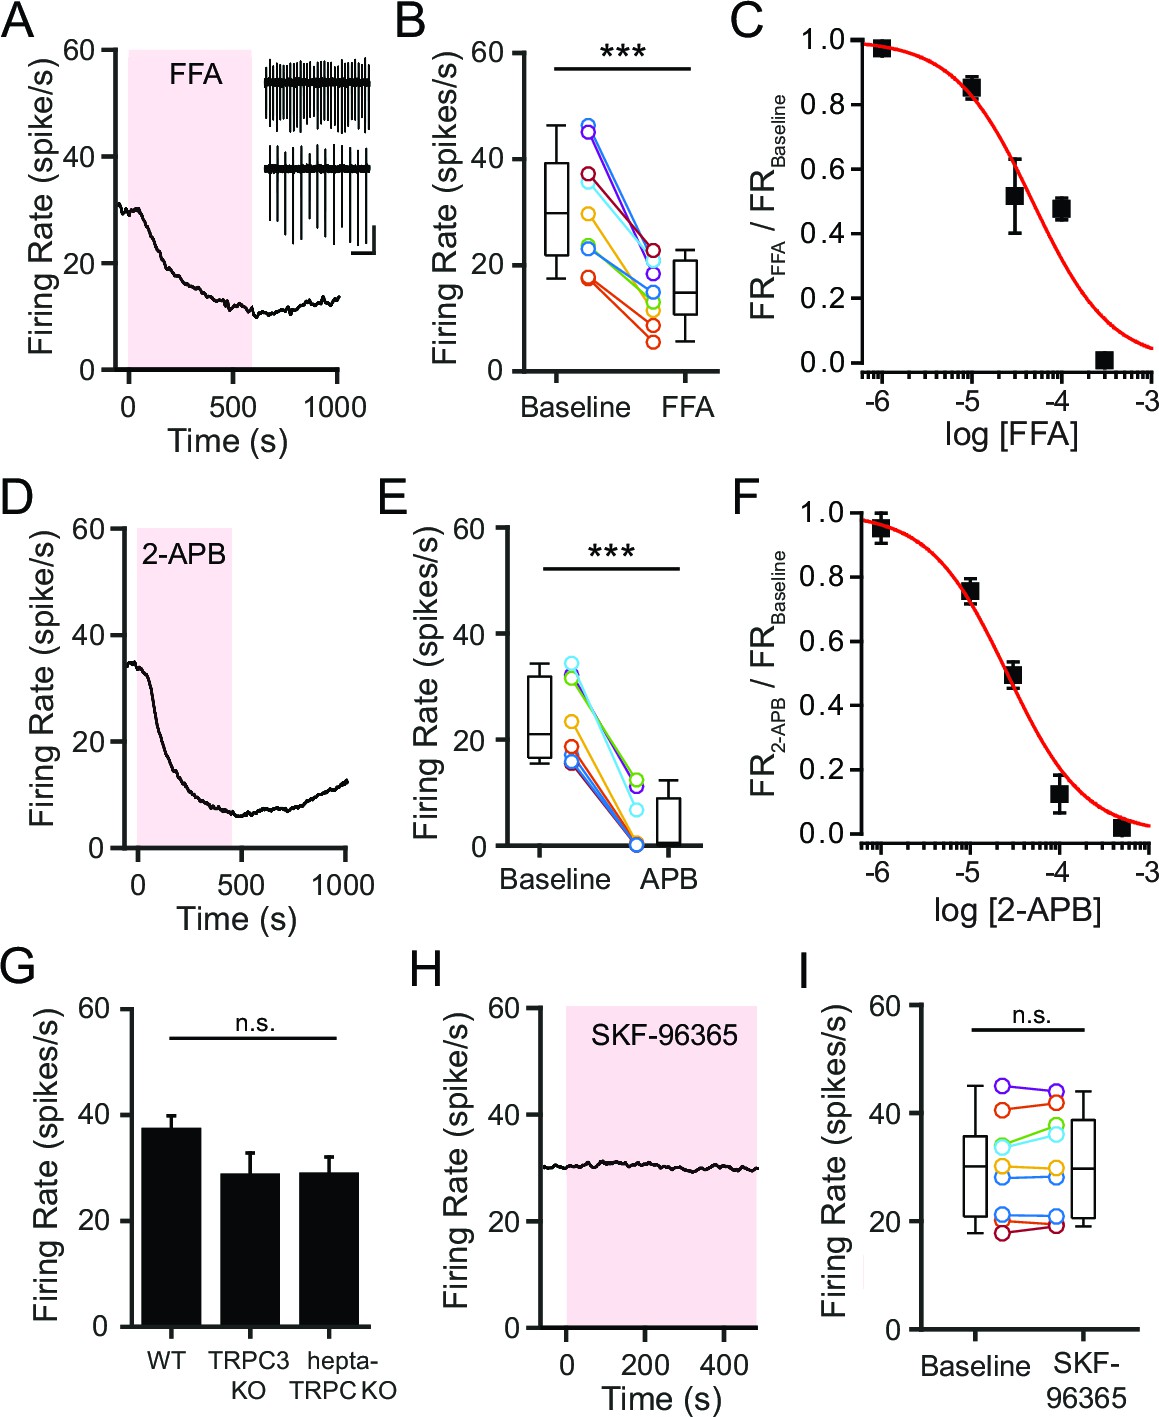
NSCCs other than TRPC channels maintain the spontaneous firing of SNr neurons.
(A,D) Representative time course of SNr neuron firing rate with application of NSCC blocker flufenamic acid (FFA; 100 μM) (A) and 2-aminoethoxydiphenylborane (2-APB; 100 μM) (D). Inset in panel a shows 1 s recordings before and after FFA. Scale bar: 100 pA, 200 ms. (B,E) Scatter plot of mean firing rate of SNr neurons before and after FFA application (30.7 ± 3.7 versus 15.2 ± 2.0 spikes/s; paired t-test; p = 0.00013; n = 9) (B) and before and after 2-APB (23.6 ± 2.8 versus 3.9 ± 1.9 spikes/s; paired t-test; p<0.0001; n = 8) (E). Box plots indicate the population median, interquartile range, and maximum and minimum values. (C,F) Dose response of FFA (C) and 2-APB (F) on firing rate. Data are fit with a Hill function (red line). (G) Mean basal firing rate of SNr neurons from wild-type mice (WT; 37.3 ± 2.7; n = 20), mice lacking TRPC3 (TRPC3 KO; 28.6 ± 4.3; n = 10) and mice lacking all seven TRPC channels (hepta-TRPC KO; 28.7 ± 3.4; n = 7). Error bars indicate s.e.m. n.s.p>0.05; one-way ANOVA. (H) Representative time course of SNr firing rate with application of TRPC channel blocker SKF-96365 (100 μM). (I) Mean firing rate of SNr neurons before and after SKF-96365 application (30.0 ± 3.1 versus 30.7 ± 3.2 spikes/s; paired t-test; p = 0.19; n = 9), and box plot summary of the population statistics before and after SKF-96365. For panels B, E, I: n.s.p>0.05; ***p<0.001.
Figure 2
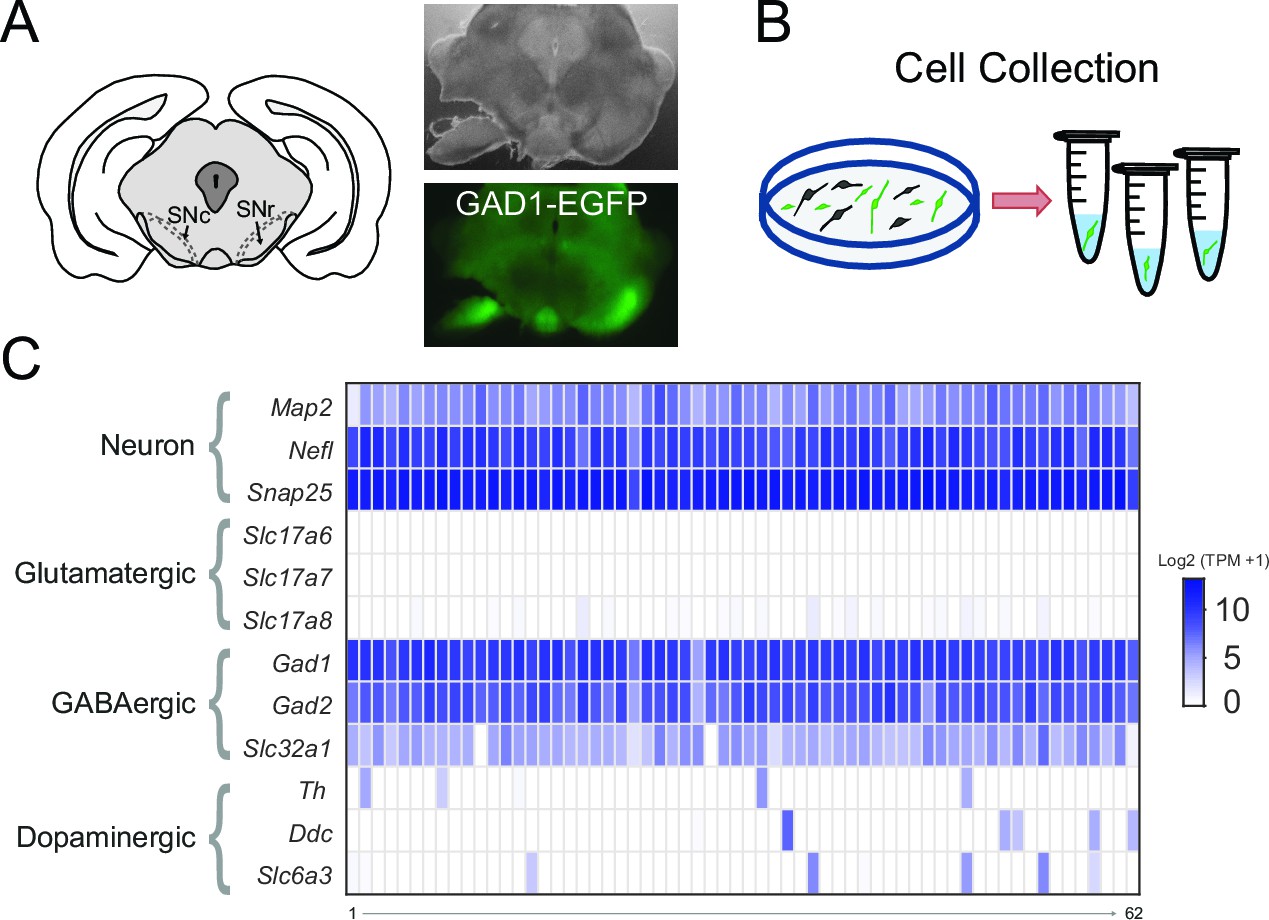
Transcriptome sequencing of individual SNr GABAergic neurons.
(A) (left) Drawing depicting a coronal section of the mouse brain containing the substantia nigra pars compacta (SNc) and SNr. Bright field (right top) and green fluorescent (right bottom) images of a coronal brain section from a GAD1-EGFP mouse with the substantia nigra region of one hemisphere partially microdissected. (B) Scheme for the plating and collecting of individual GFP-positive neurons. (C) Gene expression results for the 62 samples that were of high quality. The rows indicate gene expression results for neuron specific marker genes (Map2, Nefl, Snap25) and marker genes for neuronal subtypes: glutamatergic (Slc17a6, Slc17a7, Slc17a8), GABAergic (Gad1, Gad2, Slc32a1), and dopaminergic (Th, Ddc, Slc6a3). Expression is indicated by the log2 transform of the number of transcripts per million (TPM) plus 1.
Figure 3 with 1 supplement
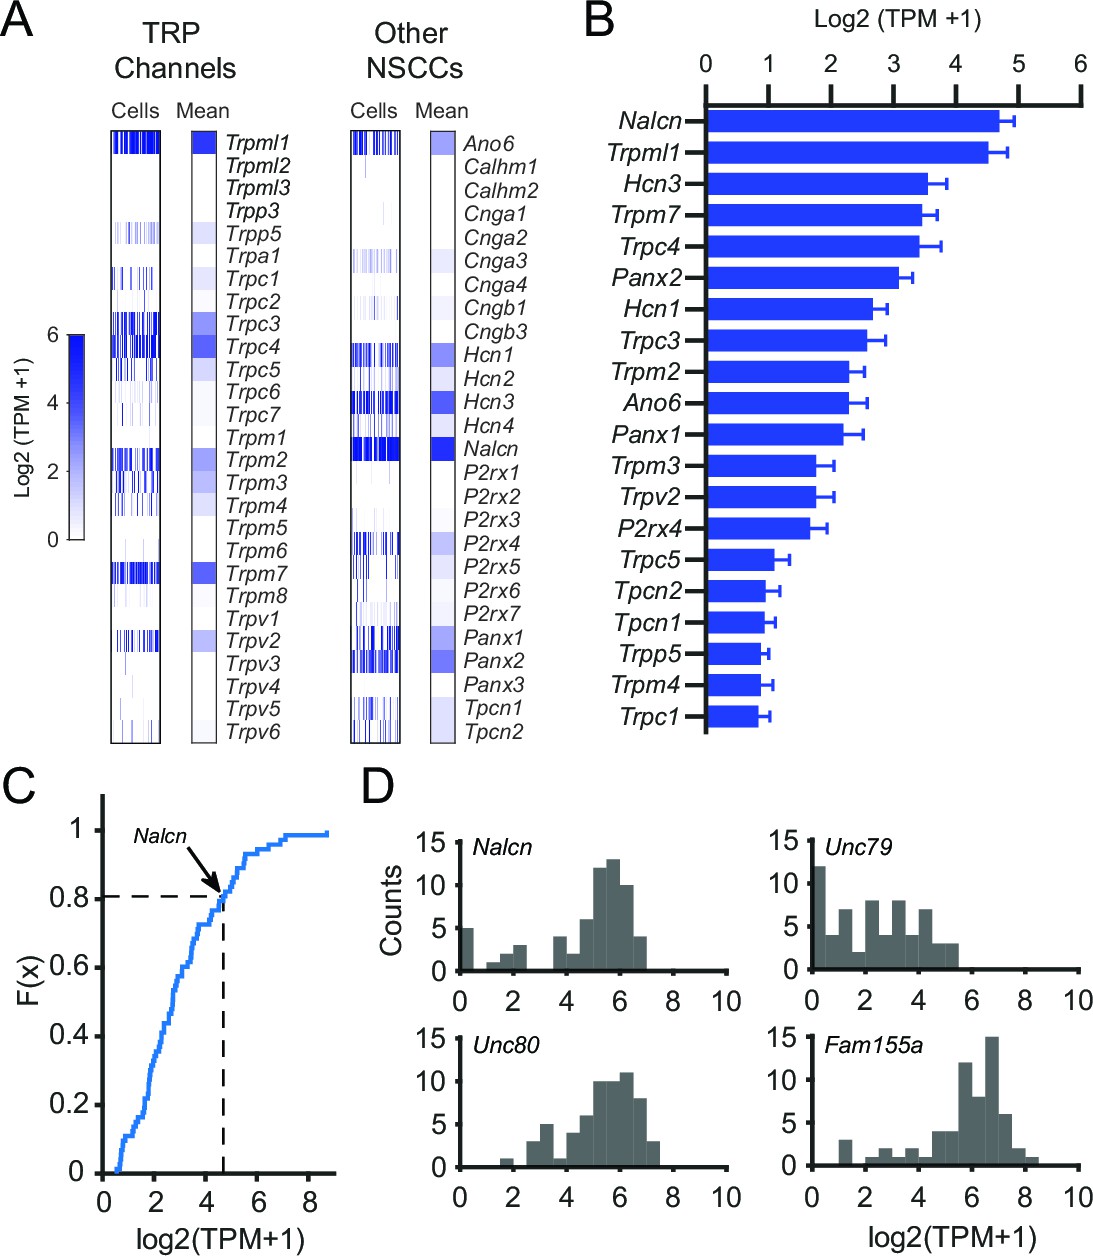
Gene expression results for NSCCs in SNr neurons.
(A) Relative gene expression levels of TRP channels (left) and other NSCCs (right) in individual SNr neurons and the population average. (B) Bar graph of the mean log2 (TPM +1) for the top 20 NSCCs in descending order. Error bars indicate s.e.m. (C) Cumulative distribution plot of the mean expression level of all ion channels that were consistently expressed by SNr neurons (73 out of 232 total ion channel genes). The average level of expression of Nalcn is indicate by arrow and dashed line. (D) Histograms of expression of Nalcn, Unc79, Unc80, and Fam155a in SNr neurons.
Figure 3—figure supplement 1
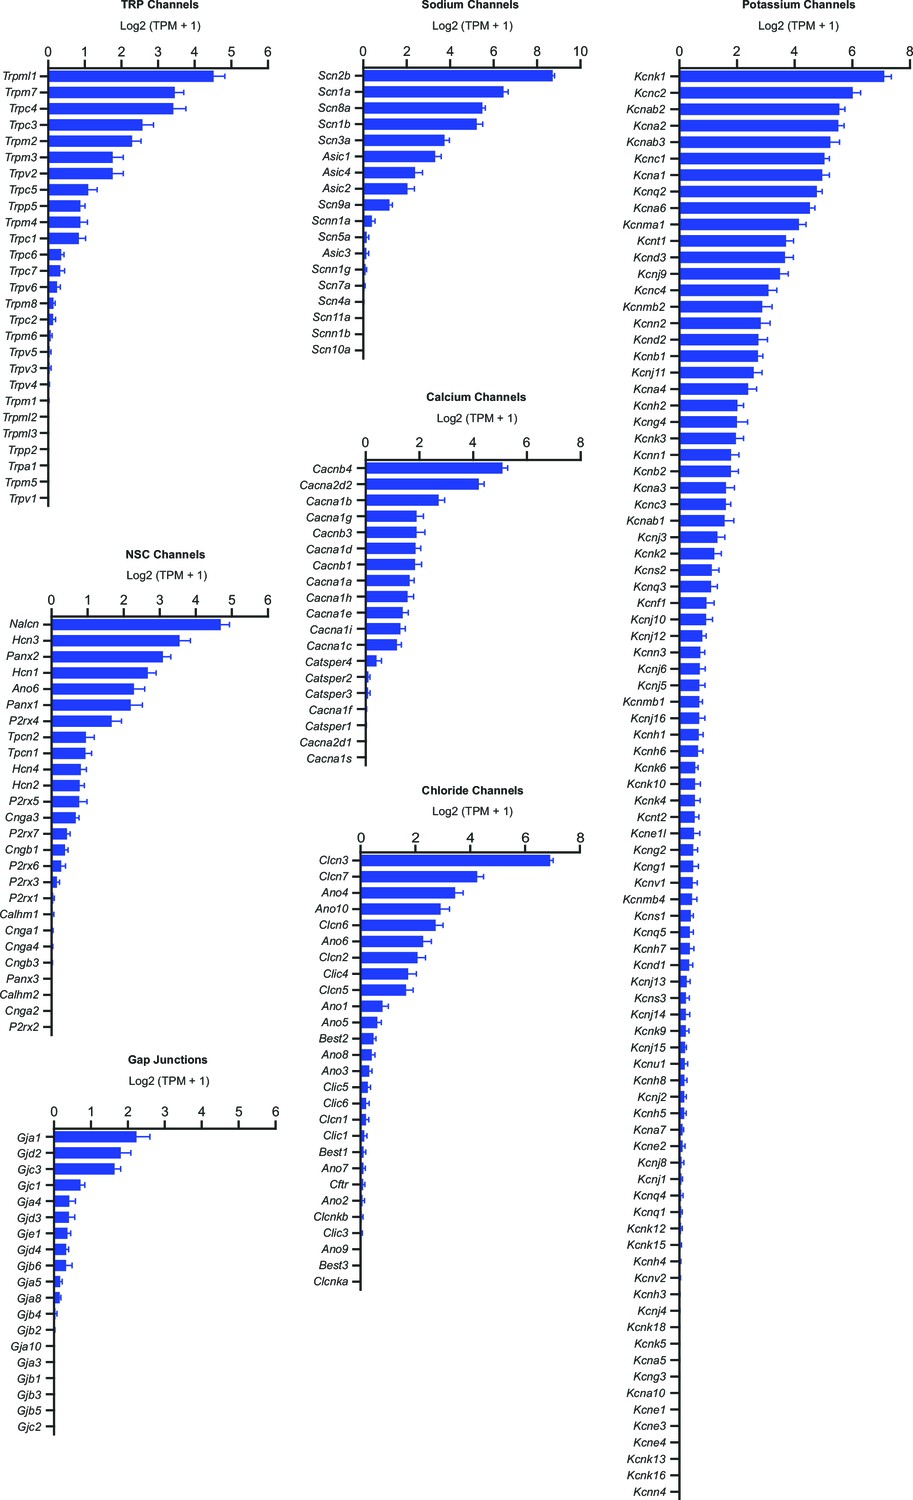
SNr neuron gene expression results for all ion channels.
Average expression in log2(TPM + 1) of ion channel genes sorted (descending order) and grouped by type. Error bars indicate s.e.m.
Figure 4
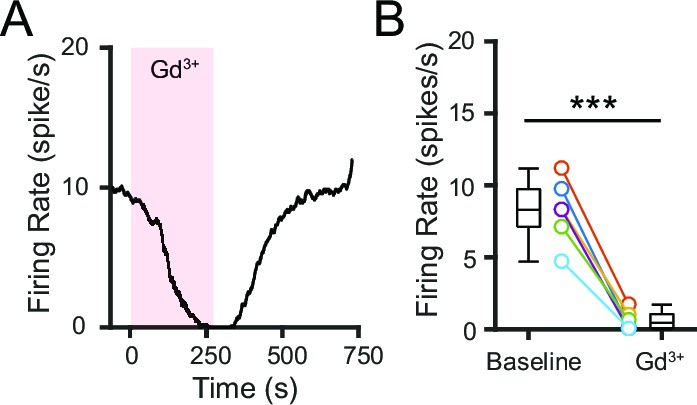
Pharmacological blockade of NALCN impairs SNr firing.
(A) Representative time course of SNr neuron firing rate with application of gadolinium (Gd3+; 100 μM). (B) Comparison of firing rates before and after Gd3+ application (8.2 ± 0.9 versus 0.6 ± 0.3 spikes/s; paired t-test; p=0.00018; n = 6). ***p<0.001.
Figure 5
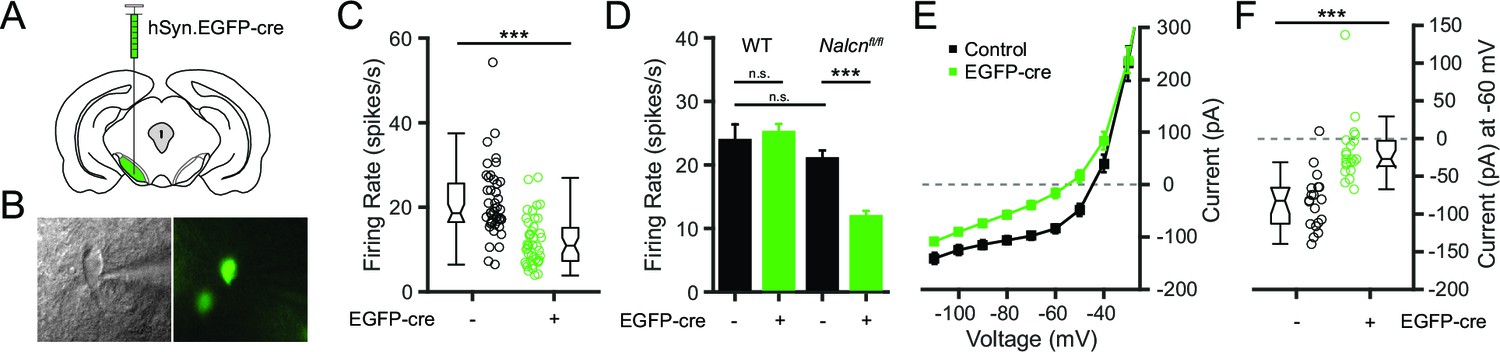
Conditional knockout of NALCN in SNr neurons slows spontaneous firing.
(A) Schematic depicting unilateral injections of the adeno-associated virus containing the hSyn-EGFP-cre construct. (B) Bright field (left) and fluorescent (right) images of an example EGFP-cre positive SNr neuron from which recordings were obtained. (C) Firing rates of EGFP-cre negative (21.0 ± 1.3 spikes/s; n = 45) versus positive (11.9 ± 0.9 spikes/s; n = 43) neurons from Nalcnfl/fl transgenic mice (unpaired t-test; ***p<0.0001). Box plot notches indicate the 95% confidence intervals. (D) Mean firing rate of EGFP-cre negative (23.9 ± 2.5 spikes/s; n = 27) and positive (25.2 ± 1.3 spikes/s; n = 39) neurons from WT mice (unpaired t-test; P = 0.62), and EGFP-cre negative and positive neurons from Nalcnfl/fl mice. n.s.p>0.05; ***p<0.001; one-way ANOVA with Bonferroni post hoc correction. (E) Steady-state I-V recordings from EGFP-cre negative (black symbols; n = 19) and positive (green; n = 21) neurons. (F) Steady-state current (pA) at -60 mV from EGFP-cre negative (n = 19) and positive (n = 21) neurons (unpaired t-test; ***p<0.0001).
Figure 6 with 1 supplement
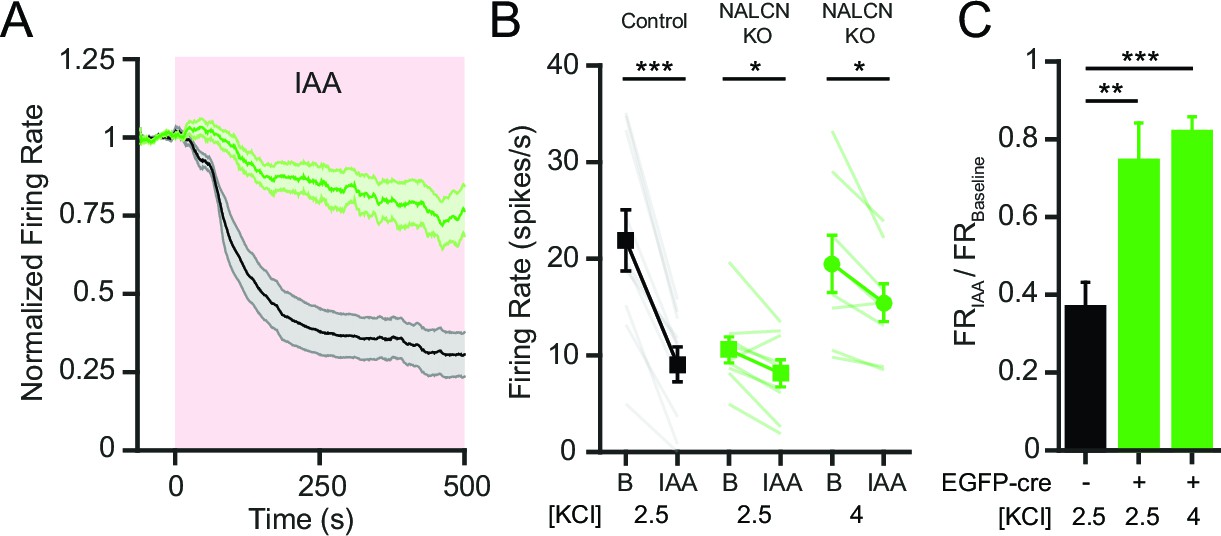
NALCN is required for the decrease in SNr firing rate after inhibition of glycolysis.
(A) Time course of the average firing rate of control (GFP-negative; black line) and NALCN KO neurons (GFP-positive; green line) with application of glycolytic inhibitor, IAA (1 mM). Shaded error region indicates s.e.m. (B) Mean firing rate of SNr neurons during baseline and after application of IAA. Black square symbols: GFP-negative control experiments in 2.5 mM KCl bath solution (21.9 ± 3.2 versus 9.1 ± 1.8 spikes/s; paired t-test; p<0.0001; n = 10). Green square symbols: NALCN KO experiments in 2.5 mM KCl bath solution (10.6 ± 1.3 versus 8.1 ± 1.4 spikes/s; paired t-test; p=0.03; n = 9). Green circle symbols: NALCN KO experiments in 4 mM KCl bath solution (19.5 ± 3.0 versus 15.5 ± 2.0 spikes/s; paired t-test; p=0.02; n = 8). *p<0.05; ***p<0.001. (C) Baseline normalized firing rate showing the fold change after application of IAA in control (2.5 mM KCl) and both NALCN KO conditions (2.5 and 4 mM KCl). **p<0.01; ***p<0.001; one-way ANOVA with Bonferroni post hoc correction.
Figure 6—figure supplement 1

NALCN KO SNr neurons have lower firing rates in both low and high potassium conditions.
(A) Mean firing rate of EGFP-cre negative (30.2 ± 3.9 spikes/s; n = 18) and positive (16.8 ± 2.0 spikes/s; n = 13) neurons from Nalcnfl/fl mice in elevated potassium (4 mM KCl) bath solution (unpaired t-test; **p=0.009). (B) Normalized mean firing rate of Nalcnfl/fl EGFP-cre negative and positive neurons in 2.5 mM and 4 mM KCl bath solution. n.s.p>0.05; **p<0.01; ***p<0.001; one-way ANOVA with Bonferroni post hoc correction.
Figure 7
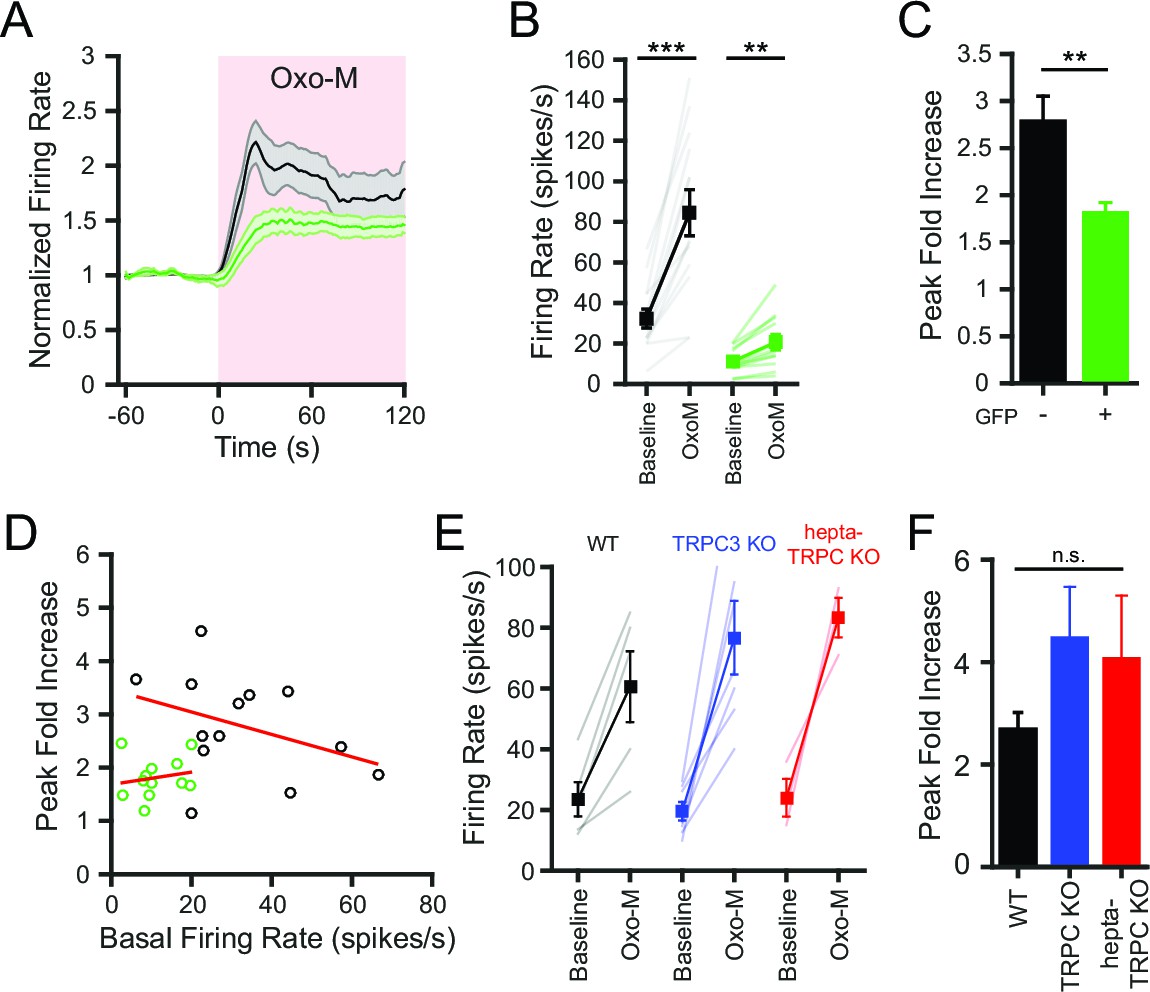
Conditional knockout of NALCN in SNr neurons blunts the increased excitability with activation of metabotropic acetylcholine receptors.
(A) Time course of the baseline normalized mean firing rate of control and NALCN KO SNr neurons with application of Oxo-M (10 μM). Shaded error region indicates s.e.m. (B) Mean firing rate during the baseline period versus the maximum firing rate during Oxo-M application of control (84.5 ± 11.4 versus 32.3 ± 4.7 spikes/s; paired t-test; p<0.0001; n = 13) and NALCN KO SNr neurons (20.6 ± 3.8 versus 11.1 ± 1.7 spikes/s; paired t-test; p=0.002; n = 12). **p<0.01; ***p<0.001. (C) Peak firing rate during Oxo-M normalized to baseline firing rate of control versus NALCN KO neurons (2.8 ± 0.3 versus 1.8 ± 0.1; paired t-test; p=0.008). **p<0.01. (D) Scatter plot of the peak normalized firing rate with Oxo-M versus the basal firing rate of control and NALCN KO SNr neurons. Red lines are linear regression fits of the data. Control: p=0.2; NALCN KO: p=0.6; Pearson correlation. (E) Baseline and peak firing rate in Oxo-M of WT, TRPC3 KO and hepta-TRPC KO SNr neurons. (F) Peak fold increase in firing rate with Oxo-M of WT (2.7 ± 0.3; n = 5), TRPC3 KO (4.5 ± 1.0; n = 7) and hepta-TRPC KO neurons (4.1 ± 1.2; n = 3). n.s.p>0.05; one-way ANOVA.
Figure 8
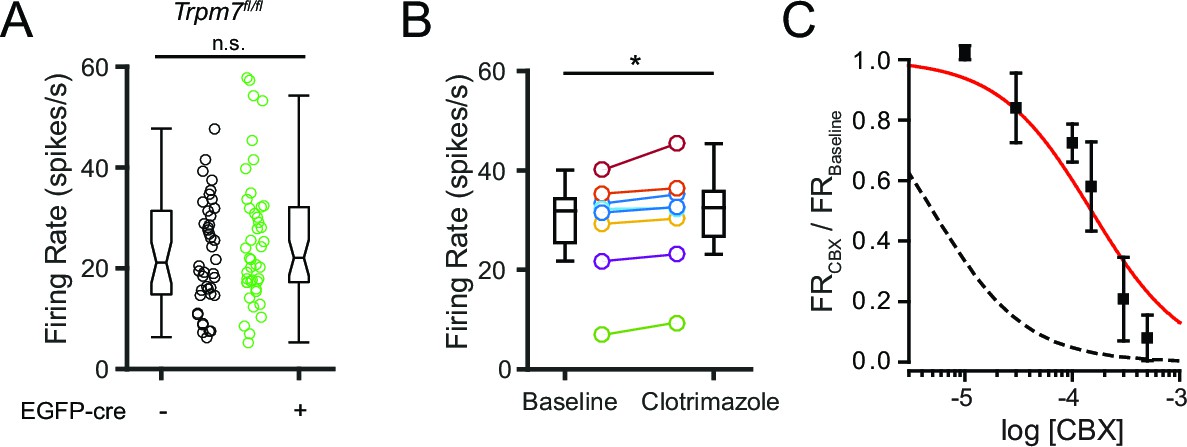
Pharmacological and genetic tests of other candidate NSCC.
(A) Mean firing rate of control (23.5 ± 1.9; n = 42) and TRPM7 KO (25.8 ± 2.0; n = 43) SNr neurons. n.s.p=0.42; unpaired t-test. (B) Mean firing rate before (28.8 ± 3.6) and after (30.6 ± 3.7) application of a TRPM2 channel blocker, clotrimazole (10 μM). *p=0.01; paired t-test. (C) Dose response curve of the effect of carbenoxolone (CBX) on baseline normalized firing rate (red line; Hill function) compared with predicted dose response curve of CBX blockade of pannexin channels (dashed black line; simulated Hill function; k = 5 × 10⁻⁶M).
Download links
A two-part list of links to download the article, or parts of the article, in various formats.
Downloads (link to download the article as PDF)
Open citations (links to open the citations from this article in various online reference manager services)
Cite this article (links to download the citations from this article in formats compatible with various reference manager tools)
The leak channel NALCN controls tonic firing and glycolytic sensitivity of substantia nigra pars reticulata neurons
eLife 5:e15271.
https://doi.org/10.7554/eLife.15271


