Object vision to hand action in macaque parietal, premotor, and motor cortices
- German Primate Center GmbH, Germany
- The Rockefeller University, United States
- University of Göttingen, Germany
Figures
Figure 1
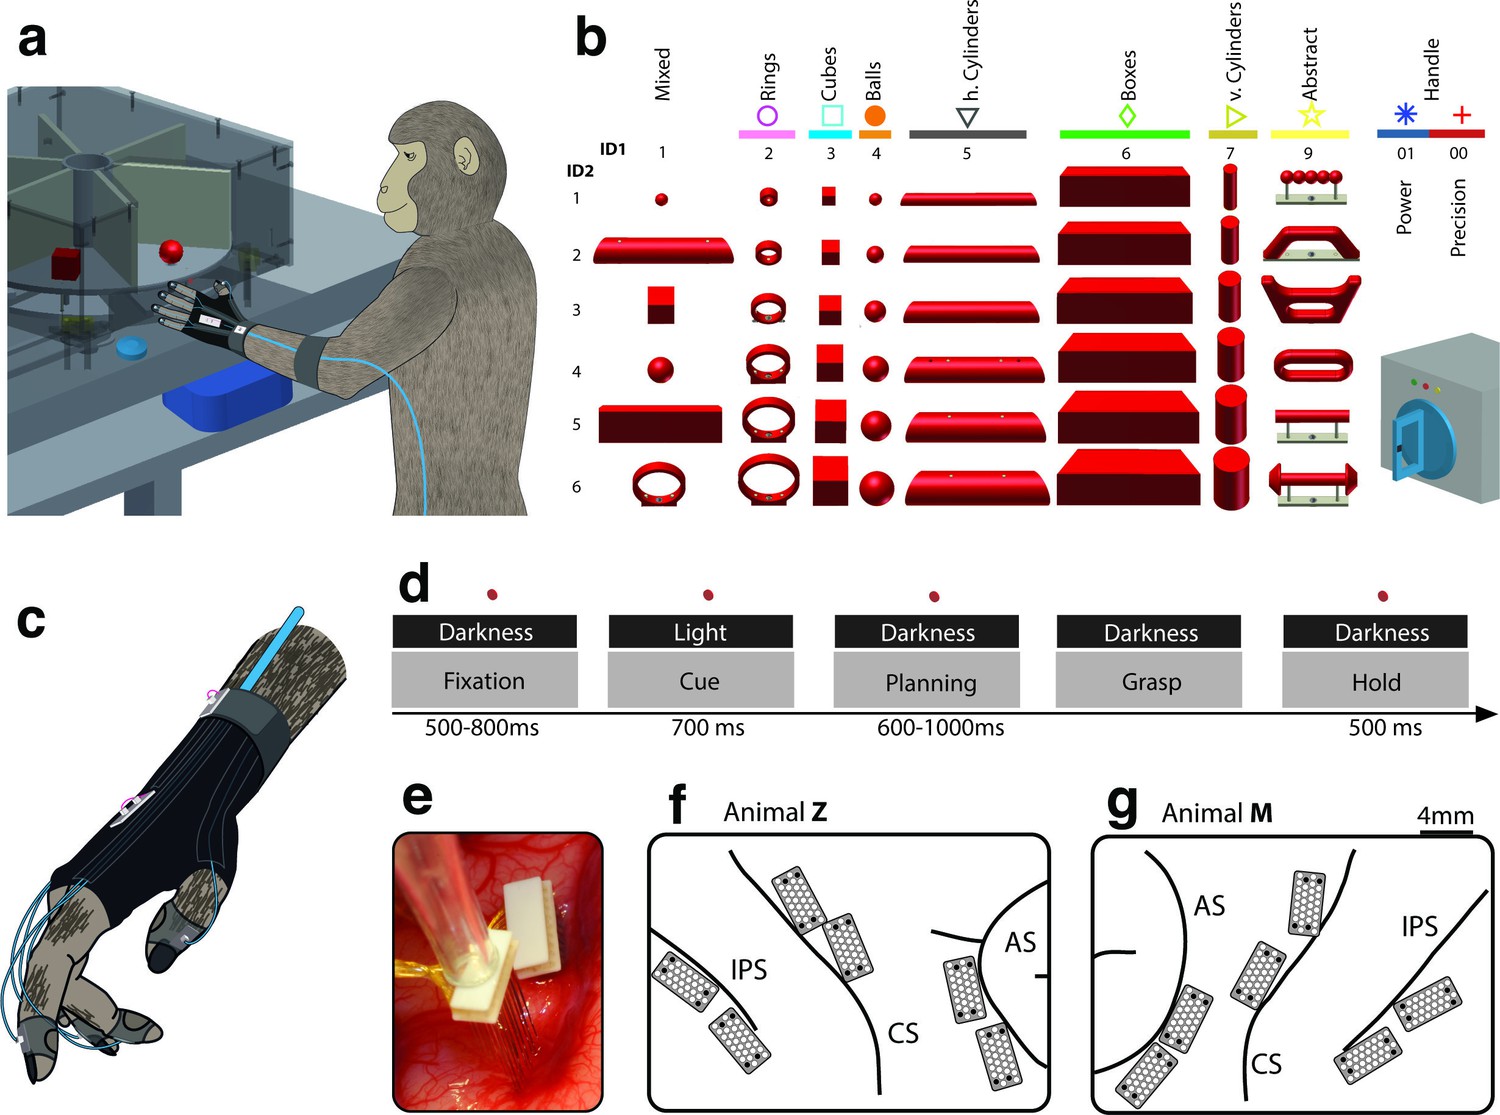
Behavioural design and implantation details.
(a–b) Two monkeys were trained to grasp a total of 48 objects presented on a PC-controlled turntable. In addition, monkeys were instructed to perform either precision or power grips on a handle. Each of the 50 grasping conditions was denoted with a double-digit number (ID1, ID2), a colour code, and a symbol to allow easy identification throughout this manuscript. (c) An instrumented glove equipped with electro-magnetic sensors allowed monitoring and recording the monkeys’ hand and arm kinematics in 27 DOF. (d) All grasping actions were performed as a delayed grasp-and-hold task consisting of eye-fixation, cue, planning, grasping and hold epochs. (e–g) Neural activity was recorded simultaneously from six floating microelectrode arrays implanted in the cortical areas AIP, F5, and M1. (f) Electrode placement in monkey Z (right hemisphere). Each array consisted of 2 ground and 2 reference electrodes (black), as well as 32 recording channels (white) aligned in a 4x9 matrix. Electrode length for each row increased towards the sulcus from 1.5–7.1 mm. (g) Same for monkey M (left hemisphere). Two arrays were implanted in each area. AIP: toward the lateral end of the intraparietal sulcus (IPS); F5: on the posterior bank of the arcuate sulcus (AS); hand area of M1: on the anterior bank of the central sulcus (CS).
Figure 2 with 2 supplements
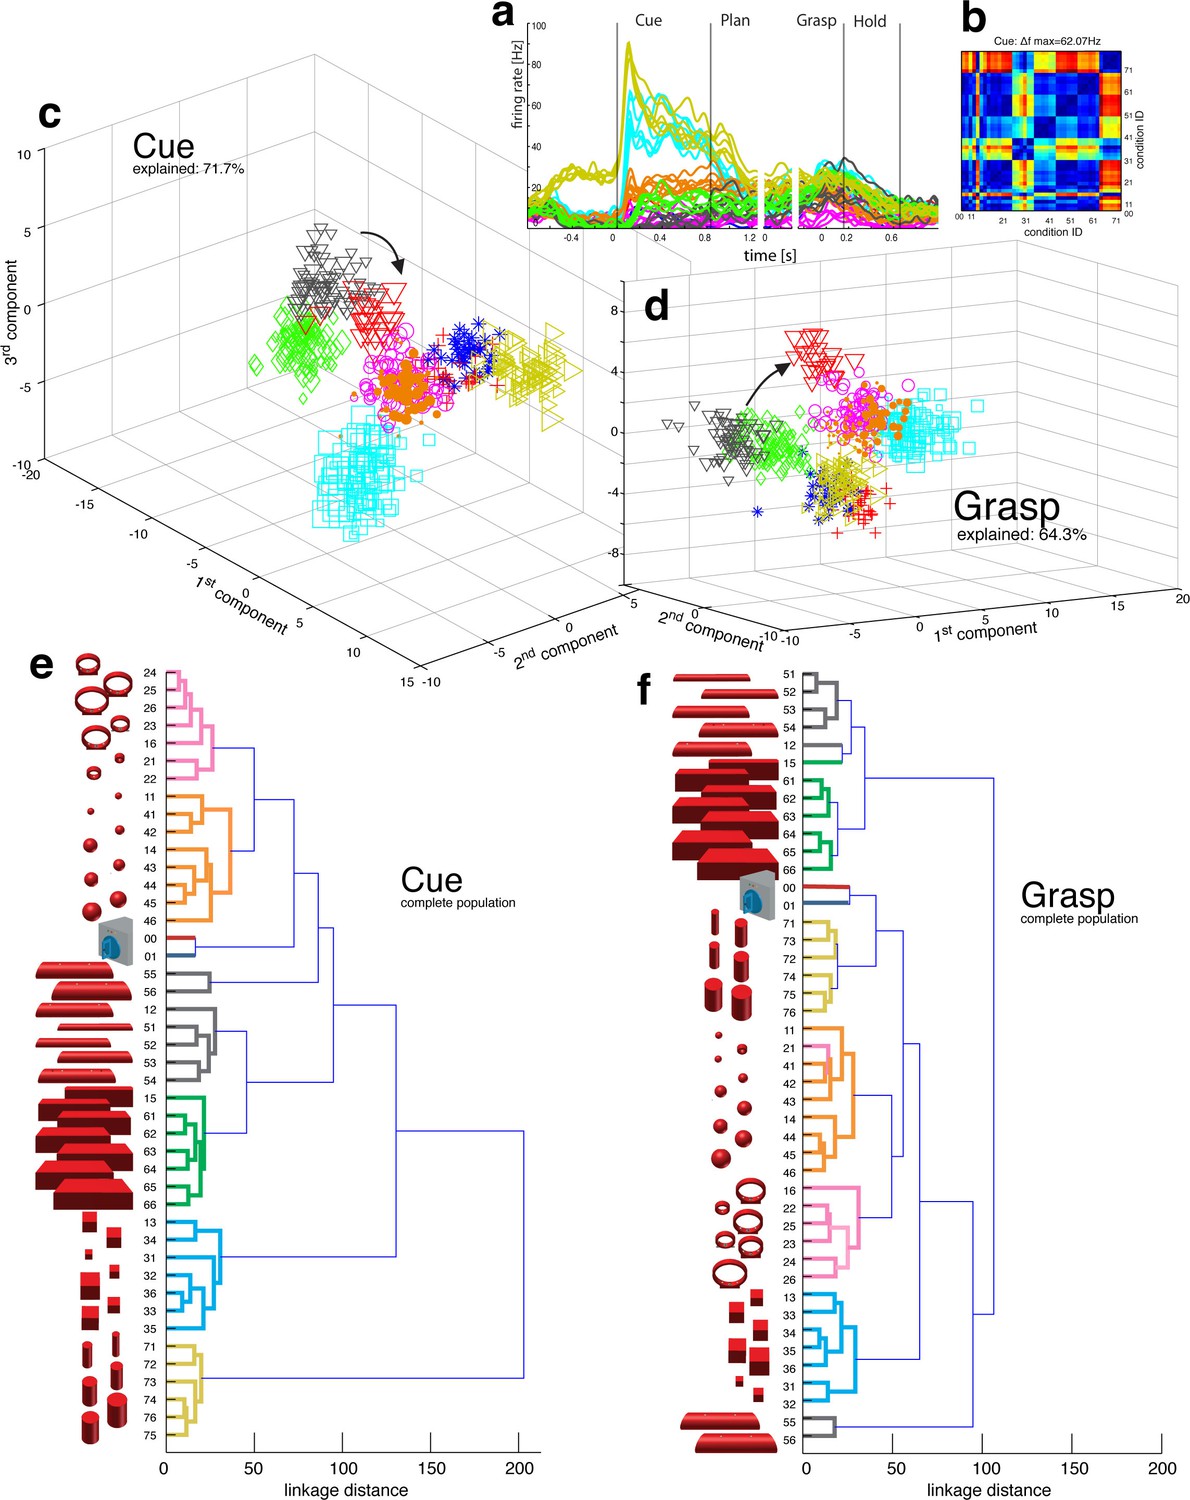
Visual object processing in area AIP.
(a) Example neuron of AIP responding to the presentation of graspable objects (each curve represents one task condition). (b) Modulation depth plot illustrating the absolute firing rate difference in the cue epoch between all condition pairs (conditions 00 – 76 placed on axis in ascending order). Warm colours: high modulation depth, cool colours: low modulation depth. (c) Shape-wise clustering of objects in the AIP population during the cue epoch, as demonstrated by CDA. Arrows indicate a shift in position when big horizontal cylinders (red triangles) were grasped from below instead from above (black triangles). (d) Same as c, but during the grasp epoch. (e–f) Dendrograms illustrating the neural distance between object conditions in the simultaneously recorded AIP population in the cue and grasp epoch (N = 62). Symbols and colour code in a, c-f as in Figure 1b. Percentages in c and d describe how much variance of the data is explained by the shown components (1st, 2nd and 3rd). Note: Video 3 visualizes the N-space of AIP of an additional recording in the same animal (Z). See Figure 2—figure supplement 1–2 for the averaged population results of animal Z and animal M, respectively.
Figure 2—figure supplement 1
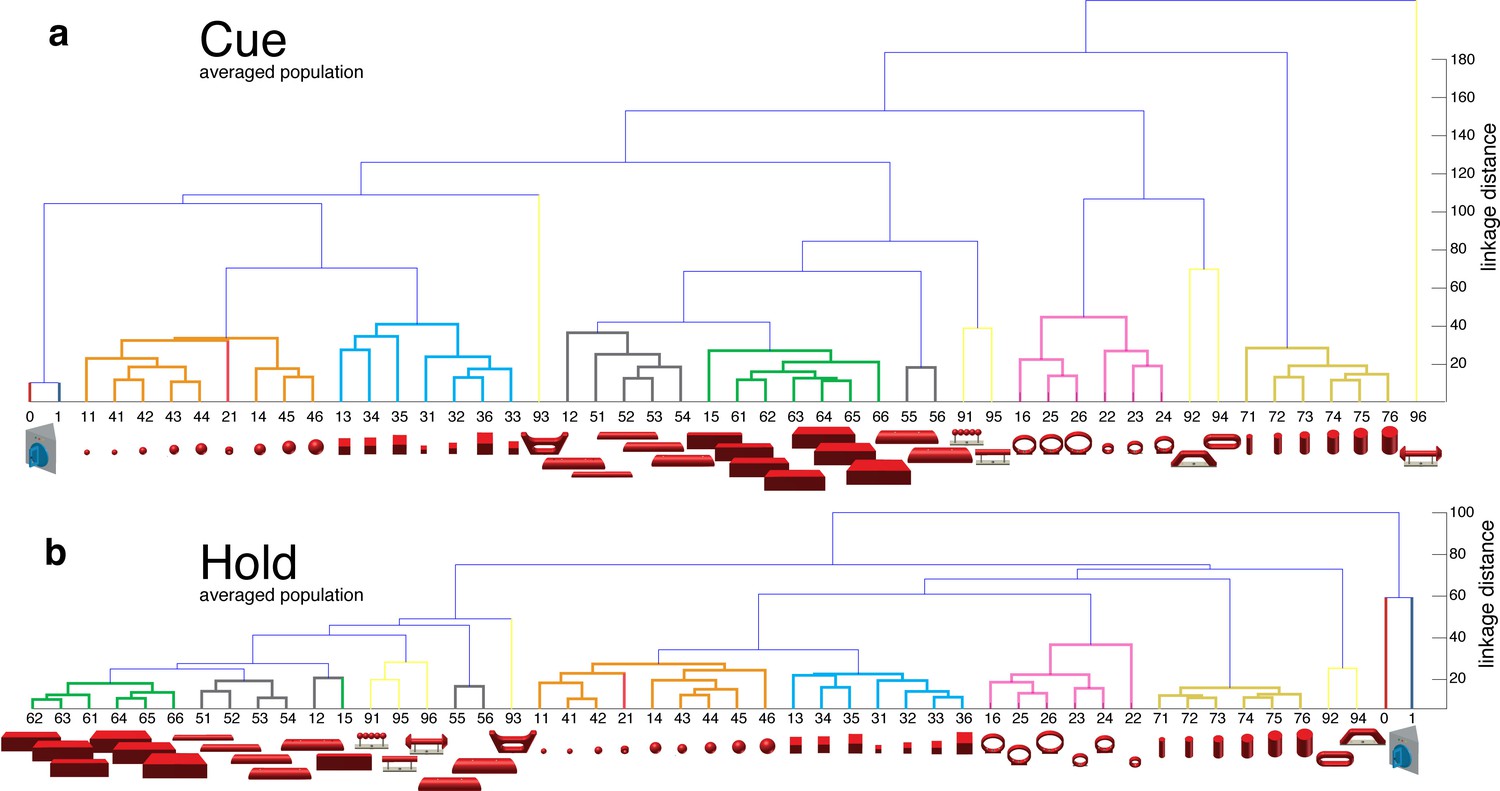
Visual coding for hand action in AIP in animal Z across all sessions.
Neural distance between each pair of group means was measured for each recording session, averaged across sessions, and visualized as dendrograms for the (a) cue and (b) hold epoch. Symbols and colours as in Figure 1b.
Figure 2—figure supplement 2
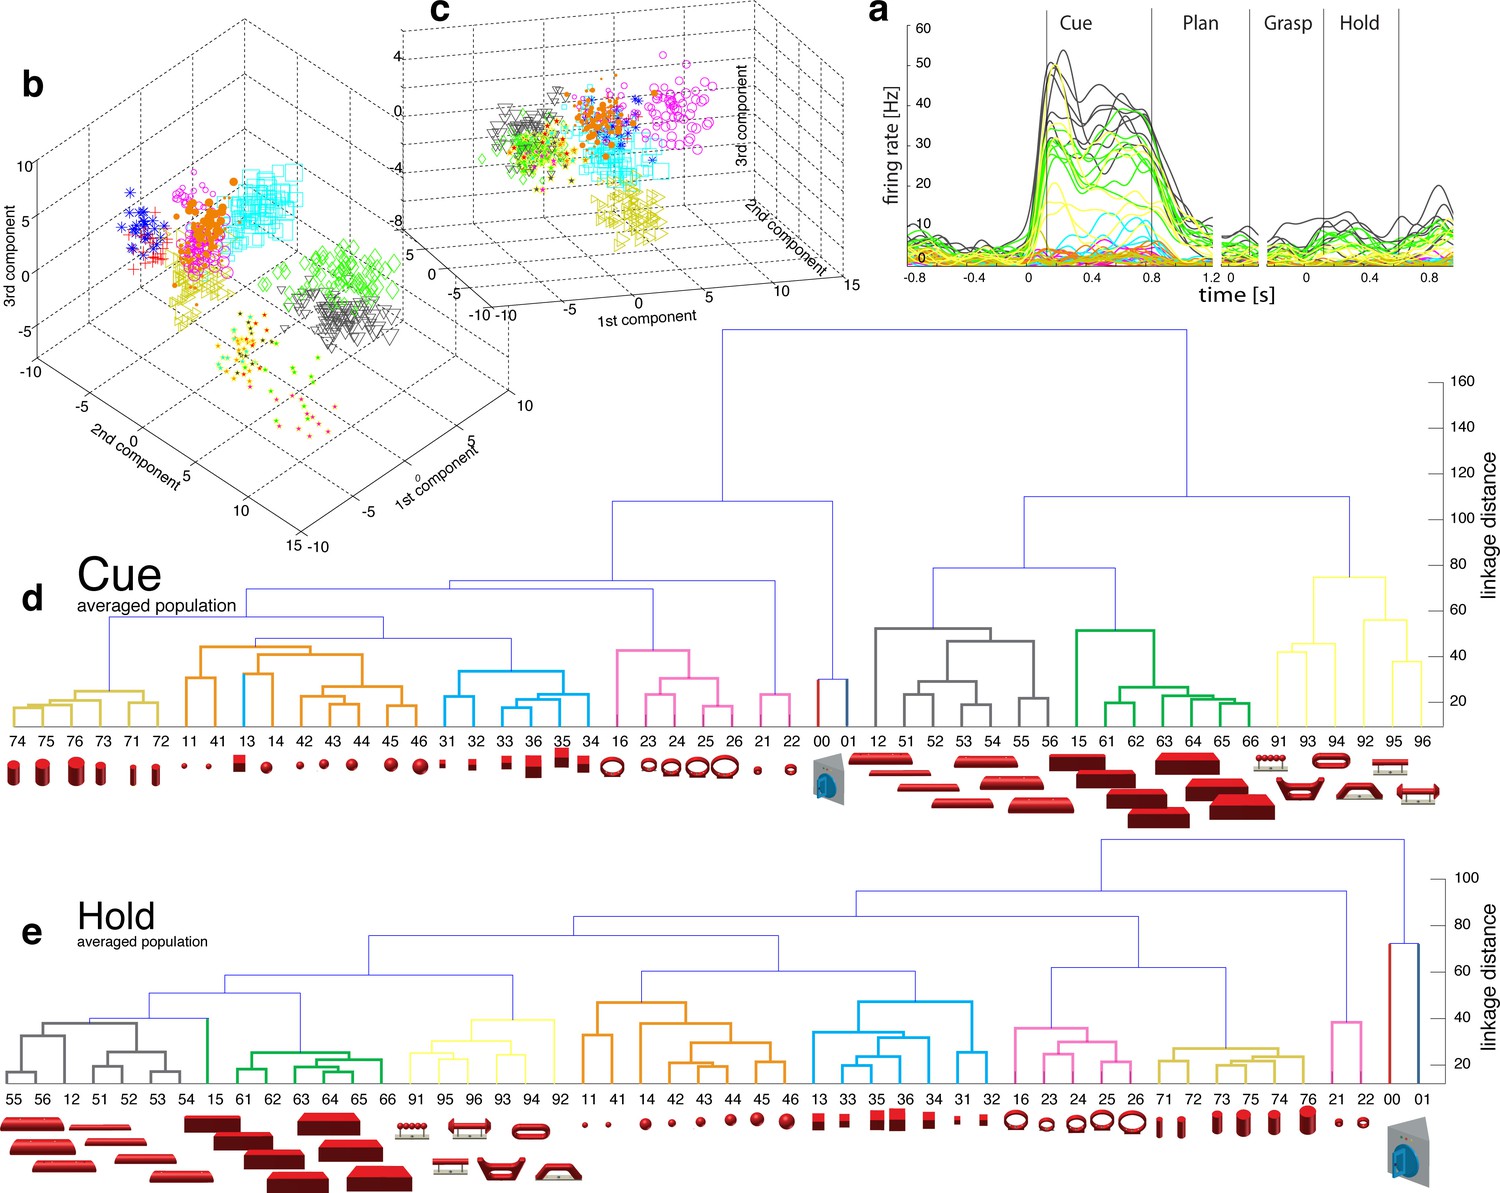
Visual coding for hand action in AIP in animal M across all sessions.
(a) Firing rate plot of AIP example unit. (b–c) N-space of AIP during cue and hold epoch of one recording session (simultaneously recorded, N = 90, first three components shown). (d–e) Neural distances between each pair of group means were measured for each recording session, then averaged across all sessions and visualized as dendrograms for the cue and hold epoch.
Figure 3
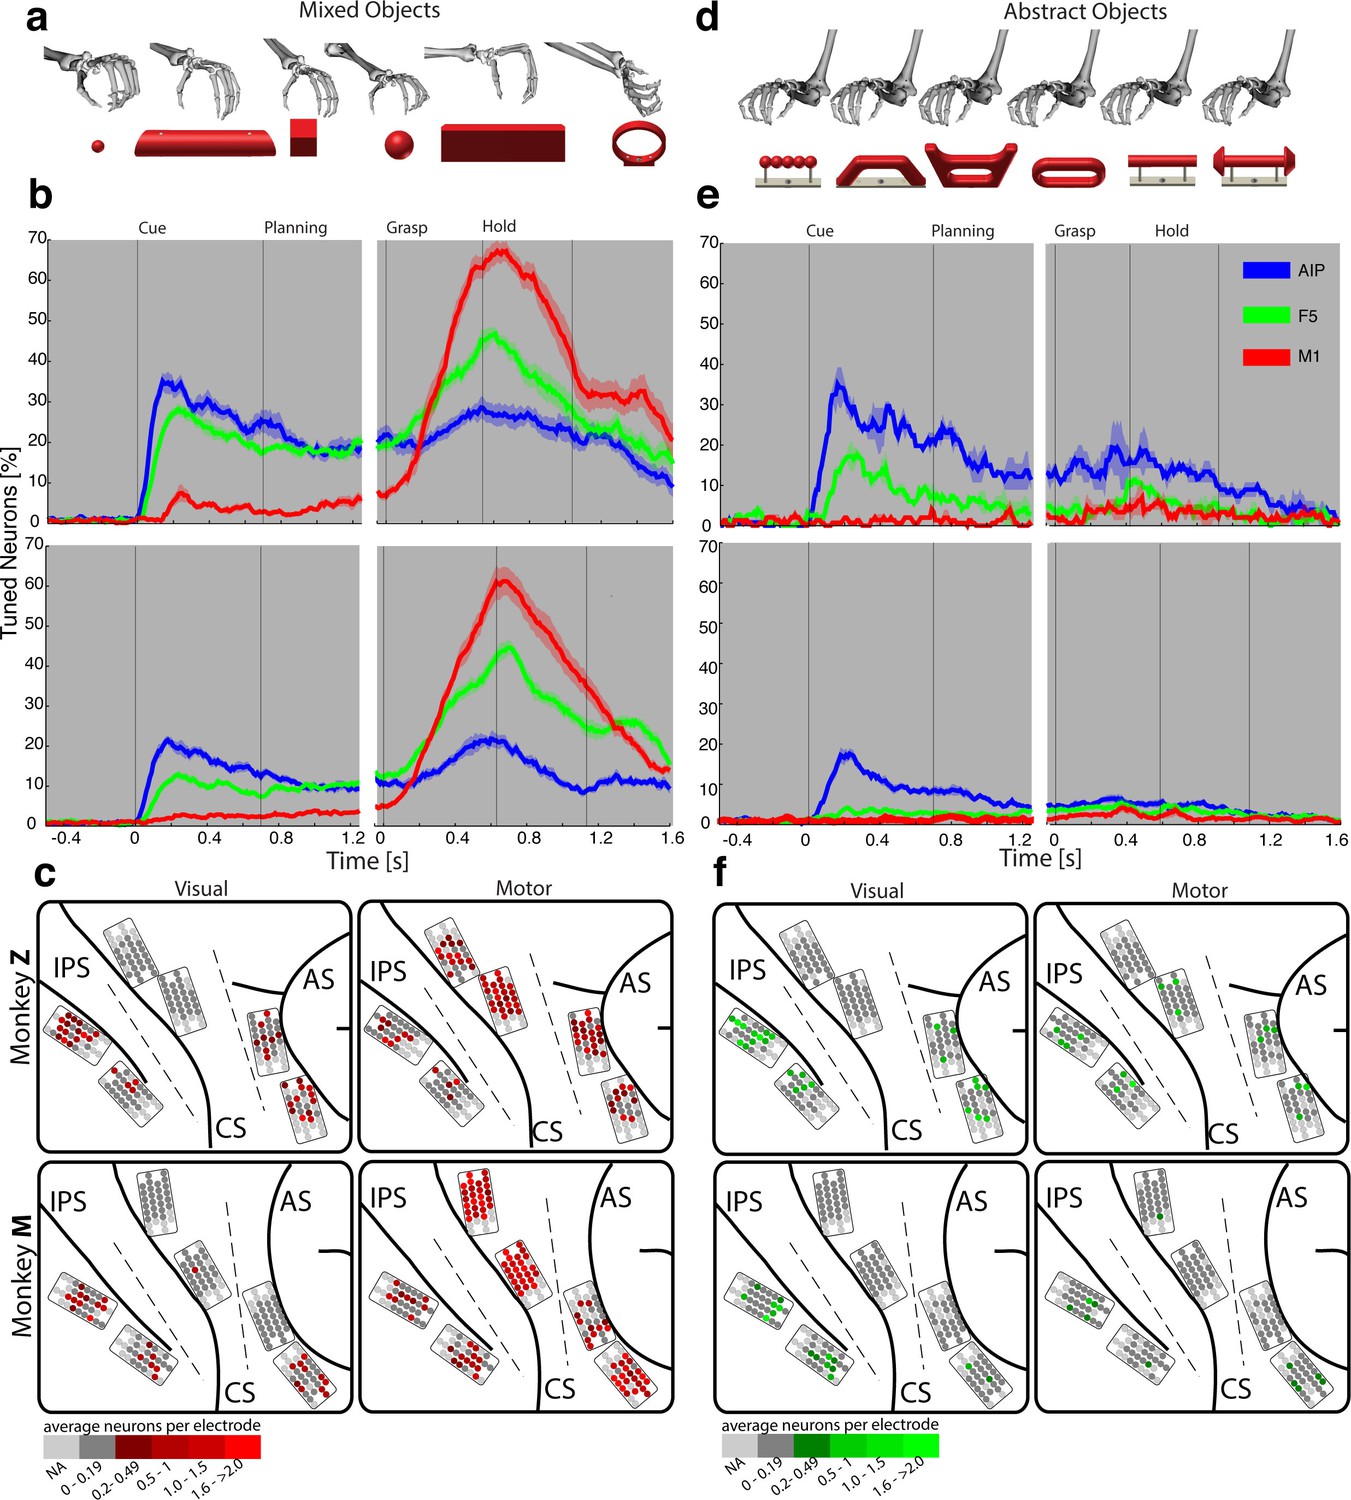
Visual processing of object shapes.
(a) A set of six 'mixed' objects elicited different visual stimuli and different motor responses. (b) Percentage of tuned neurons of the AIP, F5, and M1 population express the significant modulation with respect to the mixed objects across time (sliding one-way ANOVA). (c) Tuned neurons (shades of red) were mapped to their recording location during the visual (t = 0.16 s after object presentation) and motor phase (t = 0.7 s after movement onset). (d) As a contrast and to elicit pure visual responses, 'abstract' objects caused different visual stimuli but the same grip. (e) Similar to b, but for the abstract objects set. (f) Similar to c, but showing the map of tuned neurons (shades of green) with respect to the abstract object set. For b, e: Data is doubly aligned on cue onset and on the grasp (go) signal. Sliding ANOVA was computed for each session individually and averaged across all 10 recording sessions per animal. Shades represent standard error from mean (s.e.m.) across recording sessions. For c, f: The number of tuned neurons per channel were averaged across all recording sessions and visualized in shades of green and red for the abstract and mixed objects, respectively. Channels without any identified neurons were highlighted in light grey. Map of monkey M is mirrored along vertical axis for better comparison of both animals.
Figure 4
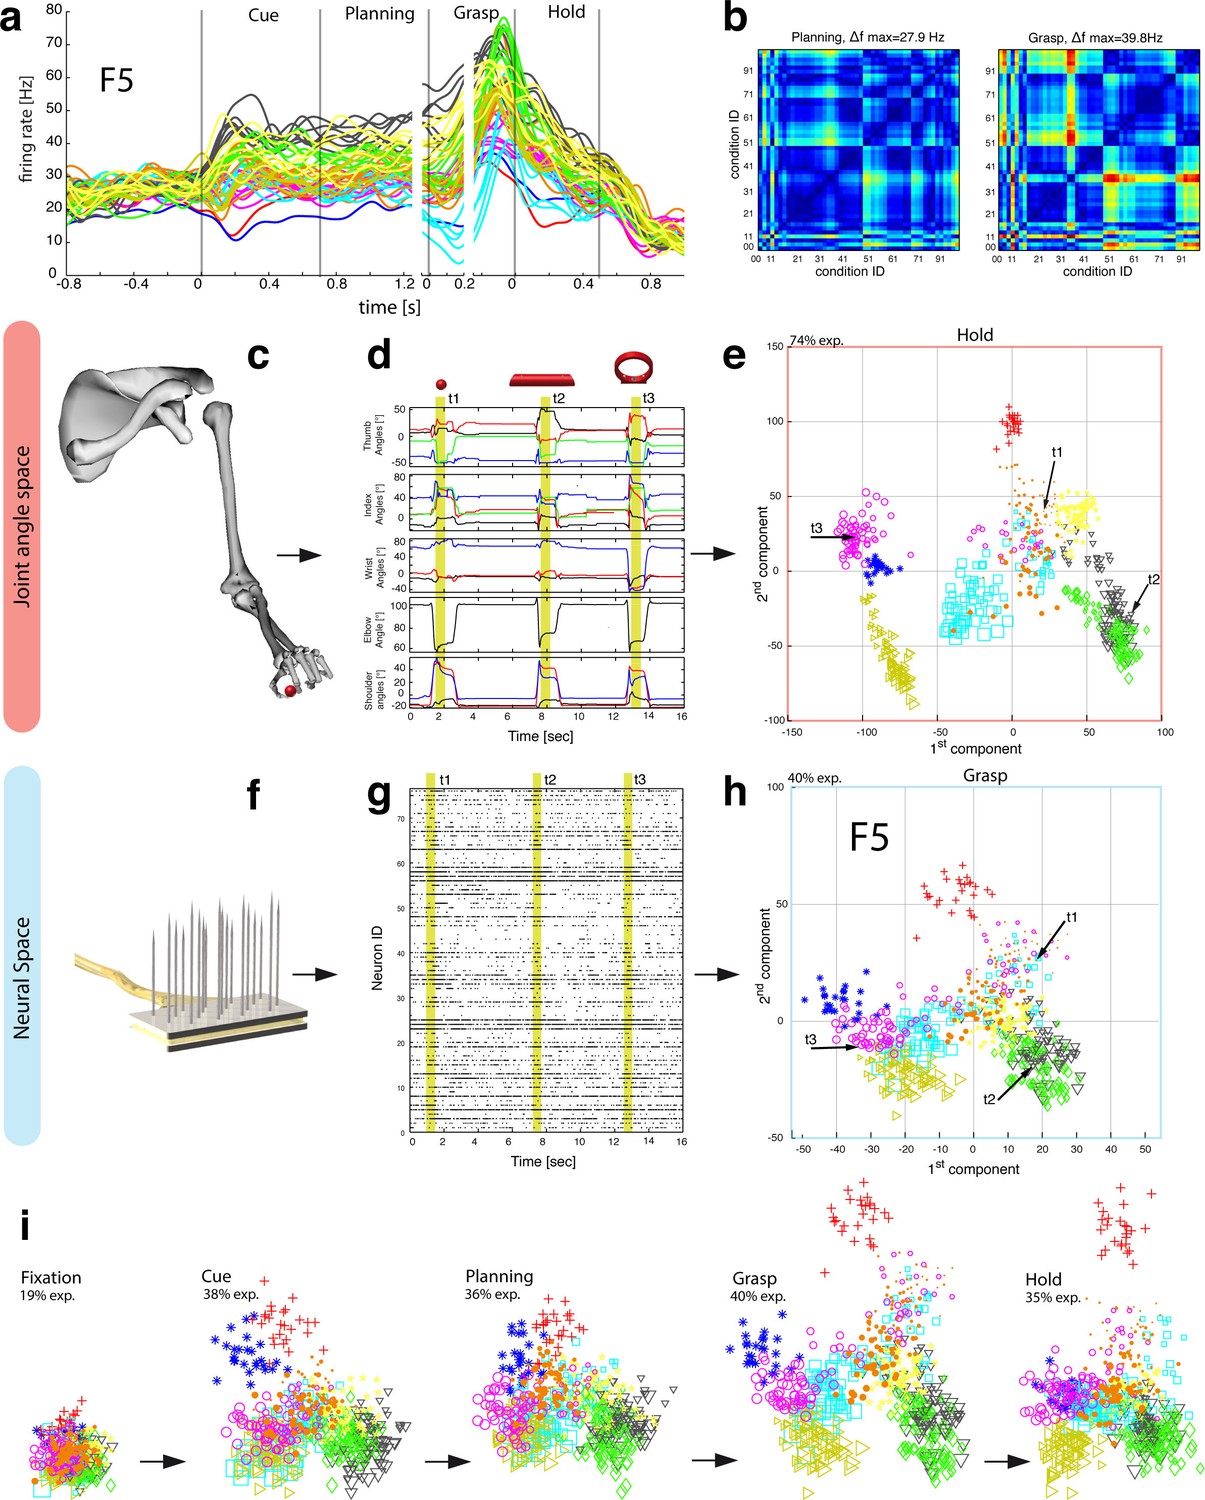
Motor planning and execution in F5.
(a) Example neuron of F5, responding to all 50 task conditions (colour code as in Figure 1b). (b) Modulation depth plots (as in Figure 2b) in the planning and grasp epoch. (c) Recorded kinematics was used to drive a monkey-specific musculoskeletal model that allowed extracting 27 DOF. (d) A selection of DOFs is presented for three sequential grips: thumb and index finger, wrist, elbow, and shoulder. (e) PCA performed on the J-space during the hold epoch allowed visualizing the grip types of all conditions and trials of one recording session (showing 1st and 2nd PCA component). (f–g) Raster plot shows the spiking activity of F5-neurons recorded from a single FMA (F5-ventral). (h) Mean firing rates during the grasp epoch (N-space) were transformed with CDA to reduce and visualize the multidimensional representation of the complete F5 population (N = 119, simultaneously recorded). In d,g, example trials t1, t2 and t3 are highlighted in yellow (hold epoch in d, grasp epoch in g) and marked with arrows in e,h. (i) Neuronal state space evolution shows the course of the task determined by the CDA. e,h and i: For visual comparison the N-space was aligned to the J-space using PCRA; Symbols and colours as in Figure 1b, symbol size corresponds to object size.
Figure 5 with 2 supplements

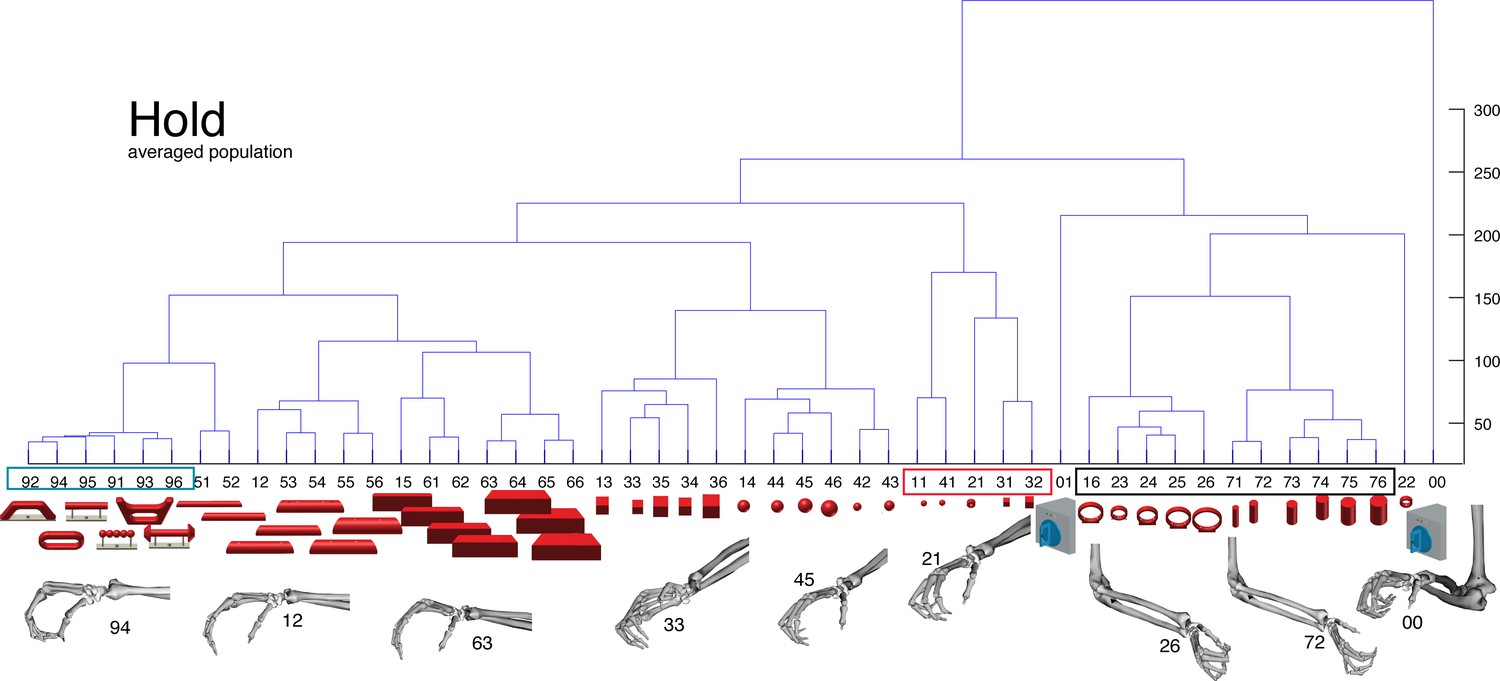
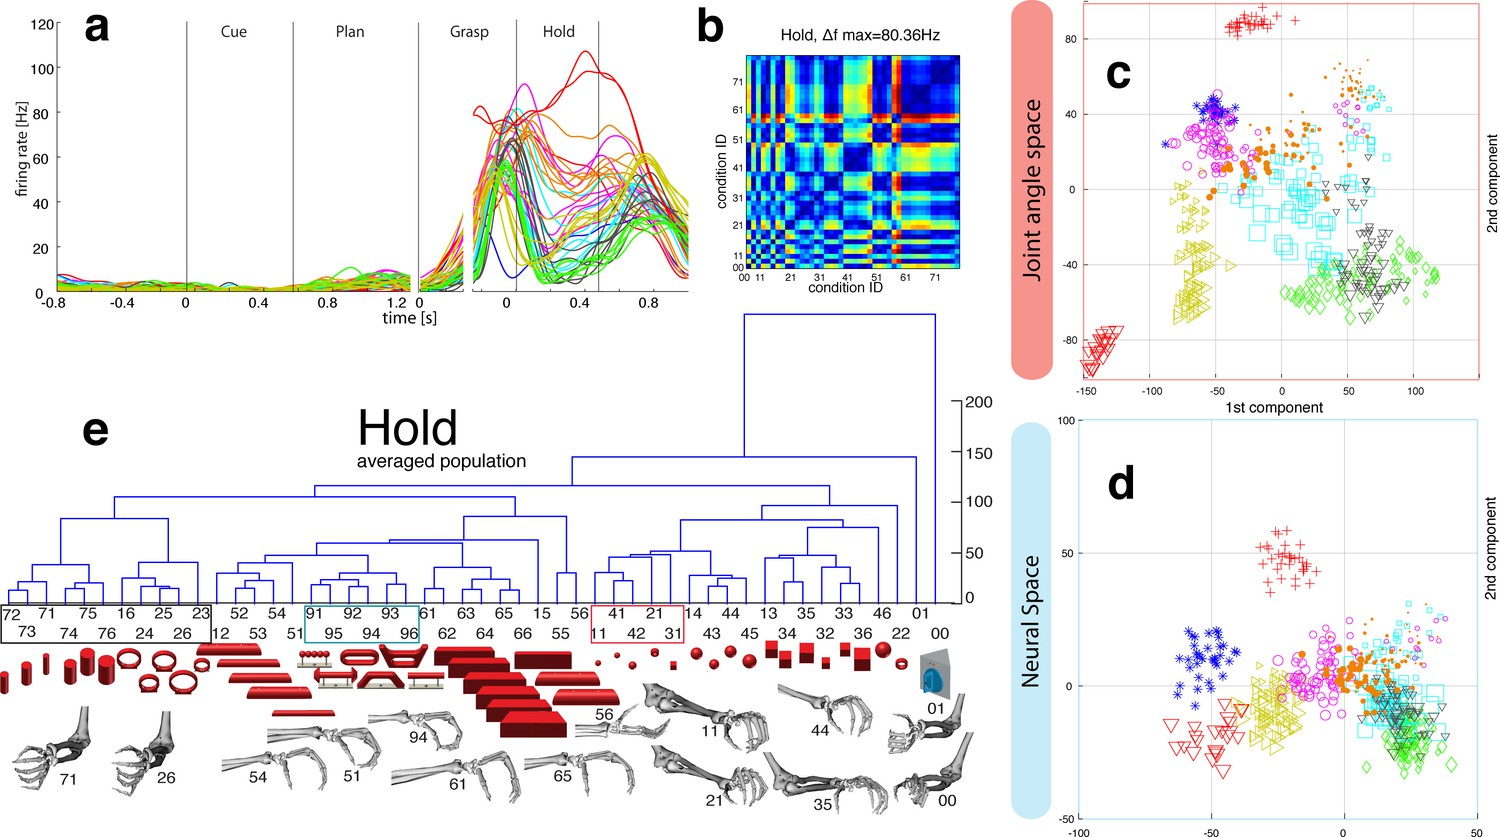
Hierarchical cluster analysis of the F5 population.
(a) Dendrogram of J-space (27 DOF). (b–c) Dendrogram of F5’s complete N-space during the plan and the grasp epoch. Condition numbers as in Figure 1b. A selection of grip types and their corresponding objects are illustrated. In a-c, similar motor characteristics are highlighted with coloured boxes (see text). (b,c) is based on the complete F5 population (N = 119, simultaneously recorded neurons), in contrast to its illustration in the reduced neural space in Figure 4. See Figure 5—figure supplement 1–2 for the averaged population results across all sessions of animal M and animal Z, respectively.
Figure 5—figure supplement 1

F5-Motor coding in animal M across all recording sessions.
Neural distances between each pair of group means were measured for each session, averaged across sessions, and visualized as dendograms for the (a) plan and (b) grasp epoch.
Figure 5—figure supplement 2

F5-Motor coding in animal Z across all sessions.
(a) Firing rate plot of F5 example unit. (b) Modulation depth plot of example unit during grasp epoch. (c) Reduced J-space of one session recorded with instrumented glove and (d) reduced N-space of F5 during the grasp epoch of the same session (simultaneously recorded, N = 76, first two components shown). (e–f) Neural distances between each pair of group means were measured for each session, averaged across sessions, and visualized as dendograms for the plan and grasp epoch. For c–e: Symbols and colours as in Figure 1b.
Figure 6 with 2 supplements
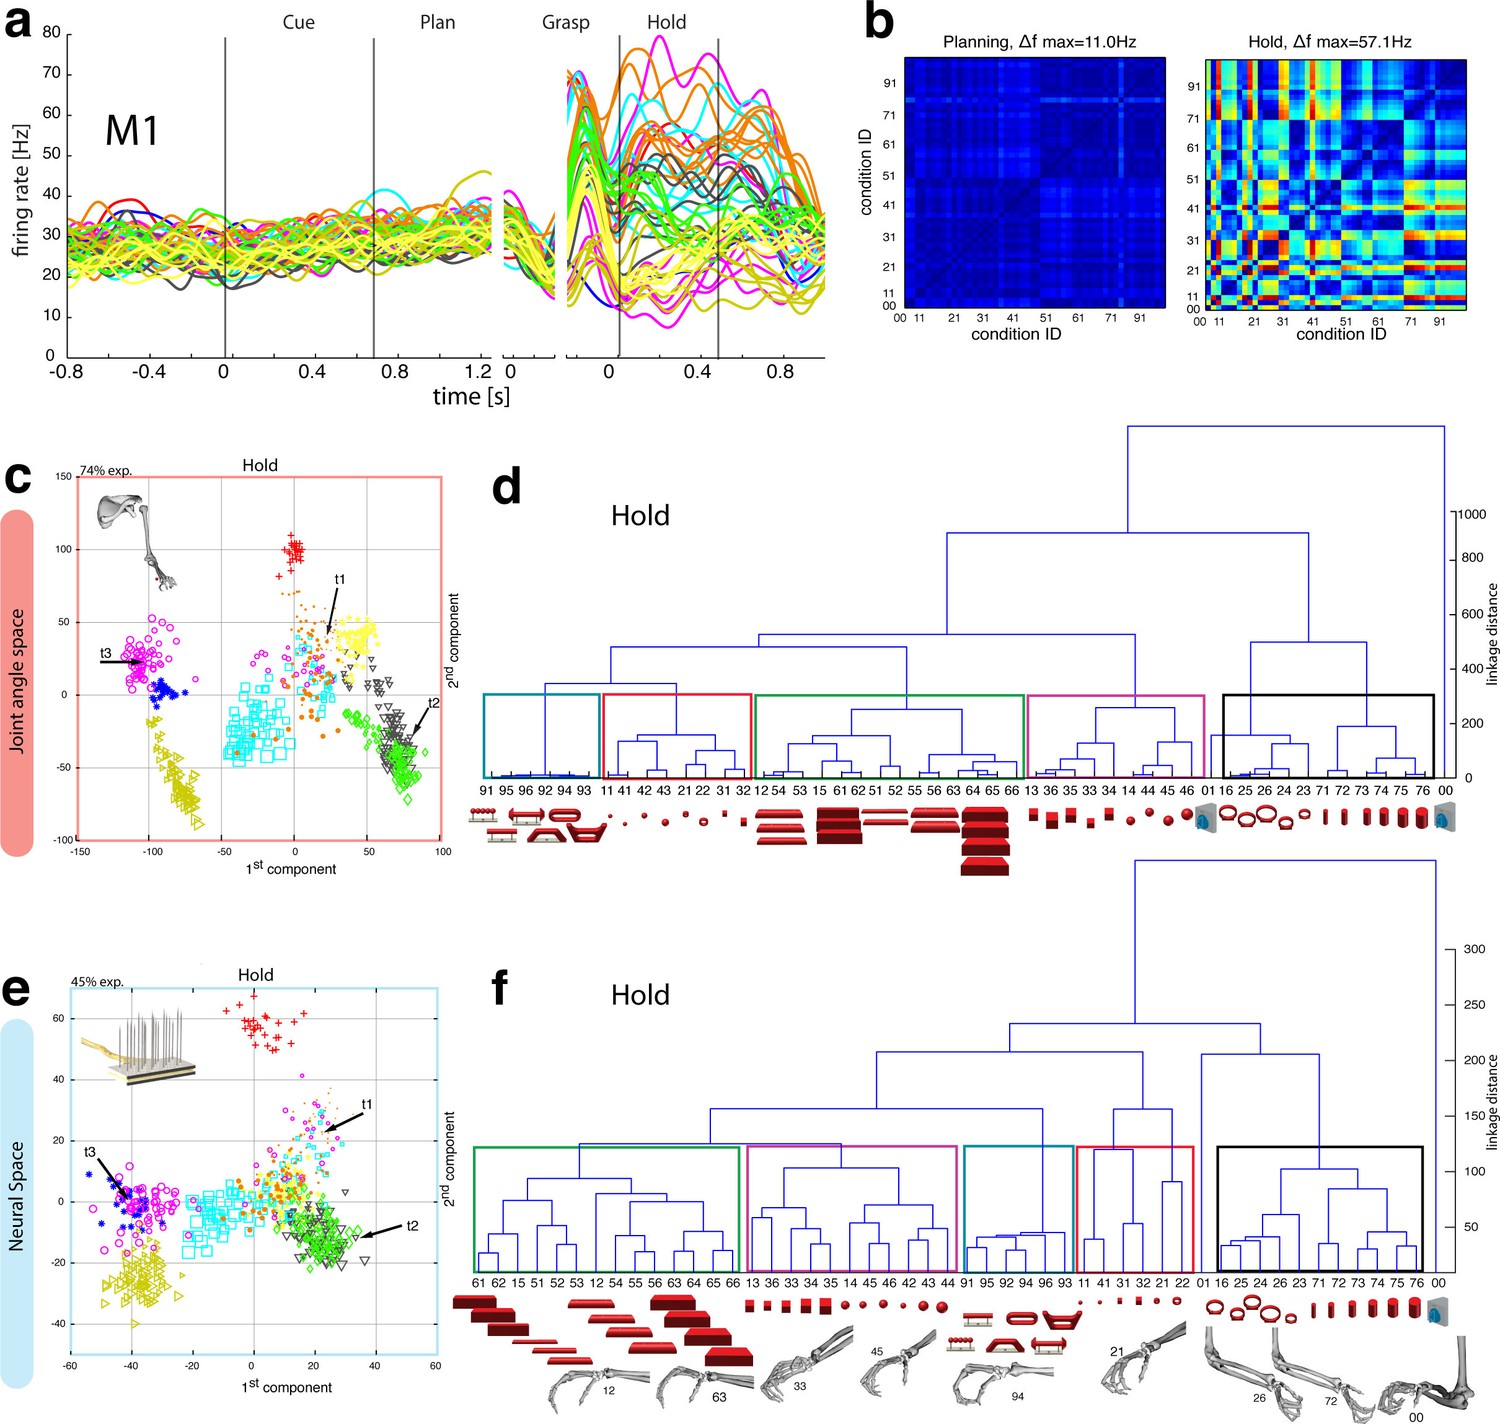
Motor execution in M1.
(a) Example neuron of M1 in monkey M, curves show firing rates separately for all 50 task conditions (colour code as in Figure 1b). (b) Modulation depth plots (as in Figure 4b) for the planning and hold epoch of the example neuron in a. (c) Population activity from the reduced and (d) the complete kinematic space (J-space) is compared to (e) the reduced and (f) the complete neural population space (N-space) of M1 during the hold epoch of the task (N = 151, simultaneously recorded). In e, N-space was aligned to J-space with PCRA; symbols and colours as in Figure 1b; symbol size corresponds to object size. Arrows t1-t3 highlight the example trials of Figure 4d,g. See Figure 6—figure supplement 1–2 for the averaged population results of animal M and animal Z, respectively.
Figure 6—figure supplement 1
M1-Motor coding in animal M across all sessions.
Neural distances between each pair of group means were measured for each session, averaged across sessions, and visualized as dendograms during the hold epoch.
Figure 6—figure supplement 2
M1-Motor coding in animal Z across all sessions.
(a) Firing rate plot of M1 example unit. (b) Modulation depth plot of example unit in hold epoch. (c–d) Reduced J-space of one session recorded with the instrumented glove and reduced N-space of M1 during hold epoch of the same session (simultaneously recorded, N = 62, first two components shown). (e) Neural distances between each pair of group means were measured for each session, averaged across all sessions, and visualized as dendograms. For c,d: Symbols and colours as in Figure 1b.
Figure 7
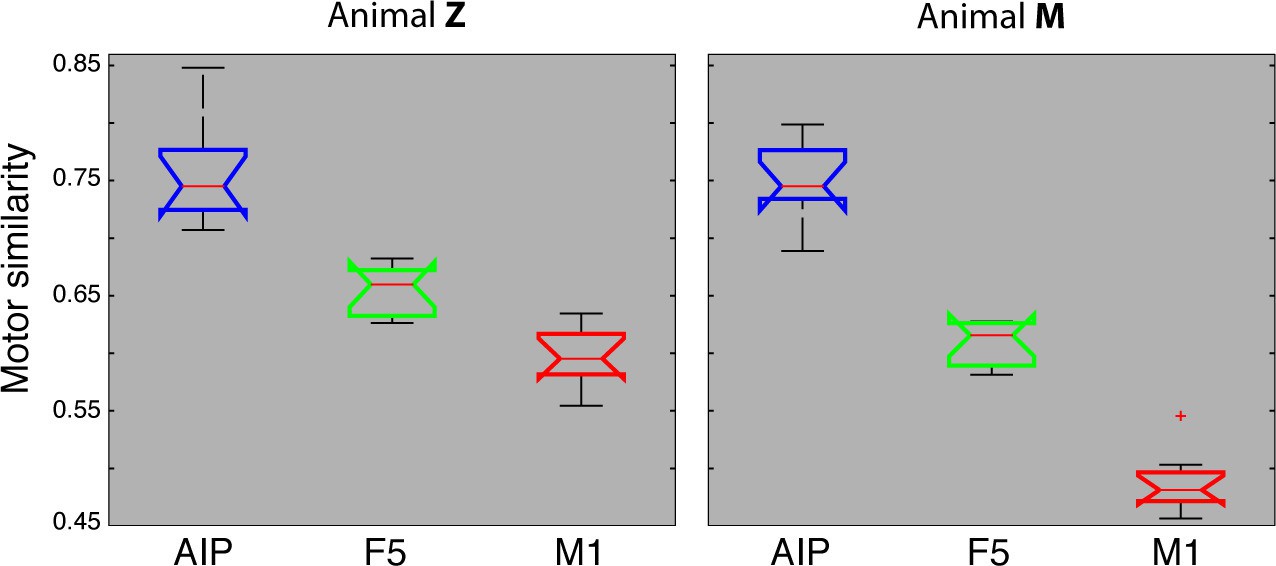
Motor similarity measure.
Boxplots illustrating similarity between the population coding of J-space and N-space during the hold epoch of the task, as provided by the PCRA analysis. Left: results in AIP, F5, and M1 across all 10 recording sessions for monkey Z. Right: same for monkey M. Red horizontal lines indicate median value, boxes show lower and upper quartile of data (25%–75%), and whiskers indicate maximum and minimal values.
Figure 8
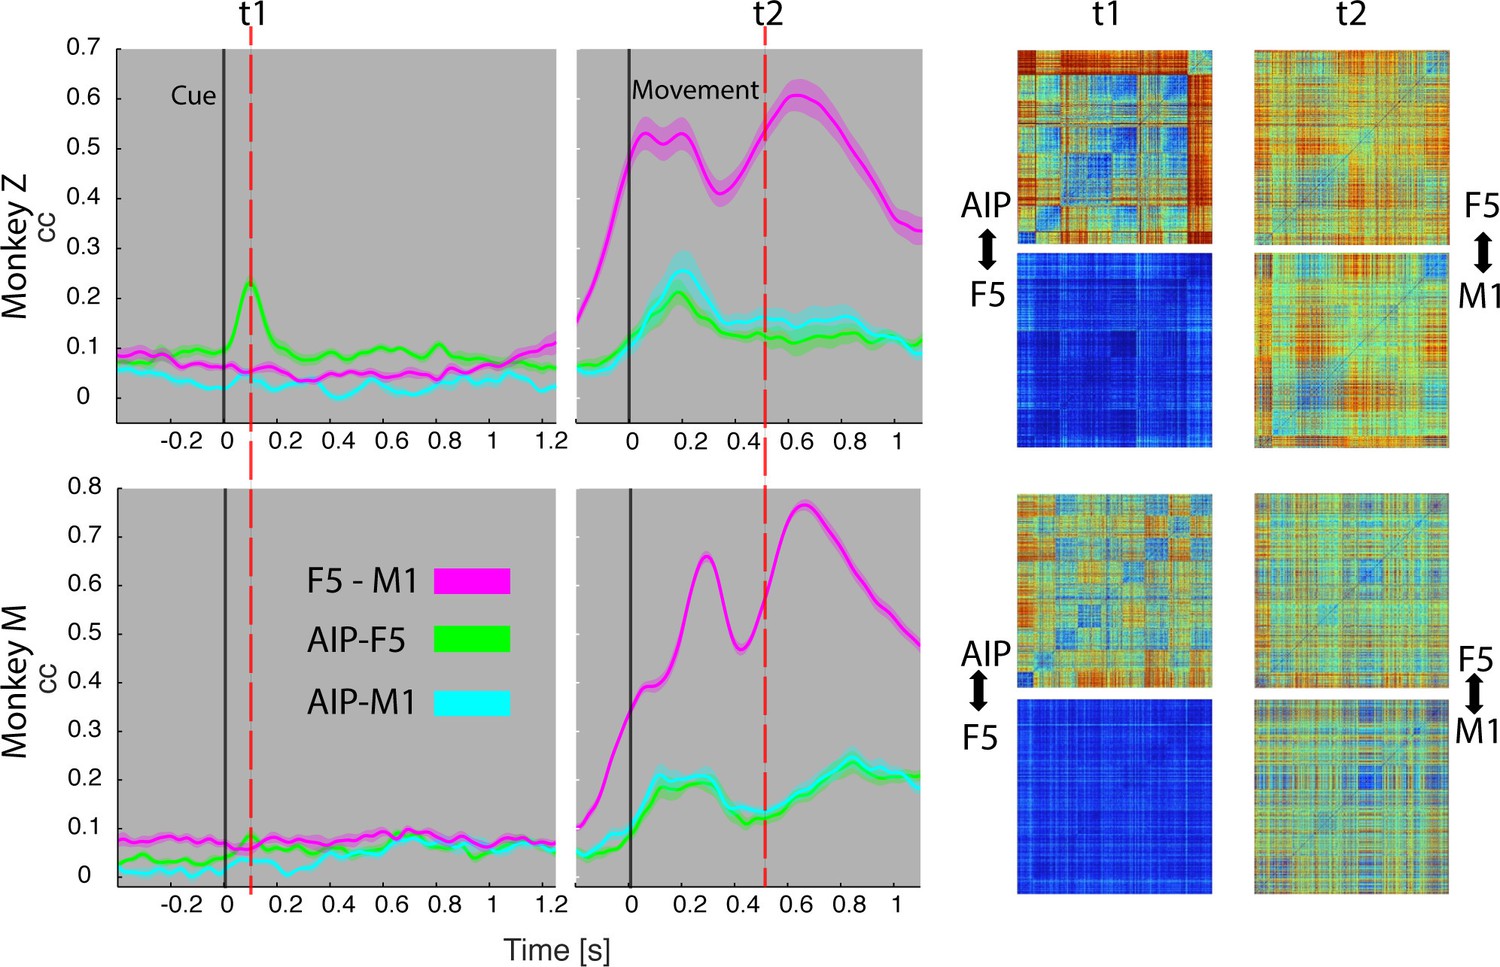
Temporal feature correlation between areas.
The distance (in firing rate) between all possible trial-pairs was computed separately in the N-space of area AIP, F5 and M1. The resulting distance maps thus represent the neuronal modulations of a population (e.g. AIP) for a specific time t. (Right) Example maps show the neural modulation patterns at key times t1 (object presentation) and t2 (during hold). Warm colours: long neural distances, cool colours: short neural distances. (Left) Correlating the neuronal patterns across time (Spearman’s r) allowed visualizing the similarity between the areas for animal Z (top row) and animal M (bottom row). For computation, spiking activity was aligned to the beginning of the cue and grasping onset. For an animation of the feature code correlation see Video 5.
Author response image 1

Visualization of (a) reduced and (b) complete population show perfectly overlapping clusters of small (black triangles, 51-54) and large cylinders (red triangles, 55-56) in the early cue phase (100 ms after cue onset).
These conditions start separating over time as shown in Figure 2c,d and Figure 2e,f.
Videos
Video 1
Experimental task.
A monkey grasped and held highly variable objects presented on a PC-controlled turntable. Note: For presentation purposes, the video was captured in the light.
Video 2
Hand and arm tracking.
18 joints of the primate hand were tracked with electromagnetic sensors and used to drive a 3-D primate-specific musculoskeletal model to extract 27 joint angles. Thumb, index, wrist, elbow, and shoulder angles are shown while the monkey is grasping a ring, a ball and a cylinder. The video runs at half speed.
Video 3
Population coding in AIP.
The first three canonical variables of the AIP population are shown in 3D and are animated for presentation purposes. Each symbol represents one trial. Symbols and colours as in Figure 1b.
Video 4
Population coding in F5.
Joint angles and the population activity of F5 were recorded together and for visual display reduced to their most informative dimensions (component 1 and 2). The video displays the evolving hand kinematics (top, left) and neuronal population activity (bottom, left) during three subsequent grasping actions. Arrows point at these trials in the J- (top, right) and N-space (bottom, right). The audio-track plays the spiking activity of an individual F5 neuron, which is highlighted in the raster plot in blue.
Video 5
Temporal feature correlation between areas.
The neural distance (in firing rate) between all pairs of trials within a neuronal population provided a modulation pattern between trials (top) for area AIP, F5, and M1. Correlating these neuronal patterns for each moment in the task allowed visualizing the coding similarity between pairs of areas across time (AIP-F5 in green, AIP-M1 in cyan, and F5-M1 in magenta). Feature correlations are based on all trials, whereas the presented object and corresponding grasp movement are shown for an example trial.
Download links
A two-part list of links to download the article, or parts of the article, in various formats.
Downloads (link to download the article as PDF)
Open citations (links to open the citations from this article in various online reference manager services)
Cite this article (links to download the citations from this article in formats compatible with various reference manager tools)
Object vision to hand action in macaque parietal, premotor, and motor cortices
eLife 5:e15278.
https://doi.org/10.7554/eLife.15278


