Persistent neural activity in auditory cortex is related to auditory working memory in humans and nonhuman primates
- Leibniz Institute for Neurobiology, Germany
- Otto-von-Guericke-University, Germany
Figures
Figure 1 with 3 supplements
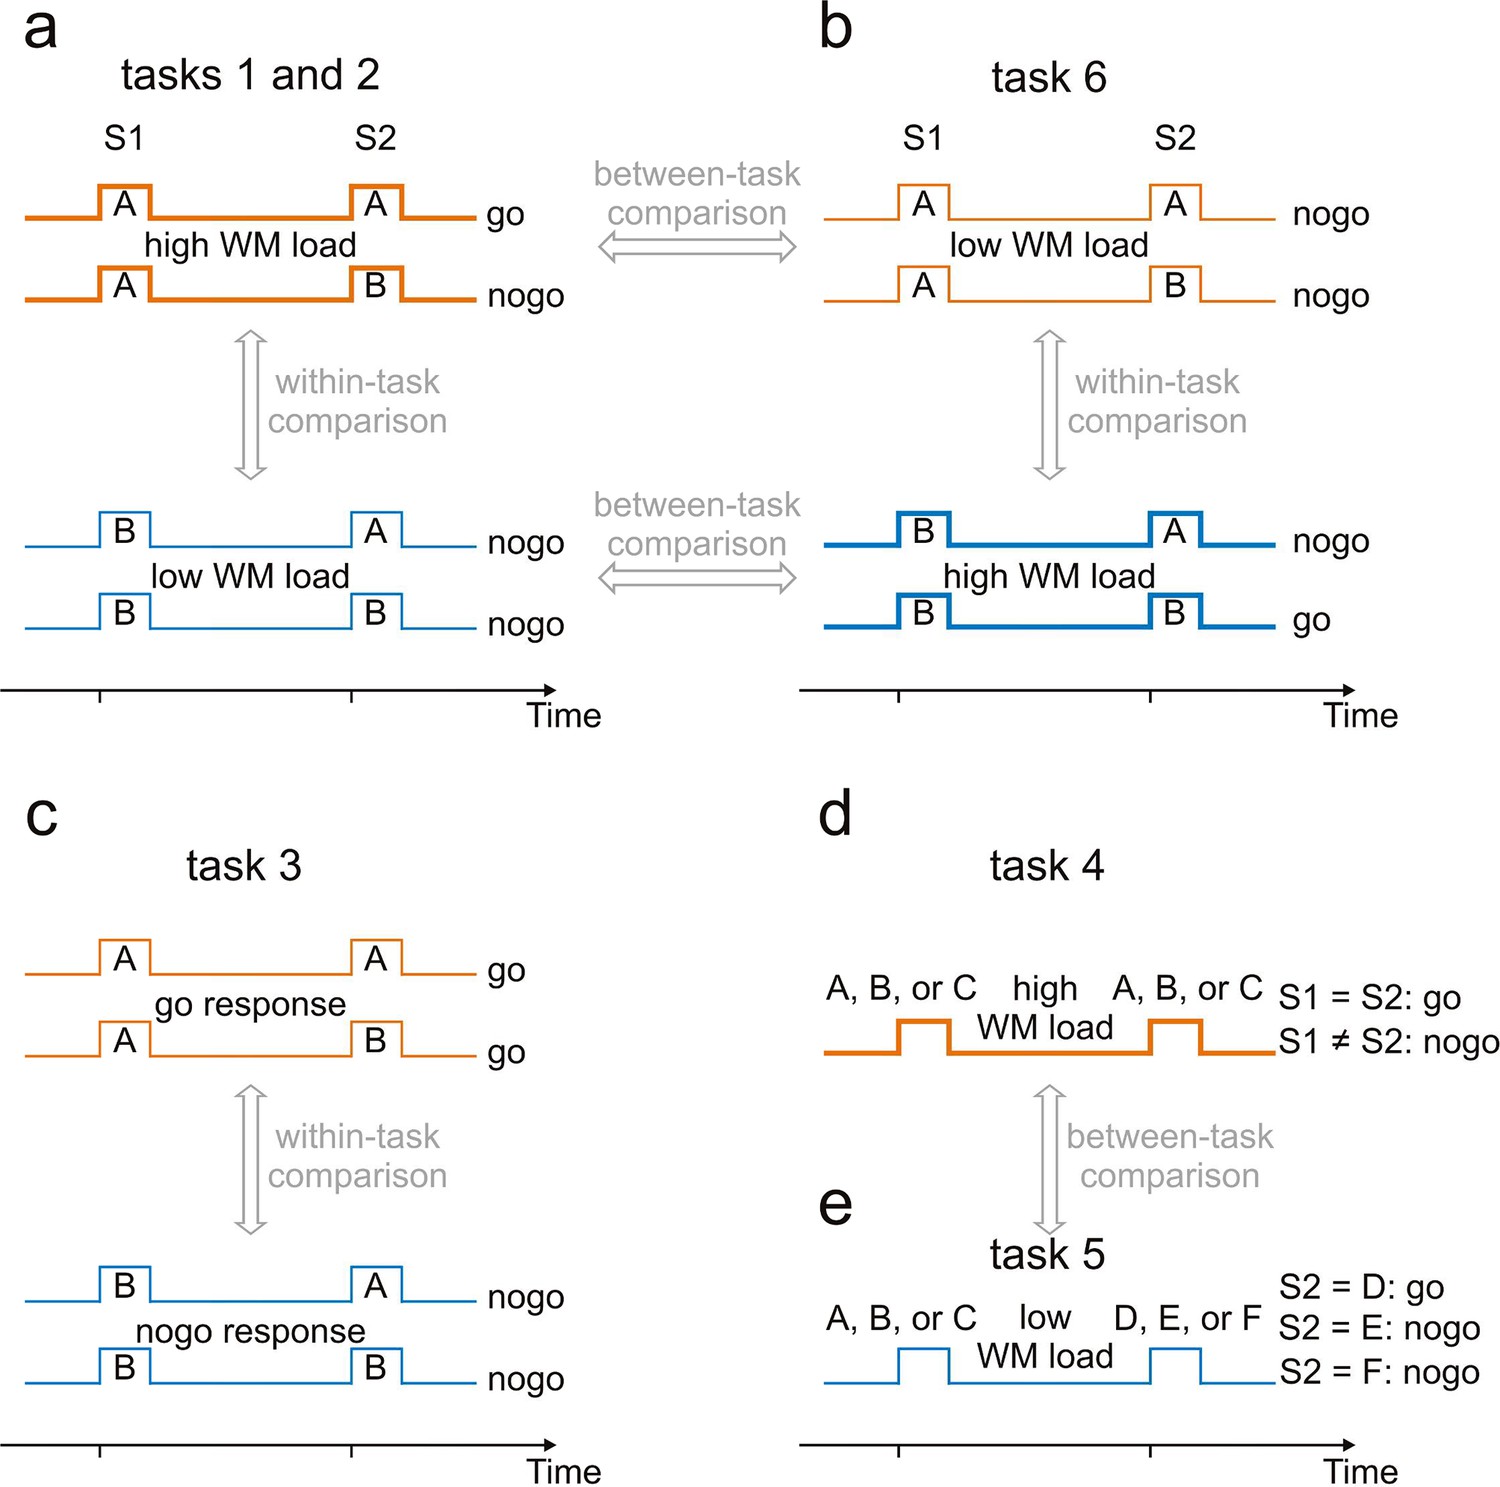
Experimental paradigms used to identify working-memory related neural activity.
A sequence of two stimuli, S1 and S2, separated by a delay, was presented on every trial. Tasks associated with these sequences differed. For tasks 1, 2, 3 and 6, four sequences (AA, AB, BA and BB) were used. A and B represent tones of different frequencies. For task 4, S1 and S2 were tones of three different frequencies, A, B or C. For task 5, S1 was also a tone (of frequency A, B or C), whereas S2 was a noise burst (D), a frequency-modulated tone (E) or a click train (F). (a) Tasks 1 and 2 required a go response for sequence AA and a nogo response for the other sequences. The WM load was higher when S1 was A (thick orange traces) than when it was B (thin blue traces). Tasks 1 and 2 differed with respect to the hand used for the responses. Putative WM-related activity was identified by a within-task comparison. (b) Task 6 required a go response for sequence BB and a nogo response for the other sequences. The partial changes of stimulus-response associations relative to those of task 1 enabled WM-related activity to be revealed also by between-task comparisons. (c) Task 3, a delayed-response task, required a go response when S1 was A and a nogo response when it was B, irrespective of the frequency of S2. Potential differences in activity related to preparation for go and nogo responses could be revealed by comparing activity during the delay of trials requiring go responses (thin orange traces) and nogo responses (thin blue traces). (d) Task 4, a delayed-match-to-sample task, required a go response when S1 and S2 were identical and a nogo response otherwise. (e) Task 5, a sound-discrimination task, required a go response when S2 was the noise burst and a nogo response when S2 was the click train or the frequency-modulated tone, irrespective of the frequency of S1. WM-related activity was revealed by comparing activity during the delay in tasks 4 and 5. Feedback of whether the response was correct or not was provided to the human subjects in tasks 4 and 5 and to the monkeys in tasks 1 and 6. The human subjects were shown a smiling face immediately after a correct response and a frowning face after an incorrect response. For the monkeys, a drop of water was provided immediately after correct go and nogo responses.
Figure 1—figure supplement 1
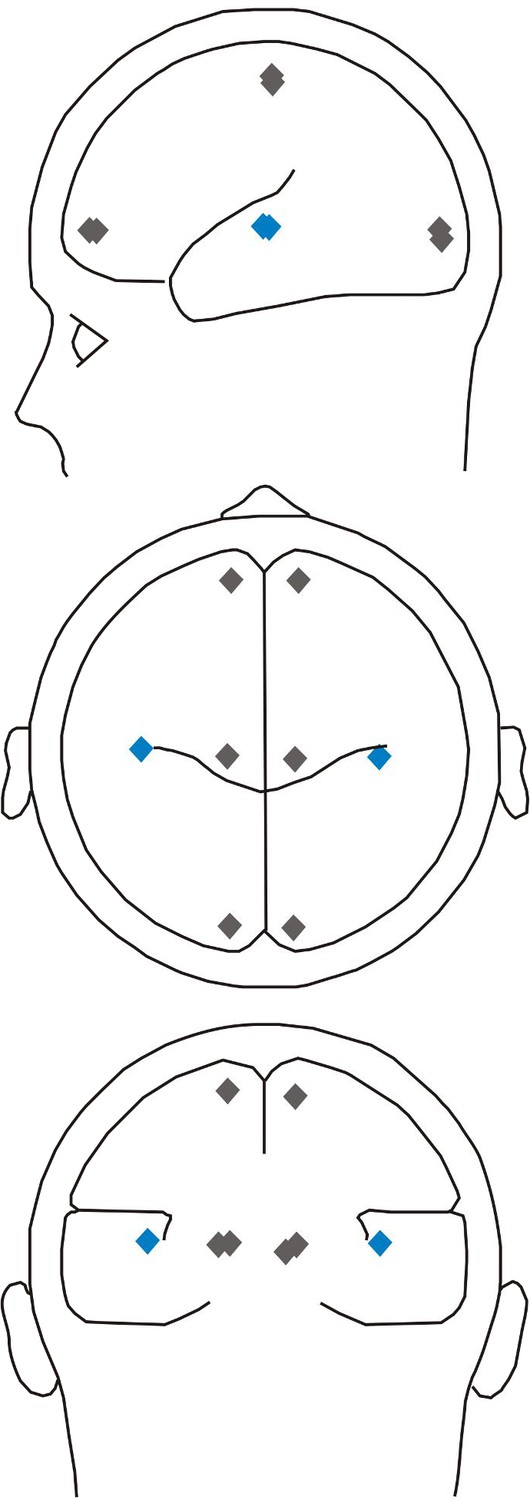
Schemes of source positions used for the analysis of the MEG data.
In each panel, the blue diamonds mark the locations of the regional sources seeded in the upper part of Heschl's gyrus in both ACs, as projected onto planes showing views of the head from left (top panel), top (middle panel), as well as back (bottom panel). The gray diamonds mark six additional sources seeded in central, frontal and occipital cortical areas in both hemispheres.
Figure 1—figure supplement 2
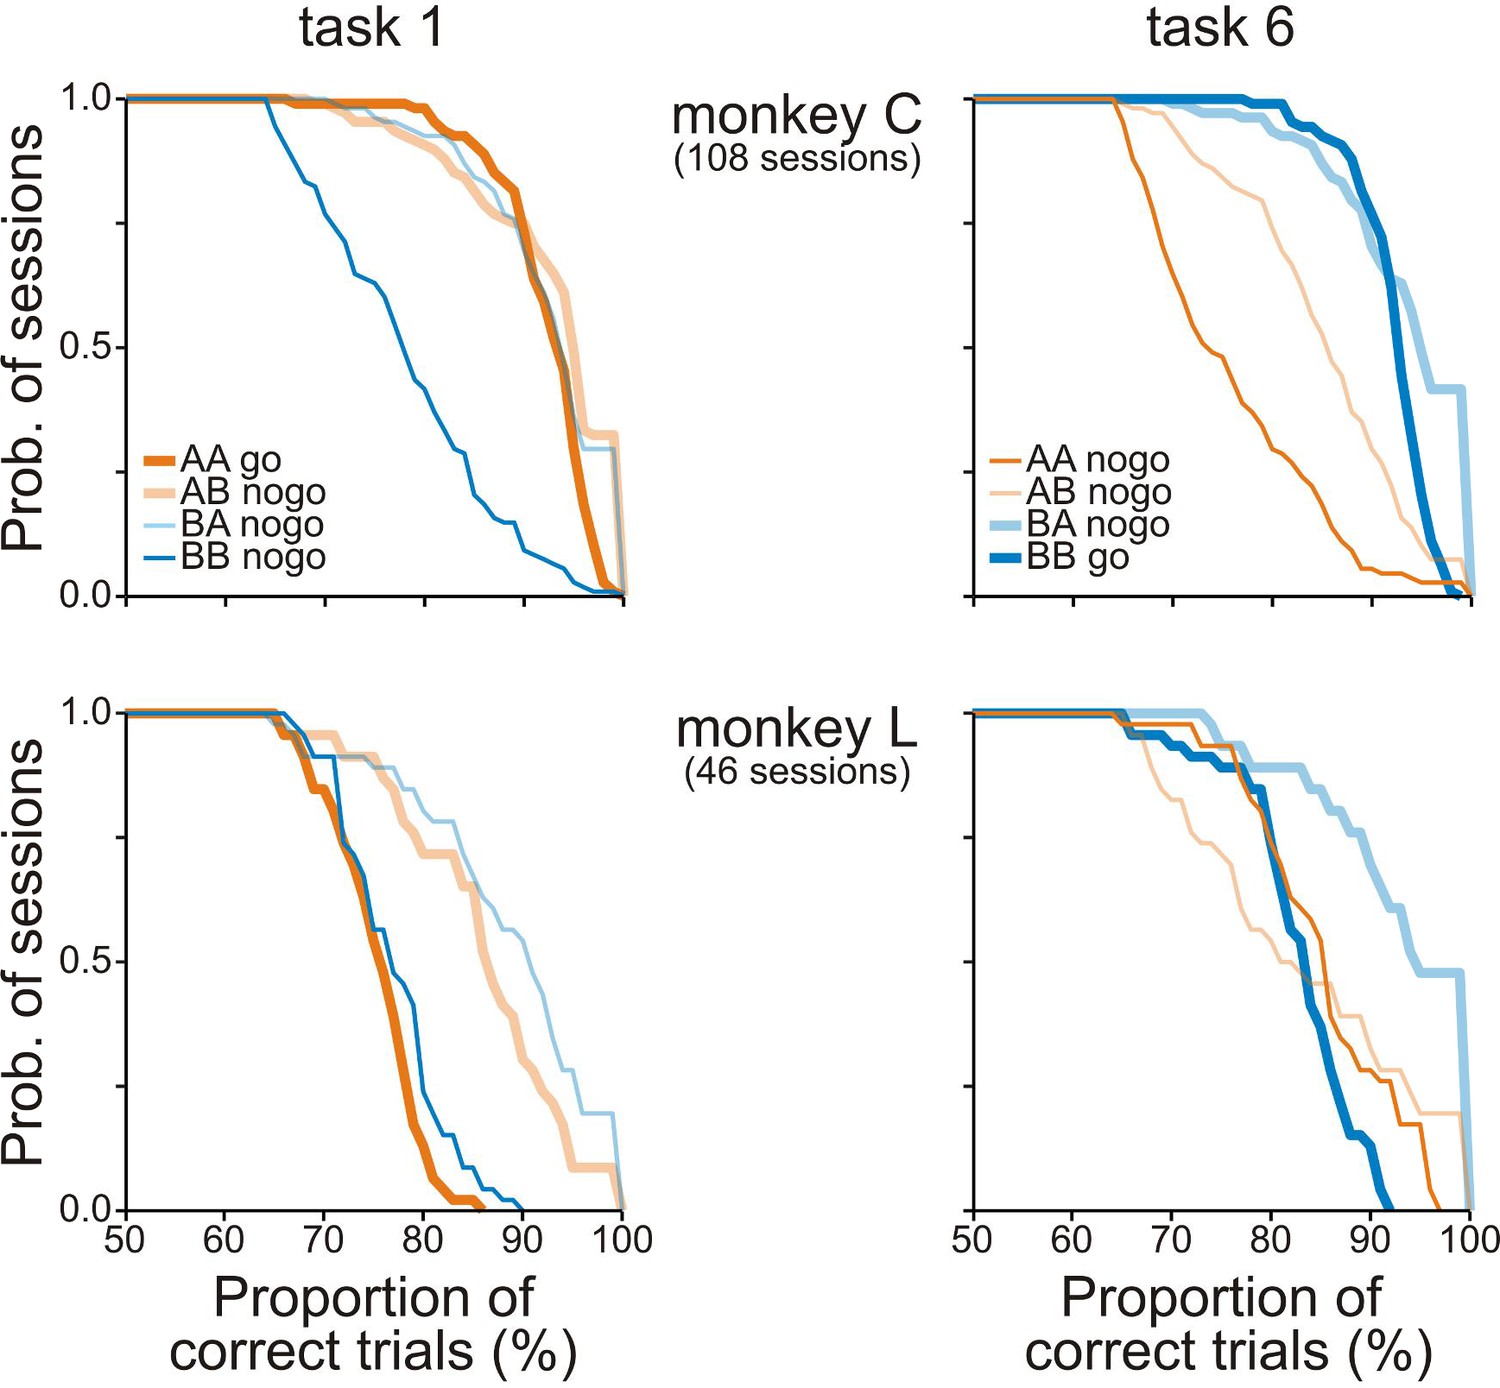
Behavioral performance of monkeys C and L in the working-memory tasks.
Distributions of the proportions of correct trials for each sequence in task 1 (left column) and task 6 (right column) from monkeys C (top row) and L (bottom row). Thick and thin traces represent high- and low-WM-load trials, respectively. Orange and blue traces represent trials when S1 was 3 kHz (tone A) and when it was 1 kHz (tone B), respectively. The ordinate shows the probability of sessions with the proportion of correct trials equal to or greater than that specified by the value on the abscissae. The proportion of correct trials was ≥65% for all sequences in both tasks. The pattern of the proportion of correct trials across sequences suggests that the monkeys mainly utilized WM to solve the two tasks.
Figure 1—figure supplement 3
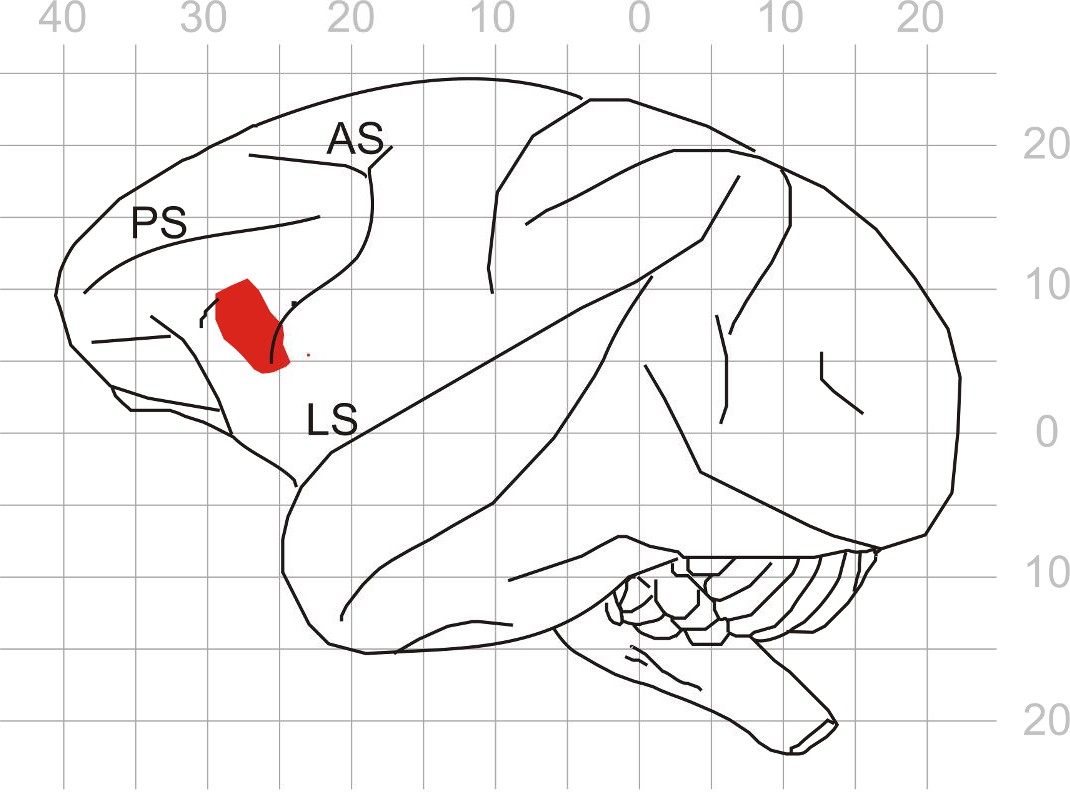
Demonstration of the recording area in prefrontal cortex.
The red patch indicates the recording area on a lateral view of the macaque left hemisphere. The gray rids are the stereotactic coordinates according to Szabo and Cowan (1984). LS, Lateral Sulcus; PS, Principal Sulcus; AS, Accurate Sulcus.
Figure 2
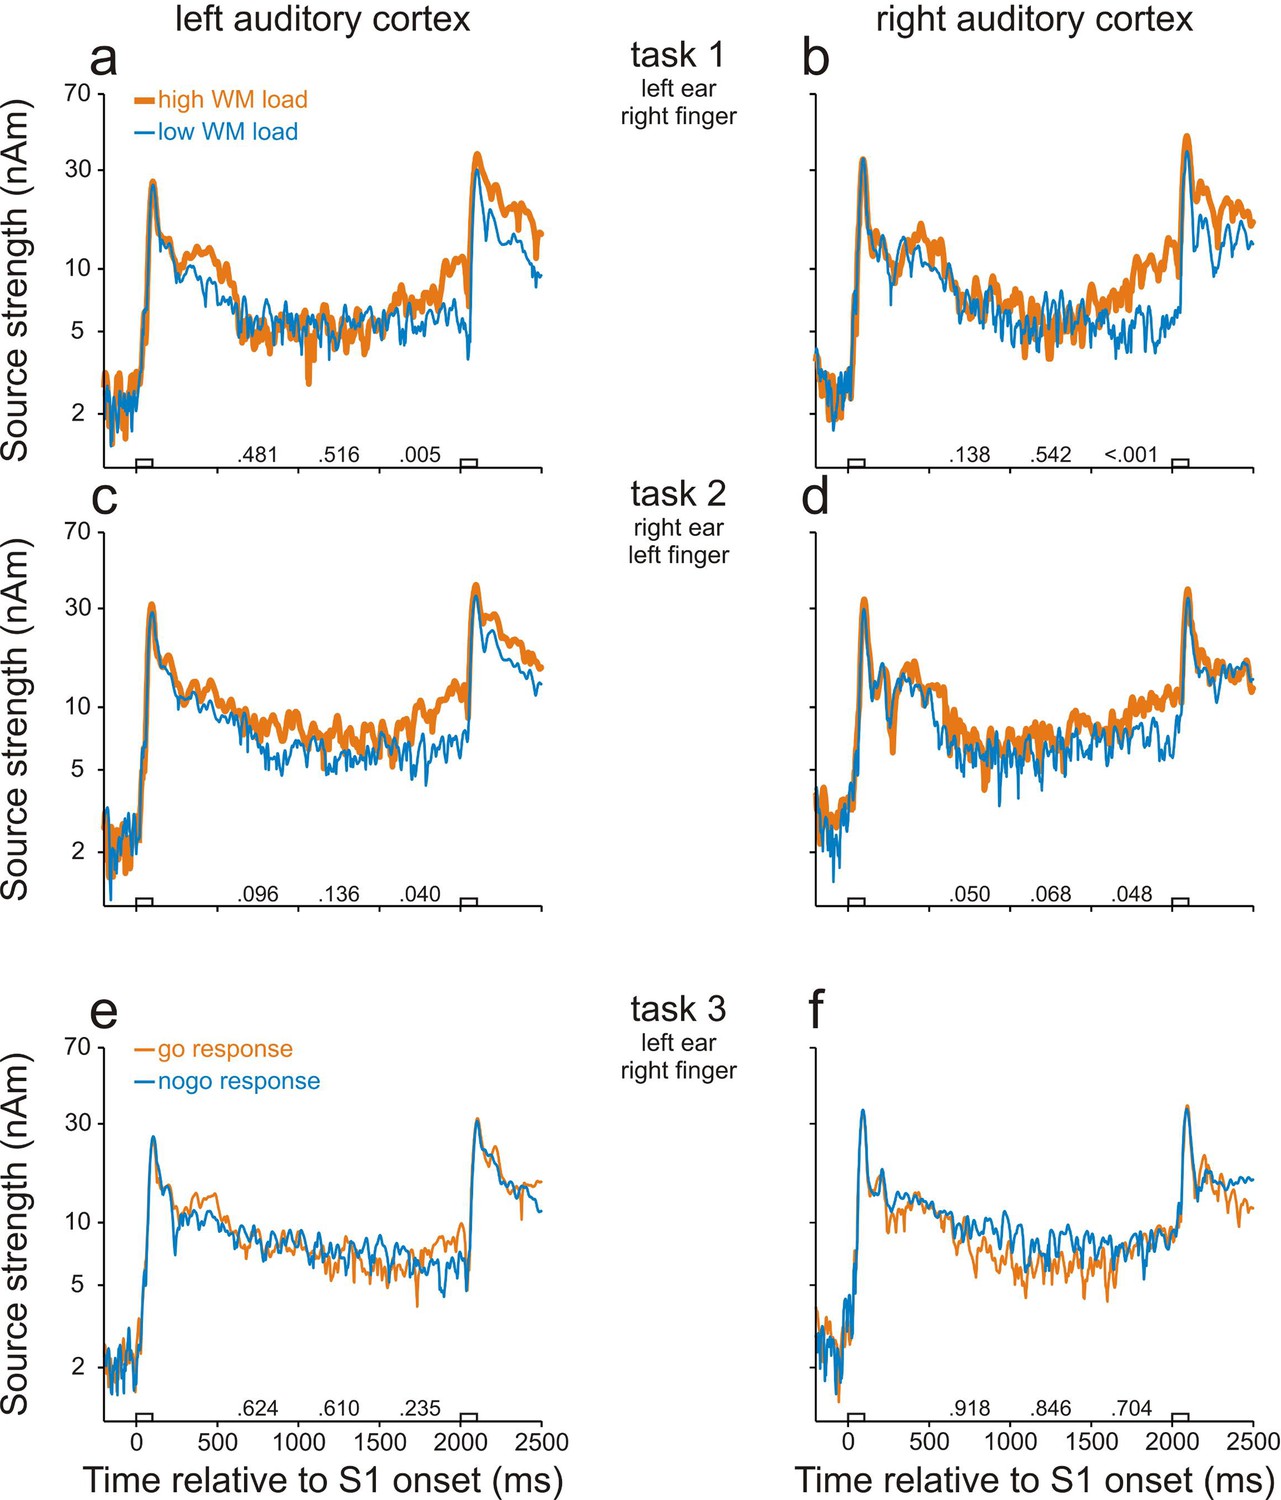
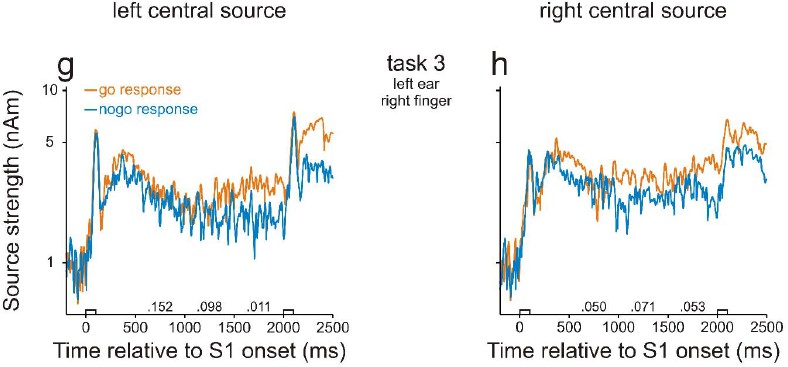
Working-memory related neural activity in human auditory cortex identified in study 1.
Strengths of the sources in AC in task 1 (a, b), task 2 (c, d) and task 3 (e, f). Data from the left and right hemisphere are shown in the left and right column, respectively. Each trace represents the grand geometric mean source waveform derived from MEG recordings in 12 subjects. Thick orange and thin blue traces in a–d represent source strengths in high- and low-WM-load trials, respectively. Thin orange and thin blue traces in e–f represent source strengths in go and nogo trials, respectively. The empty bars on the abscissae represent the timing and duration of S1 and S2. The numbers on the abscissae are the p-values of permutation tests for the ratios of the source strength in high- to that in low-WM-load trials or in go to that in nogo trials during the three 500-ms periods of the delay. Note that the ordinates have logarithmic scaling. Also note that the differences in the left and right AC in tasks 1 and 2 reflect differences in WM load.
Figure 3
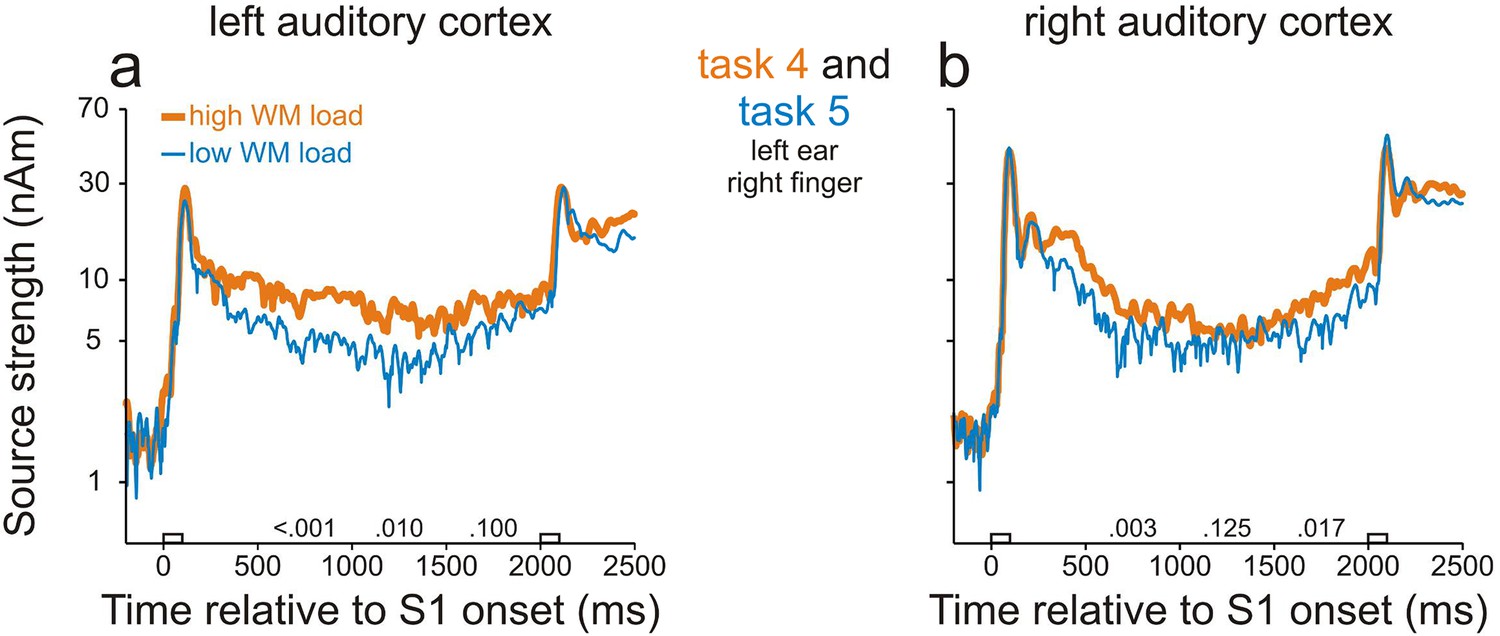
Working-memory related neural activity in human auditory cortex identified in study 2.
Sources in the left (a) and right (b) AC were stronger in task 4 in which WM load was high (thick orange traces) than in task 5 in which WM load was low (thin blue traces). Each trace represents the grand geometric mean source waveform across 15 subjects. Other conventions as in Figure 2.
Figure 4 with 1 supplement
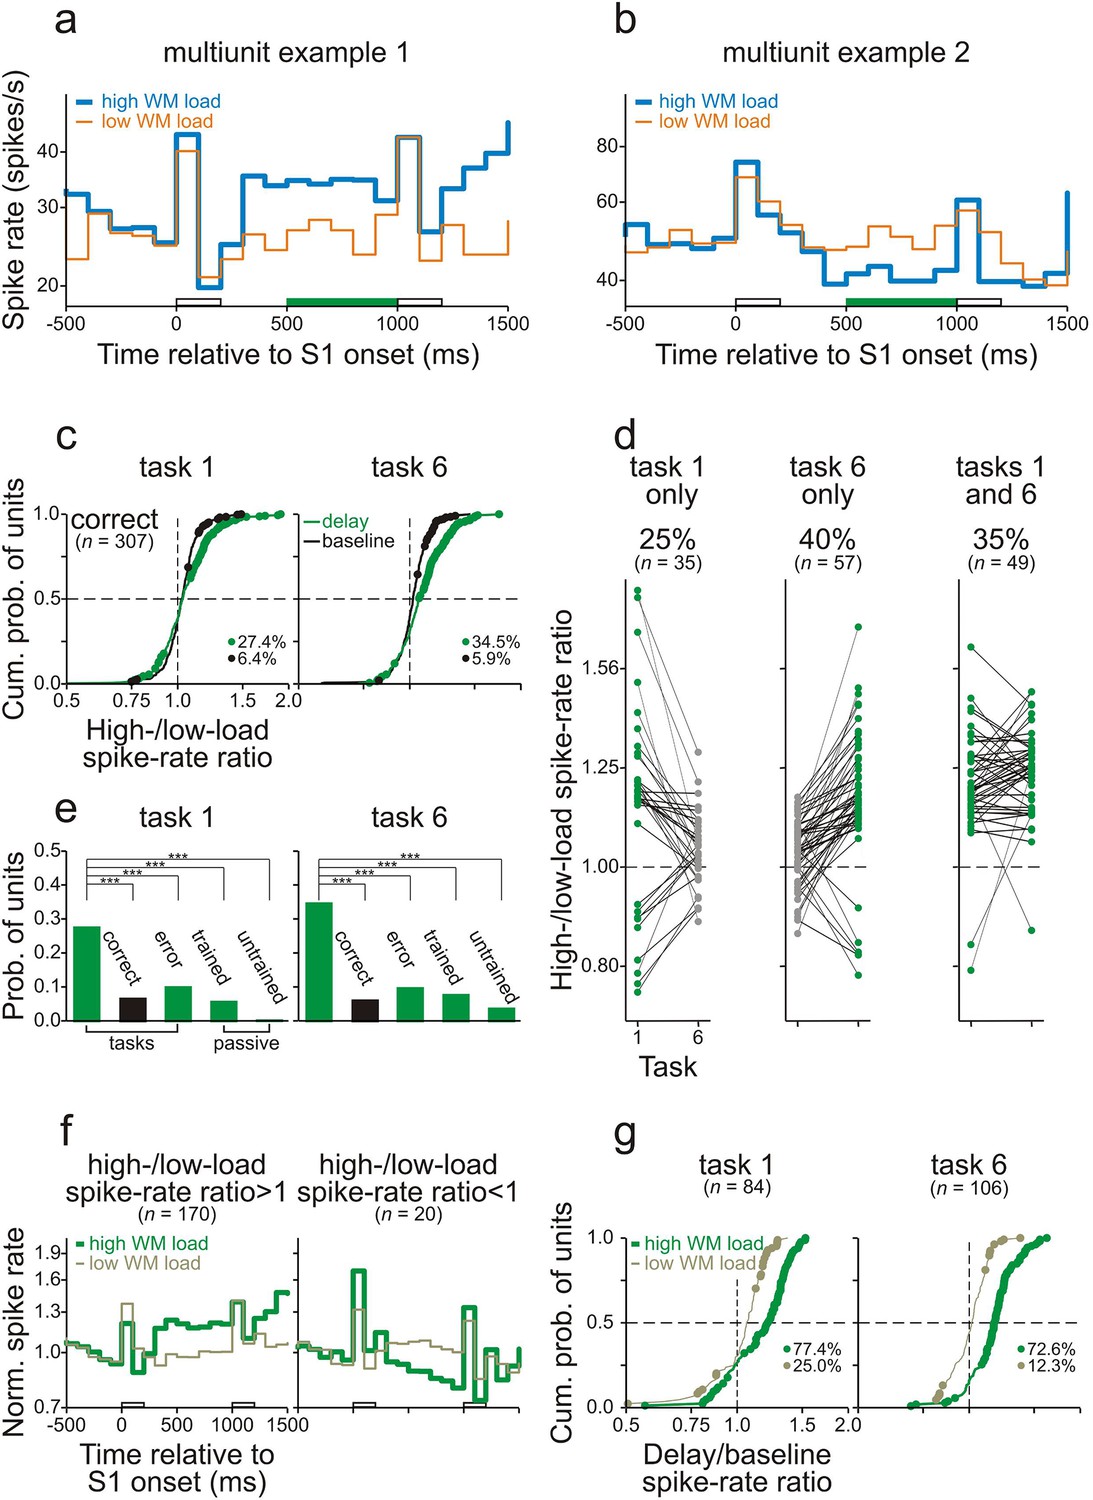
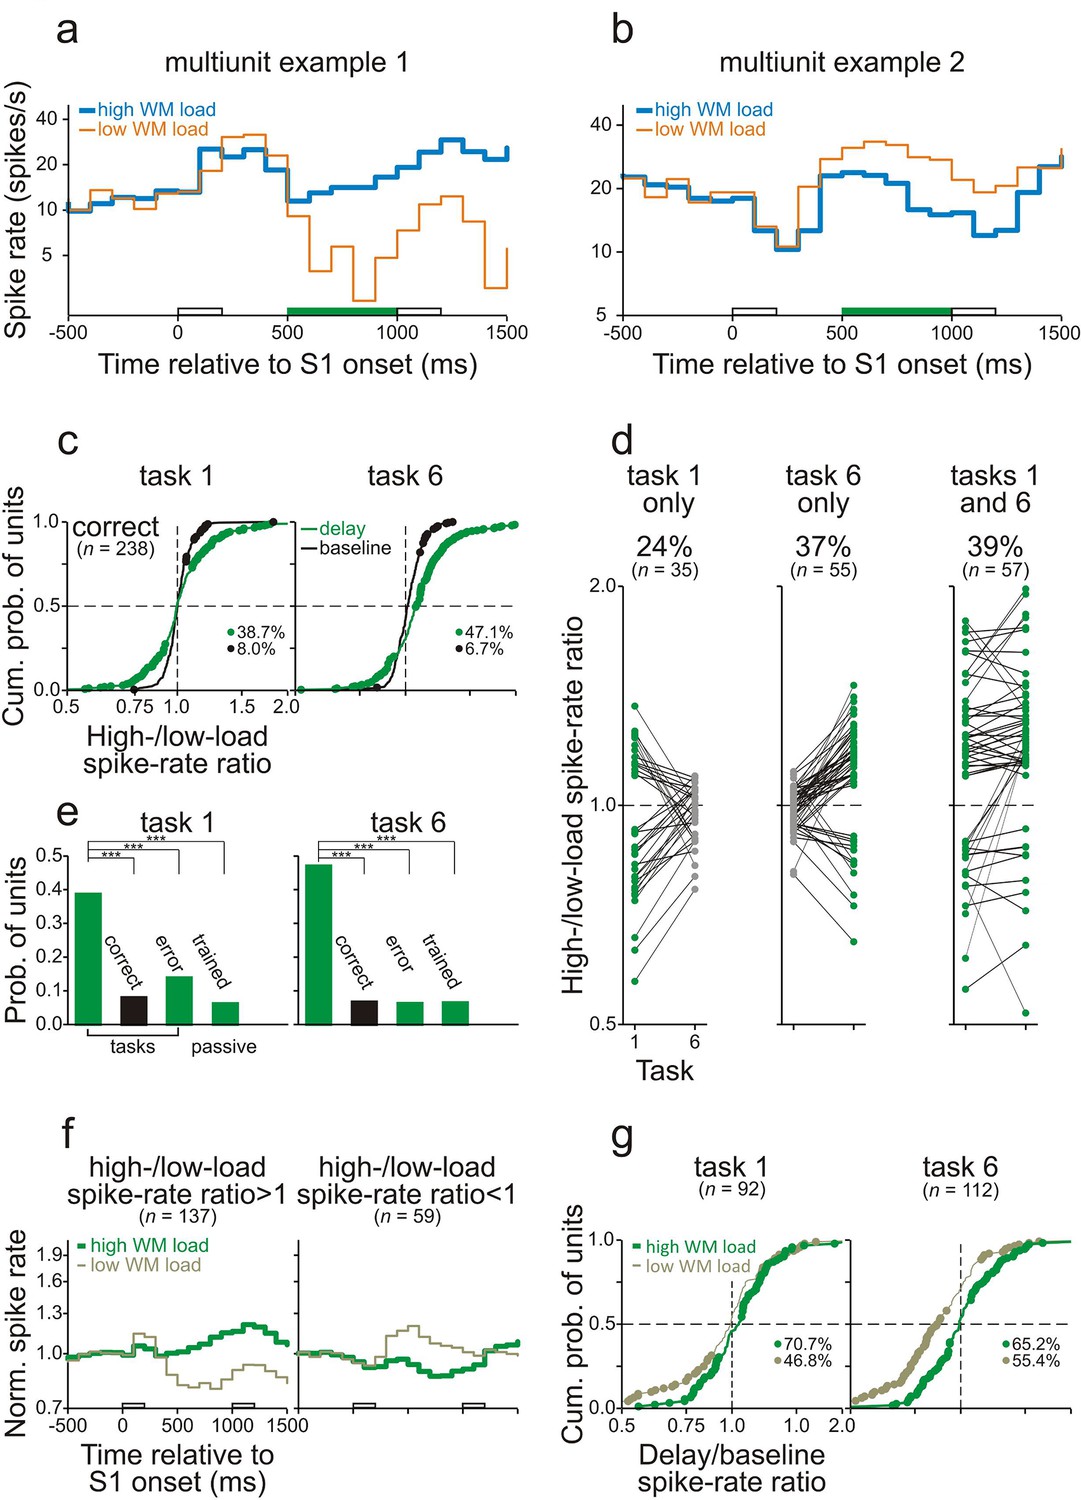
Working-memory related spike activity in monkey auditory cortex.
(a, b) The spike rates of two representative multiunits recorded in AC while the monkeys performed task 6 correctly. Thick and thin traces represent spike rates in high- and low-WM-load trials, respectively. S1 was 1 kHz (blue) in high-WM-load trials and 3 kHz (orange) in low-WM-load trials. The green bars on the abscissae represent the final 500 ms of the delay during which the high-/low-load spike-rate ratios differed significantly from 1. In the example in panel a, the spike rate is higher, and in the example in panel b lower, in high- than in low-WM-load trials. The empty bars on the abscissae represent the timing and duration of S1 and S2. (c) The high-/low-load spike-rate ratios during the final 500 ms of the delay (green) and during the 500 ms directly before S1 (baseline; black) for all multiunits. Significant ratios are marked by dots. The proportions of units with significant ratios are also provided. Left and right panels show the ratios obtained when the monkeys performed task 1 and task 6 correctly. The horizontal dashed lines mark the median cumulative probability and the vertical dashed lines the ratio of 1. (d) Task and stimulus specificity of high-/low-load spike-rate ratios during the final 500 ms of the delay. Ratios obtained from a given unit in tasks 1 and 6 are connected by a line. Spike-rate ratios which are significantly different from 1 are represented by green dots, those which are not by gray dots. The left, middle, and right panels show the data from all units where the ratios were significantly different from 1 in task 1 only, in task 6 only, or in tasks 1 and 6, respectively. The 65% of units with significant ratios in one task only are considered to be involved in WM. The proportions and the numbers of units in the three groups are also provided. (e) Dependence of the occurrence of significant high-/low-load spike-rate ratios on the behavioral context. The green bars show the probability of units with significant ratios during the delay of correct trials, of error trials, and during passive conditions in the two trained monkeys and in the untrained monkey. The black bar shows the probability of units with significant ratios during the baseline of correct trials. The asterisks indicate significant differences between the conditions (chi-square test, one-tailed, p<0.001). (f) The mean spike rates in high- (thick traces) and low-WM-load trials (thin traces) for units with high-/low-load spike-rate ratios significantly >1 (left panel) or <1 (right panel). They were obtained by geometric averaging after normalizing each response to baseline. (g) Dominance of delay enhancement in AC. Distributions of the delay/baseline spike-rate ratios are shown separately for high- and low-WM-load trials and for task 1 and task 6. Ratios >1 represent delay enhancement and ratios <1 delay suppression. Significant ratios are marked by dots. Analyses were performed only on units with significant high-/low-load spike-rate ratios during the final 500 ms of the delay (panel c). The proportions of units with significant delay/baseline spike-rate ratios are also provided for high- and low-WM-load trials, respectively.
-
Figure 4—source data 1
Working-memory related neuronal activity identified by between-task comparison.
The table shows numbers and percentages (in brackets) of recording sites where the neuronal activity during the final 500 ms of the delay was significantly different in high- and low-WM-load trials with the same S1s (p<0.05, permutation test). Numbers of sites with significant differences in spike activity in core fields of AC, in the LFP in core fields of AC, and in spike activity in vlPFC are presented in rows. Numbers of sites with a significant difference only when S1 was A (tone A only), only when S1 was B (tone B only), or when S1 was A and when it was B (tones A and B), are presented in separate columns. The total number of recording sites was 307 for spike activity in core fields of AC, 310 for the LFP in core fields of AC, and 238 for spike activity in vlPFC.
- https://doi.org/10.7554/eLife.15441.009
Figure 4—figure supplement 1

Working-memory related spike activity of single units in monkey auditory cortex.
Conventions in panel a are equivalent to those of Figure 4c, and those in panel b equivalent to those of Figure 4d.
Figure 5 with 1 supplement
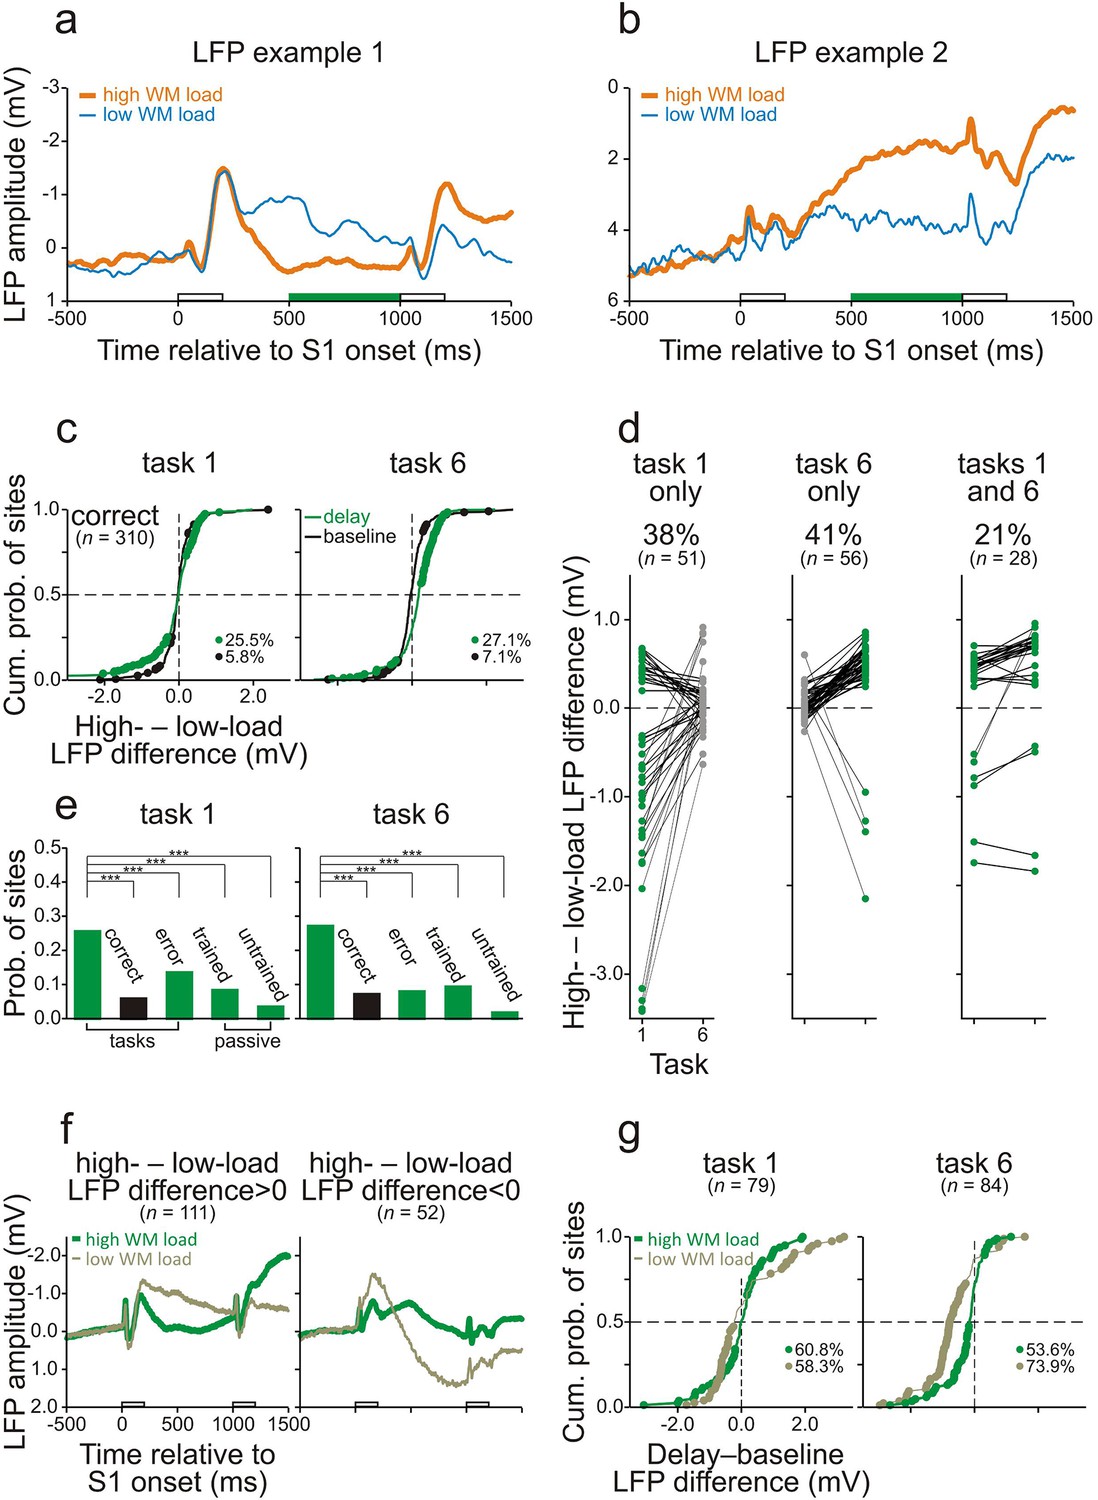
Working-memory related potentials in monkey auditory cortex.
(a, b) Representative local field potentials (LFPs) recorded at two different sites in AC of the two monkeys while they performed task 1 correctly. The organization of the figure and other conventions are equivalent to those of Figure 4. LFPs were compared by subtracting the LFP amplitude in low-WM-load trials from that in high-WM-load trials (high- – low-load LFP difference). In panel g, LFPs were compared by subtracting the mean LFP amplitude during the 500-ms period before S1 (baseline) from that during the final 500 ms of the delay (delay–baseline LFP difference).
Figure 5—figure supplement 1
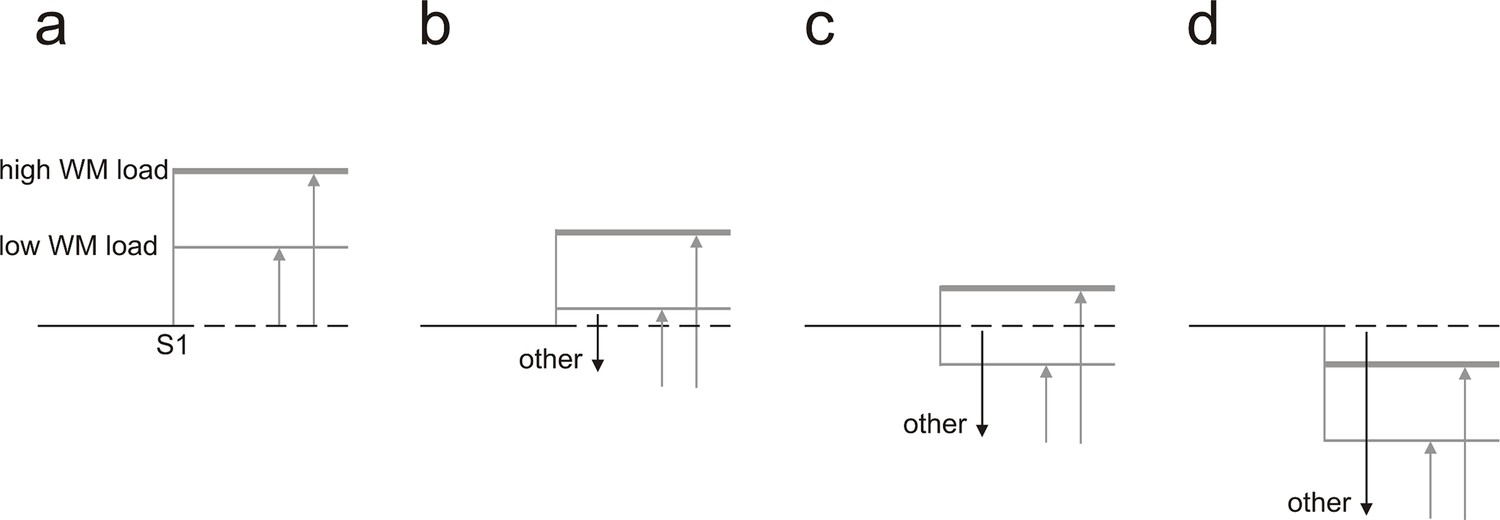
Scheme of the superposition of the effects of working memory and other mental processes on neural activity.
In all scenarios illustrated, WM is assumed to cause enhancement of neural activity after the first stimulus (S1) relative to that before S1 (baseline). The degree of enhancement increases with WM load and is represented by the length of the upward-pointing arrows. Mental processes other than WM are assumed to cause suppression whose degree, represented by the length of the downward-pointing arrows, varies between panels. In the absence of other mental processes (a), low WM load (thin gray line) is associated with less delay enhancement than high WM load (thick gray line). This relationship holds as long as other mental processes are associated with a degree of suppression smaller than the degree of enhancement associated with low WM load (b). When the degree of suppression exceeds that of the enhancement associated with low WM load, but not that associated with high WM load, high WM load will still be associated with delay enhancement but low WM load will be associated with delay suppression (c). When the degree of suppression associated with the other mental processes also exceeds the degree of enhancement associated with high WM load, both high and low WM load will be associated with delay suppression, but its degree will be higher for low WM load (d). Equivalent effects will be observed if WM is assumed to cause suppression and other mental processes cause enhancement.
Figure 6
Working-memory related spike activity in monkey ventrolateral prefrontal cortex.
(a, b) The spike rates of two representative multiunits recorded in vlPFC from monkey C while he performed task 6 correctly. The organization of the figure and all other conventions are identical to those of Figure 4.
Figure 7
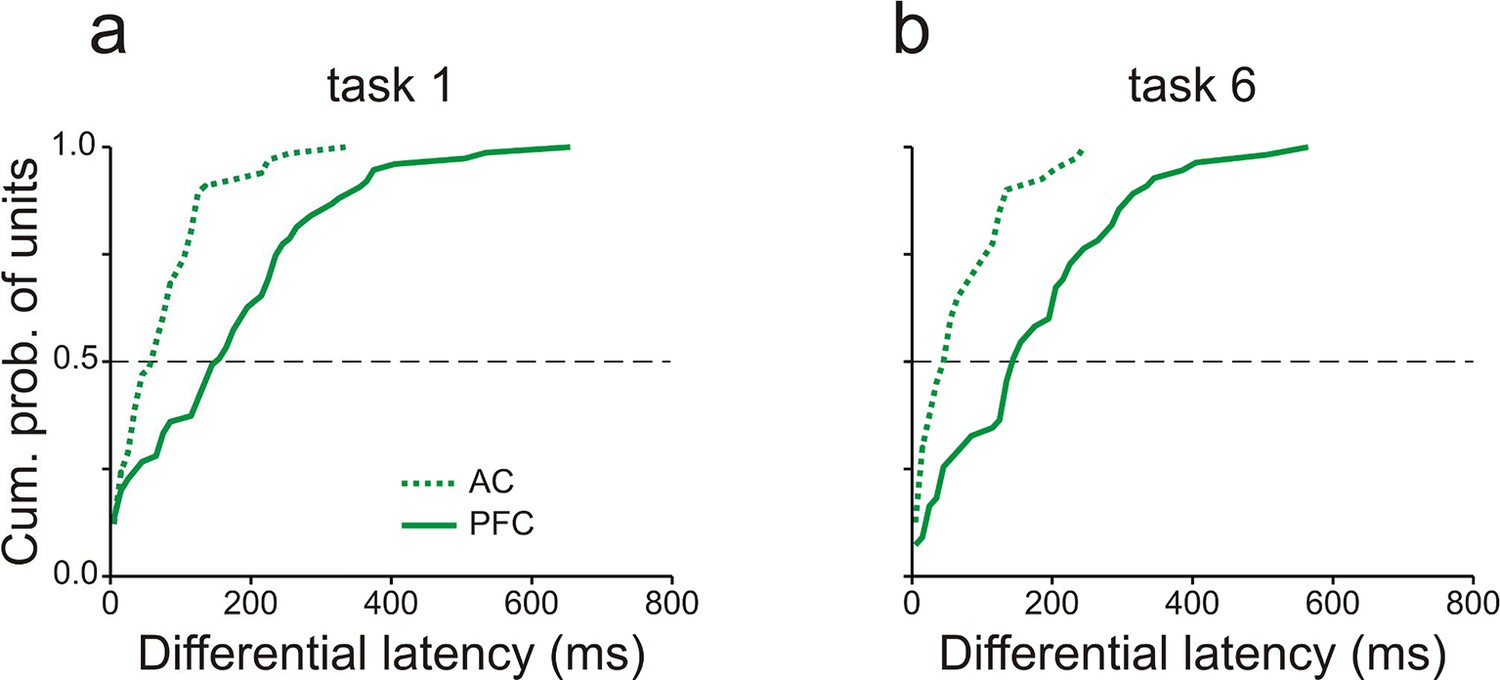
Working-memory related spike activity emerges earlier in auditory cortex than in prefrontal cortex.
Differential latencies (see Results for definition) of multiunits recorded in AC (dashed traces) and vlPFC (solid traces) in tasks 1 (a) and 6 (b). The dashed horizontal lines mark the median cumulative probability. Data were obtained from monkey C.
Author response image 1
Download links
A two-part list of links to download the article, or parts of the article, in various formats.
Downloads (link to download the article as PDF)
Open citations (links to open the citations from this article in various online reference manager services)
Cite this article (links to download the citations from this article in formats compatible with various reference manager tools)
Persistent neural activity in auditory cortex is related to auditory working memory in humans and nonhuman primates
eLife 5:e15441.
https://doi.org/10.7554/eLife.15441


