Multi-step coordination of telomerase recruitment in fission yeast through two coupled telomere-telomerase interfaces
- University of California, Irvine School of Medicine, United States
Figures
Figure 1 with 3 supplements
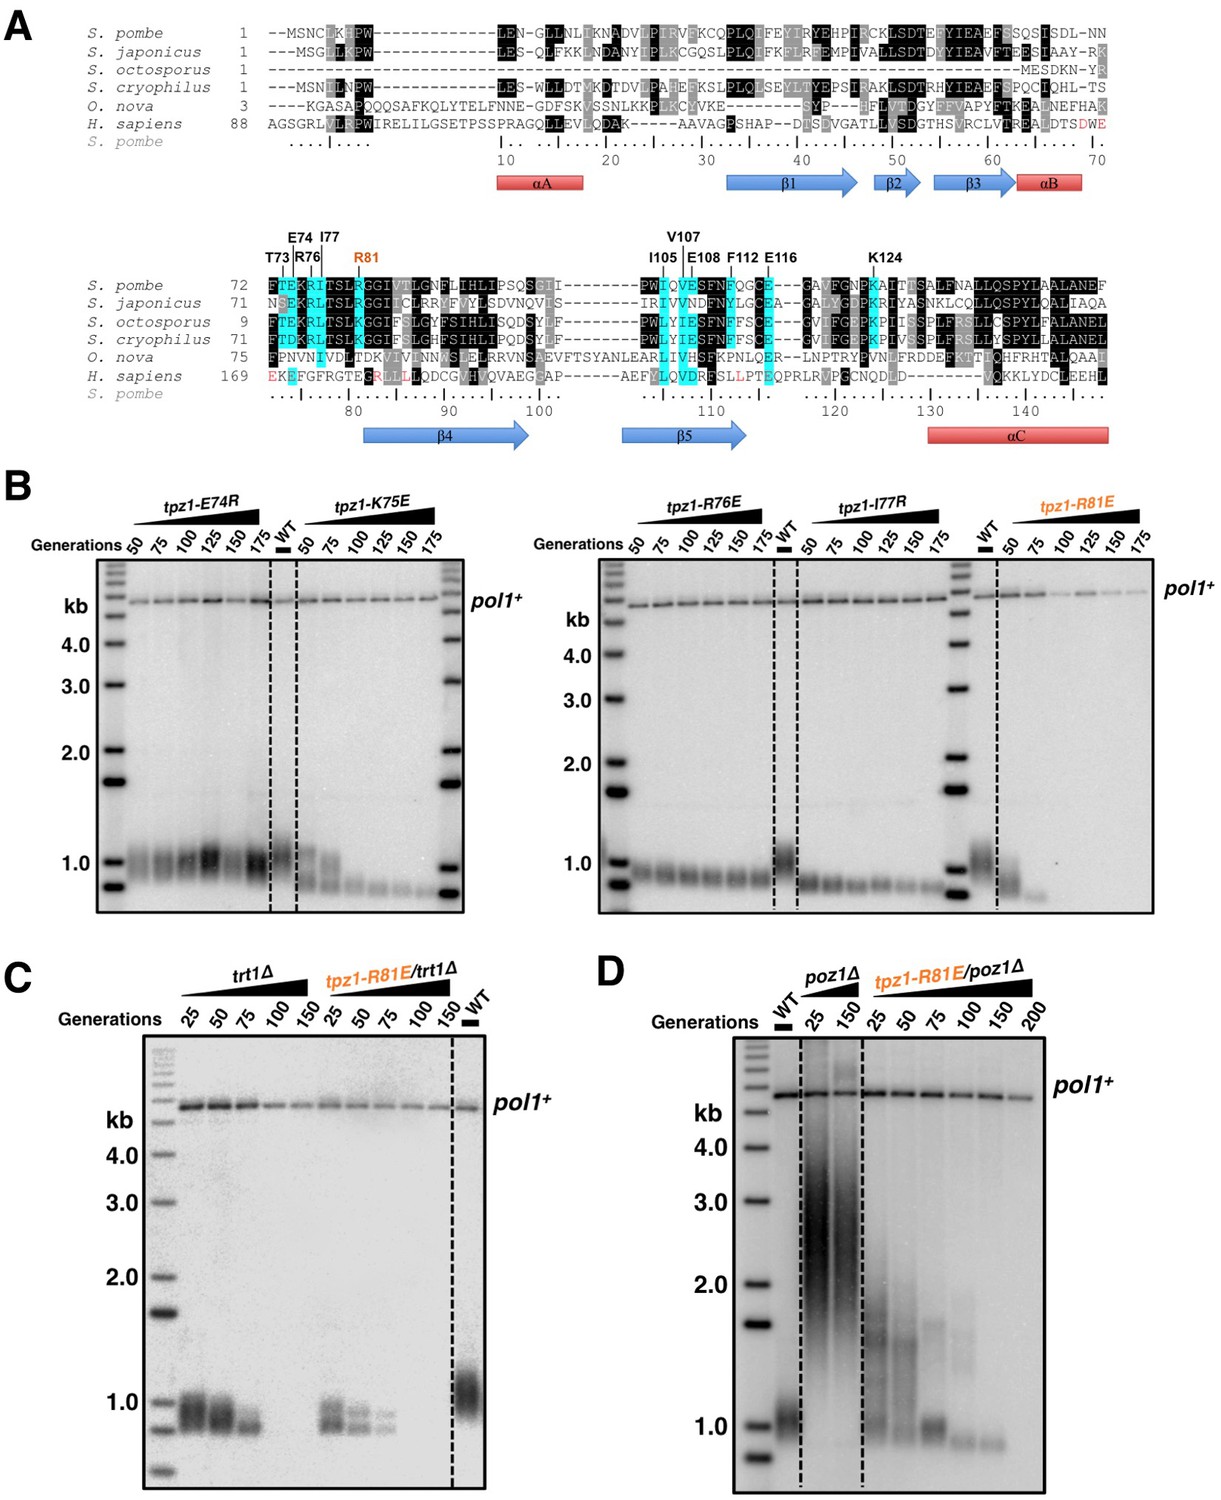
Fission yeast Tpz1 TEL-patch mutant leads to an EST phenotype.
(A) A sequence alignment of OB fold-domains between fission yeast Tpz1, human TPP1 and Oxytricha nova TEBP-β, in combination with a secondary structure prediction. Twelve conserved fission yeast Tpz1 residues subjected to mutagenesis are highlighted in blue with their identities and sequence numbers indicated above the alignment. Residues colored in red are previously identified TEL-patch residues in human TPP1 and mutations of them lead to compromised TPP1-TERT interaction. Black and grey shading indicates sequence identity and similarity, respectively. If the sequence is identical among at least 50% of species, the residues will be shaded in black. The same rule applies to sequence similarity, which is shaded in grey. (B) Southern blot analysis to measure telomere lengths using EcoRI-digested genomic DNA visualized by the telomere DNA probe for the indicated tpz1 mutant strains from successive re-streaks on agar plates. tpz1-K75E, tpz1-R76E, tpz1-I77R, and tpz1-R81E strains caused telomere shortening and tpz1-R81E cells showed the classic Ever Shorter Telomere (EST) phenotype. For the telomere length analysis southern blots presented in all the figures, the 1 kb plus marker from Invitrogen is used. Wild type cells are denoted as 'WT' in the blot. pol1+ indicates the EcoRI-digested pol1+ DNA fragment used as a loading control. (C) Double-mutant strain tpz1-R81E/trt1Δ shows EST telomere phenotype, similar to the trt1Δ single-mutant strain. (D) Double-mutant strain tpz1-R81E/poz1Δ shows progressive telomere shortening phenotype.
Figure 1—figure supplement 1
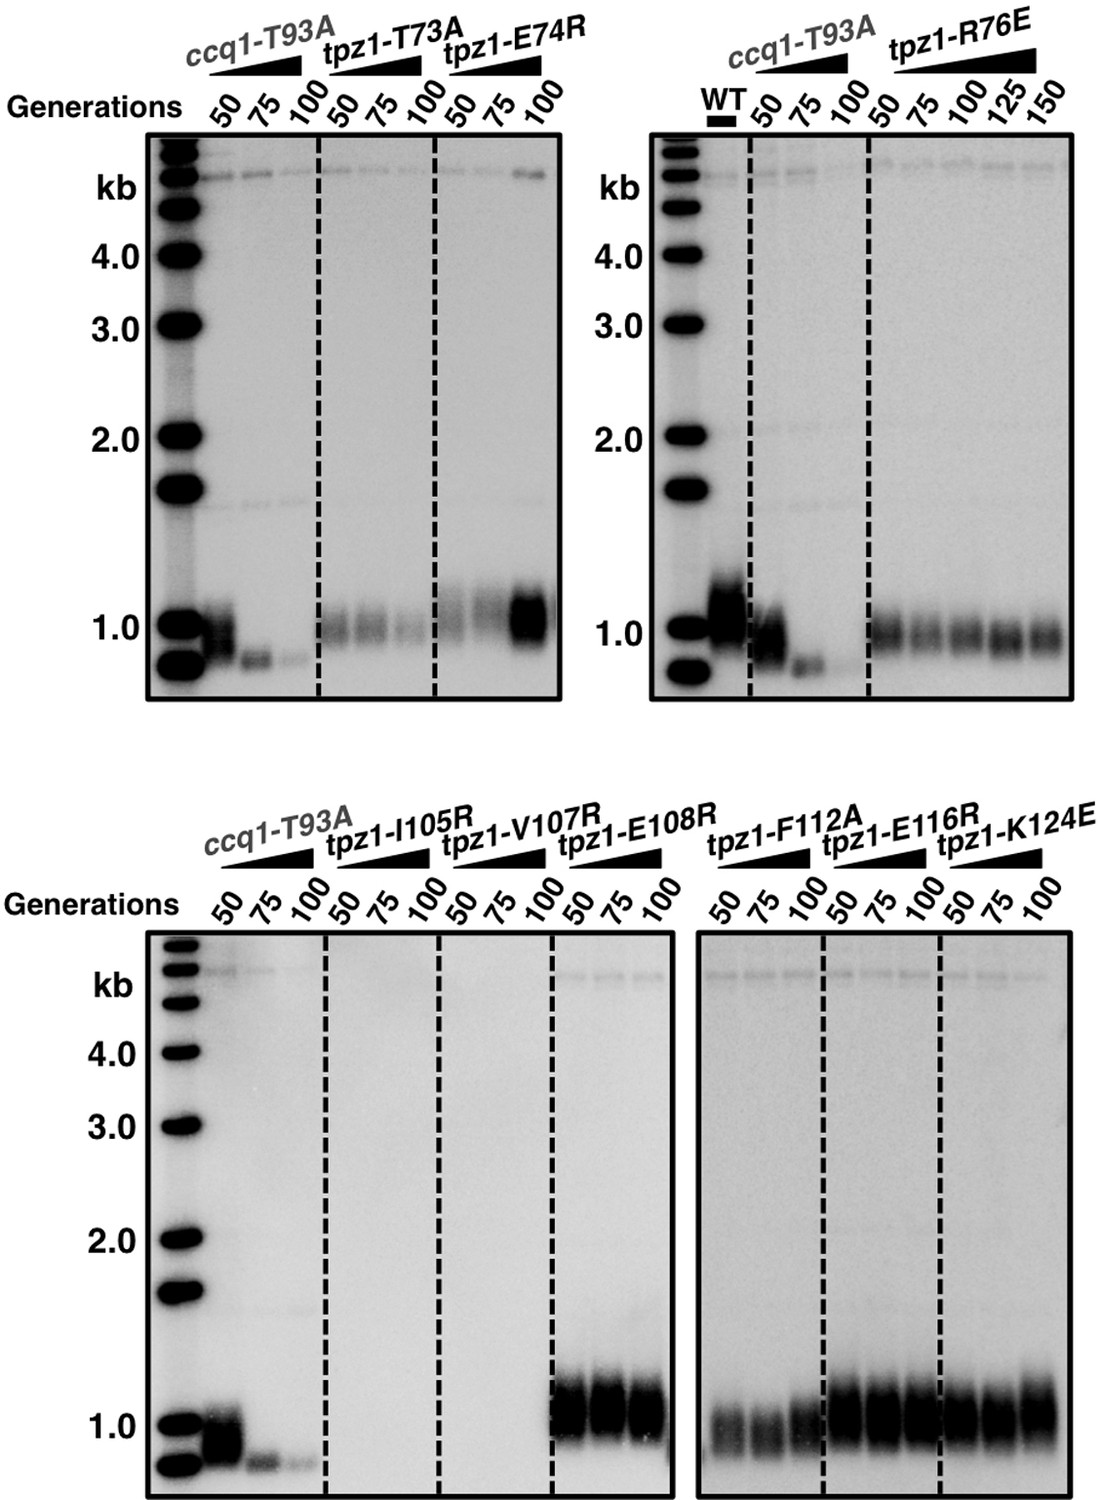
Telomere length measurement of tpz1 mutant strains.
Southern blot analysis to measure telomere lengths using EcoRI-digested genomic DNA visualized by the telomere DNA probe for the indicated tpz1 mutant strains from successive re-streaks on agar plates.
Figure 1—figure supplement 2

Evaluation of Tpz1 expression levels in tpz1 mutant strains.
Western blot showing expression levels of Tpz1 protein in indicated tpz1 mutant strains.
Figure 1—figure supplement 3

The later generation tpz1-R81E/poz1Δ mutant strain forms circularized chromosomes.
(A) Schematic diagram of chromosome showing sub-telomeric regions. Greek numbers indicate the locations where the PCR primers are designed. (B) tpz1-R81E/poz1Δ mutant lost sub-telomeric I and II regions at generation 200. The PCR products (from I to IV) are amplified from corresponding regions on chromosomes (A). For S. pombe cells carrying circularized chromosomes due to telomere loss, both sub-telomeric regions I and II are eroded from chromosome ends.
Figure 2 with 1 supplement
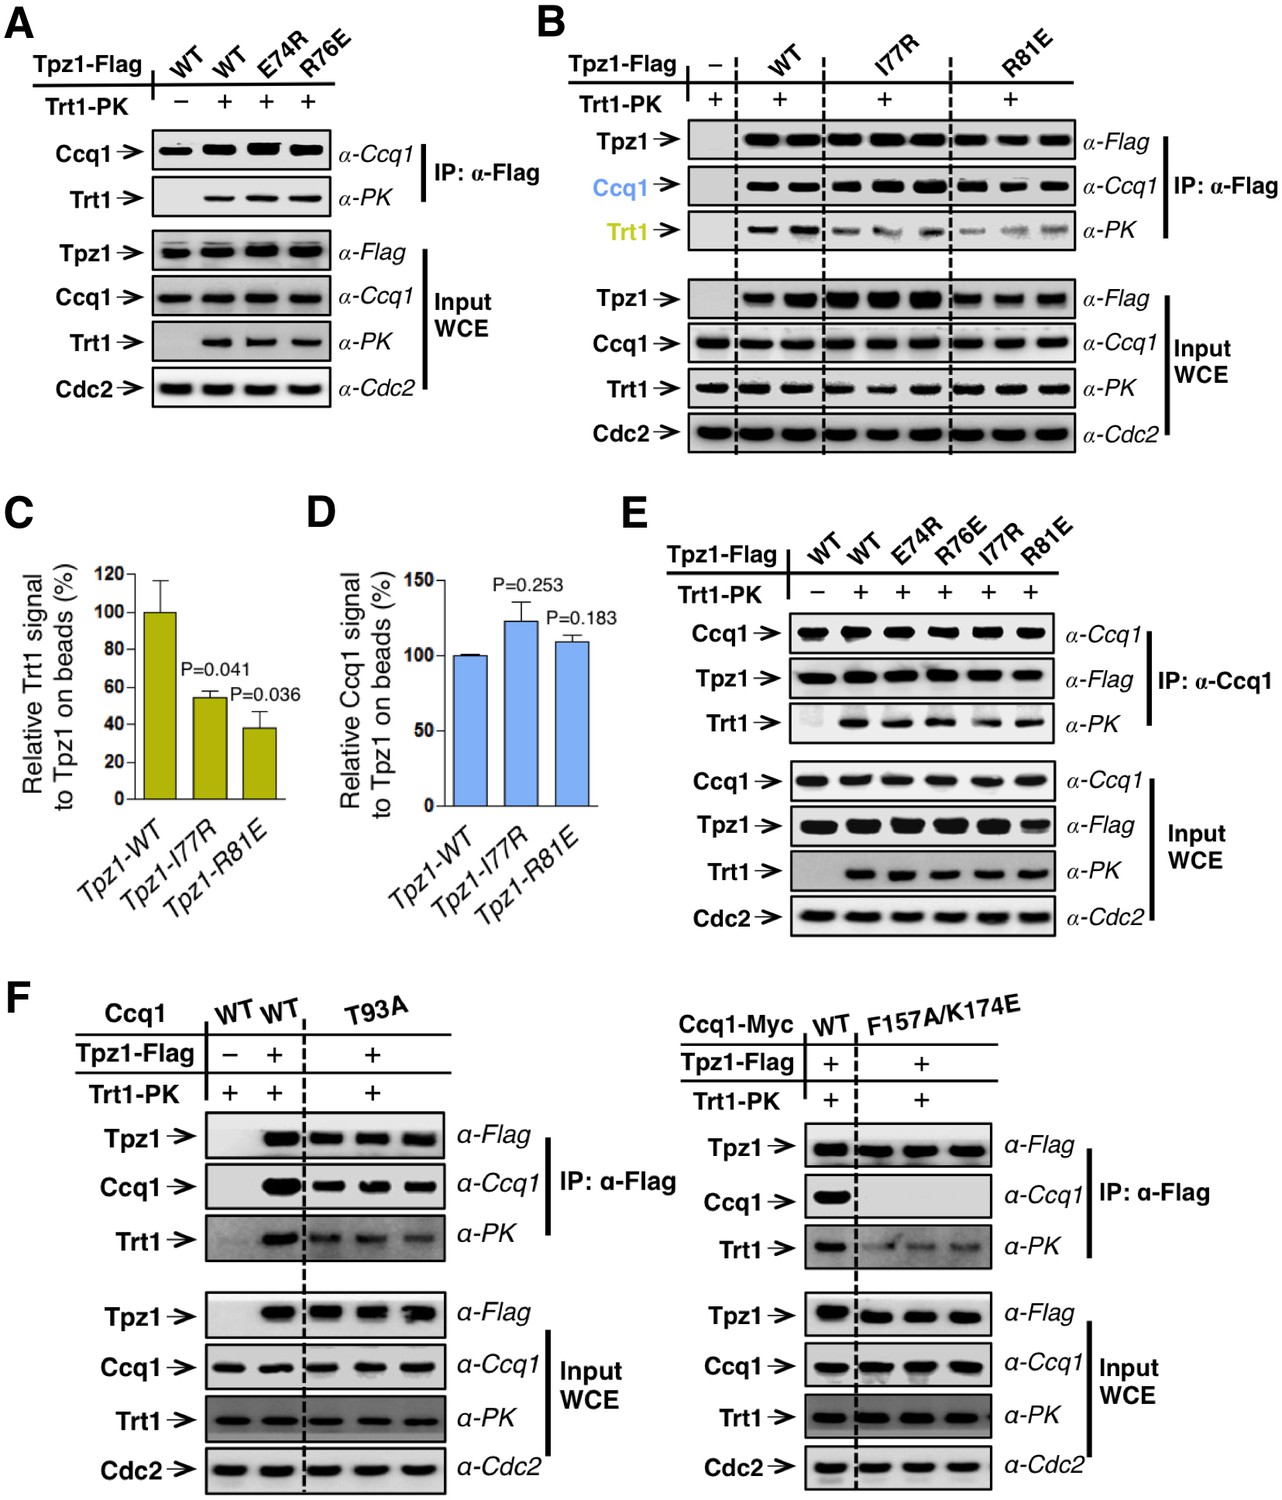
The Tpz1 TEL-patch mutant is defective in Tpz1-Trt1 interaction.
(A) Co-immunoprecepitation (Co-IP) assays evaluating bindings between Trt1 and Tpz1-E74R and Tpz1-R76E. Cdc2 was shown as the loading control. Input: 1/30 of input WCE (whole cell extract). (B) Co-IP assays showing that Tpz1-I77R and Tpz1-R81E significantly decrease interaction between Tpz1 and Trt1. Cdc2 was shown as the loading control. Input: 1/30 of input WCE. (C) Quantification of the binding efficiency between Trt1 and Tpz1 mutants from (B). The interaction between Trt1 and Tpz1-WT is set to be 100%. Trt1 levels in the IP were normalized to Tpz1 bound to the beads. (D) Quantification of the binding efficiency between Ccq1 and Tpz1 mutants from (B). The interaction between Ccq1 and Tpz1-WT is set to be 100%. Ccq1 levels in the IP were normalized to Tpz1 bound to the beads. (E) Co-IP assays evaluating the binding efficiency between Trt1 and Ccq1 in various Tpz1 mutant cells. Cdc2 was shown as the loading control. Input: 1/30 of input WCE. (F) Co-IP assays evaluating the binding efficiency between Trt1 and Tpz1 in ccq1-T93A and ccq1-F157A/K174E. Cdc2 was shown as the loading control. Input: 1/30 of input WCE.
Figure 2—figure supplement 1

Trt1-Tpz1 interaction is intact in tpz1-K75E and tpz1-K75A strains.
Co-immunoprecepitation (Co-IP) assays evaluating the binding between full-length Trt1 and Tpz1 mutants K75E and K75A. Cdc2 was shown as the loading control. Input: 1/30 of input WCE (whole cell extract).
Figure 3

The Tpz1 TEL-patch mutant fails to localize telomerase to telomeres.
(A–C) Enrichment of Trt1 (A), Ccq1 (B) or Tpz1 (C) at telomeres is monitored by chromatin immunoprecipitation (ChIP) assay. Slot-blot was used to visualize telomere association of Trt1, Ccq1 or Tpz1 in each indicated tpz1 mutant strains. Error bars in the quantitation of the slot-blot analysis represent standard deviations of two individual repeats.
Figure 4
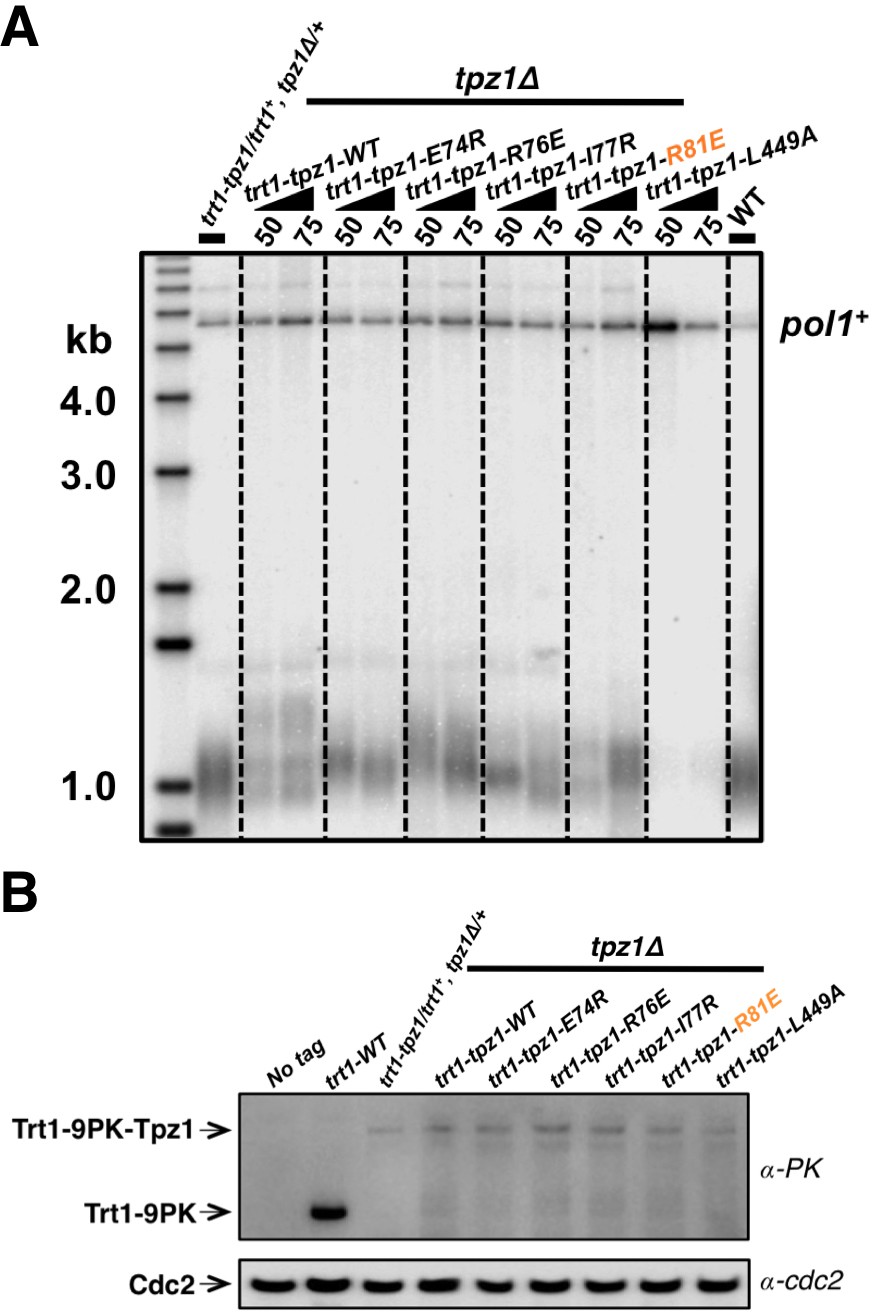
Fusing Trt1 to Tpz1 bypasses the requirement for functional Tpz1 TEL-patch.
(A) Southern blot analysis to measure telomere lengths using EcoRI-digested genomic DNA visualized by the telomere DNA probe for the trt1-tpz1 fusion strains with indicated WT or mutant versions of tpz1. 9PK tags were inserted between trt1 and tpz1. (B) Western blot showing expression levels of PK-tagged Trt1 protein and the chimeric Trt1-Tpz1 fusion proteins. Cdc2 was used as a loading control for total proteins.
Figure 5
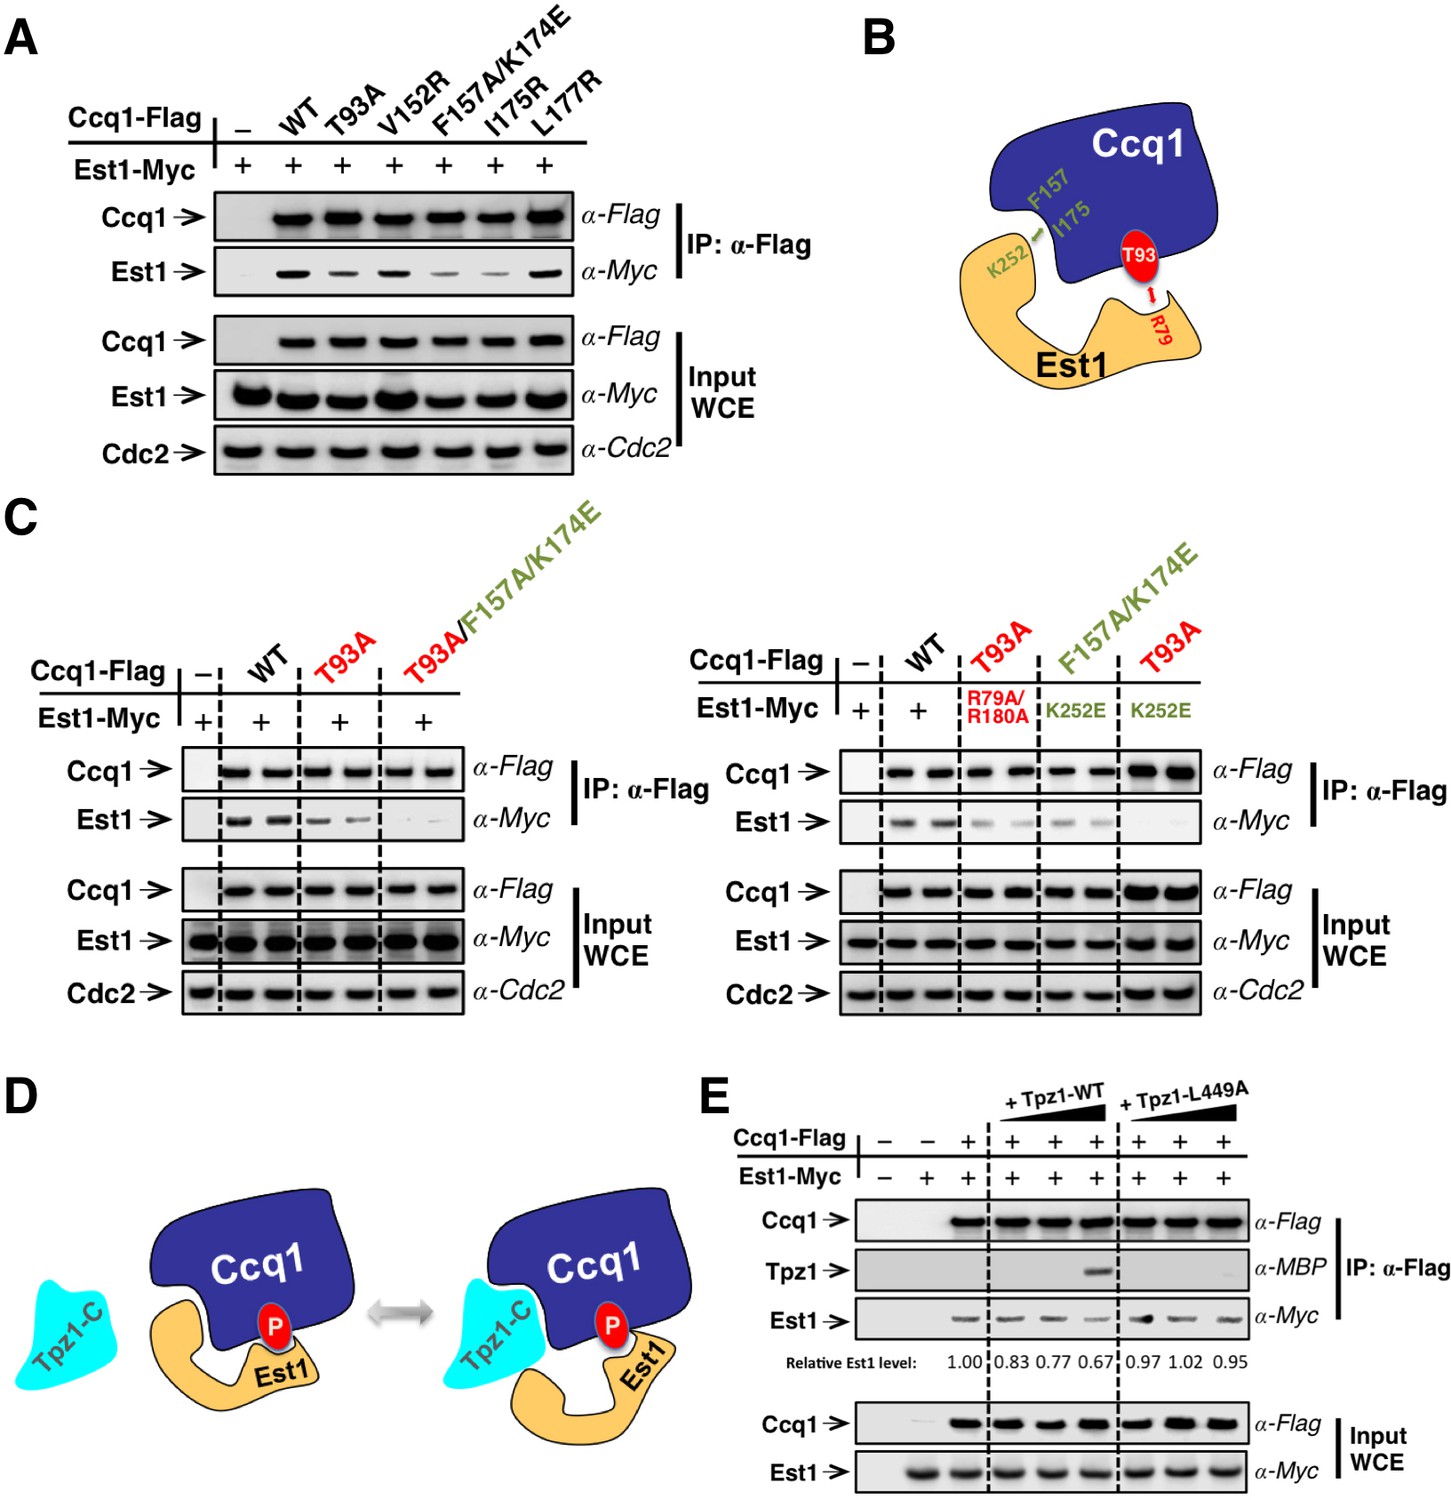
Est1 binds to Ccq1 through two different binding sites.
(A) Ccq1-Est1 interaction is diminished but not completely disrupted in the ccq1-T93A, ccq1-F157A/K174E, and ccq1-I175R strains as evaluated by Co-IP assays. Cdc2 was shown as the loading control. Input: 1/30 of input WCE. (B) Schematic model of Est1 and Ccq1 interaction showing two binding sites for their interaction as further tested in (C). (C) Co-IP assays evaluating the contribution of two binding sites to the binding between Est1 and Ccq1. Cdc2 was shown as the loading control. Input: 1/30 of input WCE. (D) Schematic model of Tpz1 C-terminal domain, Est1 and Ccq1 forming an intermediate Est1-Ccq1-Tpz1 complex. (E) Competitive binding assay showing that Tpz1 can partially compete with Est1 for its interaction with Ccq1; however, the Tpz1-Ccq1 interaction defective mutant Tpz1-L449A cannot.
Figure 6
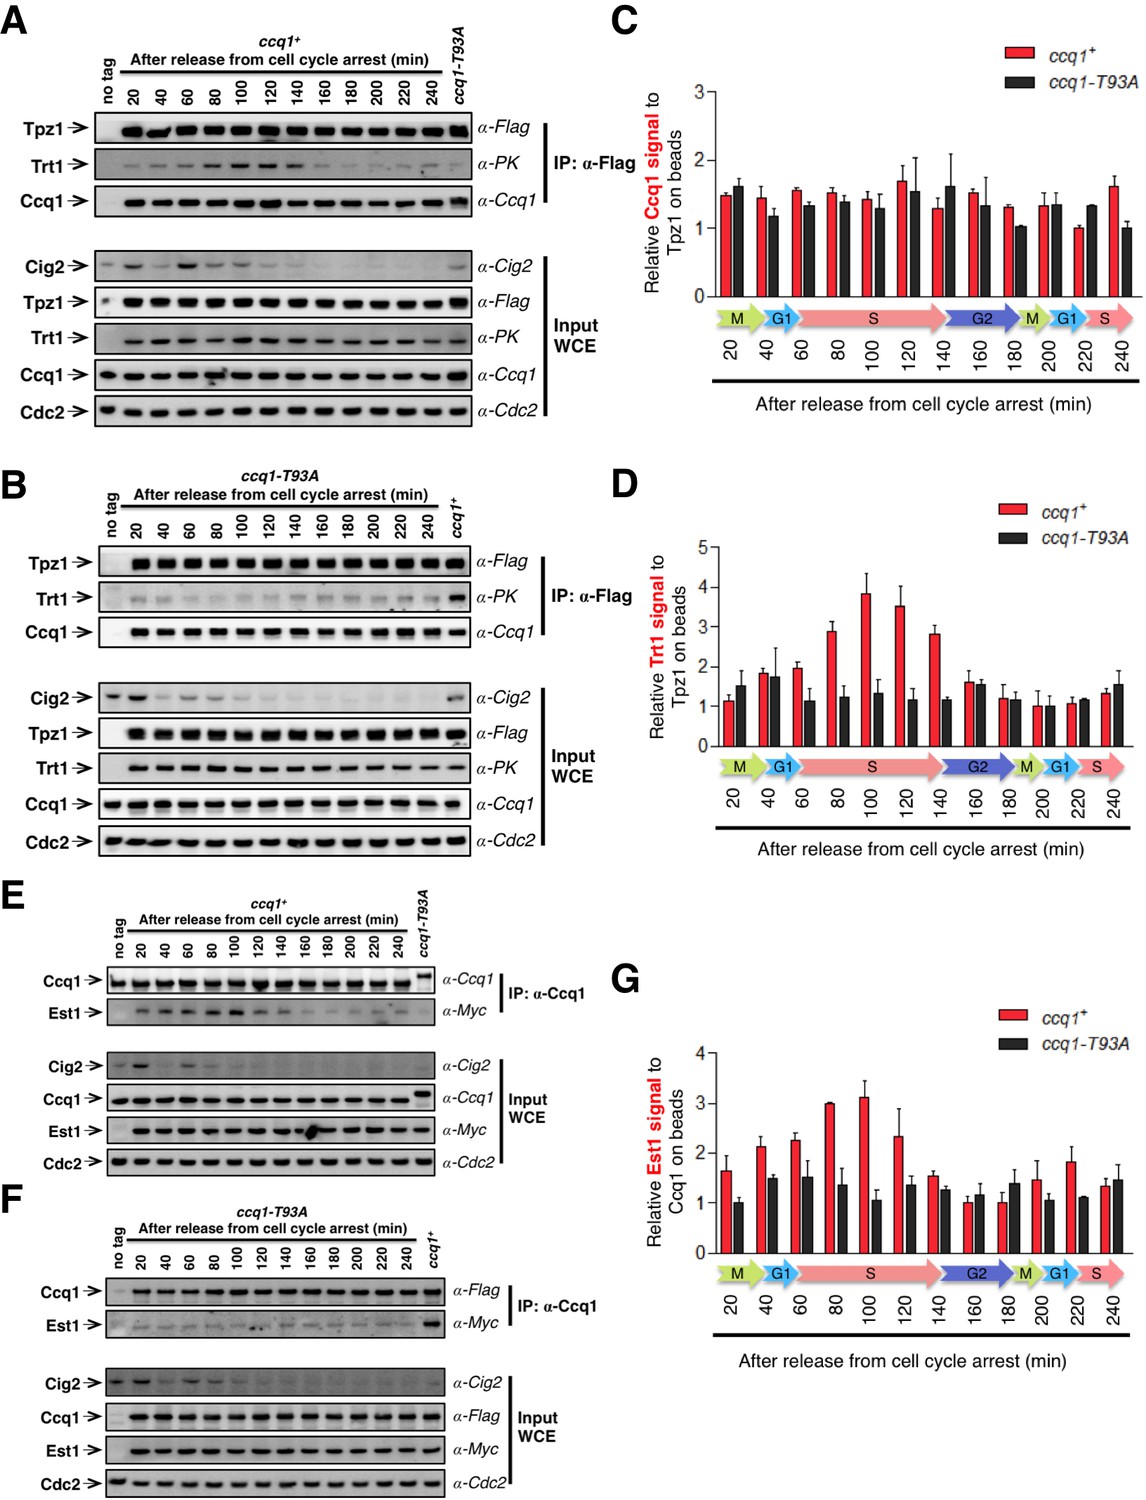
Tpz1-Trt1 interaction is cell cycle-regulated.
(A) and (B) Co-IP assays evaluating the binding efficiency of Tpz1-Trt1 and Tpz1-Ccq1 interactions during cell cycle progression in ccq1+ (A) and ccq1-T93A (B) cells. In addition to the indication of time after release from G2 arrest, the levels of S phase cyclin Cig2, which peak at the G1/S boundary and decline to low levels in G2 and M phase, are also shown. Cdc2 was shown as the loading control. Input: 1/30 of input WCE. (C) and (D) Quantification of the binding efficiency of Tpz1-Trt1 (C) and Tpz1-Ccq1 (D) interactions during cell cycle progression as assayed in (A) and (B). The lowest level of Tpz1-Trt1 (C) or Tpz1-Ccq1 (D) interactions is set to be 1. Plots show mean values ± s.d. for two independent experiments. (E) and (F) Co-IP assays evaluating the binding efficiency of Ccq1-Est1 interaction during cell cycle progression. As in (A) and (B), in addition to the indication of time after release from G2 arrest, the levels of S phase cyclin Cig2, are also shown. Cdc2 was shown as the loading control. Input: 1/30 of input WCE. (G) Quantification of the binding efficiency of Ccq1-Est1 interaction during cell cycle progression as assayed in (E) and (F). The lowest level of Ccq1-Est1 interaction is set to be 1. Plots show mean values ± s.d. for two independent experiments.
Figure 7 with 1 supplement
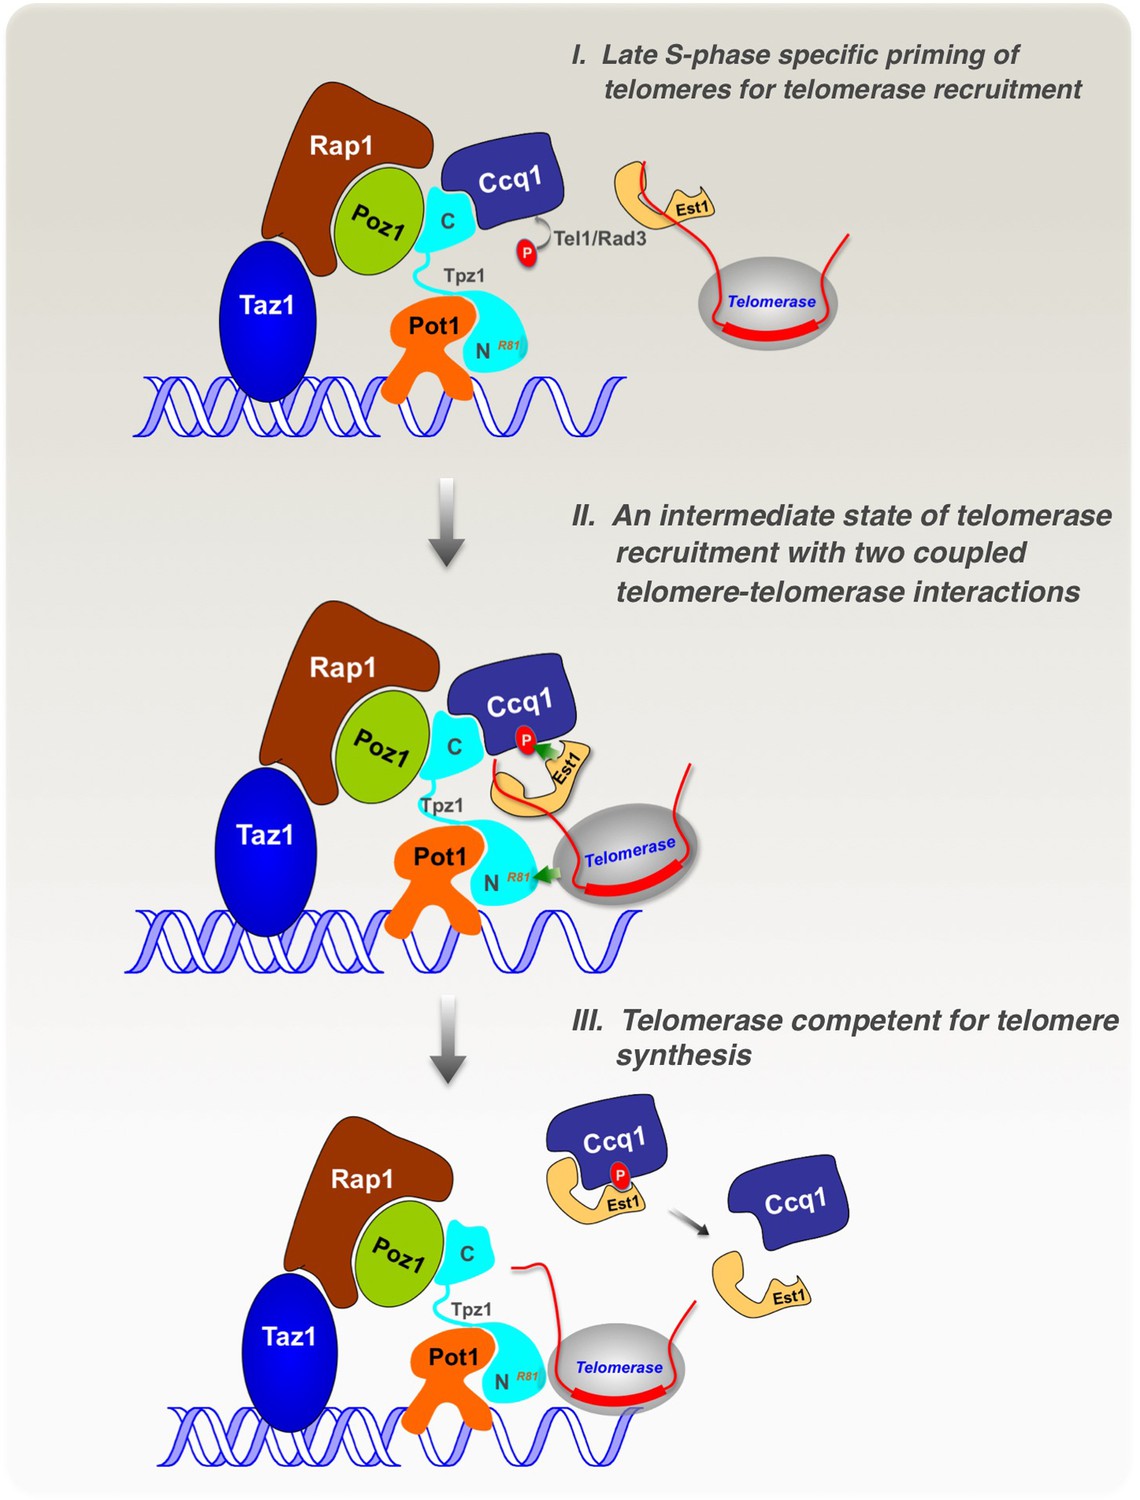
Model of cell cycle-regulated telomerase recruitment via an intermediate state with two coupled telomere-telomerase interactions.
A model showing telomerase recruitment in fission yeast through an intermediate state in which Trt1 and Est1 in the telomerase holoenzyme are collaboratively anchored to the telomere via Trt1-Tpz1 TEL patch and Est1-Ccq1 interactions, respectively (illustrated by two green arrows drawn in the middle panel), thereby achieving cell cycle-regulated recruitment of telomerase to telomeres.
Figure 7—figure supplement 1

A speculative two-interface intermediate-state model for human telomerase recruitment.
A speculative two-interface intermediate-state model for human telomerase recruitment showing that the C-terminal domain of TIN2 is likely to be the Ccq1-functional equivalent in humans and interacts either with hEST1 or the telomerase RNP directly, forming the second connection between telomeres and telomerase in addition to the TPP1 (TEL-patch)-TERT (TEN domain) interaction.
Additional files
-
Supplementary file 1
Strains used in the study and their genotypes.
- https://doi.org/10.7554/eLife.15470.015
Download links
A two-part list of links to download the article, or parts of the article, in various formats.
Downloads (link to download the article as PDF)
Open citations (links to open the citations from this article in various online reference manager services)
Cite this article (links to download the citations from this article in formats compatible with various reference manager tools)
Multi-step coordination of telomerase recruitment in fission yeast through two coupled telomere-telomerase interfaces
eLife 5:e15470.
https://doi.org/10.7554/eLife.15470


