N6-methyladenosine of HIV-1 RNA regulates viral infection and HIV-1 Gag protein expression
Figures
Figure 1 with 4 supplements
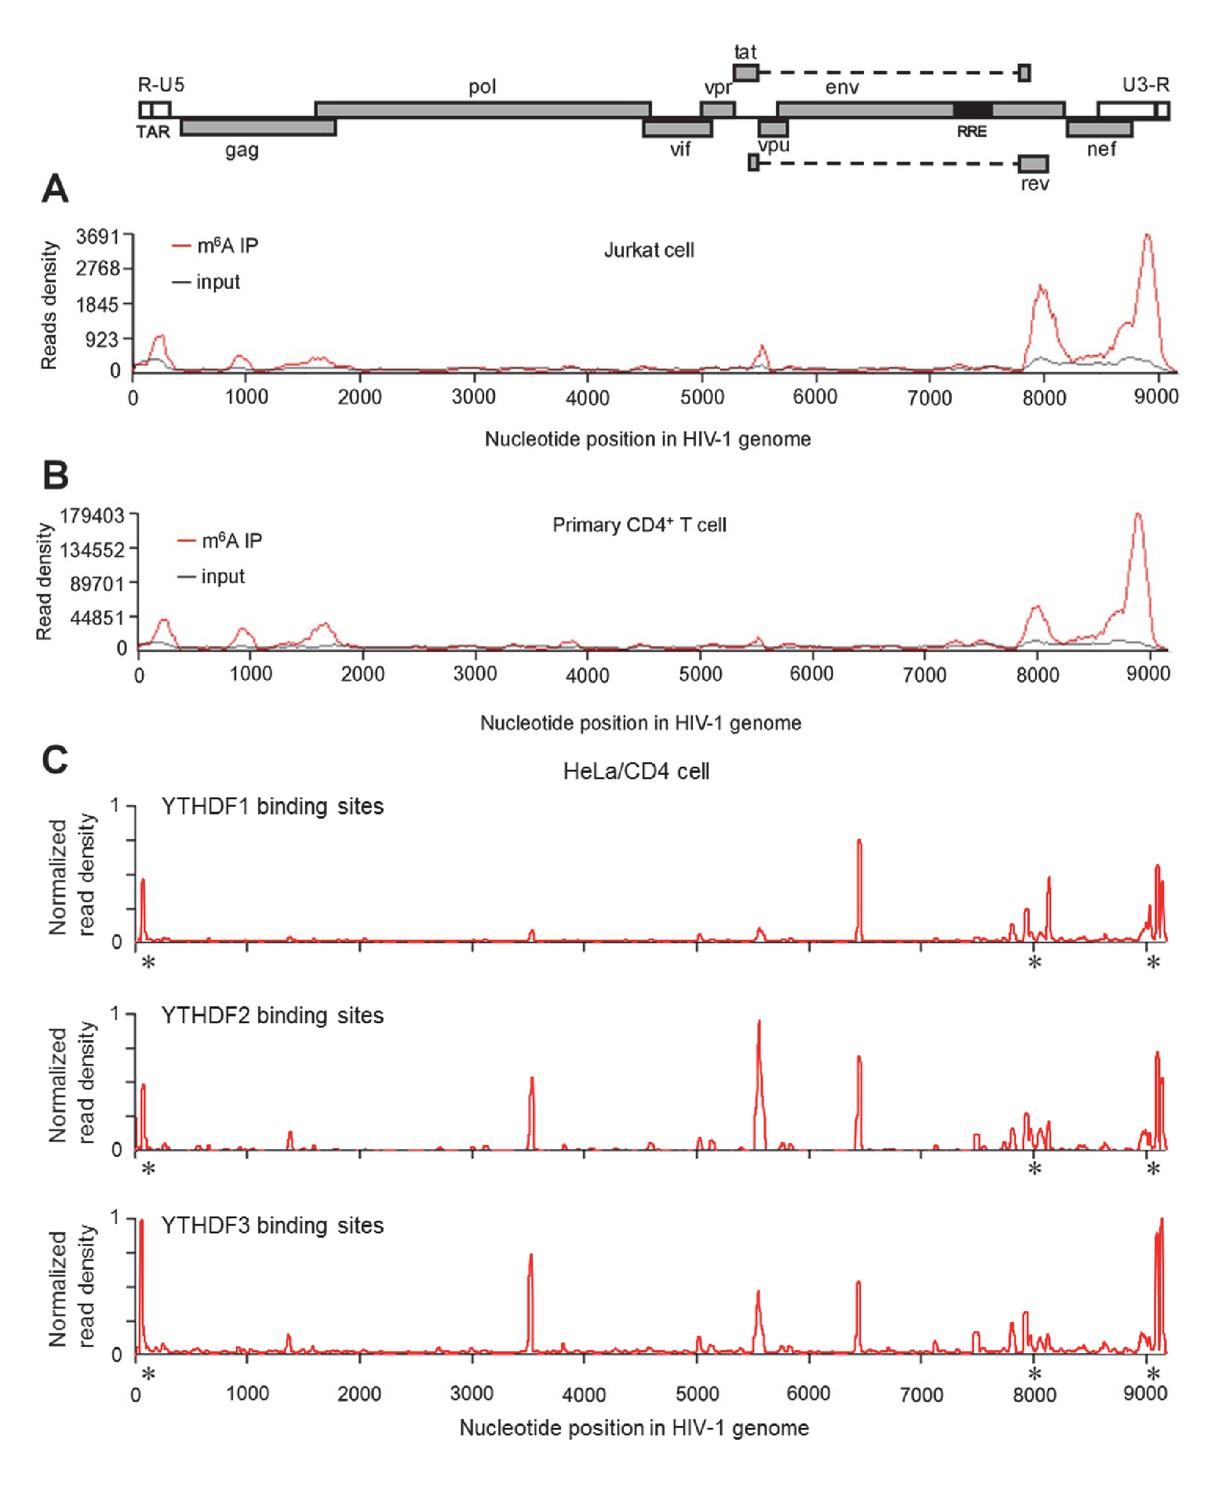
HIV-1 RNA contains m6A modifications and YTHDF1–3 proteins bind to m6A-modified HIV-1 RNA.
(A–B) The distribution of m6A reads from m6A-seq mapped to HIV-1 genome (red line) in HIV-1 infected Jurkat cells (A) or primary CD4+ T-cells (B). Baseline signal from the RNA-seq of input samples is shown as a black line. A schematic diagram of HIV-1NL4-3 genome is shown above. TAR, transacting response element; RRE, Rev response element. Jurkat cells (A) or primary CD4+ T-cells (B) were infected with HIV-1NL4-3 and total RNA was extracted for m6A-seq at 72 or 96 hr post-infection (hpi), respectively. (C) YTHDF1-3 proteins bind to the HIV-1 gRNA. HeLa/CD4 cells overexpressing FLAG-tagged YTHDF1-3 proteins were infected with HIV-1NL4-3 (MOI= 5) for 72 hr and used in CLIP-seq assay to identify their binding sites on HIV-1 gRNA. The distribution of mapped reads (>16 nt) with corresponding nucleotide positions are shown, forming peaks as putative binding positions. Asterisks mark the peak clusters overlapping with identified m6A peaks, indicating high-confident YTHDFs binding sites. Read density was normalized to the total number of mapped reads in each sample (YTHDF1: 28438; YTHDF2: 232568; YHTDF3: 124915). The data presented are representative of results from two independent experiments (n=2).
Figure 1—figure supplement 1
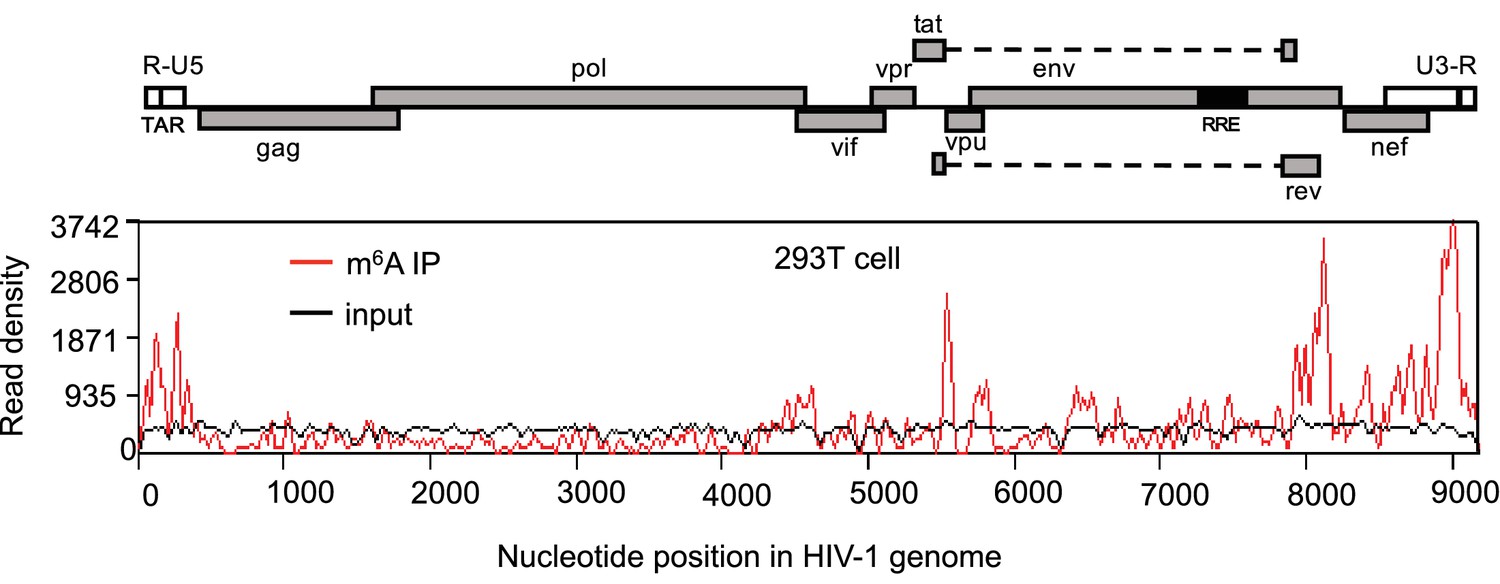
HIV-1 RNA contains m6A modifications.
HEK293 T cells were transfected with a proviral DNA-containing plasmid (pNL4-3). Total RNA was extracted at 48 hr post-transfection and immunoprecipitated with an m6A-specific antibody. Enriched RNA was subjected to next generation sequencing. Peaks show the relative abundance of m6A sites on the HIV-1 genome. The distribution of m6A reads from m6A-seq mapped to HIV-1 genome (red line). Baseline signal from the RNA-seq of input samples is shown as a black line. A schematic diagram of HIV-1NL4-3 genome features is shown above. TAR, transacting response element; RRE, Rev response element. The data presented are representative of two independent experiments.
Figure 1—figure supplement 2

Quantification of HIV-1 RNA m6A level using liquid chromatography-mass spectrometry.
HIV-1 RNA (250 ng) was isolated from highly purified HIV-1MN virions (total 600 μg of p24 capsid) and subjected to quantitative analysis of the m6A level using LC-MS/MS (n=3 of each sample). The results are presented are from representative of two independent experiments.
Figure 1—figure supplement 3
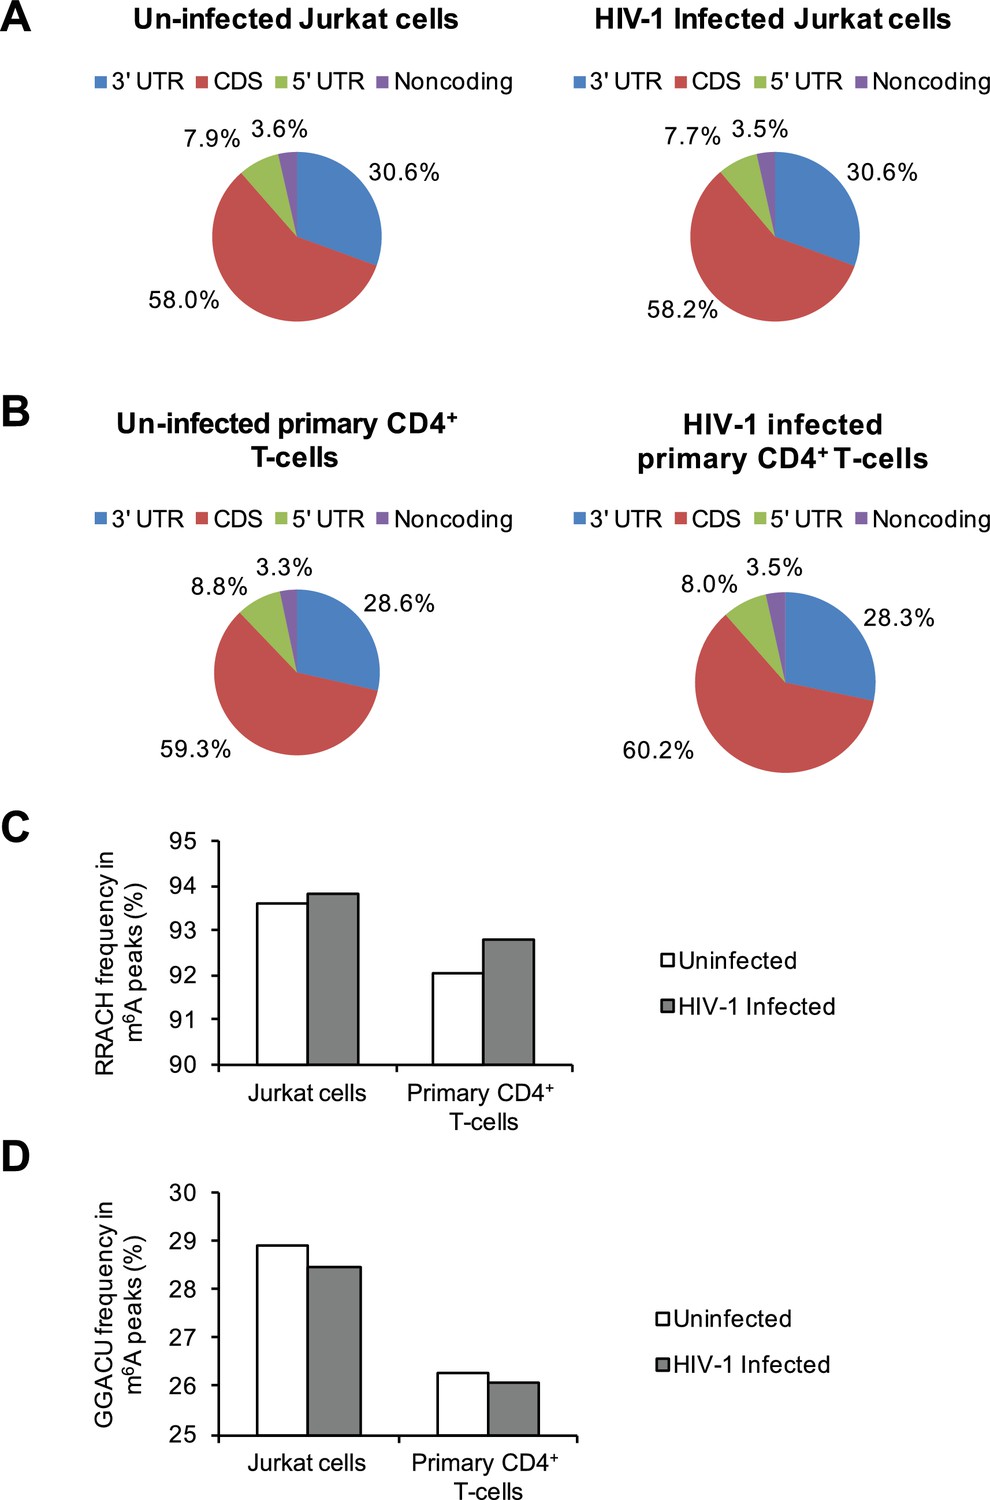
Distribution of m6A in cellular RNAs and the frequency of m6A motifs in HIV-1-infected cells.
(A–B) Pie charts show the distribution of m6A peaks in the 5′ UTR, coding DNA sequence (CDS), 3′ UTR, and noncoding regions of transcripts from uninfected and HIV-1-infected Jurkat T-cells (A) or primary CD4+ T-cells (B). The m6A peak distribution in HIV-1-specific RNAs is also shown. (C–D) Frequency of the RRACH motif (C) and the GGACU motif (D) within the m6A peaks in cellular RNAs from the uninfected control and HIV-1-infected cells. Data presented are the average results of duplicated samples (n=2).
Figure 1—figure supplement 4
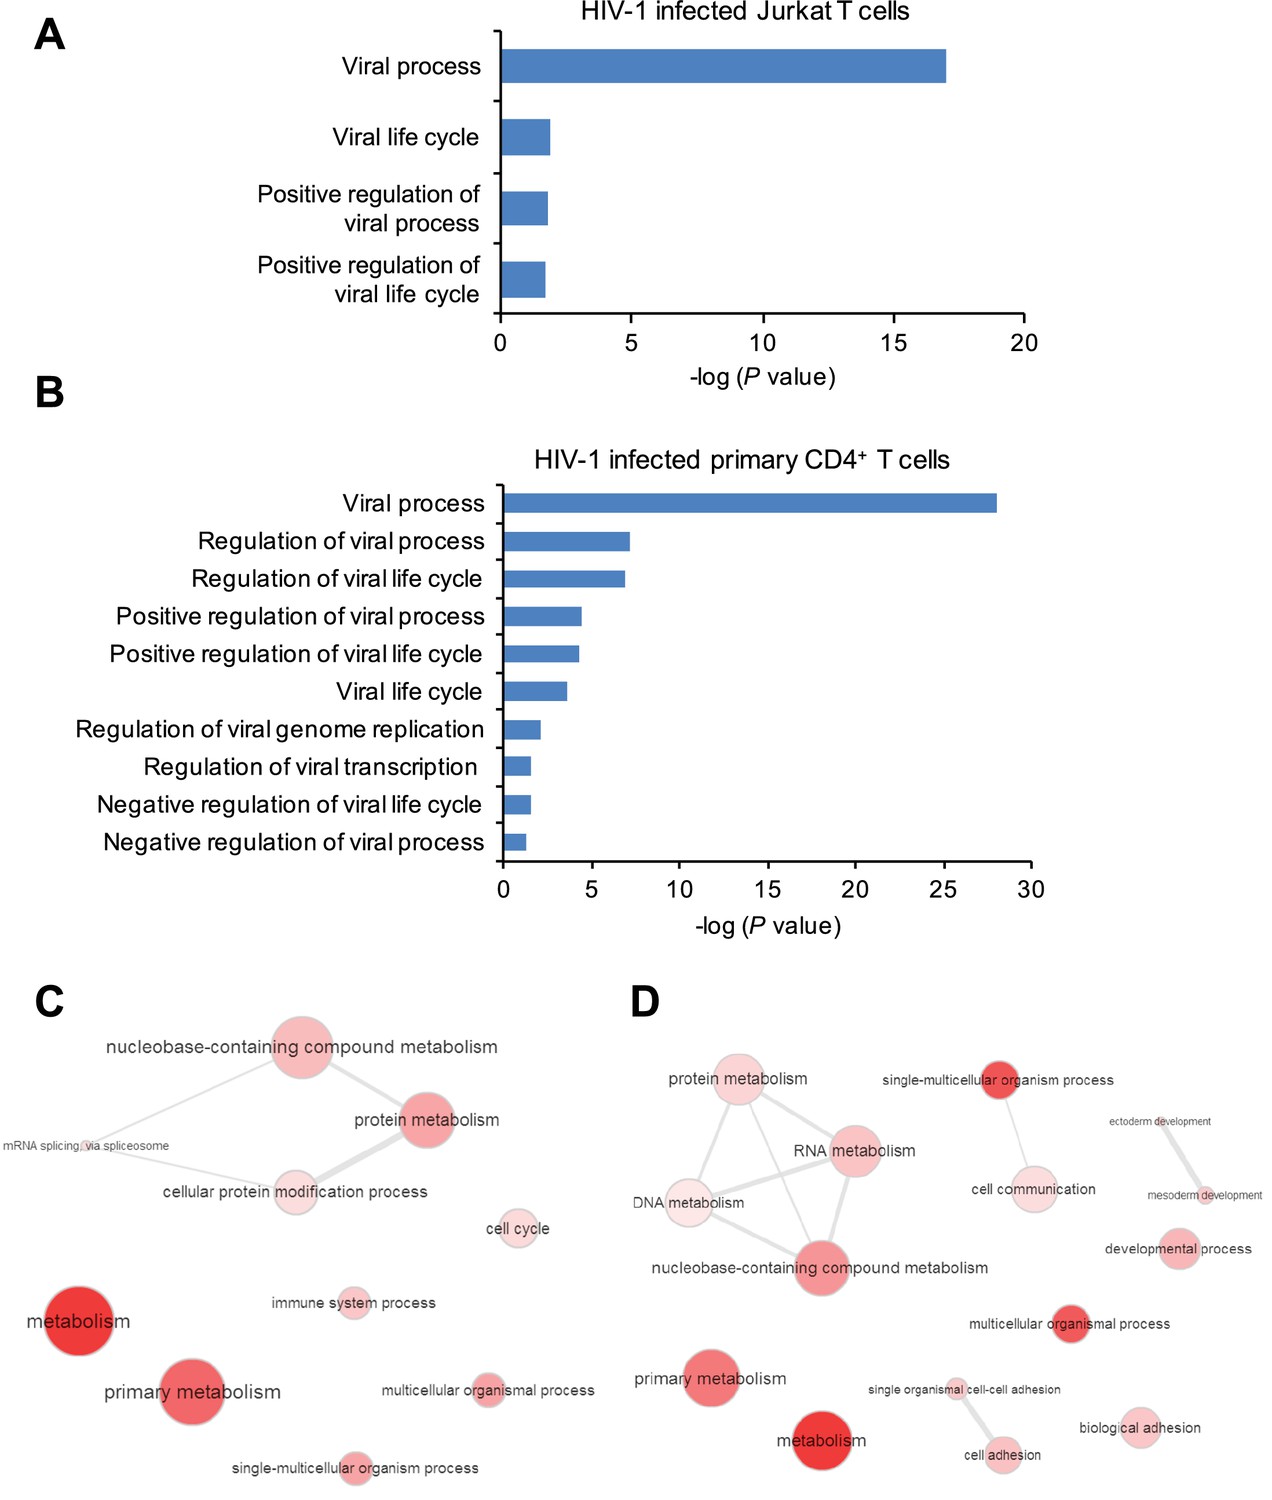
Gene ontology (GO) analysis of m6A-modified cellular genes in HIV-1 infected cells.
(A and B) GO terms specific to virus related pathways and corresponding p values, clustered from methylated genes detected in Jurkat cells (A) or primary CD4+ T cells (B) infected with HIV-1. (C and D) GO graphs showing functional clusters from genes with unique m6A peaks identified in HIV-1-infected Jurkat cells (C) or primary CD4+ T-cells (D) when compared to uninfected cells. Data presented are the average results of duplicated samples (n=2).
Figure 2
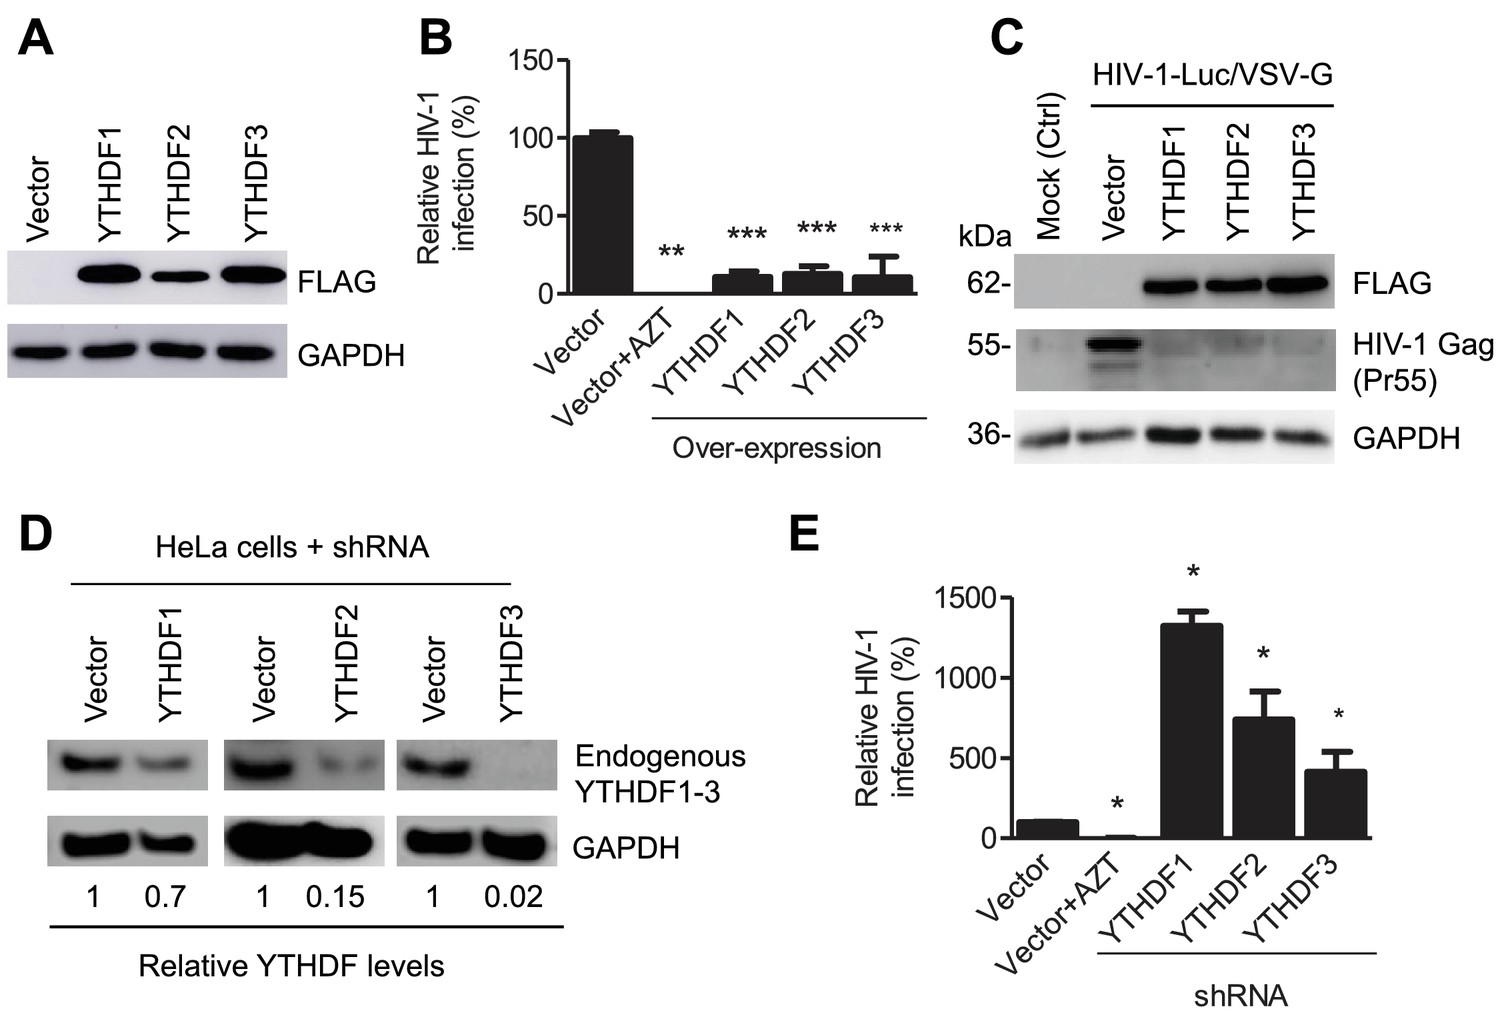
YTHDF1–3 proteins negatively regulate post-entry HIV-1 infection in HeLa cells.
(A–B) Overexpression of YTHDF1–3 proteins in HeLa cells significantly inhibits HIV-1 infection compared to vector control cells. (A) Overexpression of YTHDF1–3 proteins in HeLa cells was confirmed by immunoblotting. (B) HeLa cells overexpressing YTHDF1–3 proteins were infected with HIV-1 Luc/VSV-G at an MOI of 0.5 and viral infection was measured by luciferase activity at 24 hpi. (C) Overexpression of YTHDF1–3 proteins inhibits HIV-1 Gag protein synthesis in infected cells. HeLa cells overexpressing individual YTHDF1–3 proteins or the vector control cells were infected by HIV-1-Luc/VSV-G at an MOI of 0.5. At 24 hpi, the expression of HIV-1 Gag and YTHDF1–3 proteins (FLAG-tagged) was determined using immunoblotting. GAPDH was used as a loading control and mock-infected vector control cells were used as a negative control. (D and E) Individual knockdown of endogenous YTHDF1–3 proteins in HeLa cells significantly increases HIV-1 infection compared to vector control cells. HIV-1 infection assays were performed as described for panel B. *p<0.05, **p<0.005, and ***p<0.0005, compared to vector control without AZT treatment. All results are shown as mean ± SD (n=3) and data presented are representative of at least three independent experiments.
Figure 3
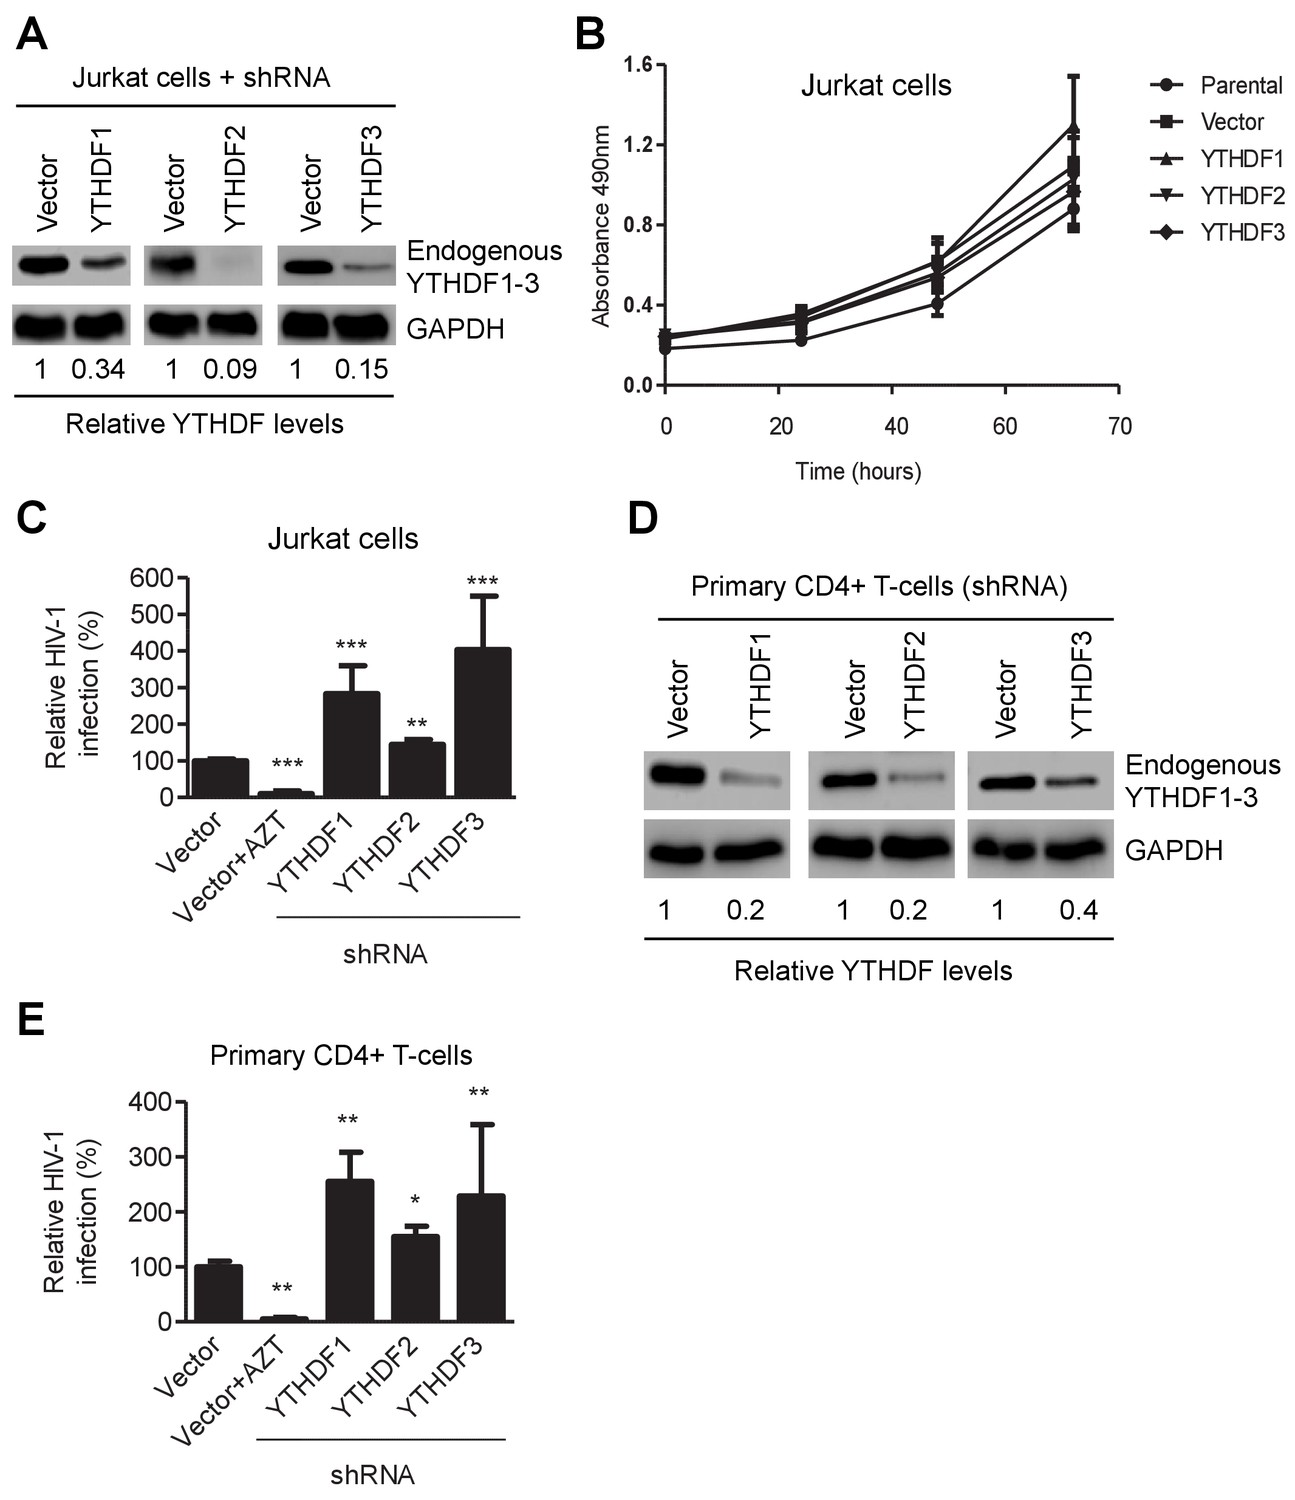
YTHDF1–3 proteins negatively regulate post-entry HIV-1 infection in CD4+ T-cells.
(A) Individual knockdown of endogenous YTHDF1–3 proteins in Jurkat CD4+ T cells was confirmed by immunoblotting. (B) Knockdown of YTHDF1–3 proteins does not affect proliferation of Jurkat cells. Jurkat cells (2 × 10⁴) were seeded and cultured for 3 days. At the times indicated, cell proliferation was measured using the MTS assay. (C) Knockdown of YTHDF1–3 proteins significantly increases HIV-1 infection compared to vector control cells. (D) Individual knockdown of YTHDF1–3 proteins in activated primary CD4+ T-cells from a healthy donor. (E) Knockdown of YTHDF1–3 proteins significantly increases HIV-1 infection compared to vector control cells. (A and D) GAPDH was used as a loading control. (C and E) The vector controls without AZT were set as 100%. The reverse transcriptase inhibitor AZT treated cells were used as positive control for productive HIV-1 infection. *p<0.05, **p<0.005, and ***p<0.0005, compared to vector control without AZT treatment. All results are shown as mean ± SD (n=3) and data presented are representative of at least three independent experiments.
Figure 4 with 1 supplement
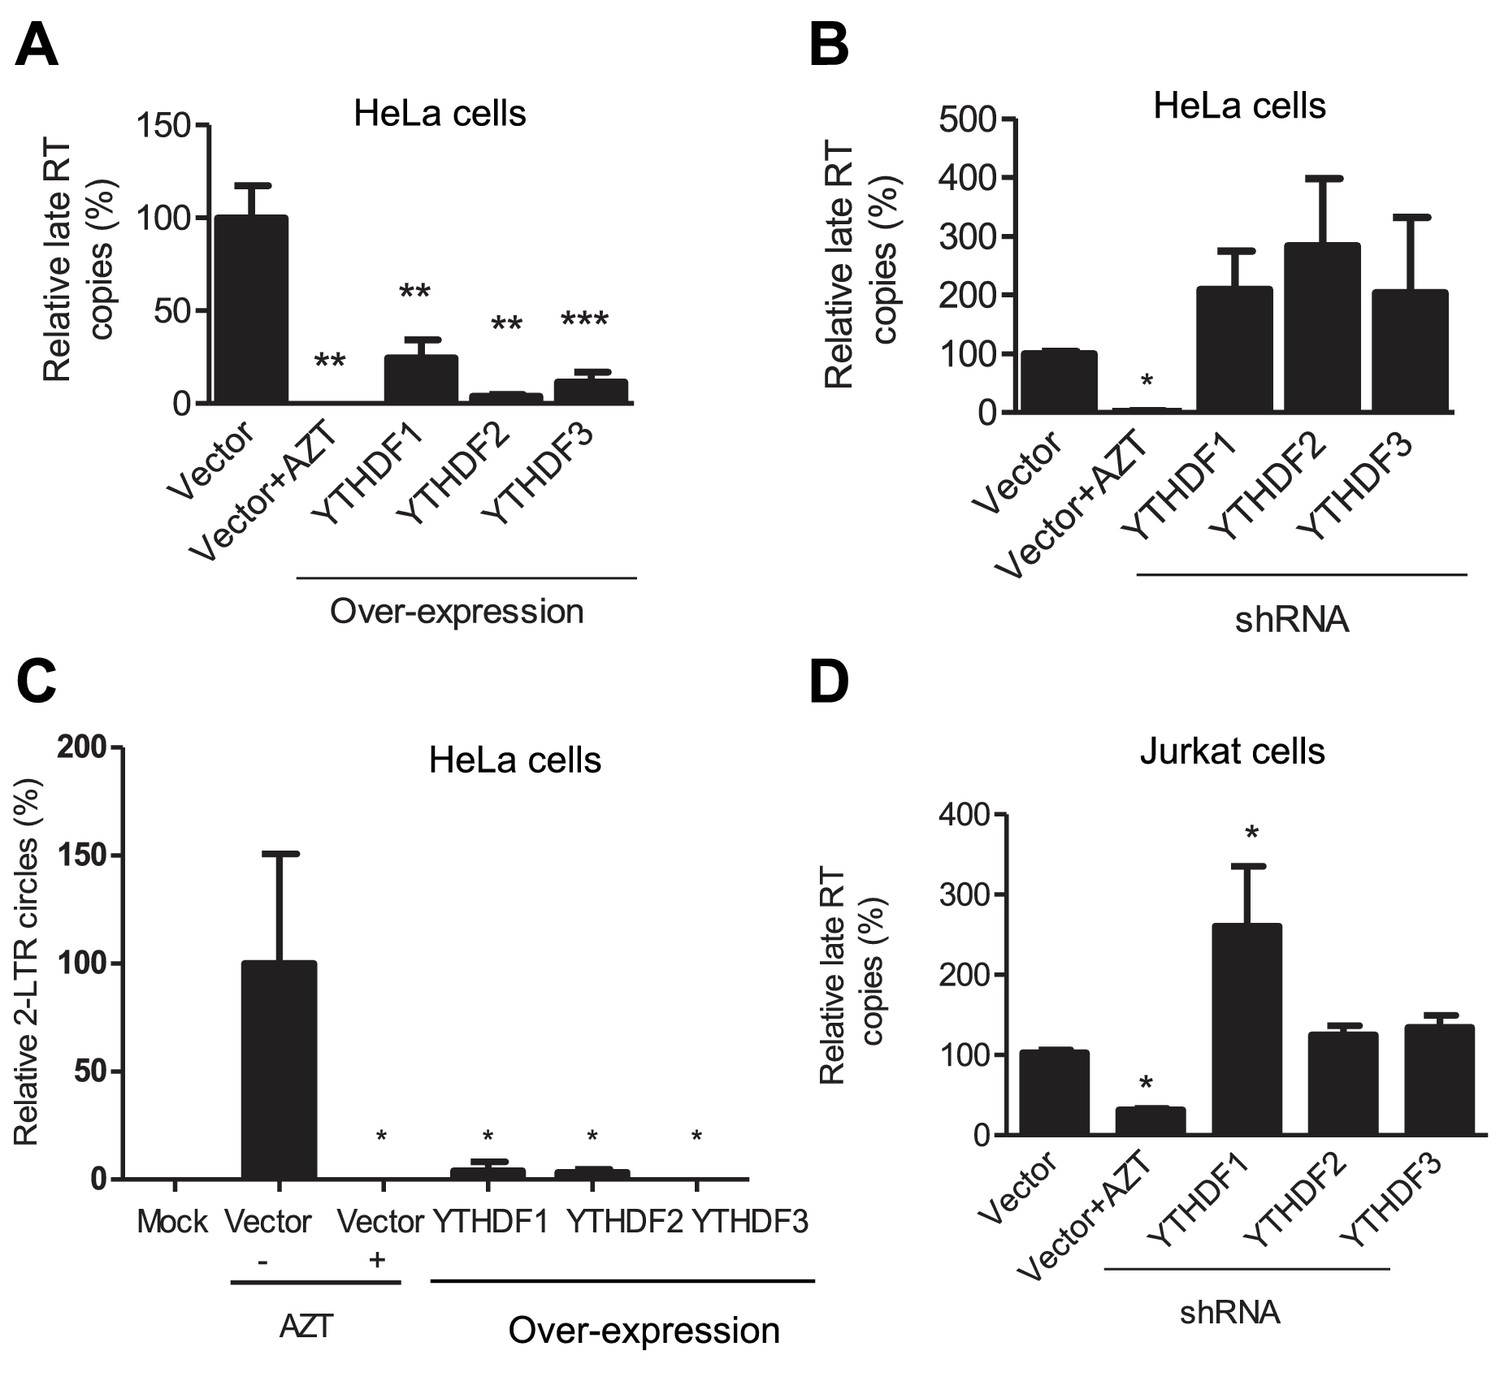
YTHDF1–3 proteins inhibit post-entry HIV-1 infection by blocking viral reverse transcription.
HeLa cells over-expressing or knocking-down (shRNA) individual YTHDF1–3 proteins were infected with HIV-1-Luc/VSV-G at an MOI of 0.5. (A, B and D) Genomic DNA was isolated from the cells 24 hr post-infection and HIV-1 late reverse transcription (RT) products were quantified by qPCR. (C) YTHDF family proteins reduce the formation of HIV-1 2-LTR circles in infected HeLa cells. At 24 hr post-infection, DNA was isolated from the cells and the 2-LTR circles were analyzed by qPCR and normalized to GAPDH levels. AZT treated vector control cells were used as a negative control for HIV-1 inhibition. *p<0.05 compared to the vector control without AZT treatment. All results are shown as mean ± SD (n=3) and data presented are representative of at least three independent experiments.
Figure 4—figure supplement 1
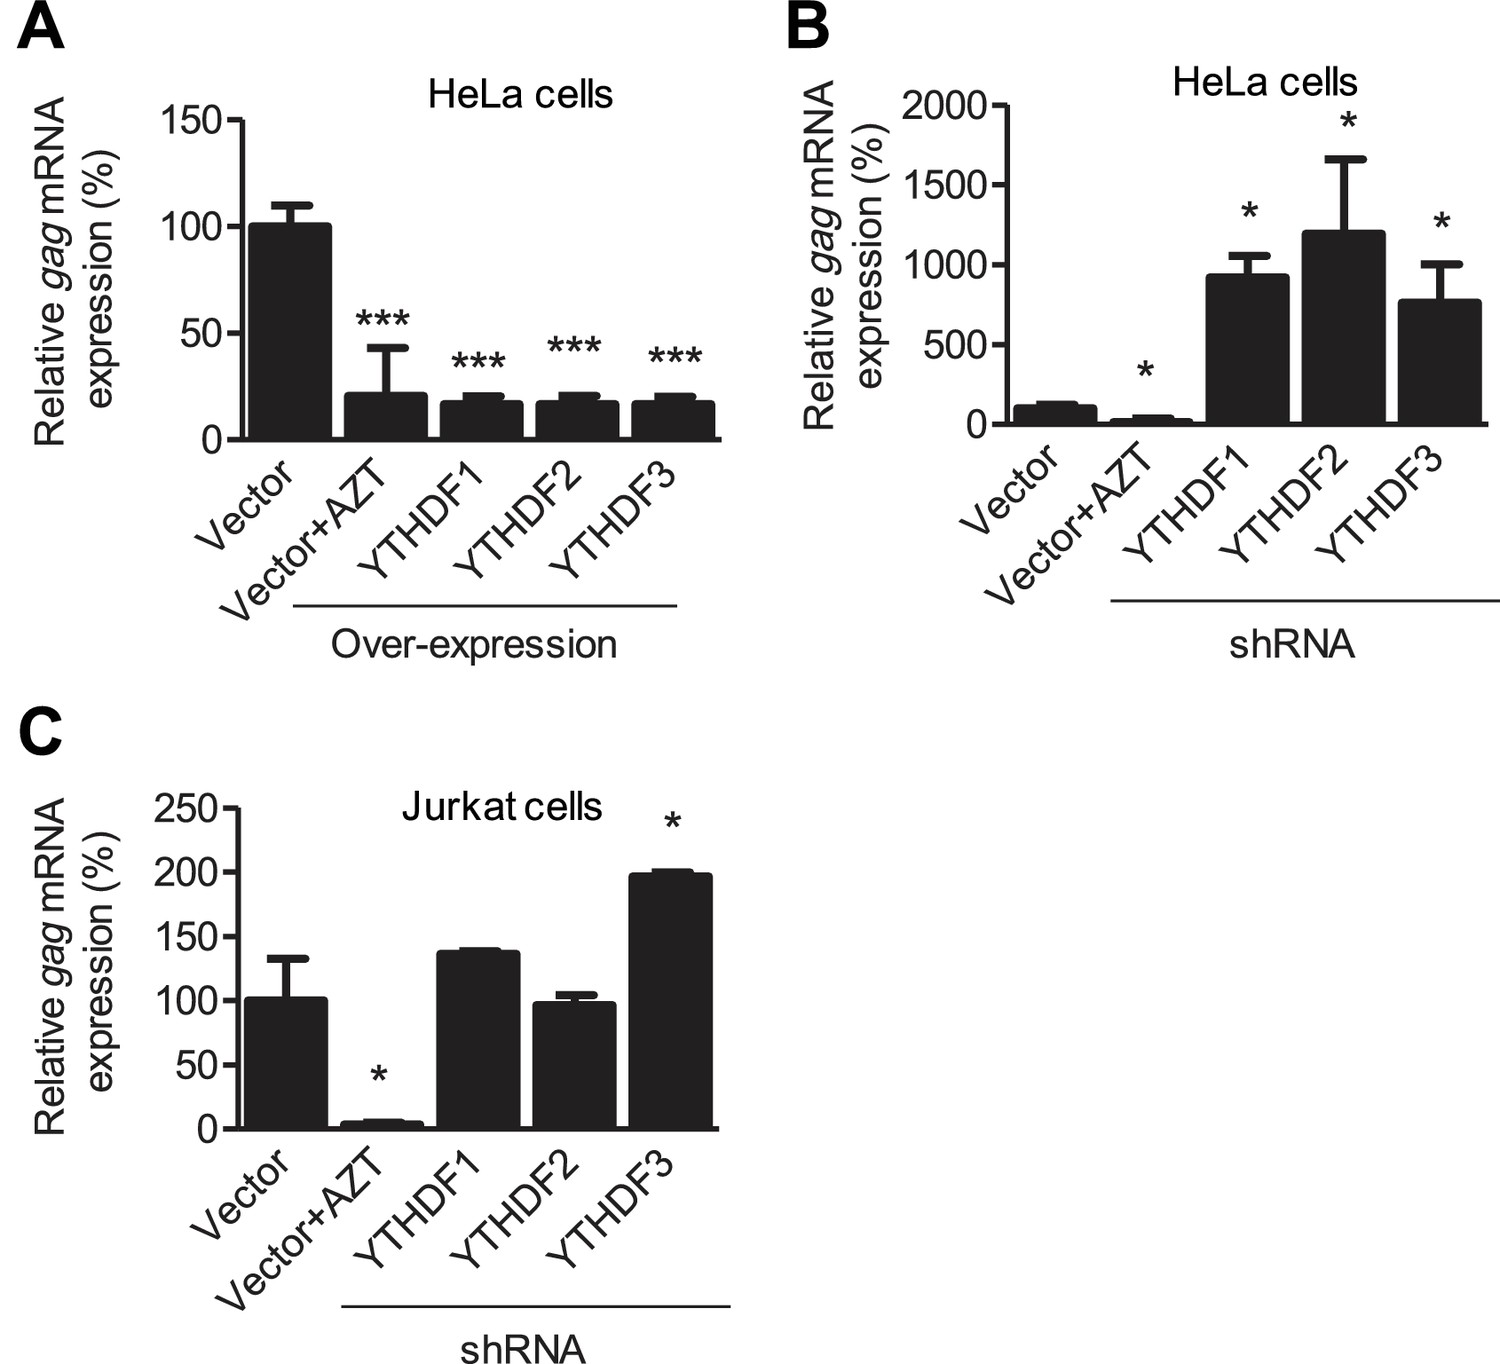
YTHDF1–3 proteins negatively regulate HIV-1 gag mRNA expression.
Specific shRNAs or scrambled shRNA vector-treated cells were infected with HIV-1 Luc/VSV-G at an MOI of 0.5. Total RNA was isolated from the cells 24 hr post-infection and HIV-1 gag mRNA levels were quantified using qRT-PCR. (A and B) HIV-1 gag mRNA levels in the infected HeLa cells with overexpression (A) or knockdown (B, shRNA) of YTHDF1–3 proteins. (C) HIV-1 gag mRNA levels in the HIV-1 infected Jurkat cells after knockdown of YTHDF1–3 proteins. AZT treated vector control cells were used as a negative control of HIV-1 infection (A–C). The vector controls without AZT were set as 100%. *p<0.05, **p<0.005, and ***p<0.0005, compared to vector control without AZT treatment. All results are shown as mean ± SD (n=3) and data presented are representative of at least three independent experiments.
Figure 5
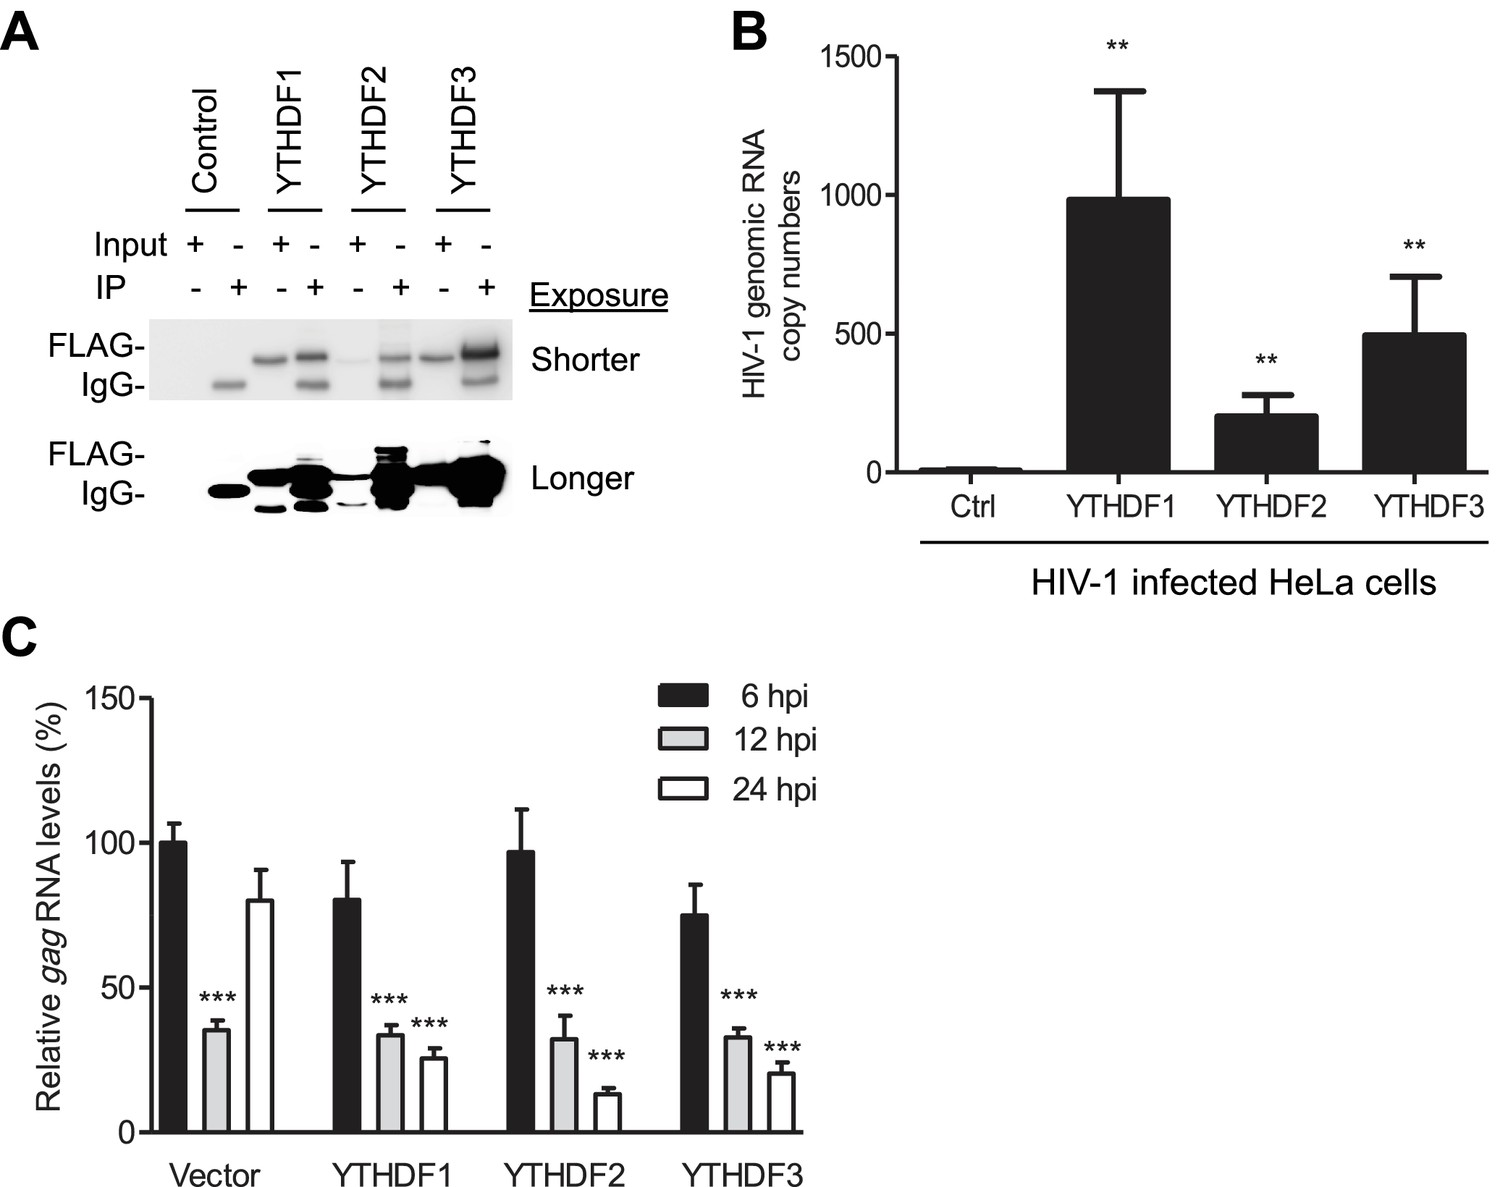
YTHDF1–3 proteins bind to HIV-1 gRNA in infected cells.
(A) Immunoblotting of YTHDF1–3 proteins in the input and immunoprecipitation (IP) samples from HIV-1-Luc/VSV-G infected HeLa cells. FLAG antibodies were used to immunoprecipitate FLAG-tagged YTHDF1–3 proteins overexpressed in HeLa cells after HIV-1 infection. A short and long exposure of the immunoblot is shown. (B) HIV-1 gRNA is bound by YTHDF1–3 proteins expressed in HeLa cells. HeLa cells stably overexpressing FLAG-tagged YTHDF1–3 proteins or empty vector control cells (Ctrl) were infected with HIV-1-Luc/VSV-G at an MOI of 5 for 3 hr. Cell lysates were immunoprecipitated with anti-FLAG, RNA was extracted and HIV-1 gag RNA levels were measured. **p<0.005 compared to the vector control cells. (C) YTHDF1–3 affect HIV-1 gag RNA kinetics. HIV-1 gag RNA levels in YTHDF1–3-expressing HeLa cells were quantified by qRT-PCR. The relative levels of gag RNA in infected cells were normalized to that of the vector control cells at 6 hr post-infection (hpi). ***p<0.0005, compared to the control cells at 6 hpi (set as 100%). All results are shown as mean ± SD (n=3) and data presented are representative of at least three independent experiments.
Figure 6
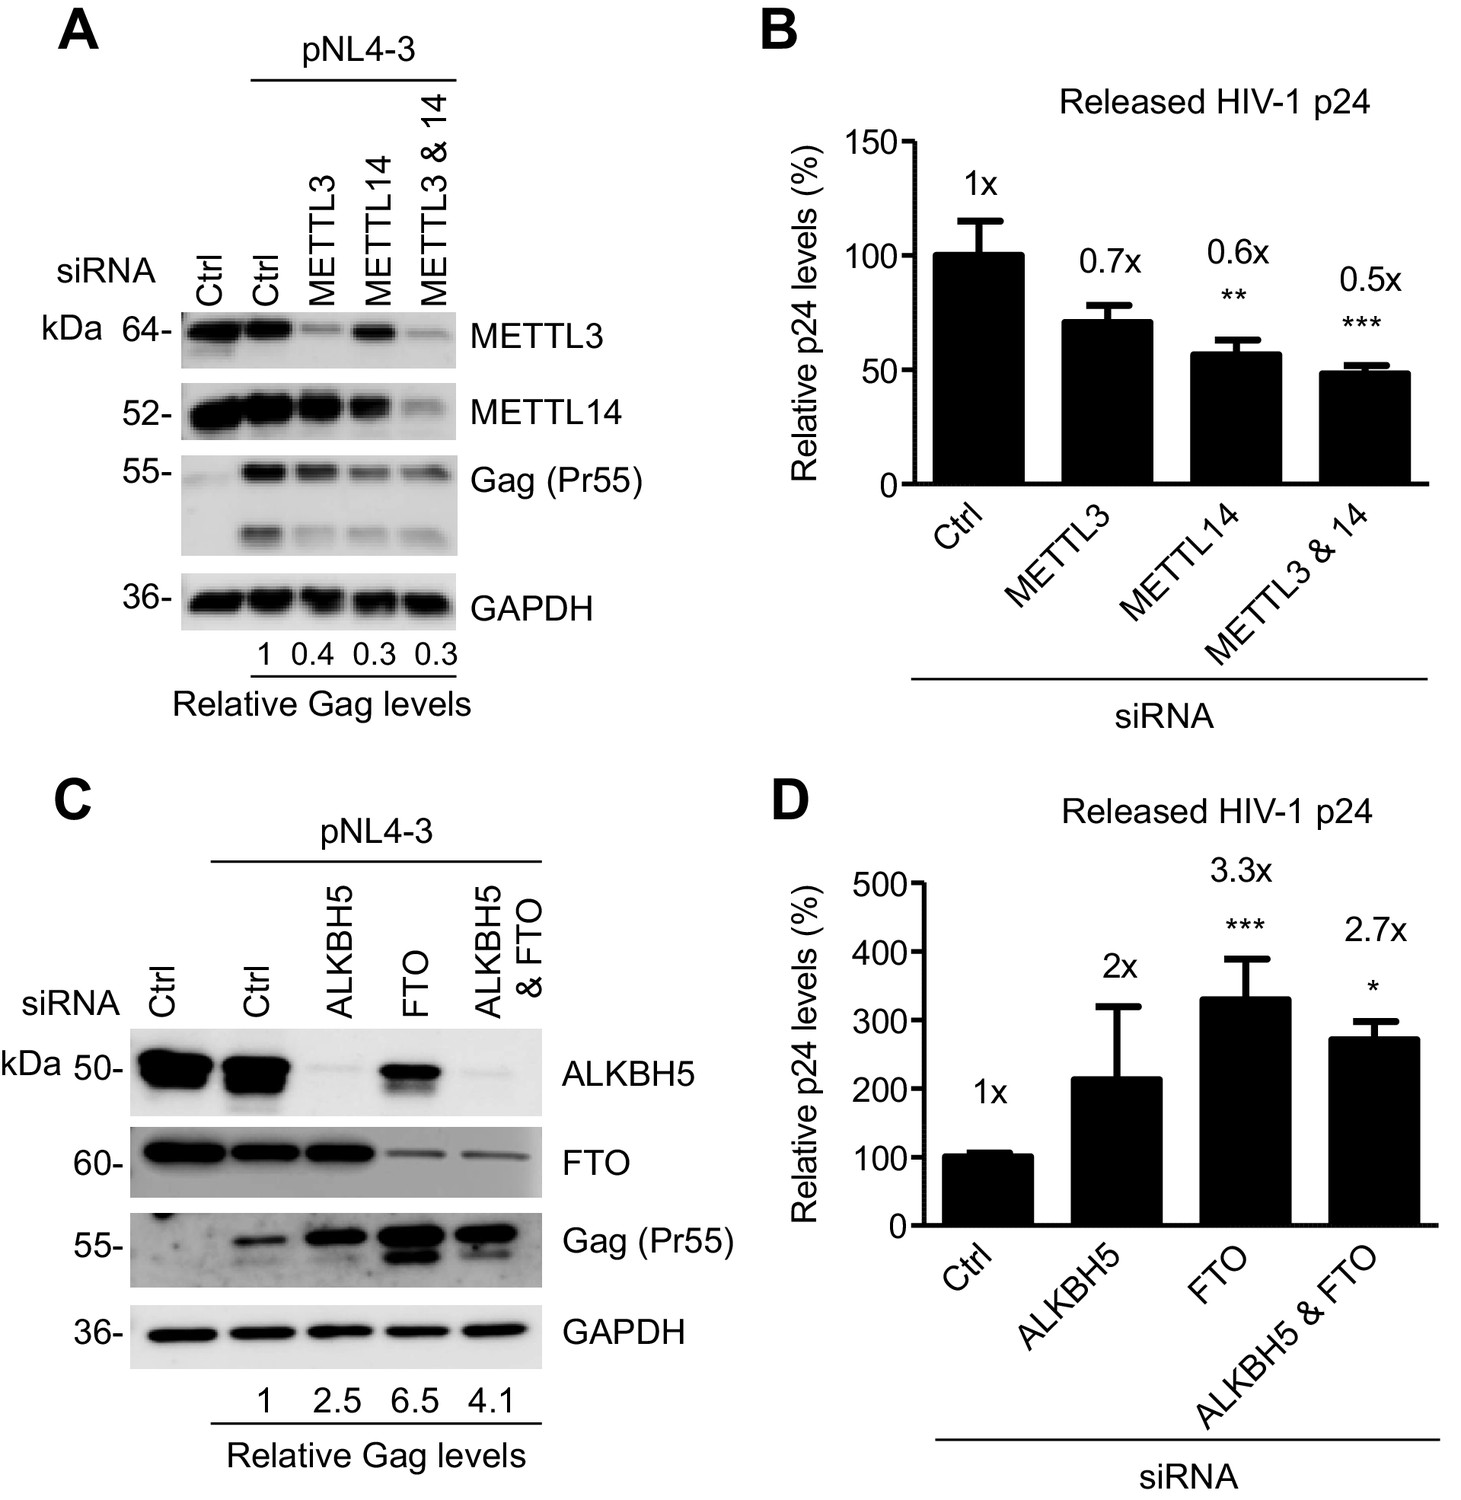
The m6A writers and erasers affect HIV-1 Gag expression in virus-producing cells.
(A and B) Individual or combined knockdown of endogenous METTL3 and METTL14 inhibits HIV-1 Gag protein expression. HEK293T cells were transfected with indicated siRNA, and then with an HIV-1 proviral DNA plasmid (pNL4-3). Cells and supernatants were collected for analyses at 36 hr post-transfection. (A) Expression of METTL3, METTL14 and HIV-1 Gag proteins in the transfected HEK293T cells was detected by immunoblotting. (C and D) Knockdown of endogenous AlkBH5, FTO, or both promotes HIV-1 Gag protein expression. HEK293T cells were transfected with indicated siRNA, and then with pNL4-3. Cells and supernatants were collected at 36 hr post-transfection. (C) Expression of AlkBH5, FTO and HIV-1 Gag proteins in the cells was detected by immunoblotting. (A and C) GAPDH was used as a loading control. Relative levels of Gag expression were normalized to GAPDH levels. (B and D) HIV-1 capsid p24 levels in supernatants were measured by ELISA. The relative levels (%) are also shown. *p<0.05 compared to the siRNA control. The results are shown as mean ± SD (n=3) and data presented are representative of three independent experiments.
Figure 7
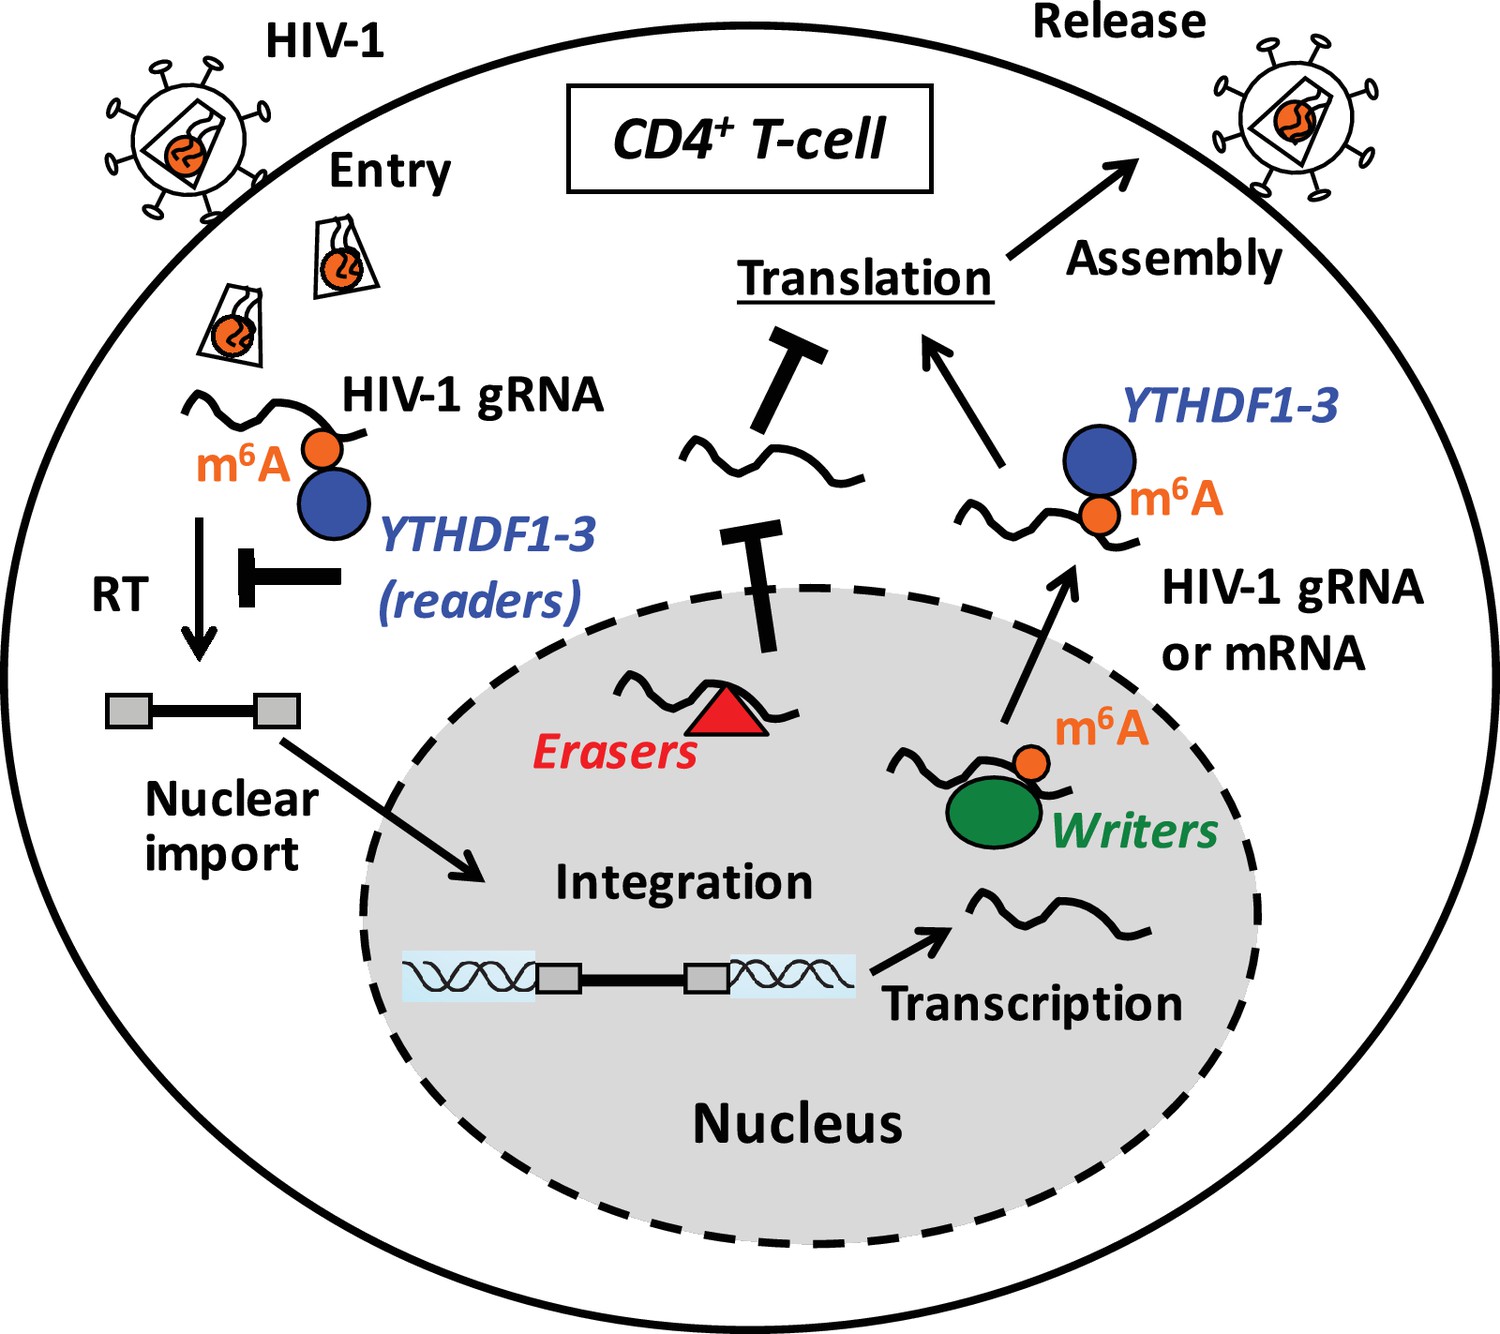
Proposed mechanisms and dynamics of m6A modification of HIV-1 RNA in regulating viral infection in cells.
In the nucleus, the m6A writers (METTL3 and METTL14) add the m6A marker to HIV-1 genomic RNA (gRNA) or mRNA, and the m6A erasers (FTO and AlkBH5) remove the m6A modifications of HIV-1 RNA. The m6A modification of HIV-1 RNA can promote viral protein translation in cells. In contrast, cytoplasmic m6A readers (YTHDF1–3) bind to m6A-modified HIV-1 gRNA, which can result in inhibition of HIV-1 reverse transcription (RT), viral mRNA expression, and thereby HIV-1 infection in cells.
Tables
Table 1
The shRNA sequences used in this study.
| shRNA | Sequences (5’-3’) |
|---|---|
| Non-specific (vector) control | CCGGCAACAAGATGAAGAGCACCAACTCGAGTTGGTGCTCTTCATCTTGTTGTTTTT |
| YTHDF1 | CCGGCCCGAAAGAGTTTGAGTGGAACTCGAGTTCCACTCAAACTCTTTCGGGTTTTTG |
| YTHDF2 | CCGGCGGTCCATTAATAACTATAACCTCGAGGTTATAGTTATTAATGGACCGTTTTTG |
| YTHDF3 | CCGGGATAAGTGGAAGGGCAAATTTCTCGAGAAATTTGCCCTTCCACTTATCTTTTTG |
Table 2
The siRNA sequences used in this study.
| siRNA | Sequences (5’-3’) |
|---|---|
| METTL3 | 5’-CTGCAAGTATGTTCACTATGA-3’ 5’-AGGAGCCAGCCAAGAAATCAA-3’ |
| METTL14 | 5’-TGGTGCCGTGTTAAATAGCAA-3’ 5’-AAGGATGAGTTAATAGCTAAA-3’ |
| FTO | 5’-AAATAGCCGCTGCTTGTGAGA-3’ |
| AlkBH5 | 5’-AAACAAGTACTTCTTCGGCGA-3’ |
Table 3
Sequences of PCR primers and probes used in this study.
| Primers | Sequences (5’-3’) |
|---|---|
| HIV-1 gag forward | CTAGAACGATTCGCAGTTAATCCT |
| HIV-1 gag reverse | CTATCCTTTGATGCACACAATAGAG |
| Unspliced GAPDH forward | GGGAAGCTCAAGGGAGATAAAATTC |
| Unspliced GAPDH reverse | GTAGTTGAGGTCAATGAAGGGGTC |
| Spliced GAPDH forward | GGAAGGTGAAGGTCGGAGTCAACGG |
| Spliced GAPDH reverse | CTGTTGTCATACTTCTCATGGTTCAC |
| MH531 forward (for HIV-1 late reverse transcription (RT) products) | TGTGTGCCCGTCTGTTGTGT |
| BB reverse (for late RT products) | GGATTAACTGCGAATCGTTC |
| HIV-1 late RT product probe | TCGACGCAGGACTCGGCTTGCT |
| 2-LTR probe | AAGTAGTGTGTGCCCGTCTGTTGTGTGACTC |
| 2-LTR forward | GCCTGGGAGCTCTCTGGCTAA |
| 2-LTR reverse | GCCTTGTGTGTGGTAGATCCA |
| LW59 (forward, alternative for late RT detection in shRNA vector-transduced cells) | GACATAGCAGGAACTACTAGTACCC |
| LW60 (reverse, alternative for late RT detection in shRNA vector-transduced cells) | GGTCCTTGTCTTATGTCCAGAATGC |
Download links
A two-part list of links to download the article, or parts of the article, in various formats.
Downloads (link to download the article as PDF)
Open citations (links to open the citations from this article in various online reference manager services)
Cite this article (links to download the citations from this article in formats compatible with various reference manager tools)
N6-methyladenosine of HIV-1 RNA regulates viral infection and HIV-1 Gag protein expression
eLife 5:e15528.
https://doi.org/10.7554/eLife.15528


