In vivo super-resolution RESOLFT microscopy of Drosophila melanogaster
- Max Planck Institute for Biophysical Chemistry, Germany
- Georg-August-Universität Göttingen, Germany
- University Medical Center of Göttingen, Germany
Figures
Figure 1 with 1 supplement

Drosophila melanogaster ubiquitously expressing rsEGFP2-α-tubulin.
Confocal recordings of living resected tissues of transgenic wandering third instar larvae (A–C, F–J) and of adult flies (D,E) ubiquitously expressing rsEGFP2-α-tubulin. (A) Body wall attachment site, (B) eye imaginal disc, (C) salivary glands, (D) sperm, (E) ovaries, (F) intestinal muscles, (G) intestine, (H) salivary duct, (I) salivary duct, (J) body wall muscles. Images display raw data. Scale bars: 10 µm.
Figure 1—figure supplement 1
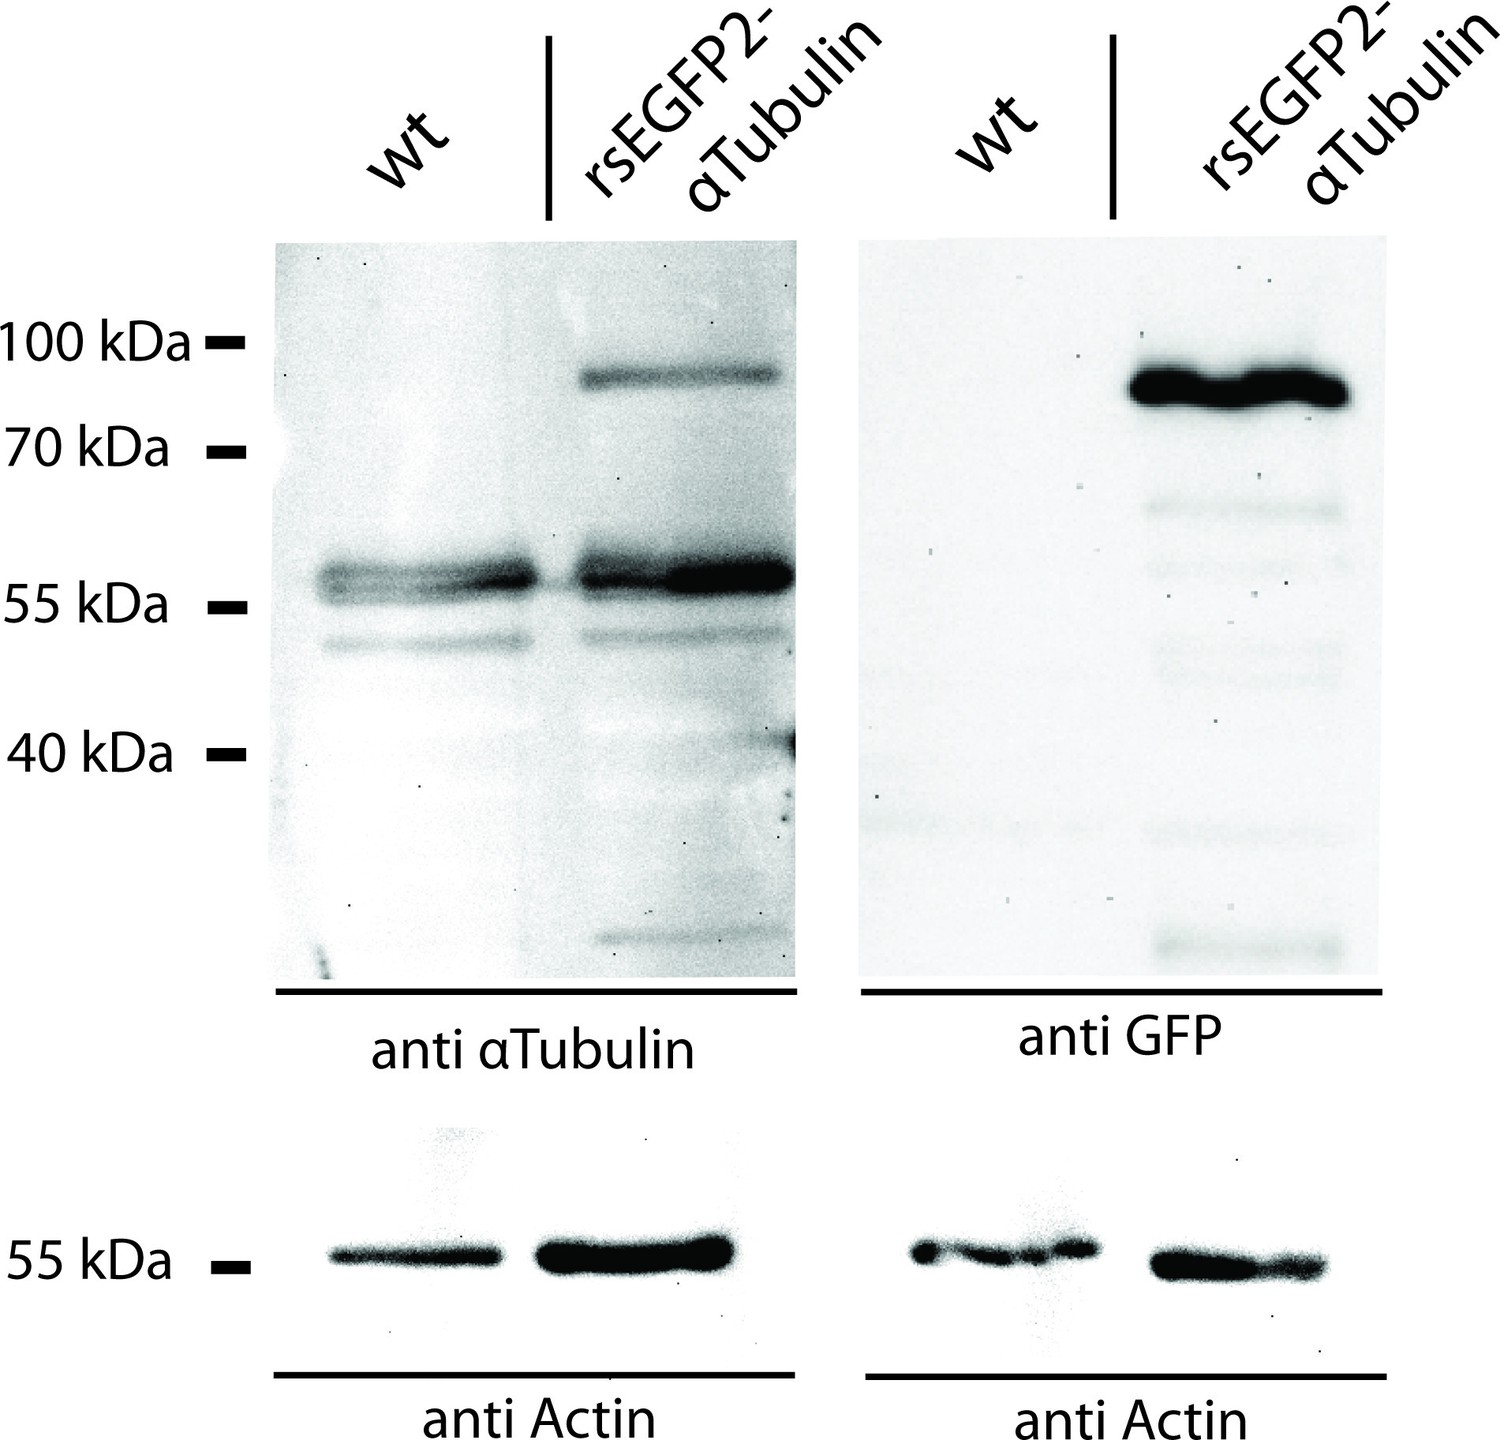
Western Blot analysis of the expression level of rsEGFP2-α-tubulin in Drosophila larvae.
Protein lysates of dissected Oregon R (wild type control) and rsEGFP2-α-tubulin expressing Drosophila larvae were decorated with antisera against α-tubulin and GFP. As a loading control, the blots were decorated with an antiserum against actin.
Figure 2 with 3 supplements

RESOLFT nanoscopy of resected tissues of third instar larvae.
(A) Comparison of confocal and RESOLFT recordings taken on body wall muscles of a larva expressing rsEGFP2-α-tubulin. (B,C) Magnifications of the areas indicated in (A). (D) RESOLFT and corresponding confocal images were taken at the indicated depths on body wall muscles of a dissected third instar larva ubiquitously expressing rsEGFP2-α-tubulin. All images display raw data. Scale bars: 1 µm.
Figure 2—figure supplement 1
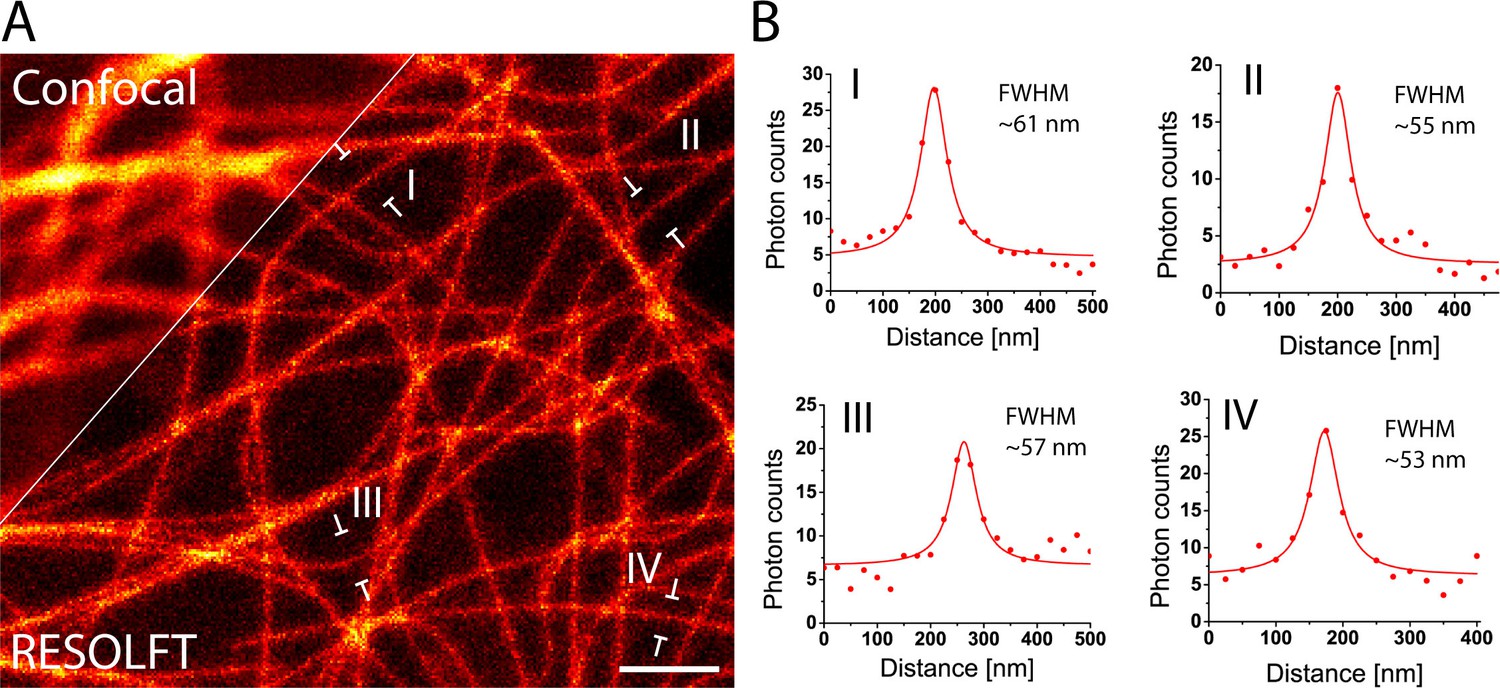
RESOLFT nanoscopy of resected tissues of third instar larvae.
(A) Comparison of confocal and RESOLFT recordings taken on resected salivary glands from a larva expressing rsEGFP2-α-tubulin. (B) Line profiles taken at the positions as indicated in (A). The data points represent an average of three adjacent (25 nm distance) measurements. The averaged data were fitted with a Lorentzian function (solid line). The FWHM was determined on the fitted function. Scale bar: 1µm.
Figure 2—figure supplement 2
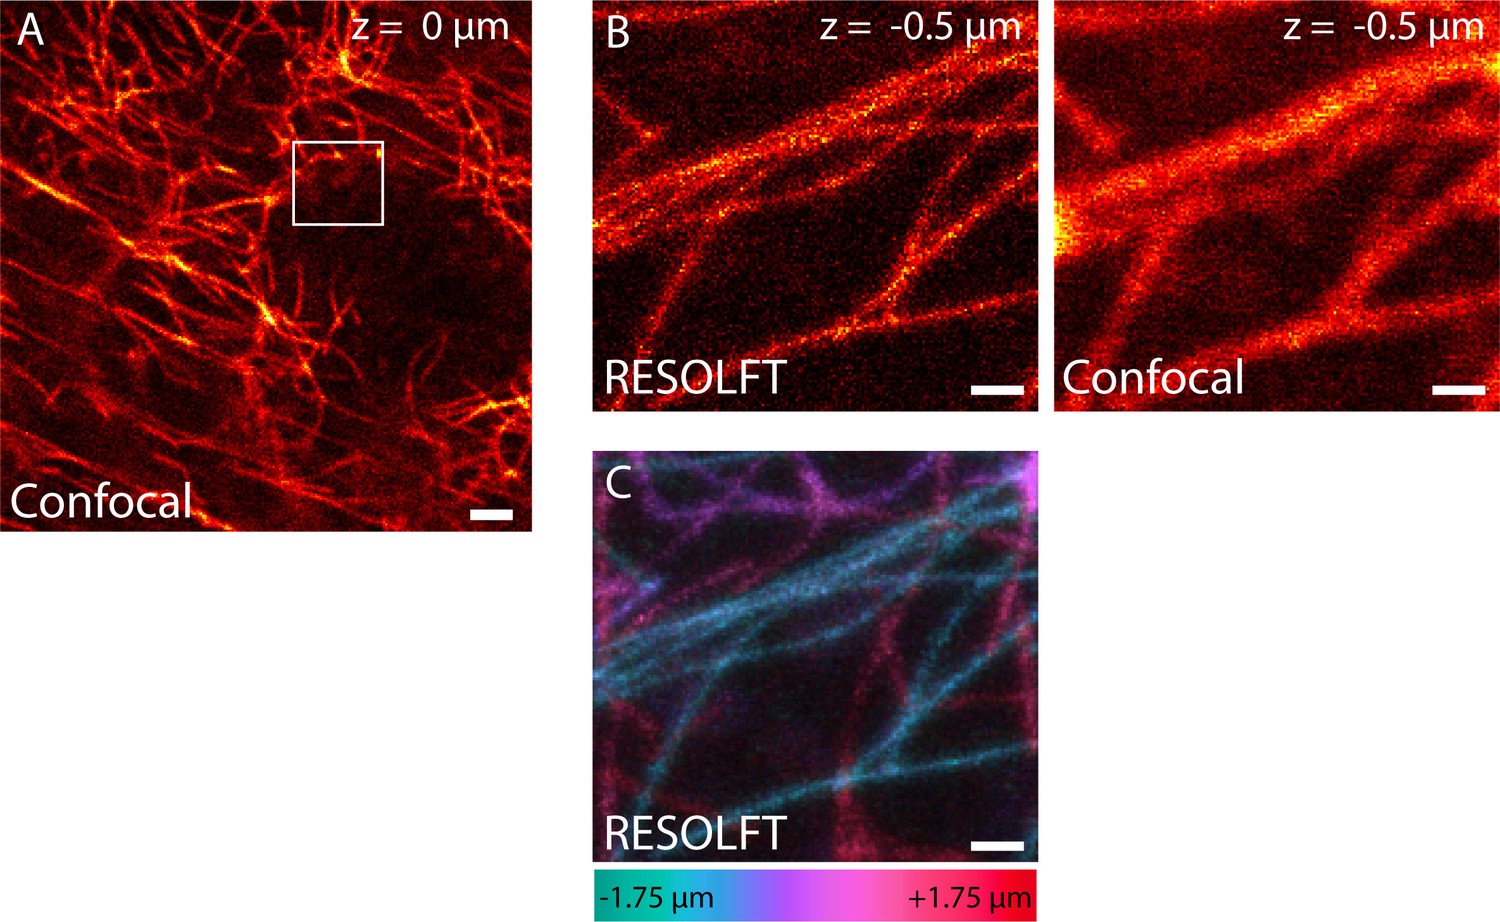
RESOLFT volume imaging using a 2D-doughnut for off-switching.
Dissected living body wall muscles of a Drosophila melanogaster larva ubiquitously expressing rsEGFP2-α-tubulin were imaged. We recorded 14 RESOLFT images with 250 nm axial distance between each image. (A) Confocal overview. The image was recorded at the center plane (z = 0) of the RESOLFT image stack. (B) RESOLFT and corresponding confocal image of the 3D stack recorded at z = -0.5 µm. (C) Maximum intensity projection of the recorded volume displayed in the xy-view. The color coding shows the relative z-position of the microtubule filaments within the recorded volume. (A,B) display raw data, (C) displays raw data smoothed with 1.2 pixel wide Gaussian. See Video 1. Scale bars: 2 µm (A), and 500 nm (B,C).
Figure 2—figure supplement 3
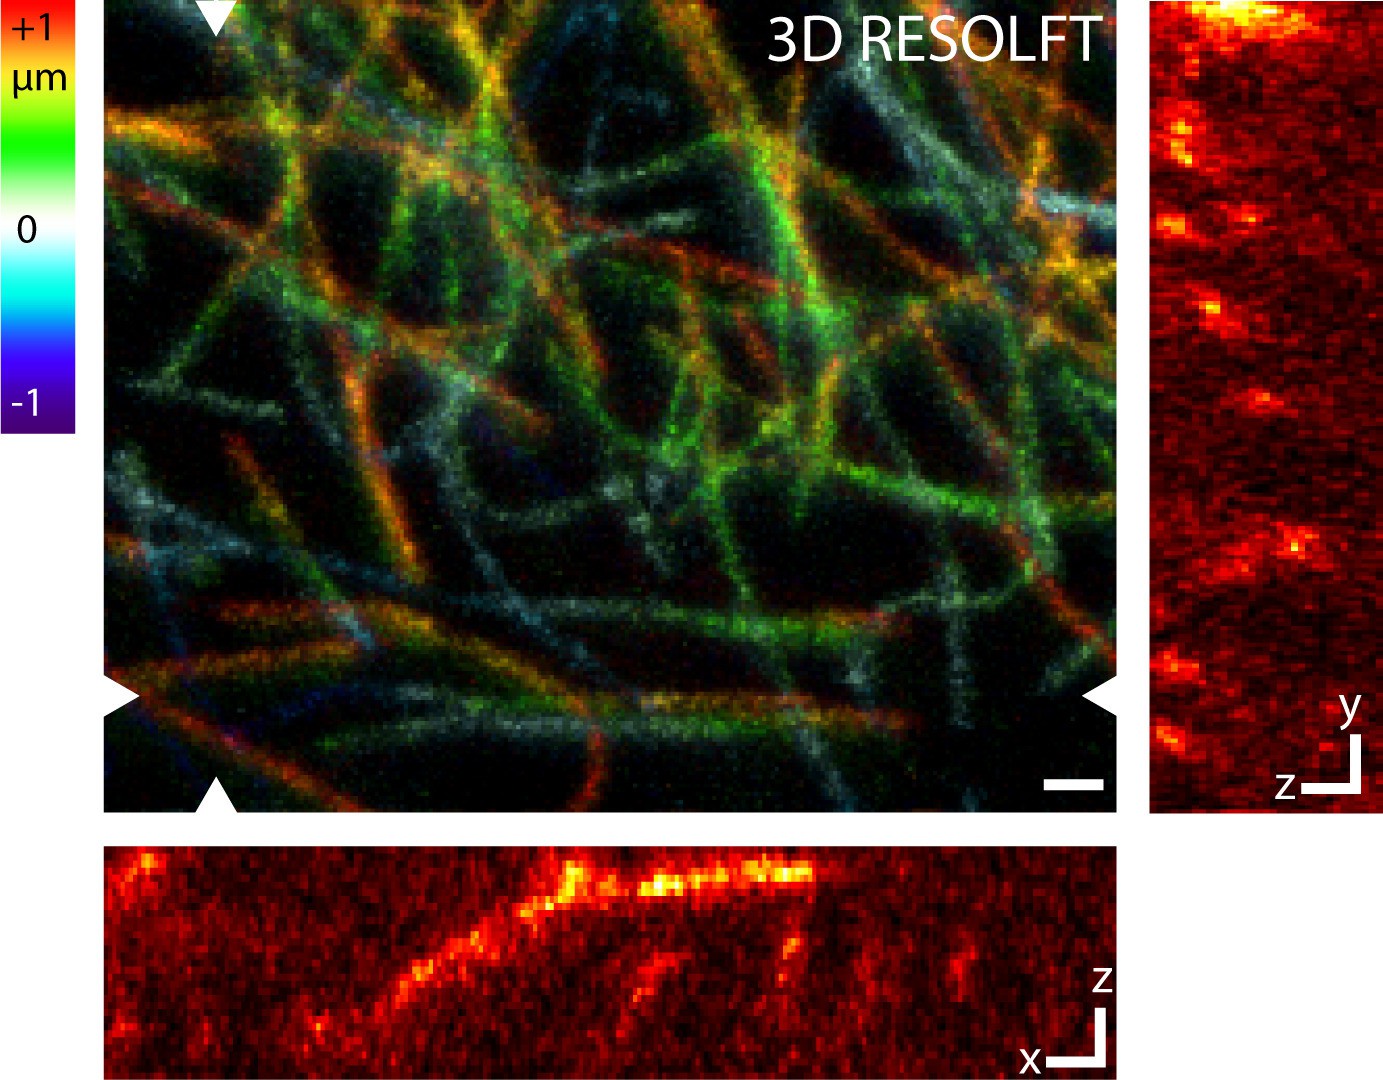
RESOLFT volume imaging using a 3D-doughnut for off-switching.
This configuration of the microscope improves the optical resolution along all three directions. Dissected living body wall muscles of a Drosophila melanogaster larva ubiquitously expressing rsEGFP2-α-tubulin were imaged. The imaged volume has a size of 8.5 µm x 6.8 µm x 2 µm. Large image: Maximum intensity projection of the RESOLFT image stack in the xy view. The color coding shows the relative z-position of the microtubule filaments within the recorded volume. Small images: xz and yz sections at the positions indicated in the large image. Images display raw data smoothed with 1.2 pixel wide Gaussian. See Video 2. Scale bars: 1 µm.
Figure 3 with 1 supplement
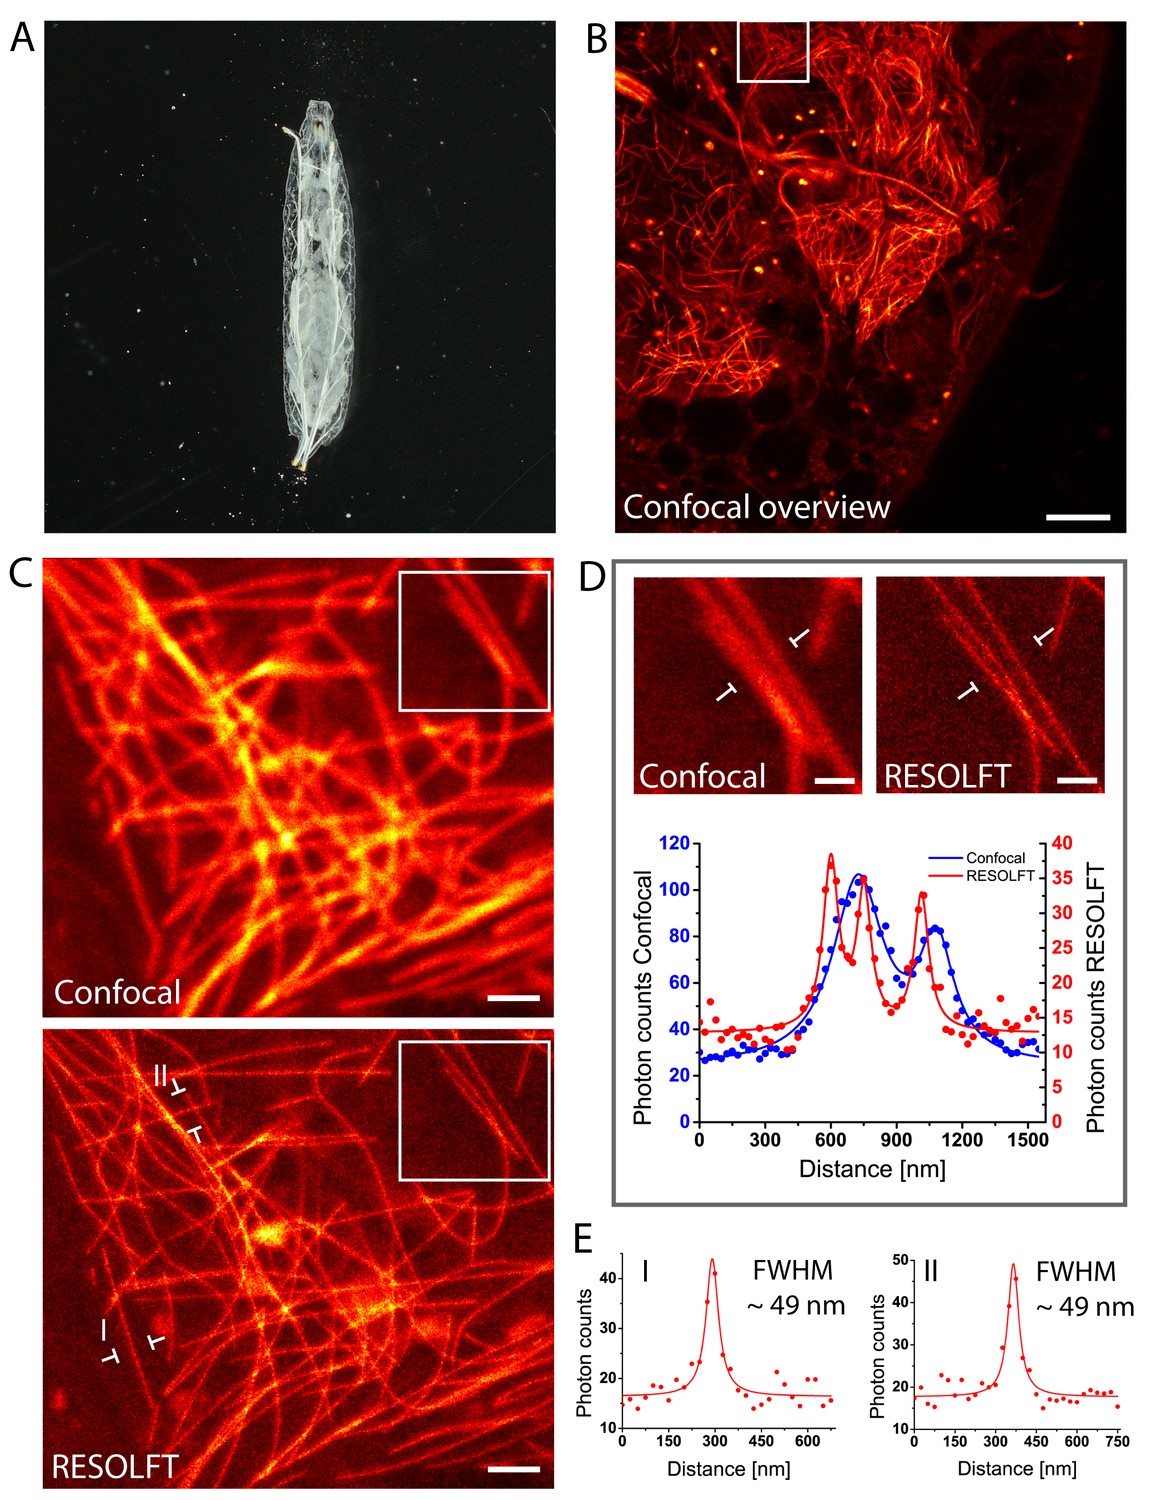
In vivo RESOLFT imaging of intact living Drosophila melanogaster larvae.
(A) Living second instar larva expressing rsEGFP2-α-tubulin were placed under a coverslip between two spacers in Schneider’s medium. (B) Confocal overview imaged through the cuticle of the larva. (C) Confocal (top) and corresponding RESOLFT (bottom) image of the area indicated in (B). (D) Top: Magnifications of the areas indicated in (C). Bottom: Line profiles taken at the indicated positions. The data points represent an average of three adjacent (25 nm distance) measurements. (E) Line profiles taken at the positions indicated in (C). The data points represent an average of three adjacent (25 nm distance) measurements. The averaged data were fitted with a Lorentzian function (solid line). The FWHM was determined on the fitted function. See also (Figure 3—figure supplement 1). Images display raw data. Scale bars: 10 µm (B), 1 µm (C), and 500 nm (D).
Figure 3—figure supplement 1

Determination of the achieved resolution in intact larvae.
RESOLFT recording taken on an intact living second instar larva expressing rsEGFP2-α-tubulin. Ten line profiles were taken at each indicated position. The data points represent an average of ten adjacent measurements (20 nm distance between each measurement). The averaged data were fitted with a Lorentzian function (solid line) and the FWHM was determined on the fit. Scale bar: 1 µm.
Figure 4 with 1 supplement
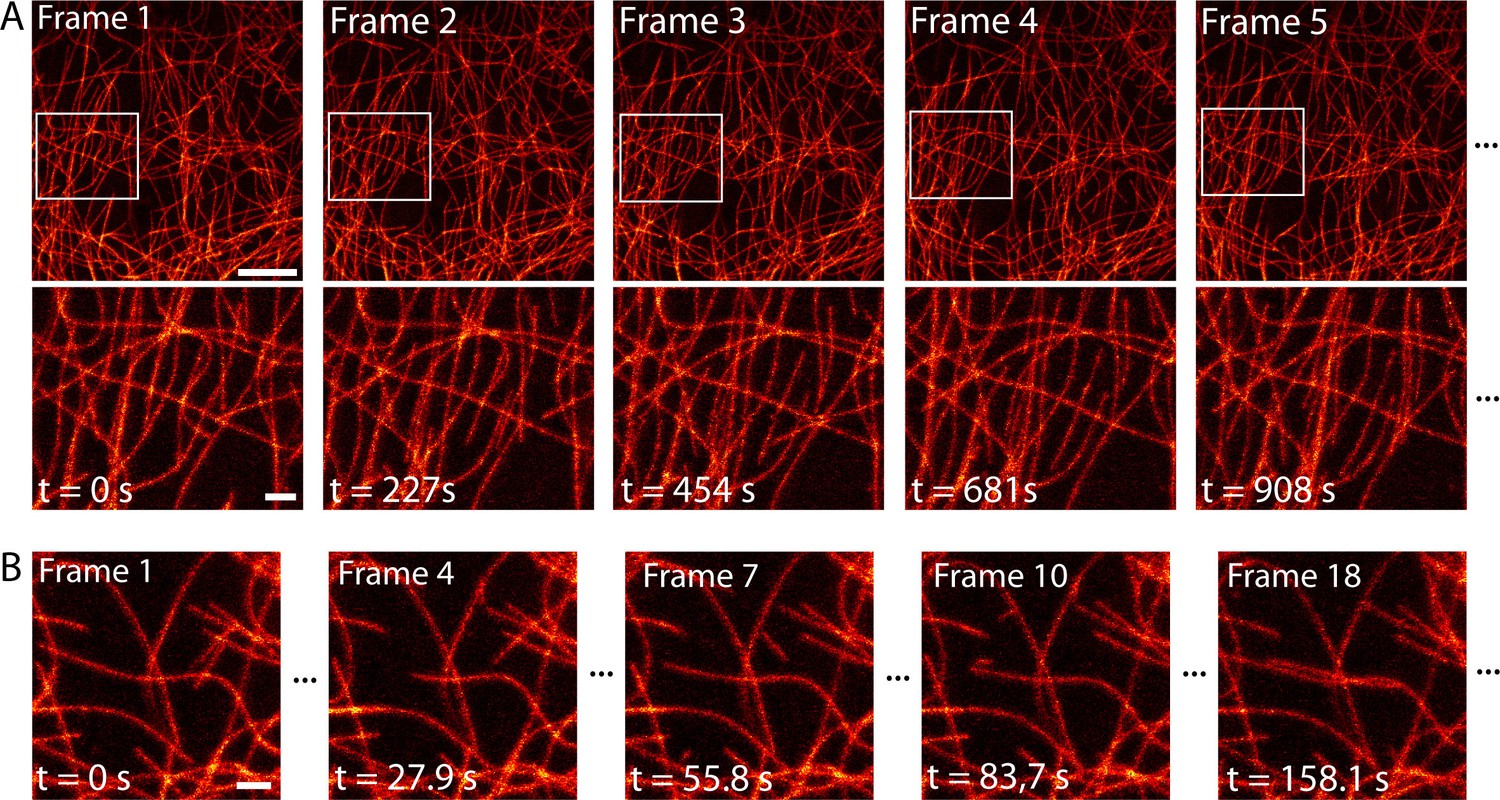
Time-lapse RESOLFT imaging of the microtubule cytoskeleton in body wall muscles of dissected Drosophila melanogaster larvae.
(A) First five of in total 40 RESOLFT image frames of dissected larva tissue expressing rsEGFP2-α-tubulin. Images were continuously recorded. Recording time of one frame: 227 s. Top: RESOLFT overview; bottom: Magnifications of the areas indicated. (B) Time lapse RESOLFT imaging with high frame rate. Selected frames of in total 40 frames recorded on body wall muscles are displayed. Recording time of one frame: 9.3 s. Data are also represented in Videos 3 and 4. All images display raw data. Scale bars: 5 µm (A, top row) and 1 µm (A, bottom row, and B).
Figure 4—figure supplement 1
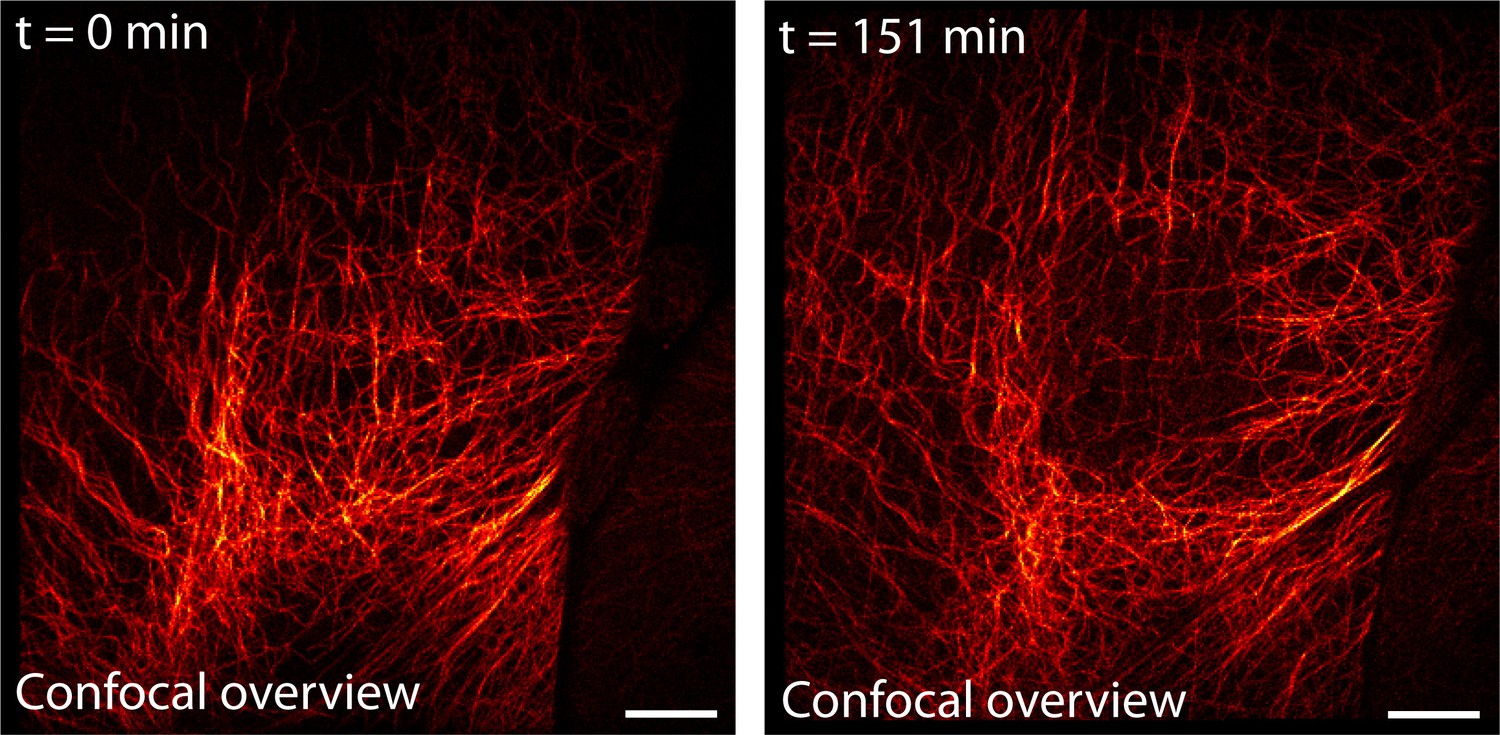
Confocal overview of the region shown in Figure 4A and Video 3 before and after long-term RESOLFT time-lapse imaging.
Imaging was performed on body wall muscles of a dissected Drosophila melanogaster larva expressing rsEGFP2-α-tubulin. The RESOLFT time-lapse recording (151.2 min of continuous recording) was performed in the central part (23 µm x 24 µm) of the shown overview image. The displayed confocal overview images were recorded before and after the time-lapse recording. Scale bar: 10 µm.
Videos
Video 1
Animation of a 3D stack recorded with a RESOLFT microscope featuring a 2D-doughnut for off-switching.
The axial resolution was diffraction limited (confocal detection). Dissected living body wall muscles of a Drosophila melanogaster larva ubiquitously expressing rsEGFP2-α-tubulin were imaged. The imaged volume has a size of 4.2 µm x 3.9 µm x 3.5 µm. We recorded 14 RESOLFT images with 250 nm axial distance between each image. The 3D reconstruction was generated using the program ImageJ with the plugin 3D Project. See Figure 2—figure supplement 2.
Video 2
Animation of a 3D stack recorded with a RESOLFT microscope featuring a 3D-doughnut for off-switching.
This configuration of the microscope improved the optical resolution along all three directions. Dissected living body wall muscles of a Drosophila melanogaster larva ubiquitously expressing rsEGFP2-α-tubulin were imaged. The imaged volume has a size of 8.5 µm x 6.8 µm x 2 µm. We recorded 33 RESOLFT images with 60 nm axial distance between each image. The 3D reconstruction was generated using the program ImageJ with the plugin 3D Project. See Figure 2—figure supplement 3.
Video 3
Time-lapse RESOLFT imaging of the microtubule cytoskeleton in dissected Drosophila melanogaster third instar larvae body wall muscles.
40 RESOLFT image frames were continuously recorded. Recording time of one frame: 227 s. The video displays 4 frames per second. Corresponding still images are shown in Figure 4A. Scale bar: 2.5 µm.
Video 4
Time-lapse RESOLFT imaging of the microtubule cytoskeleton in dissected Drosophila melanogaster third instar larvae body wall muscles.
40 RESOLFT image frames were continuously recorded. Recording time of one frame: 9.3 s. The video displays 4 frames per second. Corresponding still images are shown in Figure 4B. Scale bar: 1 µm.
Additional files
-
Supplementary file 1
Representation of color maps used.
The numbers indicate the photon counts that correspond to the lowest and highest value of the respective color map. Blue color indicates saturation.
- https://doi.org/10.7554/eLife.15567.016
-
Supplementary file 2
Imaging parameters used for RESOLFT microscopy.
Light powers were measured in front of the objective’s back focal plane.
- https://doi.org/10.7554/eLife.15567.017
Download links
A two-part list of links to download the article, or parts of the article, in various formats.
Downloads (link to download the article as PDF)
Open citations (links to open the citations from this article in various online reference manager services)
Cite this article (links to download the citations from this article in formats compatible with various reference manager tools)
In vivo super-resolution RESOLFT microscopy of Drosophila melanogaster
eLife 5:e15567.
https://doi.org/10.7554/eLife.15567


