Multisensory integration in the developing tectum is constrained by the balance of excitation and inhibition
- Brown University, United States
- Tulane University, United States
- Bard College, United States
Figures
Figure 1
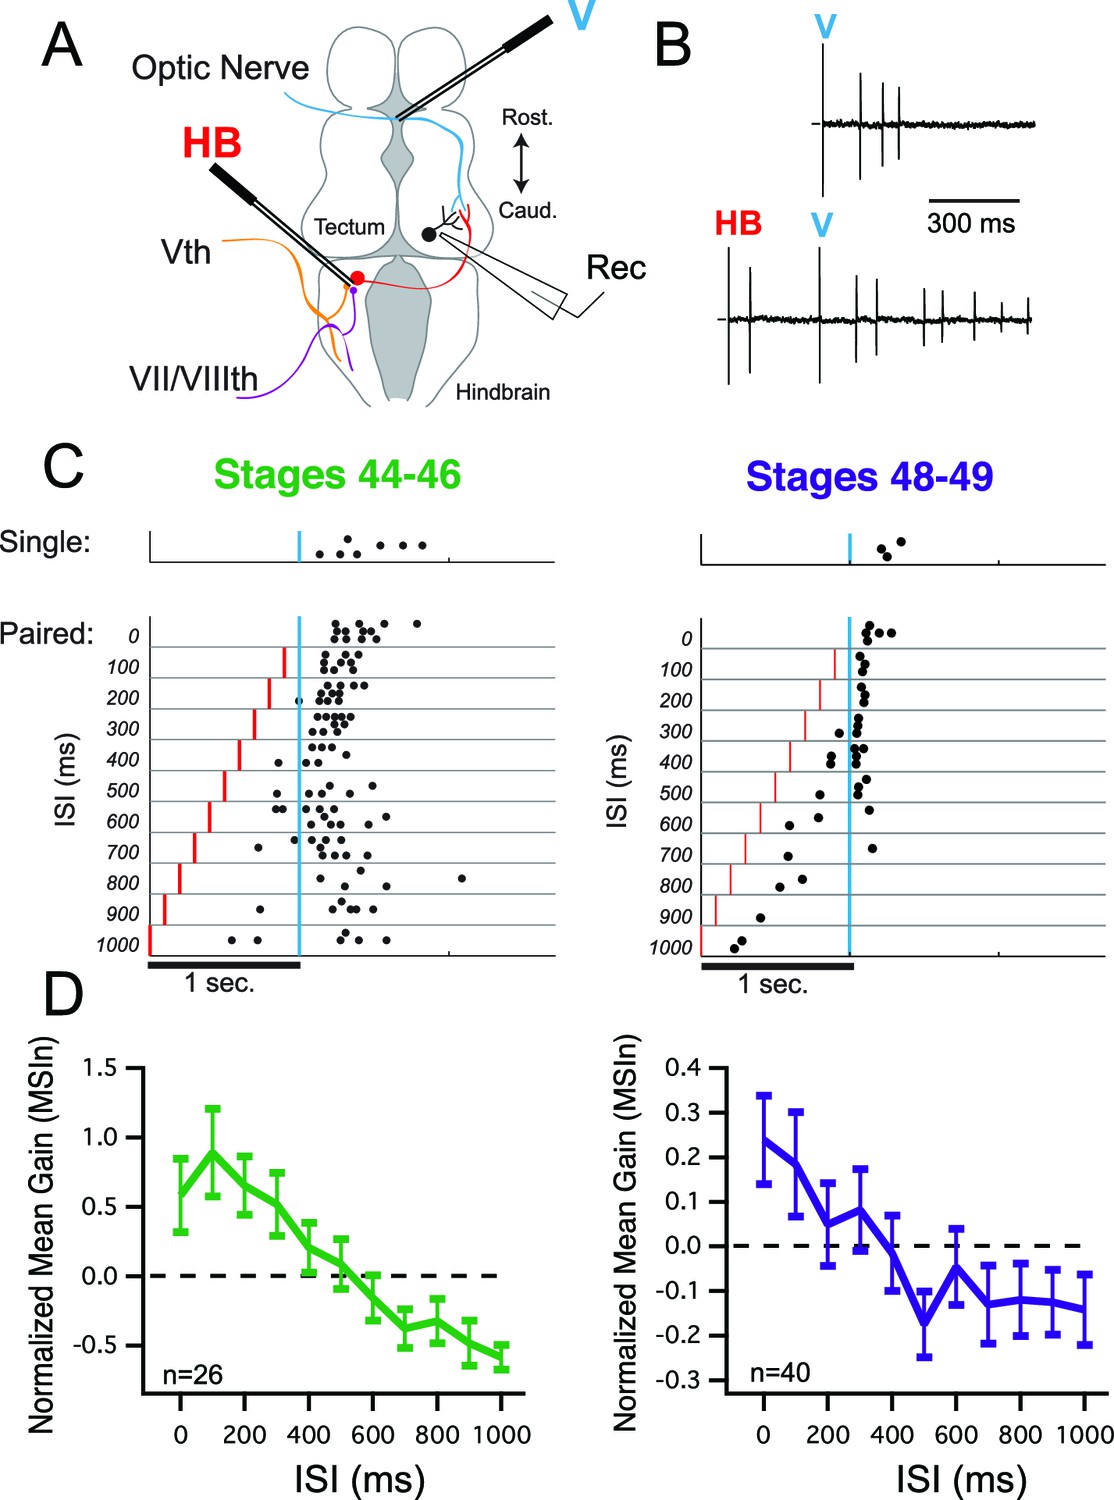
Multisensory integration in tectal neurons is dependent on interstimulus interval (ISI).
(A) Diagram showing placement of the 'V' and 'HB' bipolar electrodes relative to tectal afferents and recording location. (B) Raw traces of cell-attached spikes generated during single and paired stimulation. Letters indicate times of stimulus presentation and modality of stimulus. (C) Example raster plots from two cells, one from a stages 44–46 animal (left) and one from a stages 48–49 animal (right) as a function of ISI. (D) Grouped data from both developmental groups. In a given cell, data are averaged over trials at each ISI, to determine the MSIn ratio. Plotted here is the population means of these trial-averaged MSIn ratios, at the ISI's tested. Error bars show +/– S.E.M. MSIn = (combined response – single response) / single response.
Figure 2
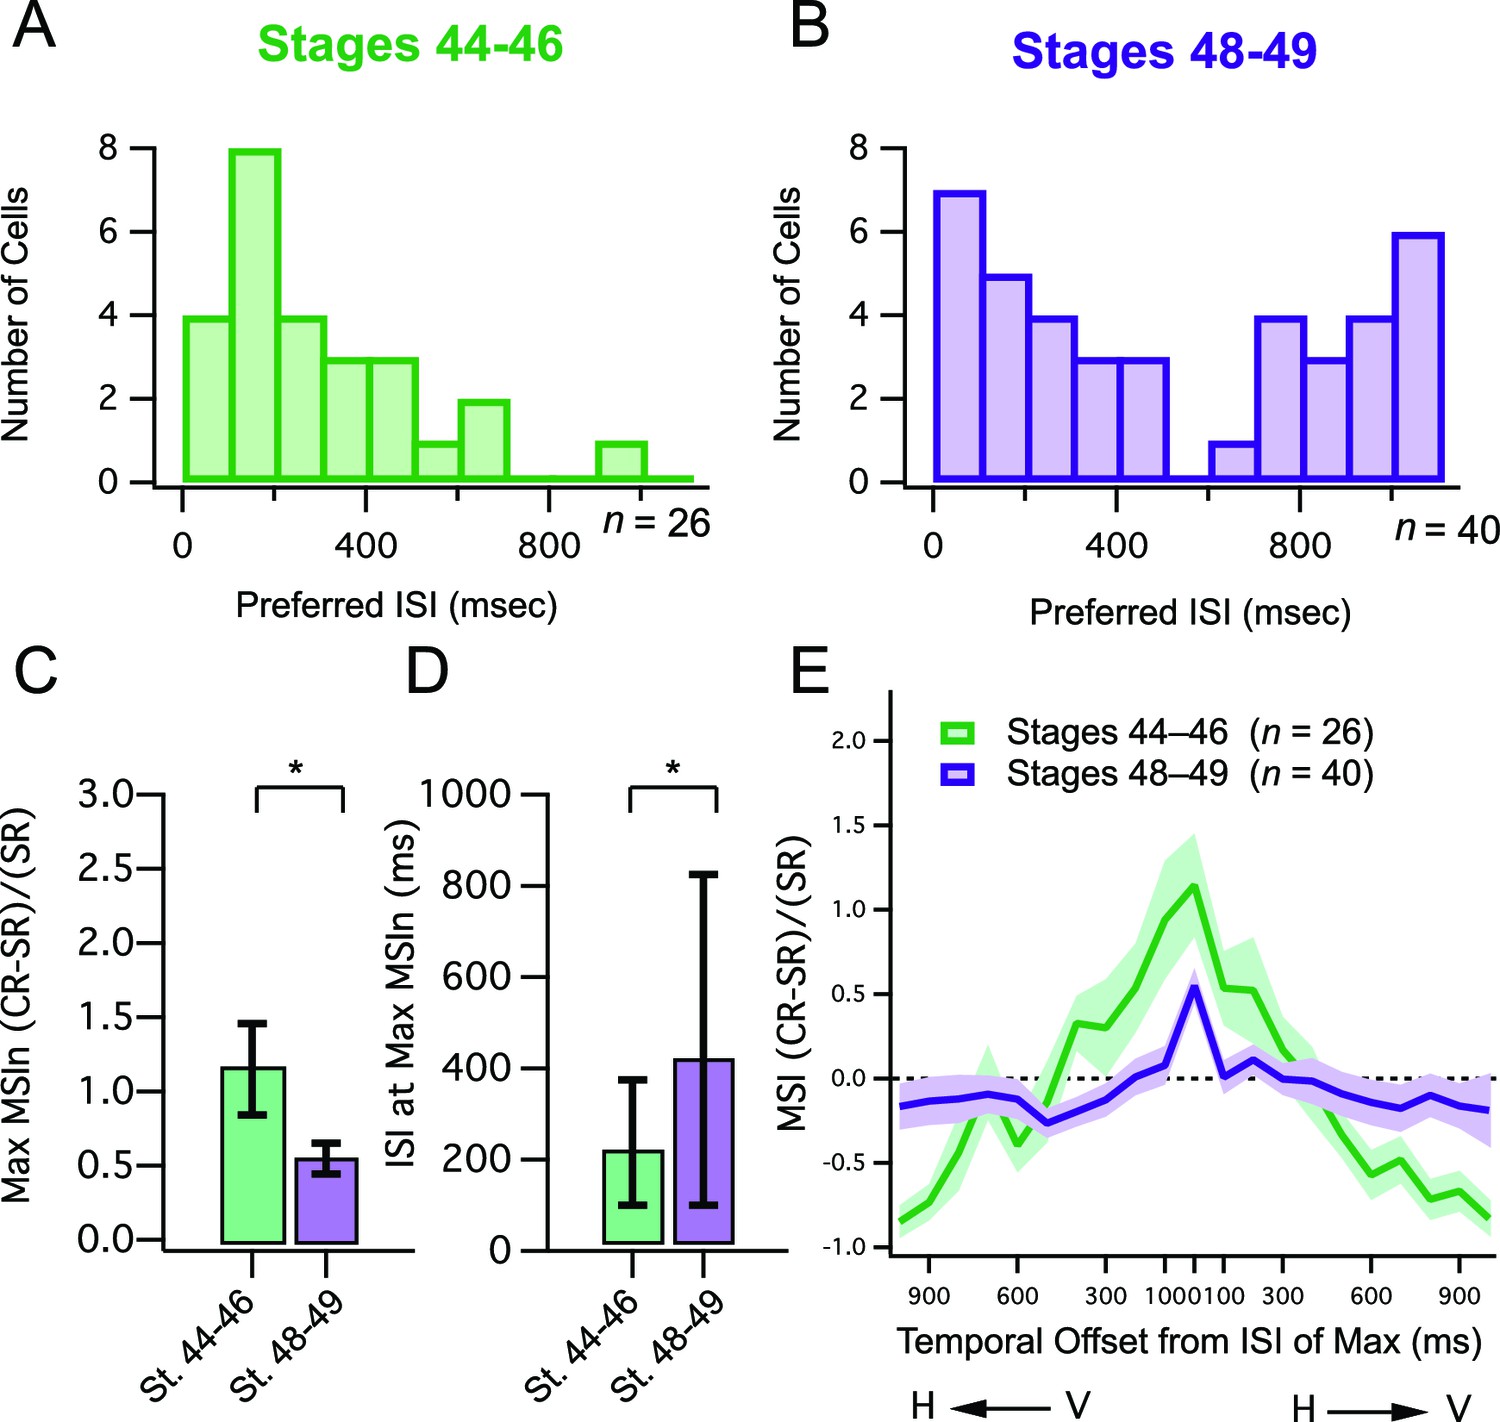
Developmental changes in temporal tuning and gain of MSI.
(A, B) Histogram bars show the ISI that for each cell, exhibited maximal MSIn values. Notice that values cluster at shorter ISIs in the younger tadpoles. Older tadpoles are tuned to a broader range of ISIs. (C) Maximum MSIn ratios are compared across developmental stages, and show decrease in MSIn gain over development. Error bars indicate +/– S.E.M. (D) The identity of the ISI's responsible for the maximal response (and thus the maximum MSIn ratio) in each developmental group are compared. Error bars show interquartile range. *p<0.05. (E) MSIn-versus-ISI tuning curves from crossmodal pairs were aligned at their peak values, and then averaged across cells. Solid lines connect the population means. Shaded areas demarcate +/– S.E.M. Stage 48–49 cells are more narrowly tuned around their preferred ISI. MSIn = (combined response – single response) / single response.
Figure 3
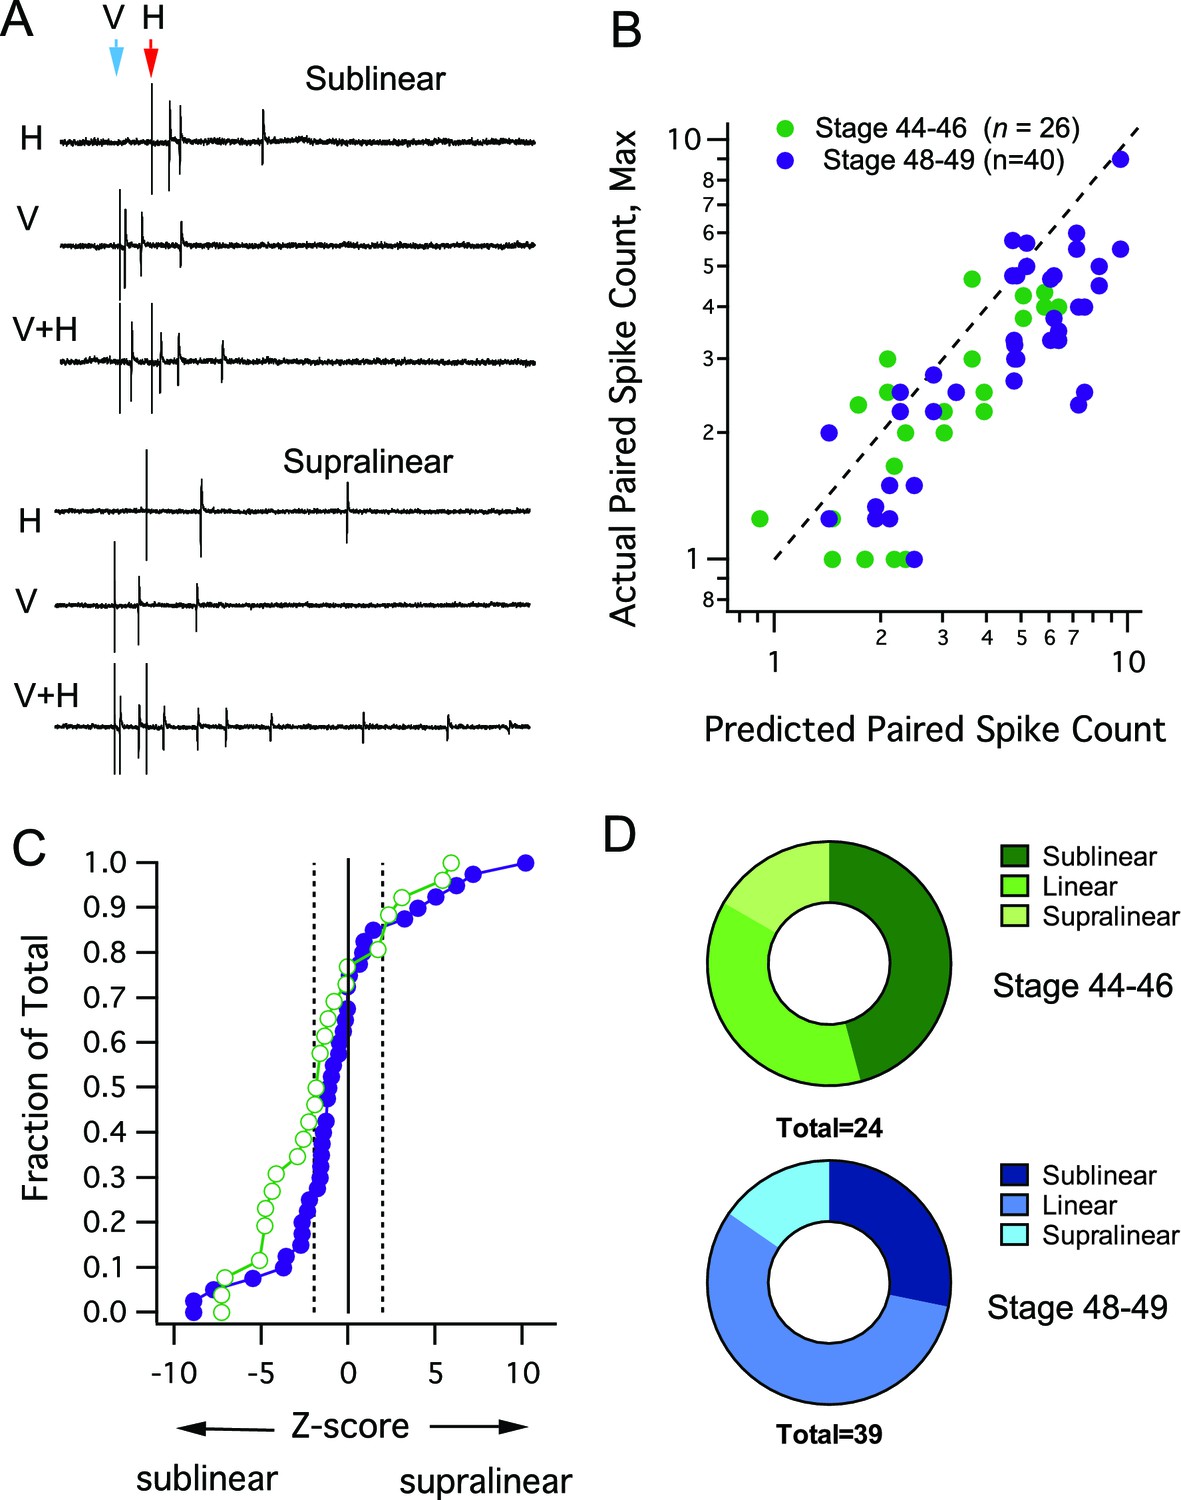
Interaction between different modalities is mostly linear or sublinear.
(A) Traces show examples of two possible outcomes of interactions between different modality responses. The upper traces show an example of sublinear summation, where the combined response evoked fewer spikes than the sum of the individual responses. The bottom example shows supralinear summation, where the combined response evokes more spikes than the sum of the individual responses. (B) For each cell, the maximum raw spike counts after paired stimulation (combined response) is plotted against the spike count predicted by the sum of adding individual modality responses. Dashed line represents the line of unity. Notice that most points cluster to the right of the dashed line, indicating a sublinear interaction. (C) Cumulative Frequency Distributions of Z-score values are plotted for the comparison between predicted and actual number of action potentials recorded after paired stimulation, in each cell. Vertical dashed lines indicate Z = +/–1.97, the point at which actual responses are +/–2 S.D.'s away from the respective predicted response. For greater detail on generation of the predicted responses and calculation of Z-scores, see Materials and methods. (D) Distribution of cells by interaction type shows few developmental differences.
Figure 4
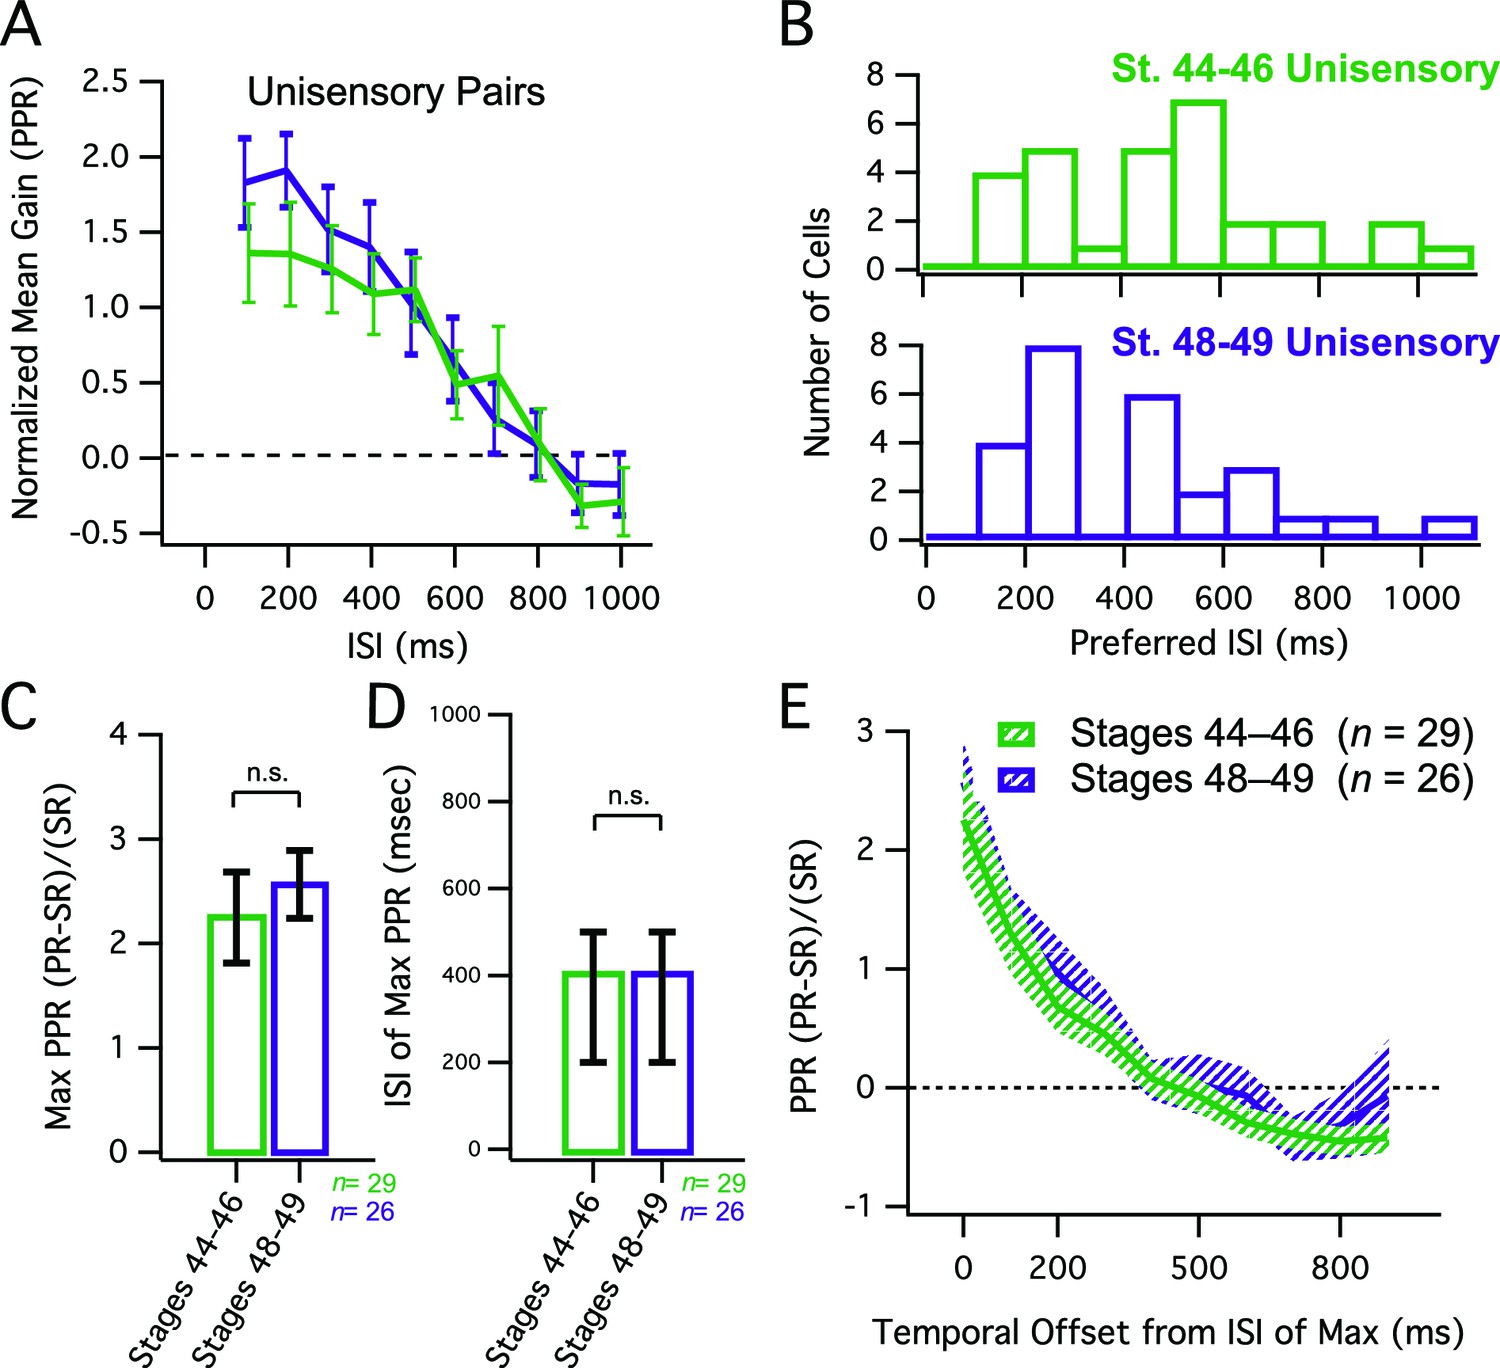
Developmental changes in MSI do not simply reflect changes in network dynamics.
(A) Grouped data showing enhancement of unisensory pairs at both developmental groups. In a given cell, data are averaged over multiple trials at each ISI, to determine the PPR. Plotted here is the population means of these trial-averaged PPR ratios, at the ISI's tested. Error bars show +/– S.E.M. (B) Histogram bars show the ISI that for each cell, exhibited maximal PPR values. Notice that values tend to cluster at shorter ISIs in both groups. (C) Maximum PPR ratios are compared across developmental stages, and show no change in PPR gain over development. Error bars indicate +/– S.E.M. (D) The identity of the ISI's at which maximal PPR occurred, separated by developmental group. Error bars show interquartile range. n. s. = not significant. (E) PPR-versus-ISI tuning curves from unimodal pairs were aligned at their peak values, and then averaged across cells. Since pairs were unisensory, only one direction is shown. Solid lines connect the population means. Shaded areas demarcate +/– S.E.M. Tuning for unisensory pairs does not change over development. PPR = (paired response – single response) / single response.
Figure 5
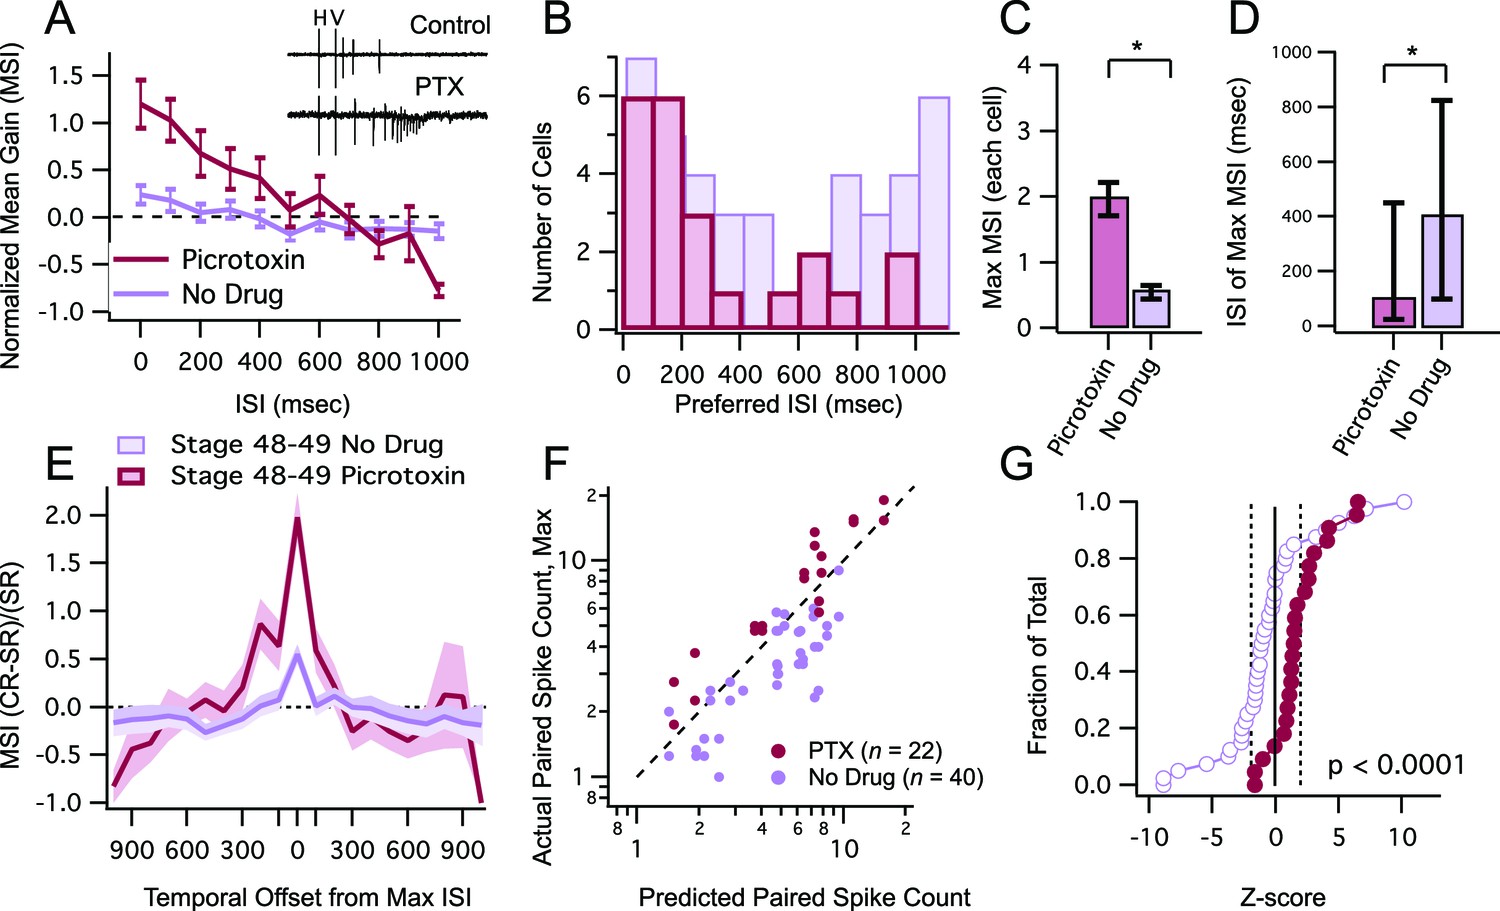
Inhibitory blockade broadens tuning window and enhances gain of MSI.
(A) Grouped data from stage 48–9 tadpoles in control condition and in the presence of GABAA receptor blocker PTX. In a given cell, data are averaged over trials at each ISI, to determine the MSI ratio. Plotted here are the population means of these trial-averaged MSIn ratios, at each ISI tested. Error bars show +/– S.E.M. (B) Histogram bars show the ISI at which each cell exhibited maximal MSIn values in control and PTX groups. Notice that PTX shifts the preferred ISI values to shorter intervals. (C) Maximum MSIn ratios are compared across control and PTX conditions, and show increase in MSI gain with inhibitory blockade. Error bars indicate +/– S.E.M. (D) The identity of the ISI's responsible for the maximal response (and thus the maximum MSI ratio) in control and PTX groups are compared. Error bars show interquartile range. *p<0.05. (E) MSI-versus-ISI tuning curves from crossmodal pairs were aligned at their peak values, and then averaged across cells. Solid lines connect the population means. Shaded areas demarcate +/– S.E.M. PTX treated cells are more broadly tuned around their preferred ISI. (F) For each cell, the maximum raw spike counts after paired stimulation (combined response) is plotted against the spike count predicted by the linear sum of individual modality responses. Dashed line represents the line of unity. Notice that in PTX treated group most points cluster to the left of the dashed line. (C) Cumulative Frequency Distributions of Z-score values are plotted for the comparison between predicted and actual number of action potentials recorded after paired stimulation, in each cell. Vertical dashed lines indicate Z = +/–1.97, the point at which actual responses are +/–2 S.D.'s away from the respective predicted response. For greater detail on generation of the predicted responses and calculation of Z-scores, see Materials and methods. Z-scores in the PTX treated group are significantly shifted toward the right (p<0.0001, Kolmogorov-Smirnov test).
Figure 6
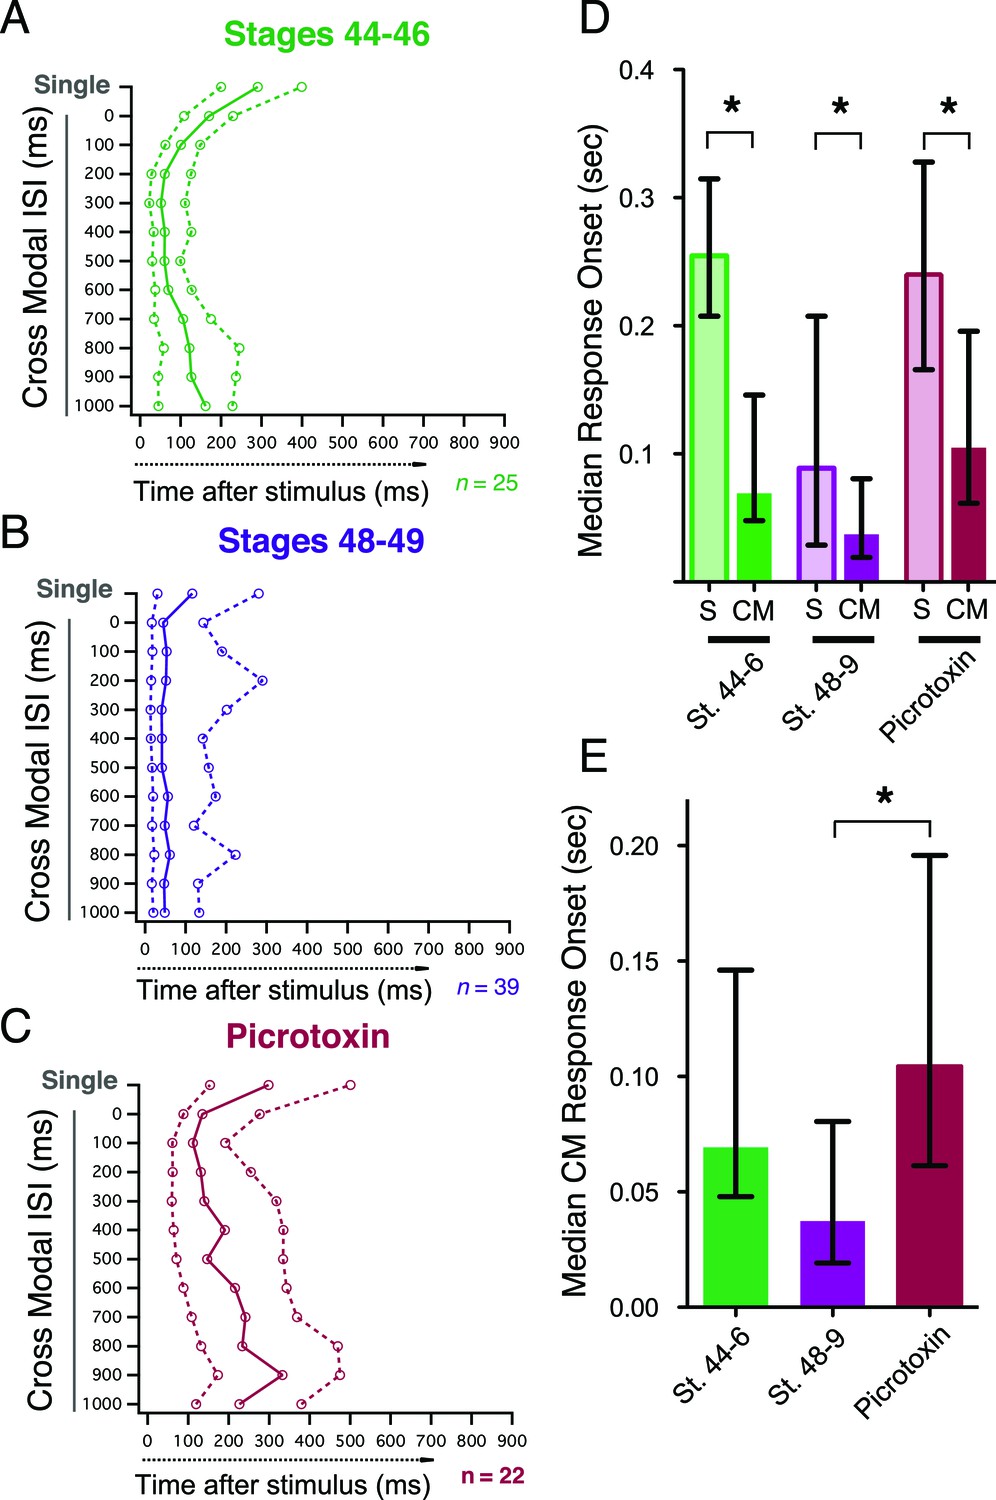
Crossmodal responses have faster onset latencies than single unimodal responses across groups, but inhibitory blockade slows response onset times.
(A, B, C) Plot of response onset times for single responses and crossmodal responses at multiple ISIs for all experimental groups. For each paired ISI, as well as the appropriate control stimulus (left axis), the. 25,. 50 (median), and. 75 quartiles of post-stimulus times for all first spikes are plotted on the bottom axis. Dashed lines connect 0.25 and 0.75 quartile values, and solid lines connect. 50 quartile (median) values. (D) Comparison of response onset times of paired vs. unpaired responses shows that across conditions, cross modal responses occur faster than single modality responses. (E) Comparison between paired response onset times across groups shows that while there is no significant speeding up of the response over development, picrotoxin delays onset times. Bars indicate median values, error bars show the IQR. *p< 0.05
Figure 7
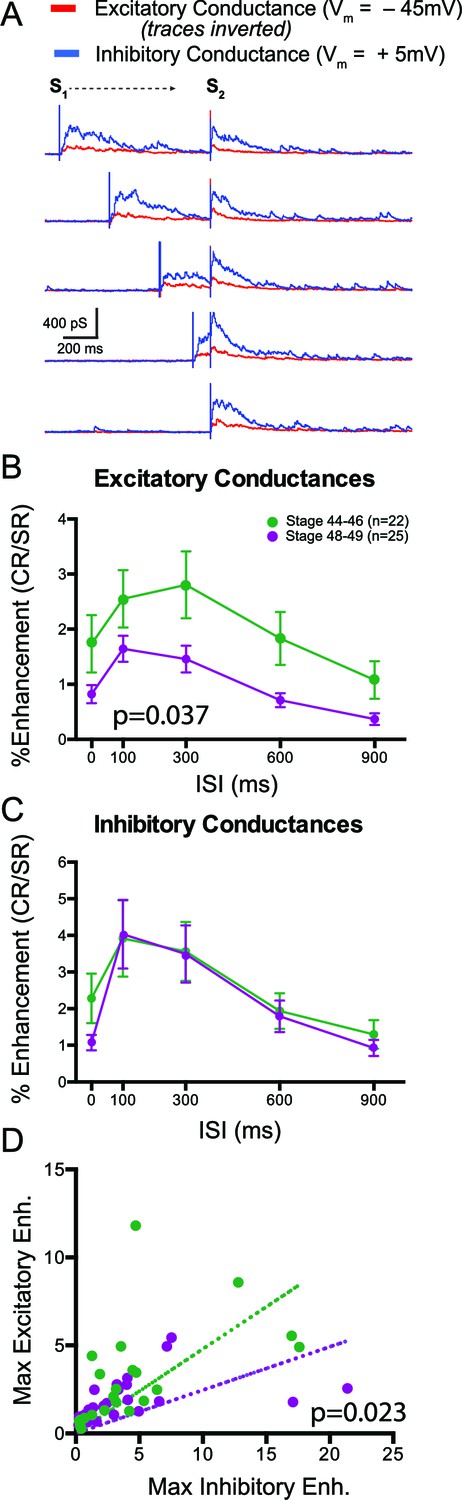
Multisensory responses have a greater inhibitory to excitatory ratio in older animals.
(A) Sample excitatory (red) and inhibitory (blue) synaptic conductances recorded at different ISIs. S1 and S2 show timing of the individual modality responses (V and HB, respectively in this example). (B) Plot of crossmodal enhancement of excitatory synaptic conductances as a function of ISI at both developmental stages. Notice that excitation becomes relatively less enhanced in the older tadpoles. (C) Plot of crossmodal enhancement of inhibitory synaptic conductances as a function of ISI at both developmental stages. Notice that there is no developmental change in the amount of inhibitory enhancement. P value determined from 2-way ANOVA. (D) Plot of maximum excitatory and inhibitory enhancement for each cell. Dotted line represents linear fit for each developmental group. p value determined by an F-Test and compares both fits. Notice that older cells exhibit relatively more inhibitory than excitatory enhancement.
Tables
Table 1
Comparisons between presentation order for cross-modal stimuli do not reveal consistent differences in MSI ratios, in either developmental group. Top: Within both developmental groups, maximum MSIn ratios are compared between the two cross-modal sequences. n.s.: not significant (unpaired t-test). Bottom: The identity of the ISI's responsible for the maximal response is compared between the two cross-modal, within each developmental group. *p<0.05 (Mann-Whitney rank-sum test); n.s.: not significant (Mann-Whitney rank-sum test). V = visual, H = hindbrain
| Stage 44–46 (n=13) | Stage 48–49 (n=20) | |||||
|---|---|---|---|---|---|---|
| Crossmodal Order | Mean MSIn ± SEM | p | Summary | Mean MSIn ± SEM | p | Summary |
| VH | 0.98 ± 0.57 | 0.605 | n.s | 0.50 ± 0.17 (n=20) | 0.628 | n.s. |
| HV | 1.31 ± 0.26 | 0.60 ± 0.12 | ||||
| Median ISI (ms) ± IQR | Median ISI (ms) ± IQR | |||||
| VH | 200 ± 250 | 0.964 | n.s. | 350 ± 675 | 0.731 | n.s |
| HV | 100 ± 350 | 500 ± 875 |
Download links
A two-part list of links to download the article, or parts of the article, in various formats.
Downloads (link to download the article as PDF)
Open citations (links to open the citations from this article in various online reference manager services)
Cite this article (links to download the citations from this article in formats compatible with various reference manager tools)
Multisensory integration in the developing tectum is constrained by the balance of excitation and inhibition
eLife 5:e15600.
https://doi.org/10.7554/eLife.15600


