A large fraction of neocortical myelin ensheathes axons of local inhibitory neurons
- Stanford University, United States
- Janelia Research Campus, Howard Hughes Medical Institute, United States
Figures
Figure 1 with 2 supplements

A large fraction of myelinated axons in upper layers of cortex contain GABA.
(A) An ultrathin section (70 nm) through the mouse somatosensory cortex immunolabeled for MBP (cyan) and GABA (red). Nuclei are stained with DAPI (blue). Smaller regions from each layer are shown at higher magnification to the right. (B) Scanning electron micrograph from layer 5 of the mouse somatosensory cortex overlaid with the corresponding immunofluorescence for MBP (cyan) and GABA (red), and the DAPI signal (blue). (C) Proportion of myelinated axonal profiles containing GABA in the cortical layers of mouse somatosensory cortex. (D) Density of GABA and non-GABA myelinated axons in mouse somatosensory cortex (y-axis is in logarithmic scale to accommodate the large range of myelinated axon densities along the cortical depth). Mean from 3 animals and standard errors are shown in C and D (number of axonal profiles analyzed per animal was 11103, 12,657 and 7540, respectively).
-
Figure 1—source data 1
Data values underlying Figure 1.
- https://doi.org/10.7554/eLife.15784.004
Figure 1—figure supplement 1
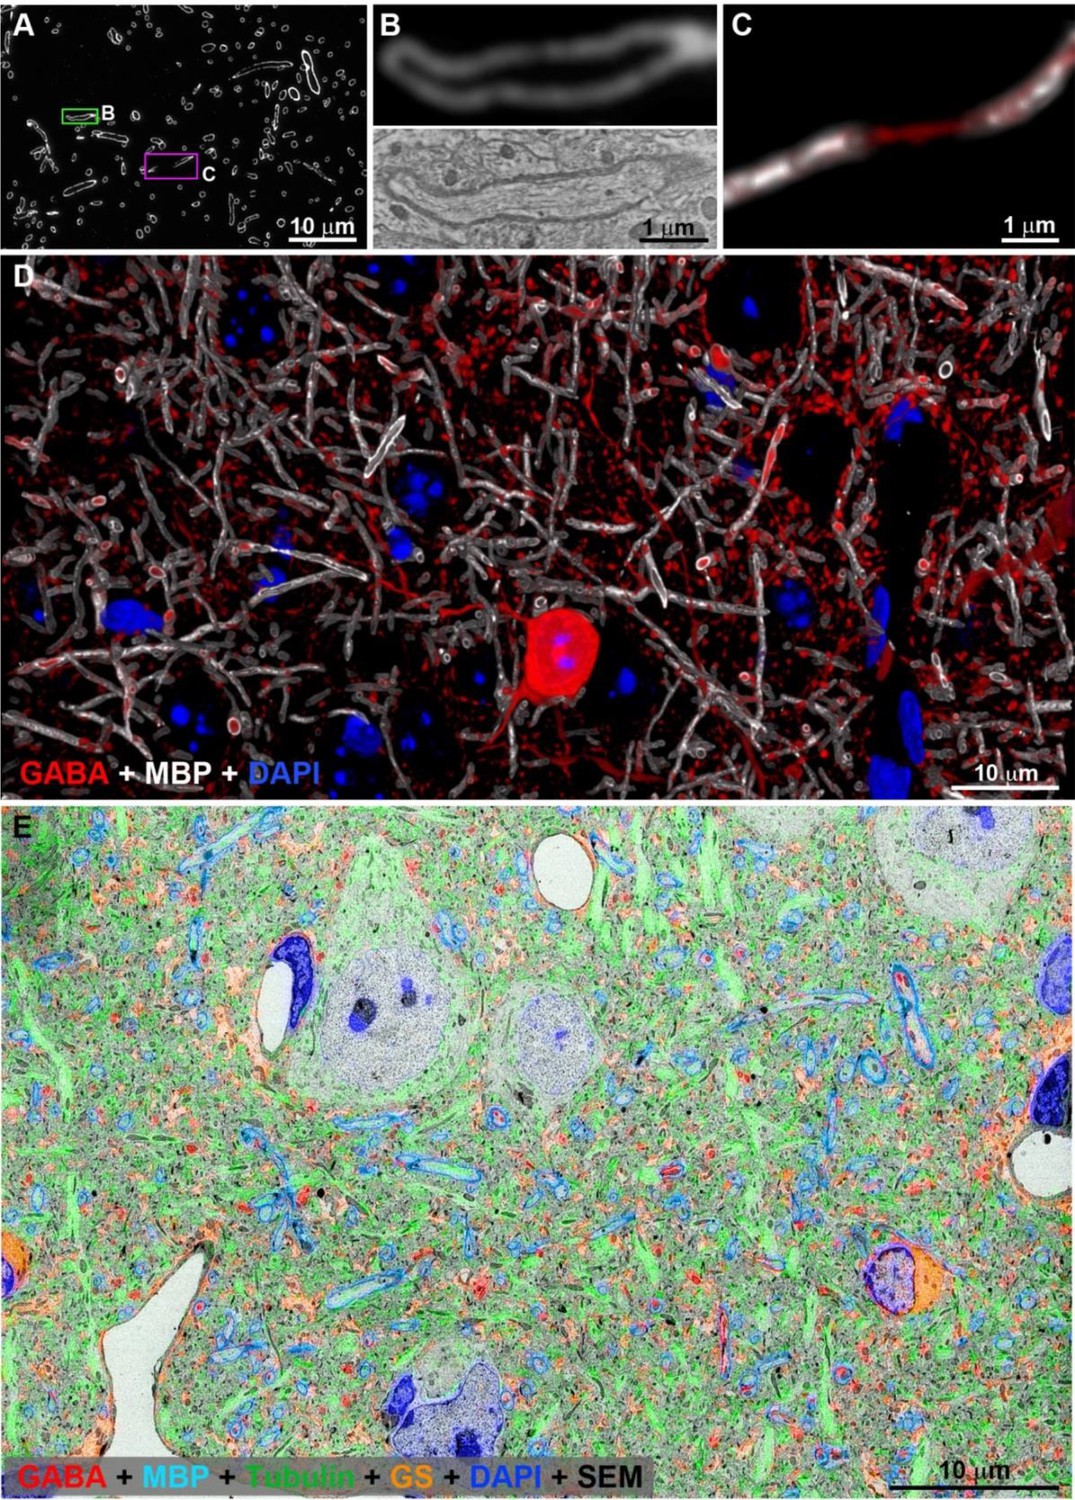
Antibodies used in this study labeled the expected structures as assessed by IF volume reconstruction and SEM imaging.
(A) MBP immunofluorescence on a single ultrathin section (70 nm) from layer 5 of the adult mouse cortex. Interruption in the MBP staining indicates a node of Ranvier (magenta box) (B) MBP staining corresponds exactly to the myelin sheath as seen in the SEM of the axon boxed in green in A. (C) Nodes of Ranvier (magenta box in A) do not stain for MBP, but the axonal path can be traced using cytoskeletal markers which persist through the nodes (alpha tubulin in red). (D) Volume reconstruction of myelinated axons immunolabeled with MBP (white) and GABA (red) in cortical layer 5 (43 sections, 70 nm each). Nuclei are stained with DAPI (blue). SEM of layer 5 of mouse cortex overlaid with immunofluorescence for GABA (red), MBP (cyan), α tubulin (green), glutamine synthetase (orange).
Figure 1—figure supplement 2
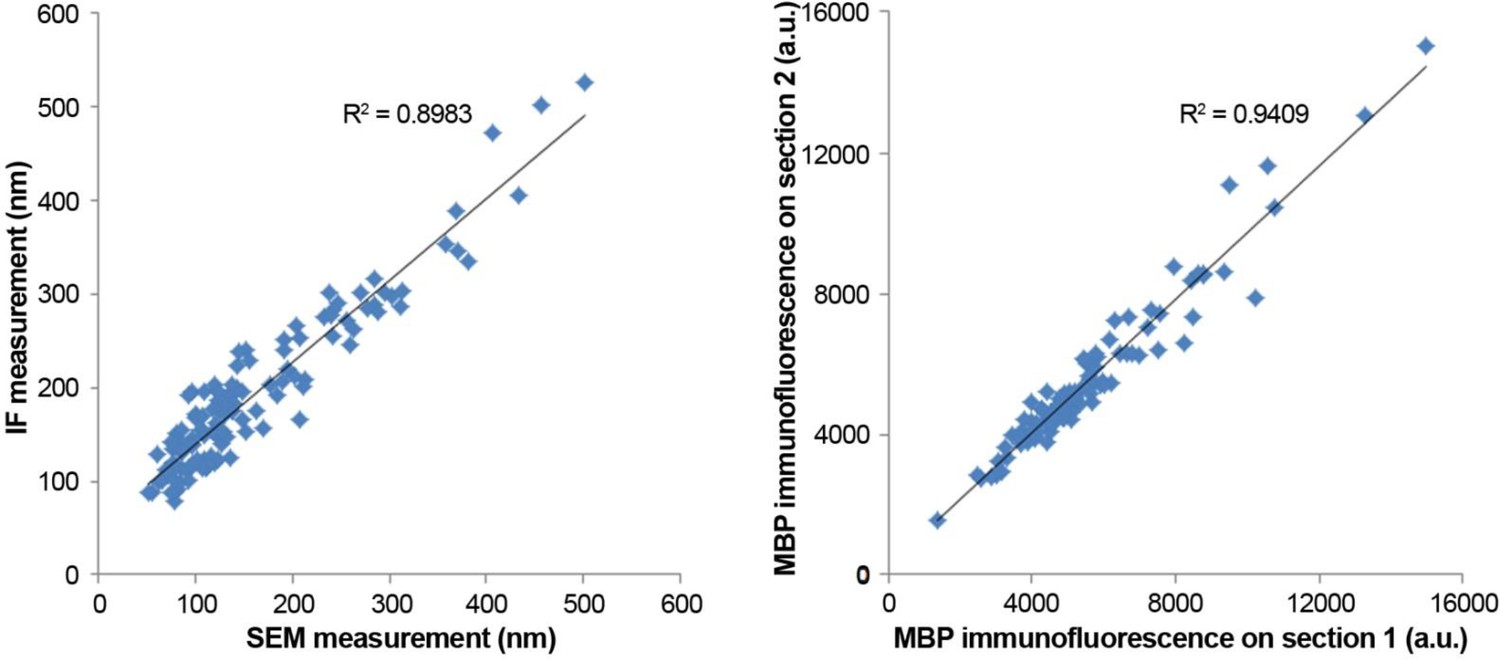
MBP antibody performance.
(A) Myelin thickness as measured from IF data and SEM data. Myelin thickness was measured on the same sections using either immunofluorescence for MBP or ultrastructurally defined myelin on SEM images using a dataset from a previous study (McGee et al., 2005) (N=125 axonal profiles). There is a strong correlation between the two measurements (R2=0.9), which allows the use of MBP immunofluorescence for more efficient sampling. (B) Consistency of MBP immunolabel. Correlation of MBP immunofluorescence of the same myelin sheath measured on two adjacent ultrathin sections (N=100 axonal profiles).
Figure 2 with 3 supplements
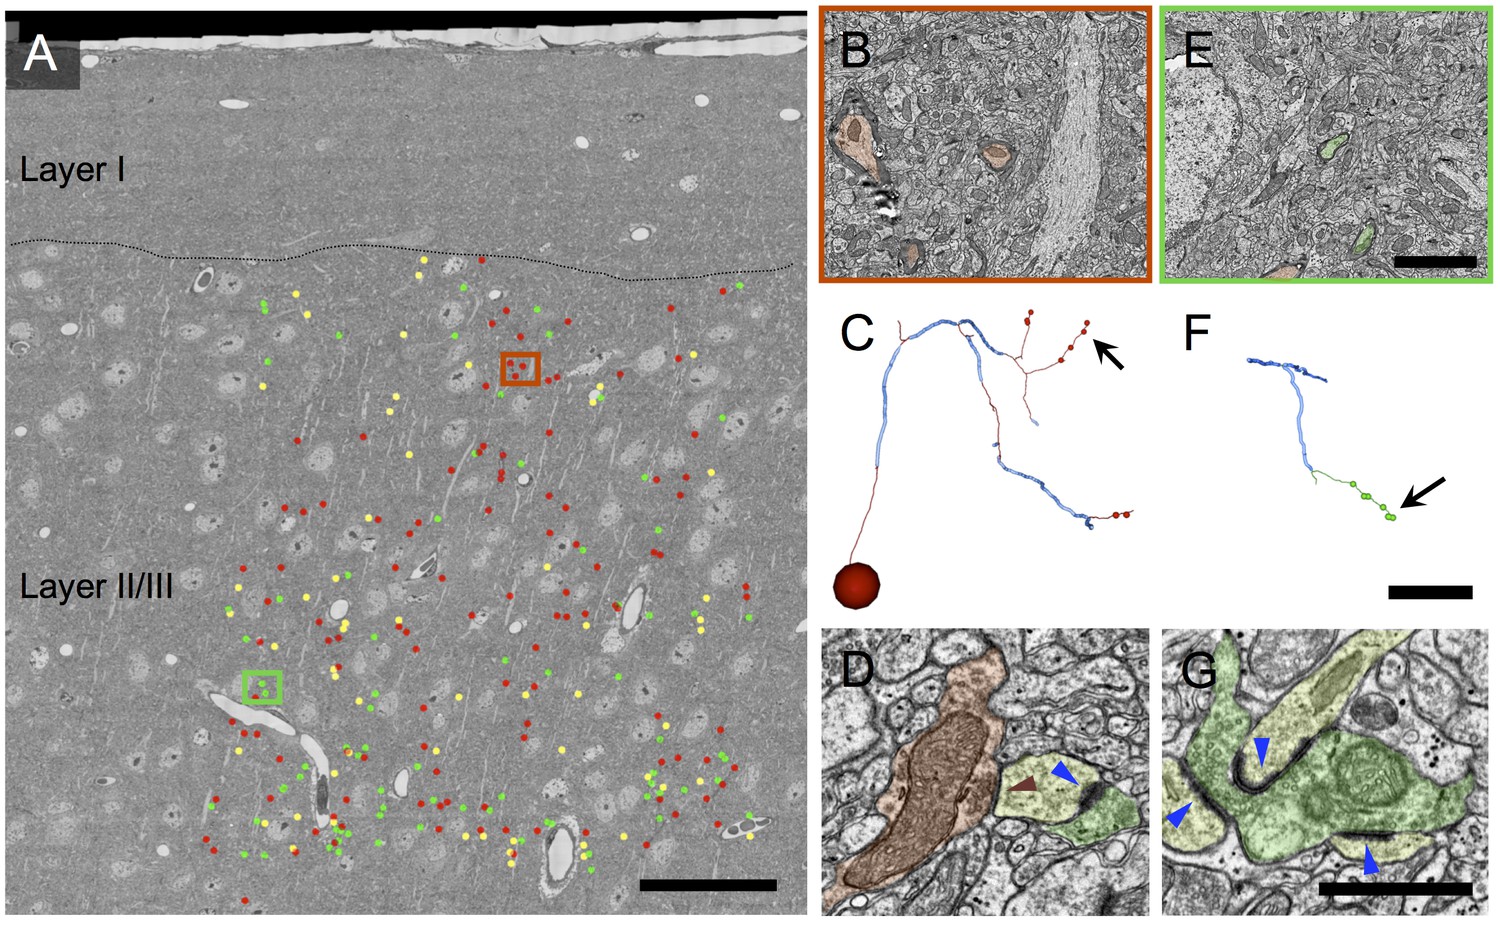
Volume electron microscopy shows a large fraction of myelinated axons in layer 2/3 of cortex are inhibitory.
(A) EM mosaic from pia through lower layer 2/3, overlaid with the locations of myelinated axon profiles used as tracing seeds. Each seed is color-coded by the type of synapses the axon was determined to make after exiting its myelin sheath elsewhere in the volume (red: symmetric; green: asymmetric; yellow, no synapses in the EM volume). Red and green rectangles indicate areas of detail in B and E, respectively. (B) Detail view of area in red rectangle in A. Three inhibitory myelinated axon profiles (false colored red) are shown. (C) A reconstructed axon arbor arising from the myelinated tracing seed at the center of B. Thick blue segments indicate myelinated internodal regions; thin red segments represent unmyelinated axon. Segment diameters are schematic. This axon was traced to its originating soma (sphere in lower left) and to 8 synapses (small red dots). The arrow indicates the location on this axon’s arbor of the symmetric synapse shown in D. Note that axon arbors were traced only until their synapses could be reliably categorized as symmetric or asymmetric; therefore the arbor shown here is a small subset of the full axonal arbor arising from this inhibitory neuron. (D) An unmyelinated axon profile (red) makes a symmetric synapse (red triangle) onto a postsynaptic spine (yellow). This spine also receives an asymmetric synapse (blue triangle) from an excitatory axon (green). (E) Detail view of area in green rectangle in A, showing two excitatory myelinated axon profiles (false colored green). (F) A reconstructed axon arbor arising from the myelinated tracing seed at the center of E. Conventions as in C, except unmyelinated axon segments are rendered in green. (G) An unmyelinated axon profile (green) makes three asymmetric synapses (blue triangles) onto three different spines. Scale bar in A, 50 μm; E, 3 μm (also applies to B); F, 20 μm (also applies to C); G, 1 μm (also applies to D).
Figure 2—figure supplement 1
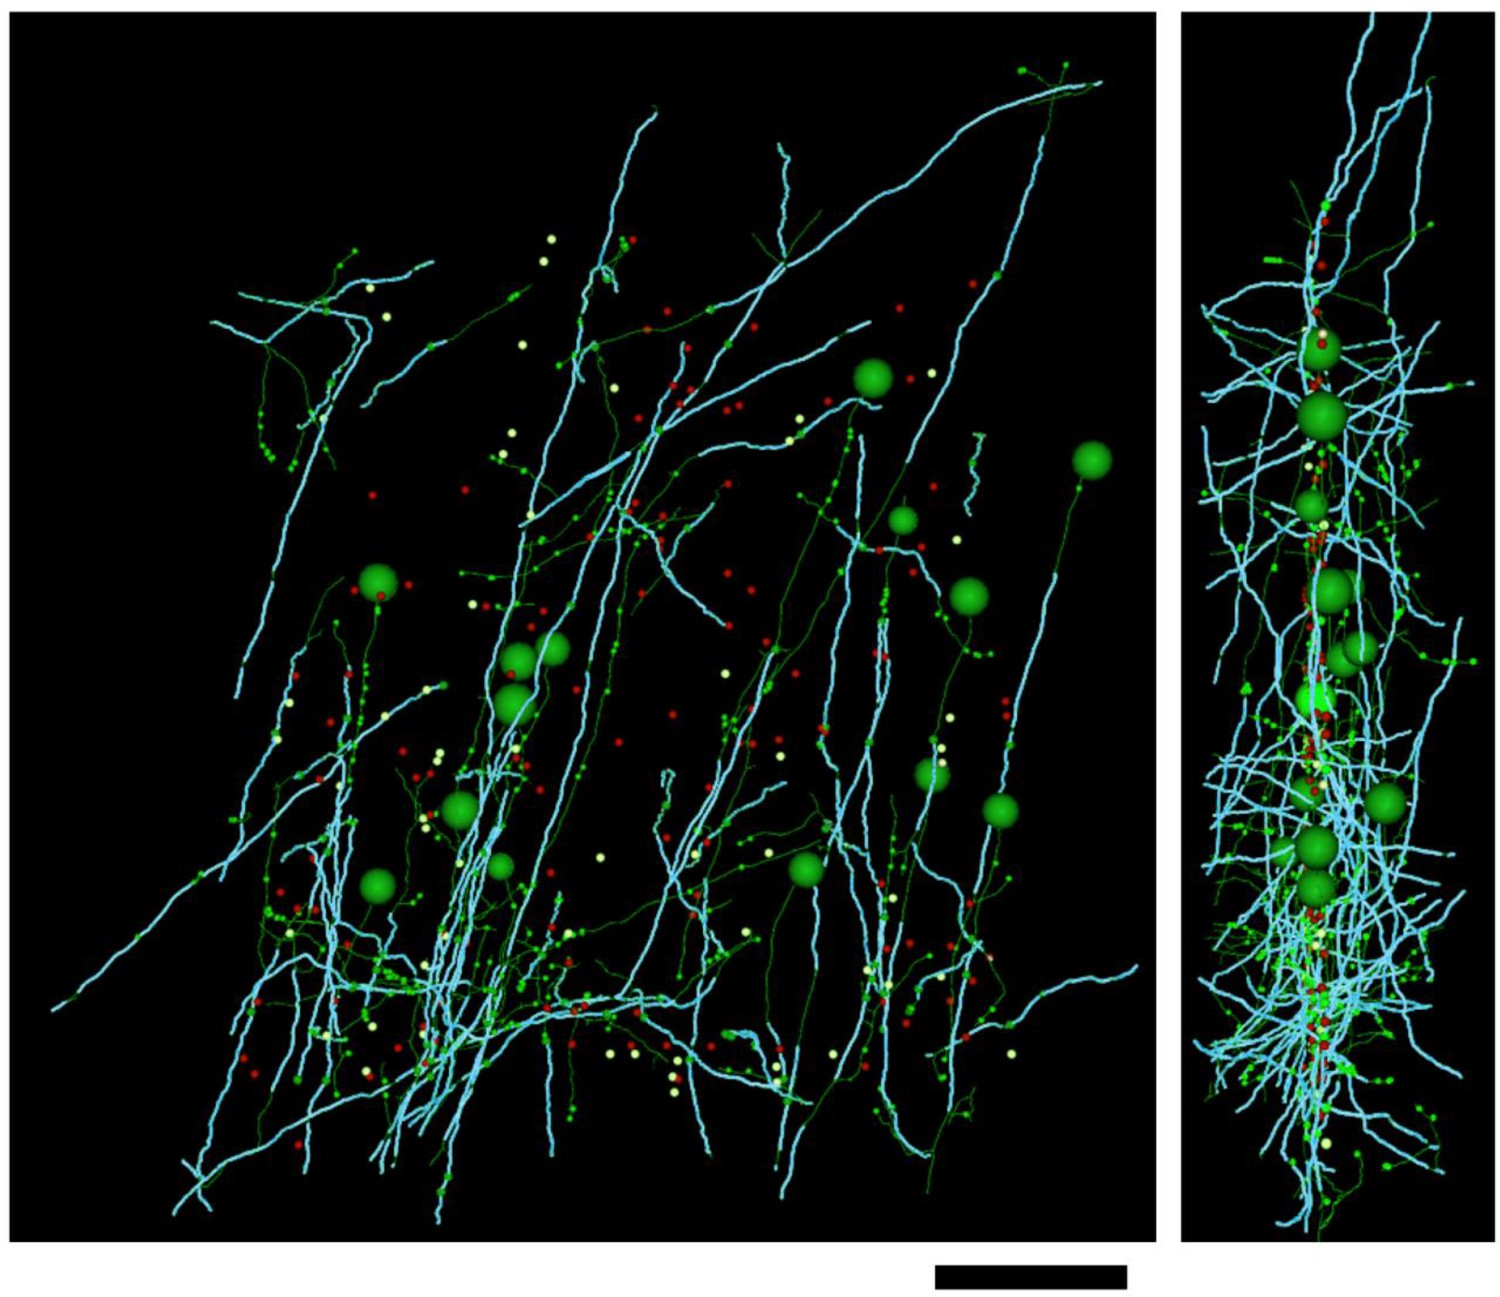
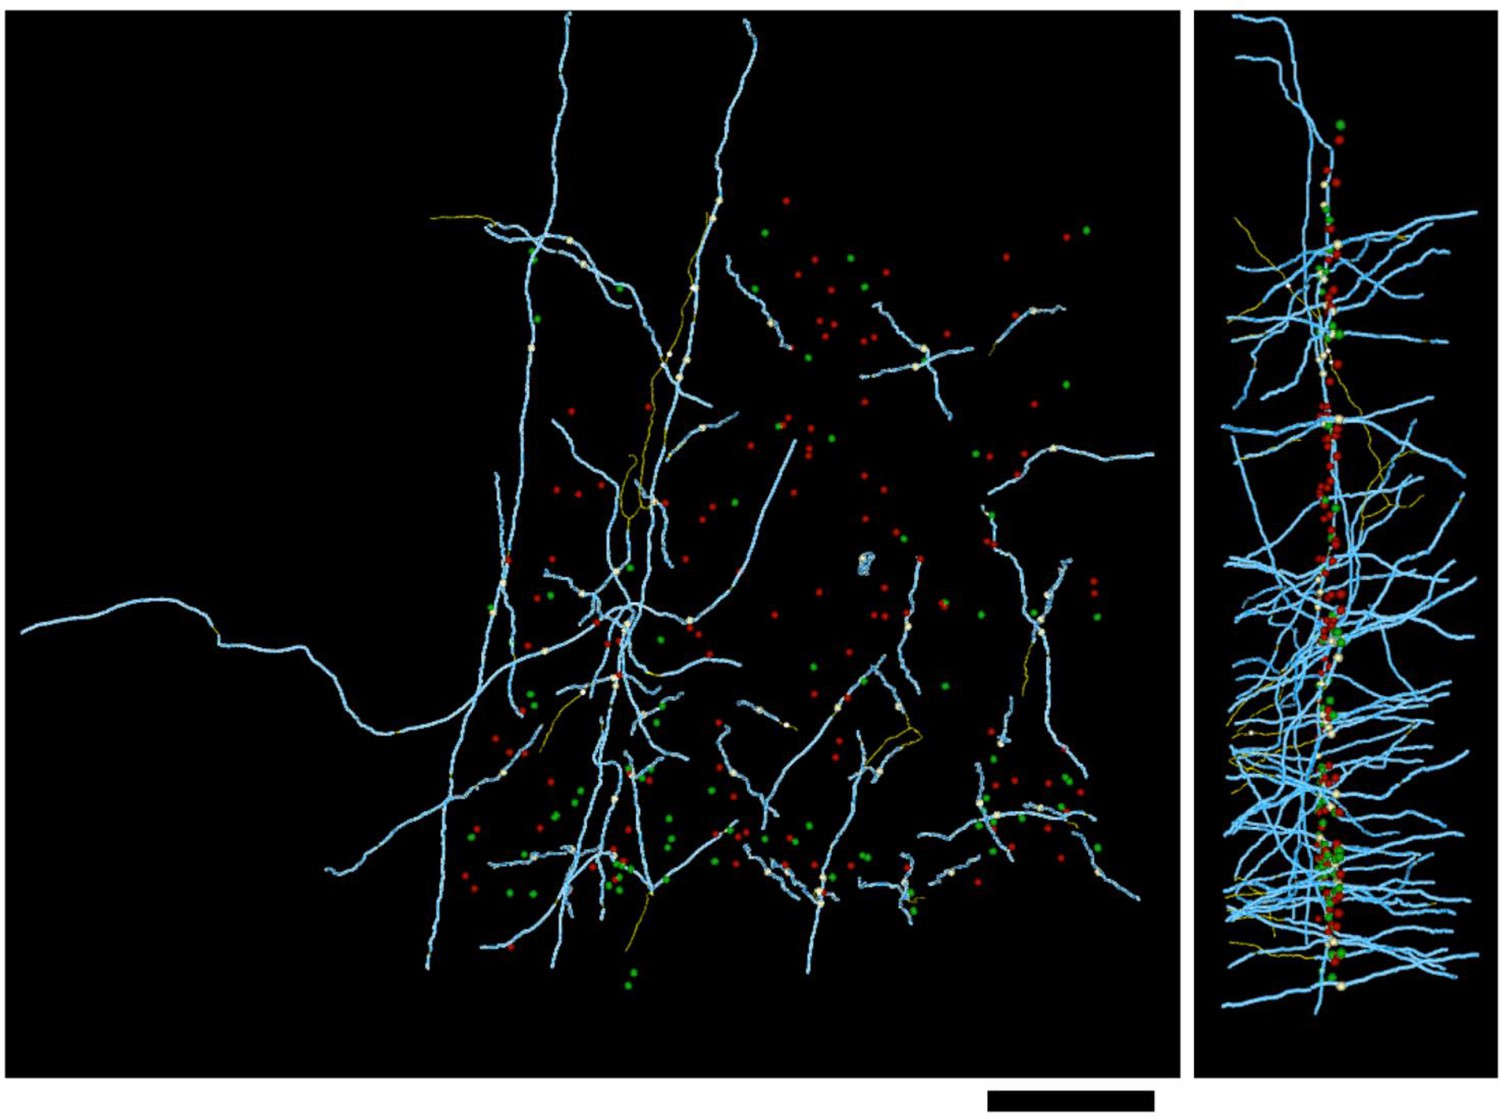
Distribution of myelin (cyan) on axon fragments (green) categorized as excitatory.
Left, frontal view. Right, side view. Large green spheres: excitatory somata reached during categorization of axon fragments; medium-sized spheres indicate the position of tracing seeds of categorized axon fragments (green: excitatory; red: inhibitory; yellow: unclassifiable). Smallest green spheres indicate the position of synapses made by the excitatory axon fragments. Scale bar ~50 μm.
Figure 2—figure supplement 2
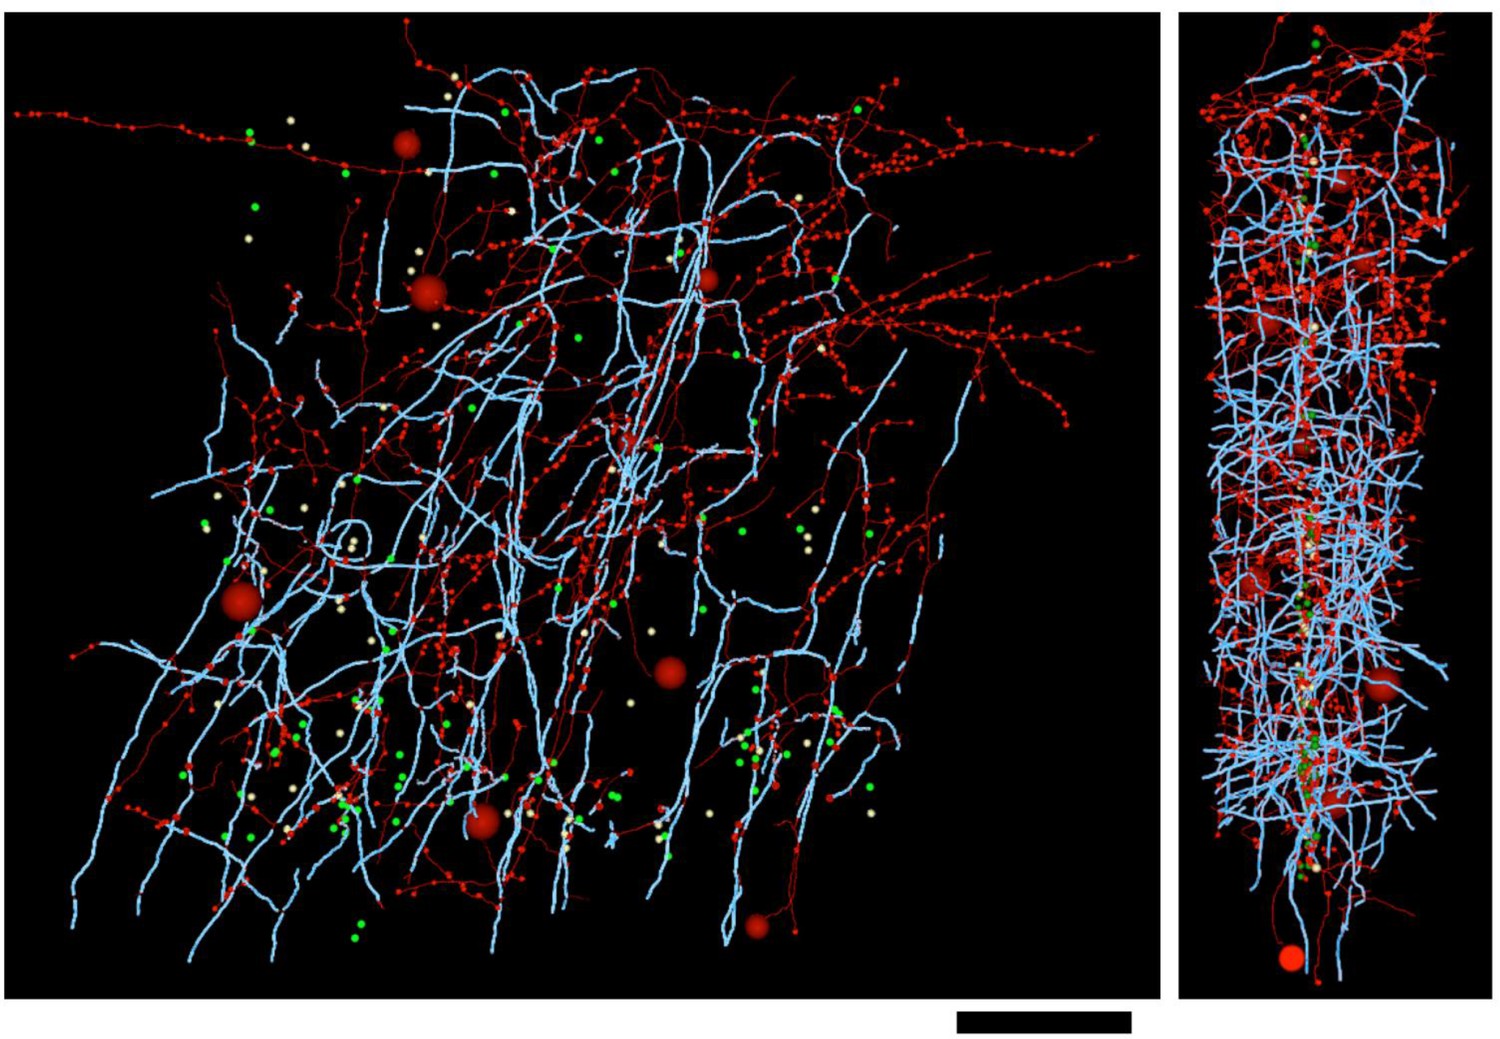
Distribution of myelin (cyan) on axon fragments (red) categorized as inhibitory.
Left, frontal view. Right, side view. Large red spheres: inhibitory somata reached during categorization of axon fragments; medium-sized spheres indicate the position of tracing seeds of categorized axon fragments (green: excitatory; red: inhibitory; yellow: unclassifiable). Smallest red spheres indicate the position of synapses made by the inhibitory axon fragments. Scale bar ~50 μm.
Figure 2—figure supplement 3
Distribution of myelin (cyan) on axon fragments (yellow) that could not be categorized, due to an absence of synapses in the EM-imaged volume.
Left, frontal view. Right, side view. Large green spheres: excitatory somata; medium-sized spheres indicate the position of tracing seeds of categorized axon fragments (green: excitatory; red: inhibitory; yellow: unclassifiable). Scale bar ~50 μm.
Figure 3 with 1 supplement
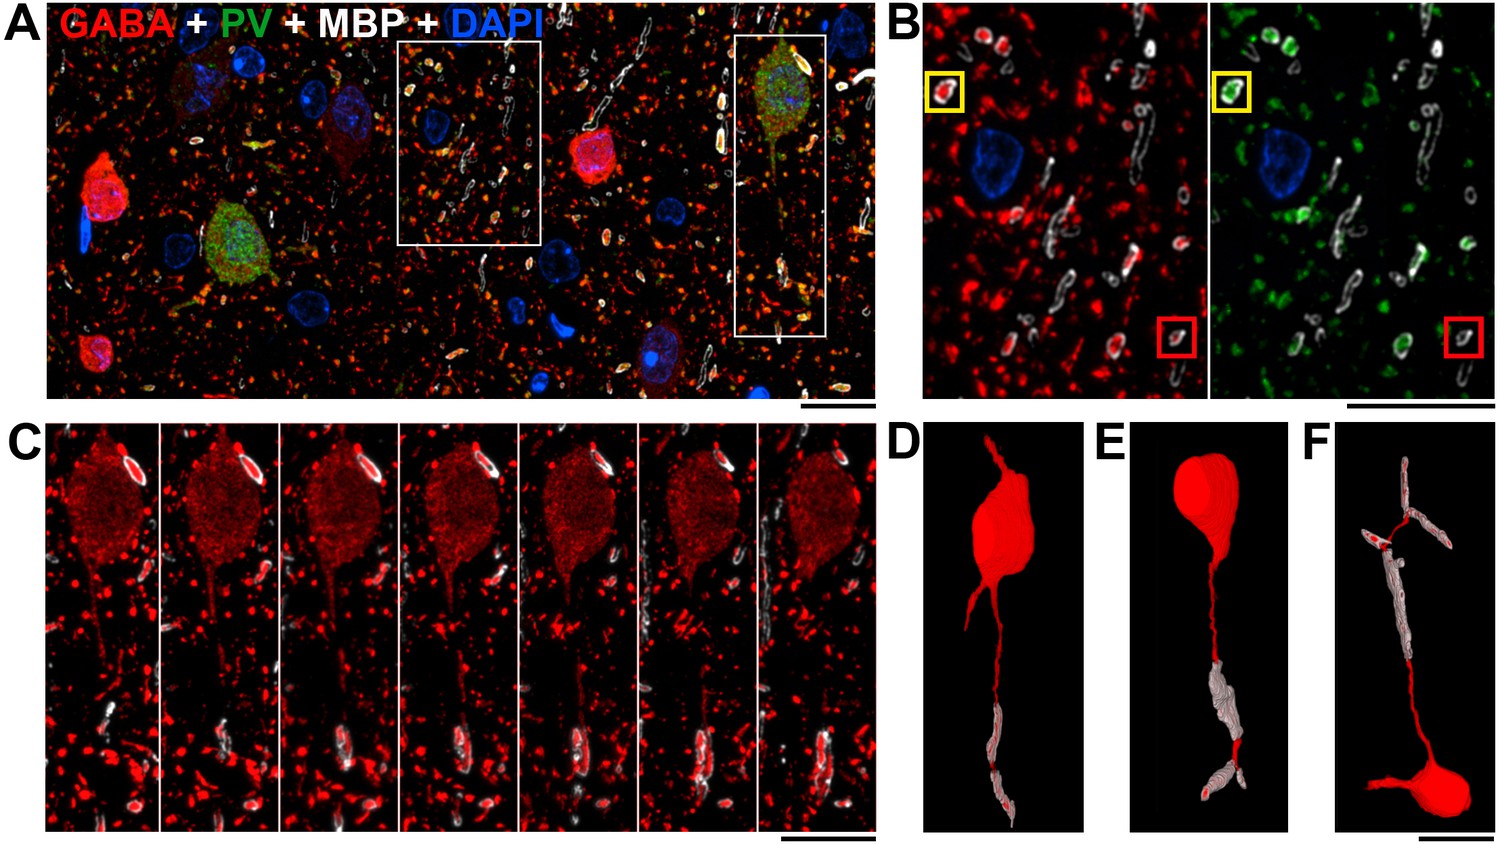
Nearly all myelinated GABA axons are parvalbumin-positive.
(A) A single section (70 nm) from layer 2/3 of mouse cortex, immunolabeled for MBP (white), GABA (red) and PV (green); nuclei are stained with DAPI (blue). Note that the PV-containing neurons have weaker GABA immunoreactivity. (B) The central box from A shown at a higher magnification. The great majority (97.9 ± 0.8%) of GABA immunopositive myelinated axons (red, left panel) also contain PV (green, right panel); the yellow box marks an example of such an axon (see main text for quantification). Occasionally, a GABA myelinated axon does not show detectable PV immunofluorescence as shown in the red box. (C) Serial sections through the parvalbumin containing neuron boxed in A, C showing its myelinated axon. (D) Volume reconstruction of the neuron in C. (E, F) Volume reconstructions of PV interneurons with myelinated axons from layers 4 and 5. A–F, Scale bar, 10 μm.
Figure 3—figure supplement 1
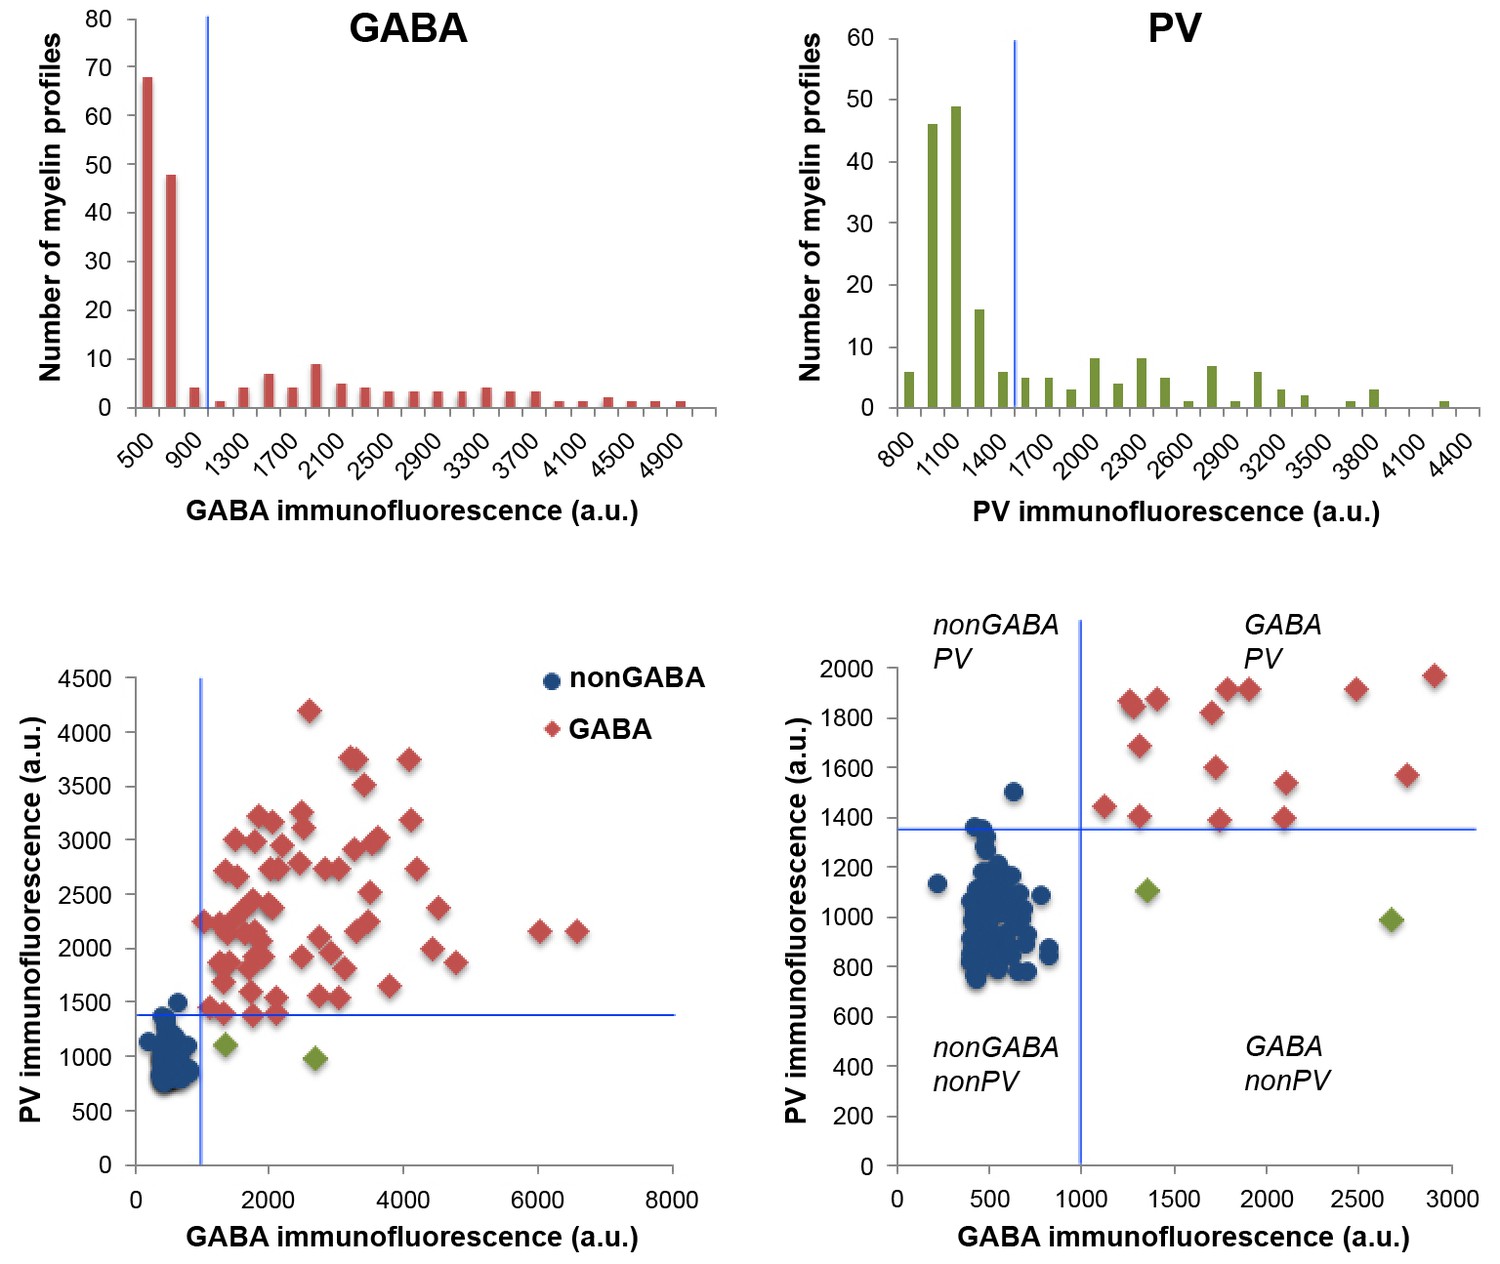
GABA and PV immunoreactivity of myelinated axons.
Top, Distribution of GABA and PV immunofluorescence within cortical myelinated axons. Because of the inherent variability of immunolabeling intensity and image acquisition parameters, comparisons were always done on sections from the same coverslip, which were stained and imaged at the same time. Measurements from layers 4 and 5 of mouse cortex from one coverslip are presented in the figure. The threshold for GABA and PV immunofluorescence is indicated by the blue lines. Bottom, Scatterplot of GABA and PV immunofluorescence from the same experiment, showing three classified populations of myelinated axons: GABA negative in blue, GABA and PV positive in red, and GABA positive but PV negative axonal profiles in green.
Figure 4

Immunofluorescent labeling of MBP shows half of myelin profiles ensheath PV-positive axons but no VIP- and very few SOM-expressing axons.
(A) Maximum intensity projection of a stack of confocal image mosaics, spanning pia (top) to white matter (bottom) of somatosensory cortex, revealing the laminar distribution of PV-expressing neurons (red) and immunolabeled myelin (green). Yellow square in layer 2/3 indicates the location of the field of view portrayed in panels B–D. (B–D) Detail view of a representative subarea from a single section in layer 2/3. About half of the myelinated axons are PV-positive (yellow triangles). B shows the red channel (PV) only; C shows the green channel (myelin) only, and myelinated profiles containing PV-positive axons are false-colored cyan; and D overlays panels B and C. (E–G) Representative confocal images from layer 2/3 of somatosensory cortex, showing VIP-expressing neurites (red), immunolabeled myelin (green), and DAPI-stained nuclei (blue). E shows only the red (VIP) and blue (DAPI) channels; F shows only the green (myelin) and blue (DAPI) channels; and G overlays panels E and F. (H–J) Representative confocal images from layer 2/3 of somatosensory cortex, showing SOM-expressing neurites (red), immunolabeled myelin (green), and DAPI-stained nuclei (blue). H shows only the red (SOM) and blue (DAPI) channels; I shows only the green (myelin) and blue (DAPI) channels, and myelinated profiles containing SOM-positive axons are false-colored cyan; and J overlays panels H and I. No myelinated axon profiles are positive for VIP; 4.4% are positive for SOM. Scale bar in A, 100 μm; B, 10 μm (also applies to C–D); E, 10 μm (also applies to H–J).
Figure 5
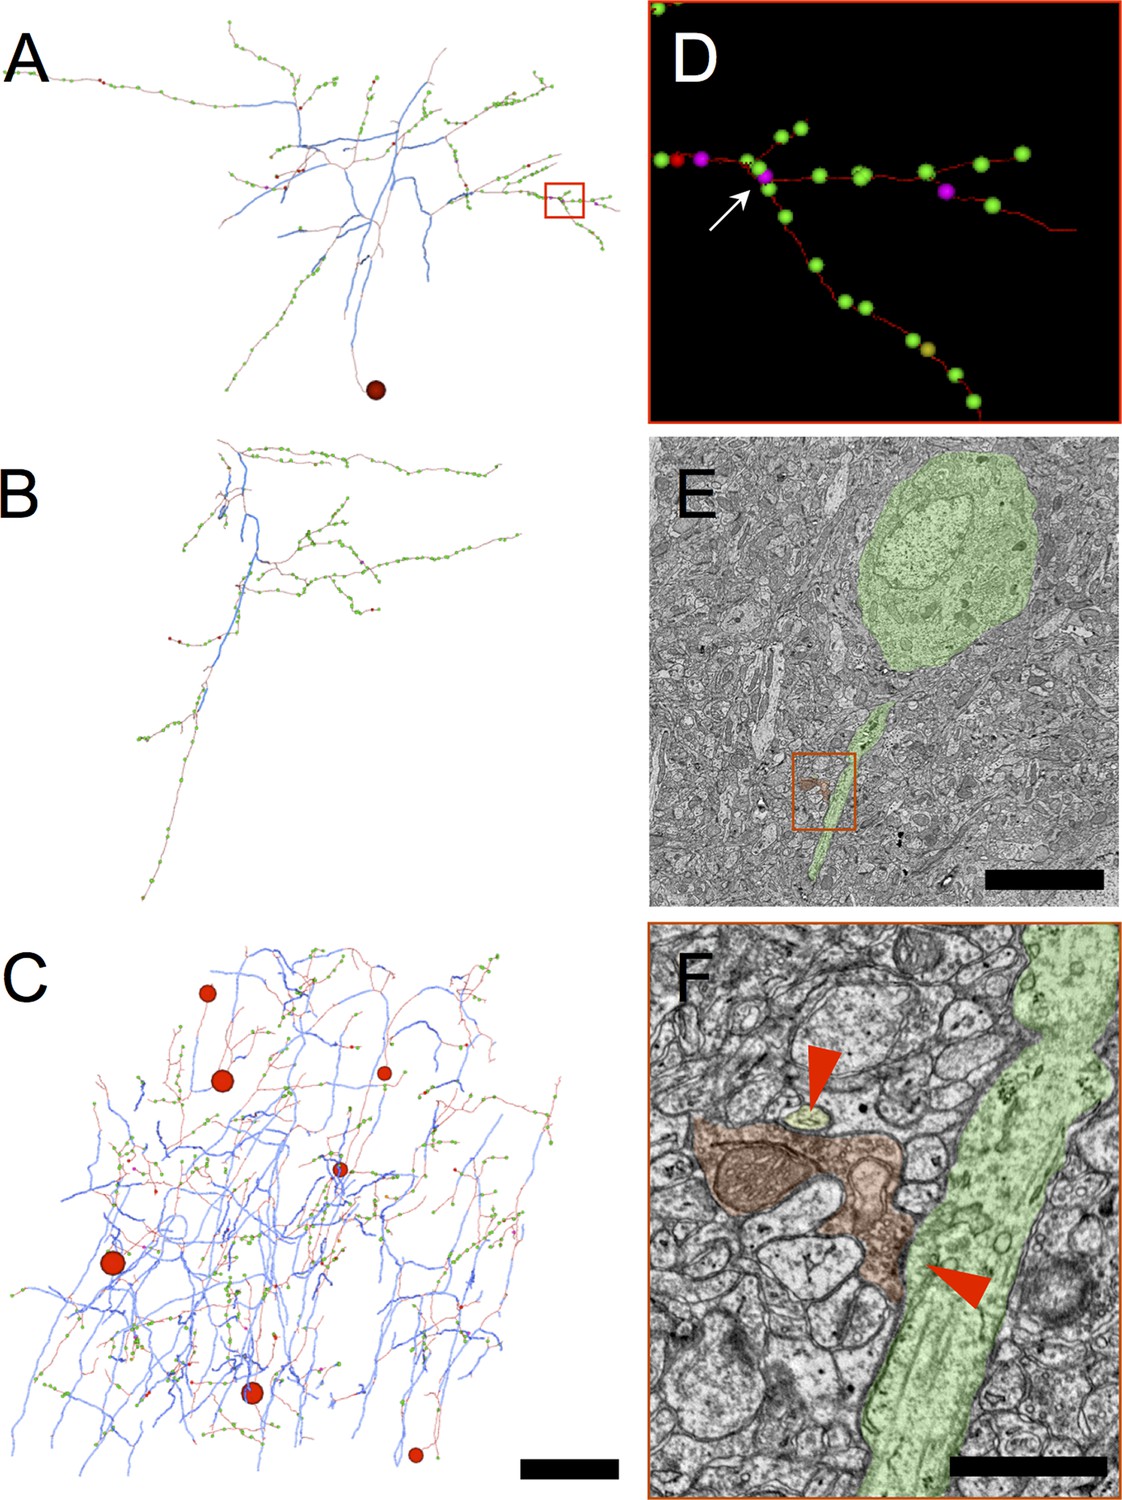
Myelinated inhibitory axons rarely make synapses upon other axons and are therefore unlikely to belong to chandelier cells.
(A) An inhibitory axon traced from a myelinated seed to completion within the EM volume. The proximal axonal arbor receives the preponderance of myelin (thick blue arbor segments), whereas the distal arbor makes most of the synapses. The red rectangle outlines the sub-arbor shown in D. In (A–C), the large red spheres indicate the position of the soma. Synapses are represented by dots, color-coded according to postsynaptic target class: green (excitatory), magenta (excitatory axon), yellow (unclassifiable), and red (inhibitory). (B) A second inhibitory axon traced to completion. In this case the EM volume boundaries were reached before reaching the soma. A myelinated core portion of the arbor can be discerned, with most synapses at the periphery. (C) All the inhibitory axon fragments traced from myelinated seeds. Overall, only 2% of synapses made by myelinated inhibitory axons are onto excitatory axons (magenta spheres); no synapses onto inhibitory axons were observed. (D) Detail view of area shown in red rectangle in A showing one of the rare synapses made by myelinated inhibitory neurons onto the proximal axon of a pyramidal cell (arrow). (E) EM image of a section intersecting the pyramidal cell body and its proximal axon (false-colored green), postsynaptic to the synapse indicated by the arrow in D (false-colored red). The red rectangle indicates the area of detail shown in F. (F) A magnified view of the synapse shown in E. A second postsynaptic target, the spine neck of a dendrite arising from a different pyramidal cell is false-colored in yellow. Symmetrical synapse locations indicated by red triangles. Scale bar in A–C, 50 μm; E, 4 μm; F, 1 μm.
Figure 6

Myelinated inhibitory axons target dendritic shafts, spines and neuronal cell bodies.
(A) A representative inhibitory axon fragment traced from a myelinated seed profile (arrow). Blue indicates the extent of myelin along the fragment; thin red axon segments are unmyelinated. The spheres indicate the location of symmetric synapses, and are color-coded red for inhibitory postsynaptic targets (synapse 1) and green for excitatory postsynaptic targets (synapses 2–5). These five symmetric synapses were sufficient to categorize the axon as inhibitory. The letters above the fragment correspond to the approximate locations of later panels. (B) The myelinated profile used as a tracing seed for the axon fragment in A. Myelin is false-colored blue; the axon is false colored in red. (C–N) EM micrographs through synapses 1–5. The presynaptic axon is false-colored in dark red; the postsynaptic inhibitory dendrite in light red; the postsynaptic excitatory targets in green; and other excitatory boutons converging onto the same targets as the myelinated inhibitory axon, in yellow. (C) Synapse 1 contacts an inhibitory dendrite, which is also shown in (D–E). In E, the dendrite is densely coated with excitatory axonal boutons making asymmetric synapses (blue triangles), a hallmark of inhibitory dendrites. (F) Cross-section through synapse 2. (G) Larger field of view of the section in F, showing that the postsynaptic target is a neuronal cell body. (H) A nearby section through the same neuron as in G, reveals it to be a pyramidal cell with a prominent apical dendrite. (I) The myelinated axon approaching an apical dendrite. (J) Synapse 3 is formed immediately after the axon unmyelinates and contacts the same apical dendrite shown in I. (K) The same bouton participating in synapse 3 forms synapse 4 with a spine arising from the same apical dendrite shown in I and J. (L) Synapse 5 targets the shaft of a dendrite, identified as excitatory by the presence of spines on near-by sections (e.g. M–N). (M) Synapse 5 can still be seen, and a spine neck arises from the postsynaptic dendrite. (N) The spine neck in M forms a small spine head, receiving an asymmetric synapse (blue triangle) from an excitatory bouton from a different axon. Scale bar in A, ~1 μm; B, 1 μm (also applies to C–F); G, 4 μm; H, 9 μm; I, 1 μm (also applies to J–L); M, 1 μm (also applies to N).
Figure 7
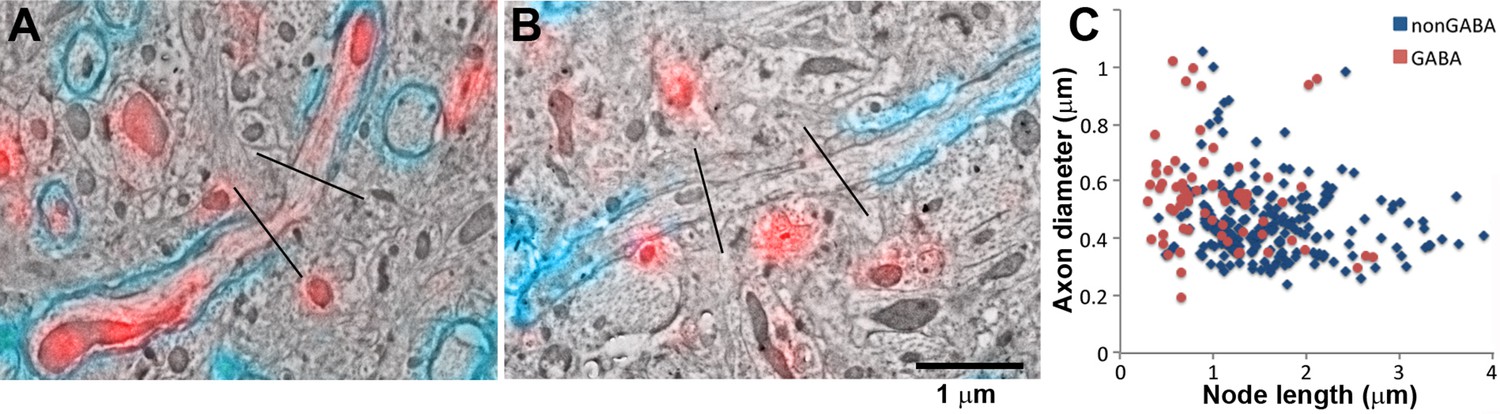
GABA axons have shorter nodes of Ranvier.
(A, B) SEM images of nodes of Ranvier (black lines: node boundaries) of a GABA (A) and non-GABA myelinated axon (B), immunolabeled with MBP (cyan) and GABA (red). (C) Comparison of the lengths of the nodes of Ranvier of cortical myelinated axons.
-
Figure 7—source data 1
Data values and statistics underlying Figure 7.
- https://doi.org/10.7554/eLife.15784.019
Figure 8

Similarities and differences between the myelin of GABA and non-GABA axons.
(A) GABA axons have thicker axons on average. Frequency distribution plot of the thickness measurements of 238 non-GABA and 163 GABA axons. (B) GABA and non-GABA axons have similar g-ratios (mean ± standard error, n=238 non-GABA and 163 GABA axons, Mann-Whitney U Test). (C) The myelin of GABA axons contains significantly more myelin basic protein (MBP) than non-GABA axons (mean ± standard error, n=489 non-GABA and 254 GABA axons). (D) There are no significant differences in the PLP content of myelinated axons. All the analyses for this Figure were performed in cortical layers 4 and 5, which have high density of GABA myelinated axons. Asterisks indicate statistically significant differences (**p<0.01, *p<0.05, Mann-Whitney U Test). (E) and (F) show an example of MBP and PLP immunofluorescence on a single section from the same dataset as analyzed in C and D.
-
Figure 8—source data 1
Data values and statistics underlying Figure 8.
- https://doi.org/10.7554/eLife.15784.021
Figure 9
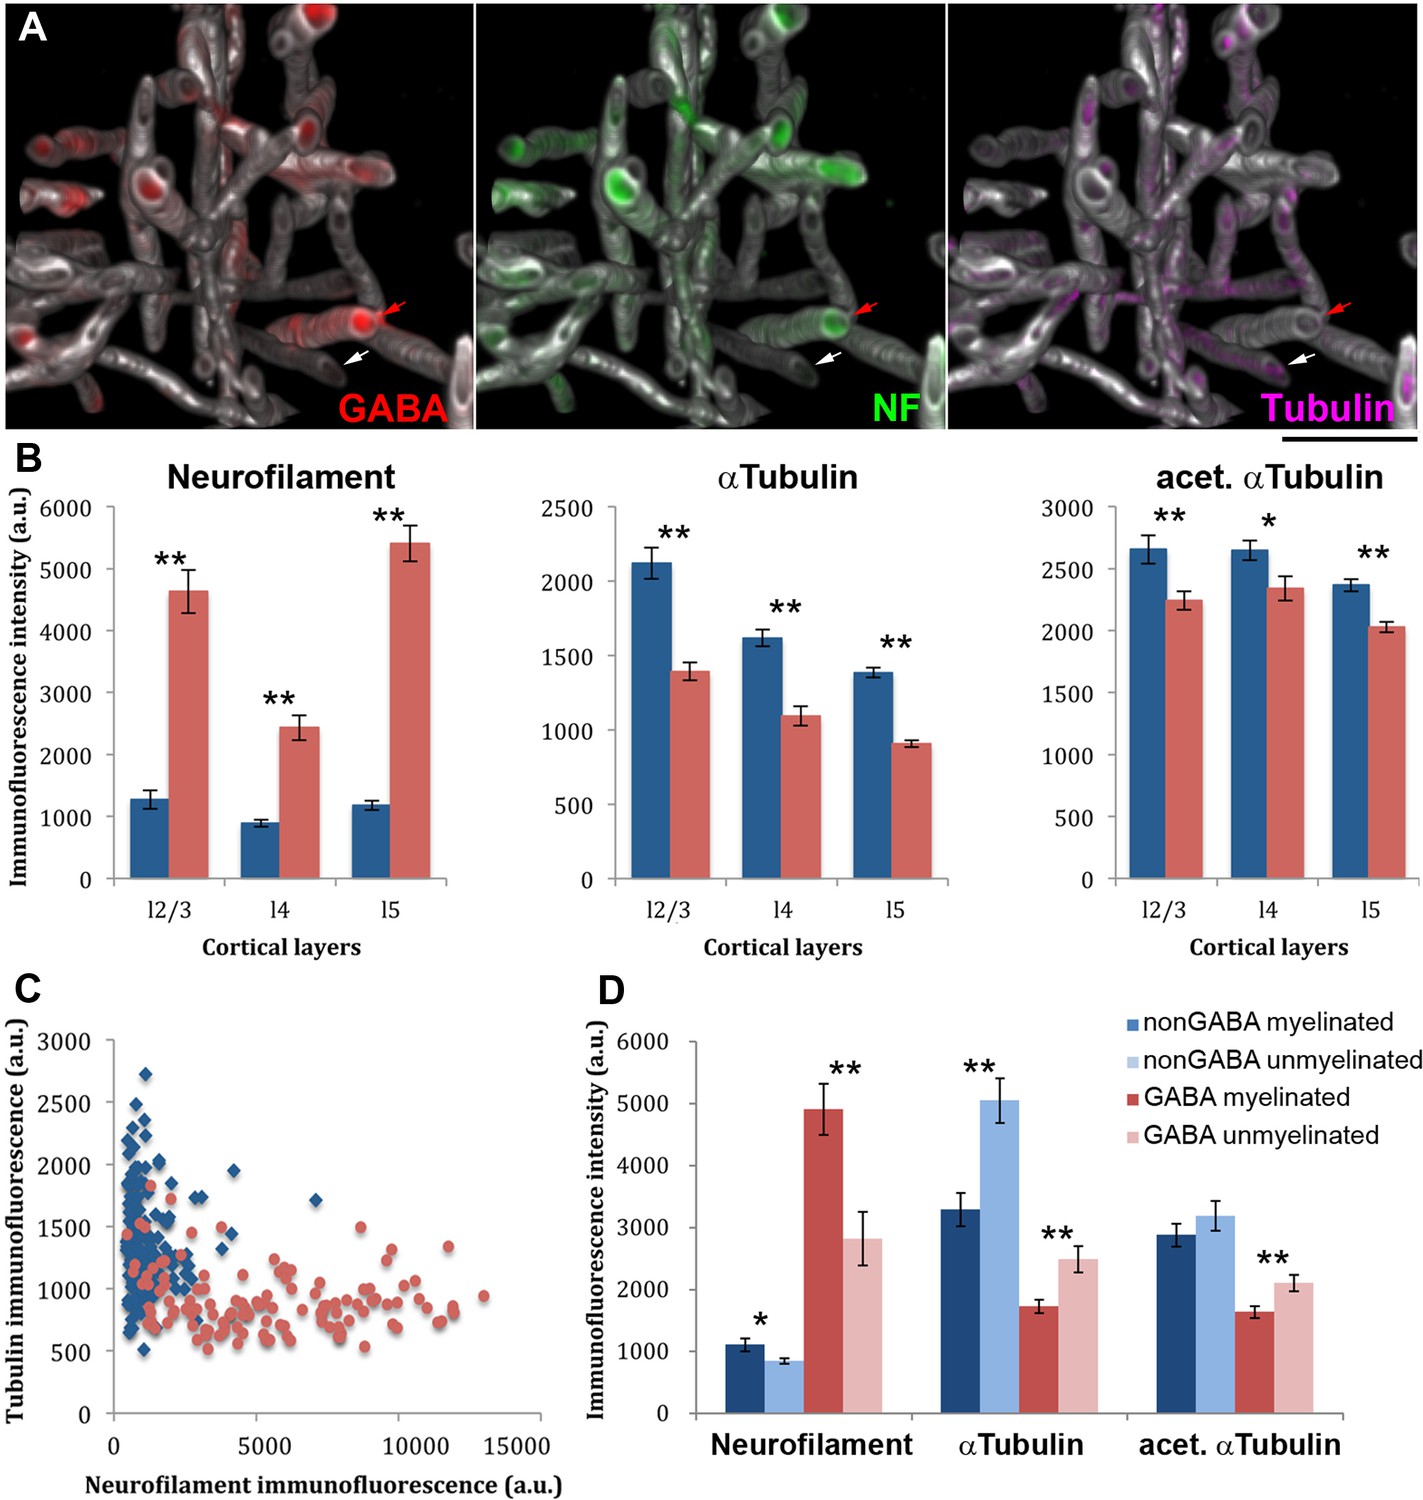
The cytoskeletal composition of myelinated GABA axons is different from myelinated non-GABA axons, as well as from unmyelinated GABA axons.
(A) The reconstructed small volume (16 × 16 × 4.5 µm) from layer 5 of the mouse barrel cortex contains GABA axons (red), which are enriched in neurofilaments (NF-H, green), and non-GABA axons where microtubules (αtubulin, magenta) predominate. For clarity, only immunofluorescence signal within myelinated axons (MBP, white) is displayed. Red arrow points to a GABA positive axon and the white arrow to a GABA negative axon. (B) The immunofluorescence intensity (mean ± standard error) for neurofilament heavy chain, αtubulin and acetylated αtubulin within myelin profiles is compared between GABA (red) and non-GABA axons (blue). A larger volume spanning layers 2/3, 4 and 5, and including the region presented in A was analyzed. The differences are statistically significant (p<0.01, Mann-Whitney U Test) in all cortical layers analyzed (layers 2/3: 80 nonGABA and 68 GABA axons; layer 4: 121 nonGABA and 65 GABA axons; and layer 5: 146 non-GABA and 119 GABA axons). (C) Analysis of the cytoskeletal content of the two types of axons from layer 5 (146 non-GABA and 119 GABA axons). (D) Comparison of myelinated vs. unmyelinated stretches of axons. Individual axons which contained both a myelinated and a non-myelinated portion within the dataset volume were analysed (11 non-GABA and 20 GABA axons from layers 2/3, 4 and 5). Nodes of Ranvier were excluded from the analysis. Statistical differences using paired t-test are reported: *p<0.05, **p<0.01).
-
Figure 9—source data 1
Data values and statistics underlying Figure 9.
- https://doi.org/10.7554/eLife.15784.023
Videos
Video 1
Serial sections through mouse cortex immunostained for MBP.
Stack of raw images from 59 serial sections (70 nm each) from cortical layer 5.
Tables
Table 1
The distribution of the postsynaptic targets.
| Postsynaptic target | Completely traced axons | Partially traced axons | All | |||
|---|---|---|---|---|---|---|
| count | % | count | % | count | % | |
| Excitatory somata | 60* | 15.0 | 46† | 10.5 | 106 | 12.6 |
| Excitatory dendritic shafts | 184 | 45.9 | 225 | 51.4 | 409 | 48.7 |
| Excitatory dendritic spines | 119 | 29.7 | 134 | 30.6 | 253 | 30.2 |
| Excitatory axons | 7 | 1.7 | 8 | 1.8 | 15 | 1.8 |
| All excitatory | 370 | 92.3 | 413 | 94.3 | 783 | 93.3 |
| Inhibitory dendritic shafts | 17 | 4.2 | 20 | 4.6 | 37 | 4.4 |
| Inhibitory dendritic spines | 0 | 0 | 0 | 0 | 0 | 0 |
| Inhibitory axons | 1 | 0.2 | 1 | 0.1 | ||
| All inhibitory | 17 | 4.2 | 21 | 4.8 | 38 | 4.5 |
| Uncategorized dendritic spines | 14 | 3.5 | 4 | 0.9 | 18 | 2.1 |
| Total | 401 | 438 | 839 | |||
-
* Including 10 synapses onto somatic spines;
-
† Including 8 synapses on somatic spines
Table 2
Primary antibodies used in this study.
| Antigen | Host | Antibody source | Dilution | RRID |
|---|---|---|---|---|
| MBP | Chicken | AVES MBP | 1:200 | RRID:AB_2313550 |
| GABA | Guinea pig | Millipore AB175 | 1:5000 | RRID:AB_91011 |
| Parvalbumin | Rabbit | SWANT PV28 | 1:300 | RRID:AB_2315235 |
| NF-H | Chicken | AVES NFH | 1:100 | RRID:AB_2313552 |
| NF-L | Chicken | AVES NFL | 1:100 | RRID:AB_2313553 |
| αTubulin | Rabbit | Abcam ab18251 | 1:100 | RRID:AB_2210057 |
| Acetylated αtubulin | Mouse | Sigma T6793 | 1:100 | RRID:AB_477585 |
| Glutamine Synthetase | Mouse | BD Biosciences 610517 | 1:25 | RRID:AB_397879 |
| PLP | Chicken | AVES PLP | 1:100 | RRID:AB_2313560 |
Additional files
-
Supplementary file 1
Antibody controls.
Pearson’s correlation coefficients from 4 different control experiments are shown. The comparison between adjacent sections tests the consistency of staining, as the distribution of targets is very similar on two adjacent ultrathin sections (70 nm thickness). This correlation is influenced by antibody characteristics, but also the size of targets, with smaller targets displaying larger spatial variability from section to section. This could explain the lower R for NF-H which labels axons, as some axons can be very thin (<100 nm). The comparison with an antibody against an overlapping antigen is a test for the specificity of staining. The following comparisons were done: MBP/PLP, GABA/GAD2, PV/GABA, NFHch/NFHr, αTub/ac αTub. The lower coefficients for GABA/GAD2 and PV/GABA reflect the fact that GAD2 and PV are present in only a subset of GABA containing structures. Another test for specificity is the comparison with an antibody against a spatially exclusive antigen. Values of R around 0 are expected in this case. MBP and PLP (present in the myelin sheath) were each compared with GABA (inside inhibitory neurons); GABA and PV (inhibitory neurons) were compared with VGluT1 (excitatory neurons); NFH, αTub and ac αTub (all predominantly neuronal) with glutamine synthetase (glial). And finally, all antibodies were compared with DAPI to control for background nuclear staining.
- https://doi.org/10.7554/eLife.15784.025
Download links
A two-part list of links to download the article, or parts of the article, in various formats.
Downloads (link to download the article as PDF)
Open citations (links to open the citations from this article in various online reference manager services)
Cite this article (links to download the citations from this article in formats compatible with various reference manager tools)
A large fraction of neocortical myelin ensheathes axons of local inhibitory neurons
eLife 5:e15784.
https://doi.org/10.7554/eLife.15784


