Mechanisms and functional roles of glutamatergic synapse diversity in a cerebellar circuit
- Ecole Normale Supérieure, France
- Inserm, U1024, France
- CNRS, UMR 8197, France
- Université Paris Descartes, France
- University Medical Center Goettingen, Germany
- Bernstein Center for Computational Neuroscience, Germany
- University of Chicago, United States
Figures
Figure 1
OFF- and ON- responses to MF stimulations in two classes of UBCs.
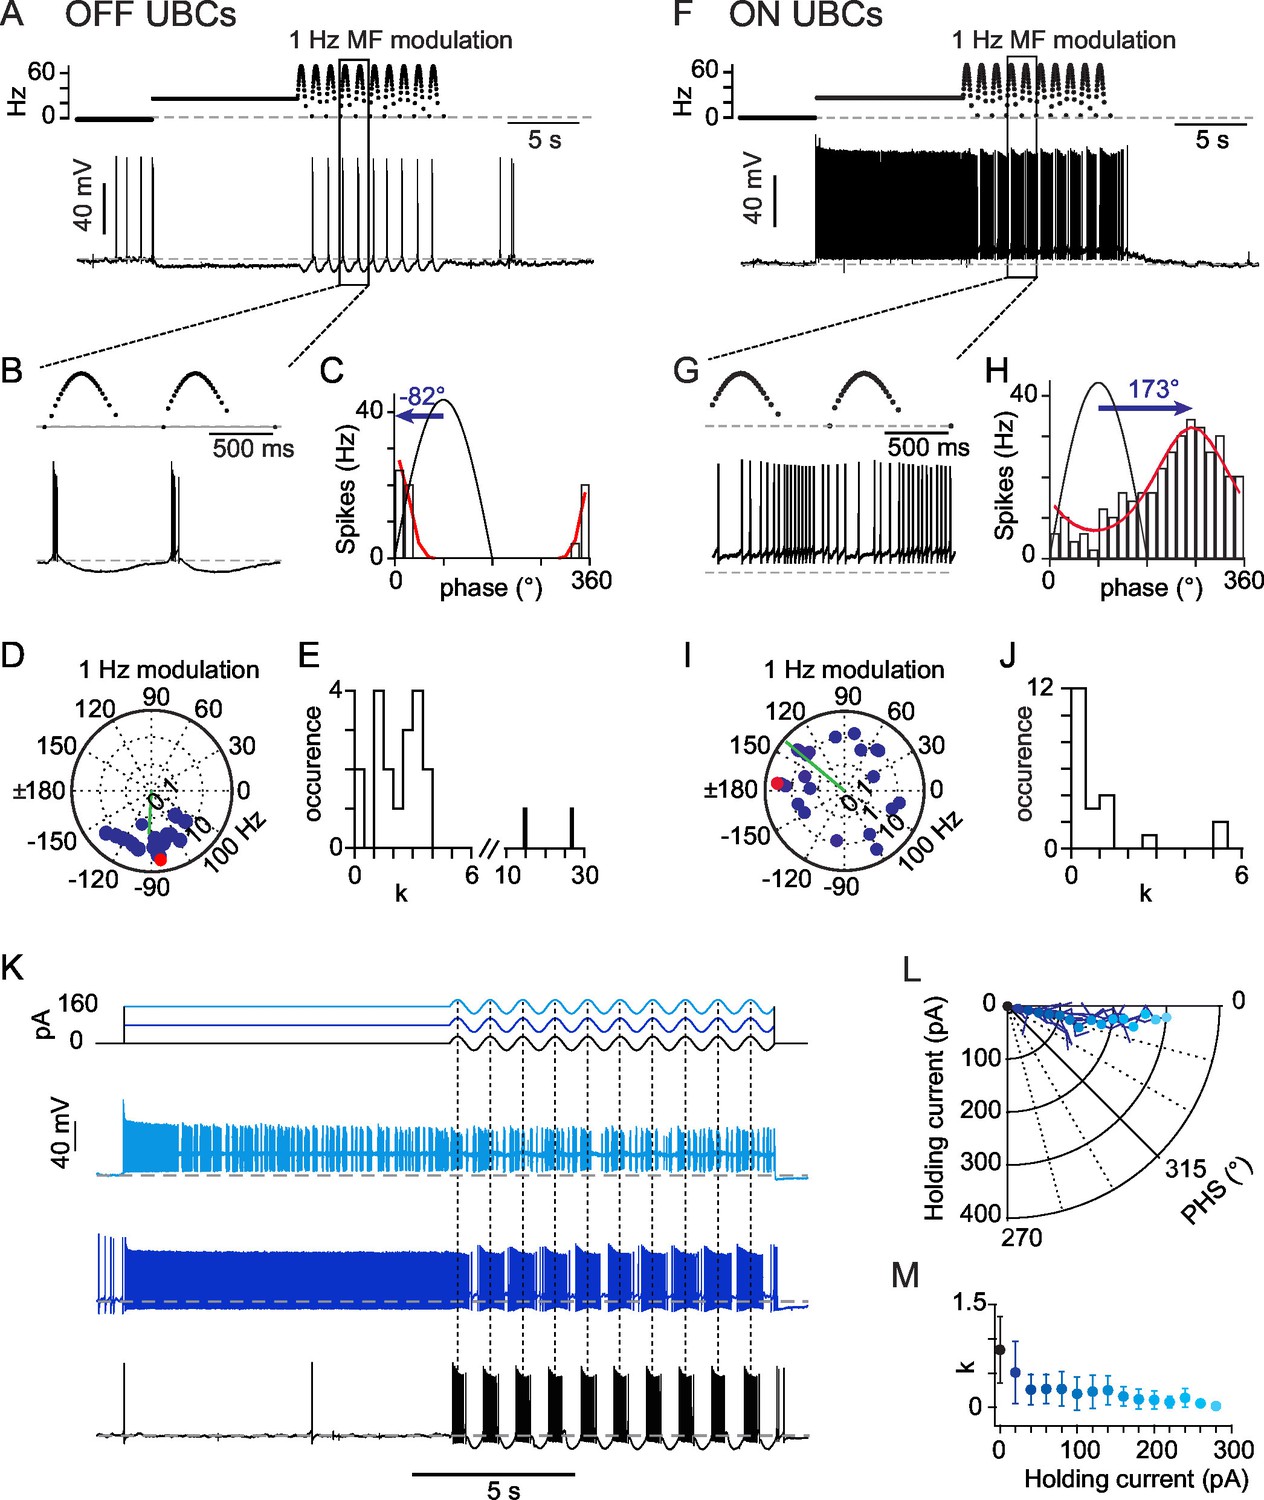
(A) Current-clamp response of a OFF-UBC to a prolonged stimulation of its afferent MF at 26 Hz showing the OFF hyperpolarizing behavior. Steady stimulation is followed by a 1 Hz sinusoidal modulation of the MF stimulation rate. (B) Enlargement of the selected region in (A) showing the phase of UBC spiking relative to the MF stimulation modulation. (C) Fit of the OFF-UBC instantaneous firing rate vs phase relationship, obtained with the ten stimulation cycles shown in (A), using an exponentiated cosine function (see Materials and methods) Here and in the next figures the MF stimulation frequency is depicted in black and peaks at 90°. The blue arrow represents the UBC phase shift relative to the MF stimulation. (D) Polar plot of the phase shift and firing frequency modulation of OFF-UBCs (n = 20) obtained with 1 Hz sinusoidal modulations of the MF stimulation rate. The cell in (A) is plotted in red. (E) Distribution of the concentration factor k1/2 yielded by the exponentiated cosine fit of OFF-UBC responses in (C) (n = 20). (F–J) Same as (A–E) for ON-UBCs. (K) Typical UBC current-clamp responses to the current injections displayed on top traces, where a sinusoidal current modulation of constant amplitude is superimposed on a variable holding current. (L) Phase shift of the UBC responses to sinusoidal current injections shown in (K) as a function of the injected holding current. (M) k1/2 values of the UBC responses to sinusoidal current injections shown in (K) as a function of the injected holding current.
-
Figure 1—source data 1
Numerical data corresponding to panels D, E, I, J, L, M of Figure 1.
Data in the L/M tab are raw data for each cell of the experimental set. Other numbers are averages across cells.
- https://doi.org/10.7554/eLife.15872.004
Figure 2
mGluR2 synaptic currents govern phase inversion in OFF-UBCs.
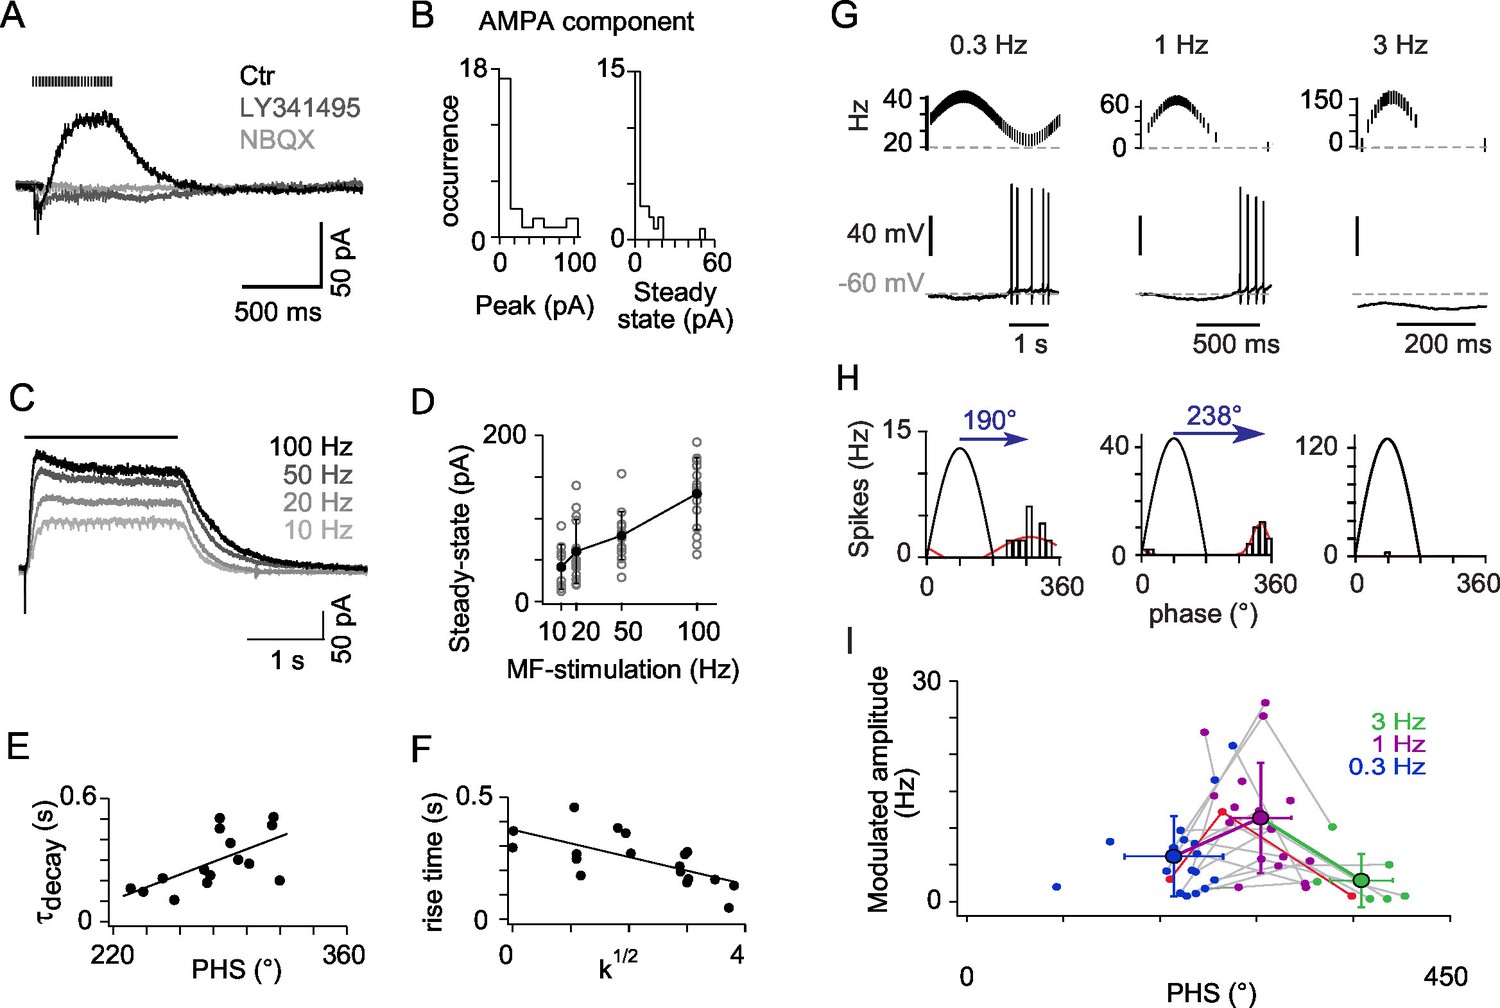
(A) Synaptic currents evoked by a train of MF stimulations (500 ms at 50 Hz) in an OFF-UBC in control conditions (ctr; black), after mGluR2 block by LY341495 (0.5 µM, gray), and after block of AMPAR by NBQX (1 μM, light gray). Stimulation train is shown on top. (B) Quantification of the isolated AMPA component in OFF-UBCs after mGluR2 block. (C) Steady-state mGluR2 currents evoked by 2s stimulations at 10, 20, 50, and 100 Hz display saturation. (D) Frequency dependence of steady-state mGlur2 synaptic currents. Average is in black. (E) The decay time constant of the EPSC at the offset of 500 ms trains of stimulation at 50 Hz correlates with the phase shift recorded in response to a sinusoidal MF stimulation modulation modulated at 1 Hz rate (Figure 1). The black line represents the linear regression. (F) The rise time constant of the outward currents evoked by 500 ms stimulations at 50 Hz correlates with the spikes concentration factor k1/2 obtained in Figure 1. (G) OFF-UBC responses to sinusoidal MF stimulation rate modulations at 0.3, 1, and 3 Hz. Stimulation protocols are shown on top and one period of recording below. (H) Fits of the instantaneous firing rate vs phase relationship of the cell shown in (G). (I) Firing frequency amplitude modulation and phase shifts of 25 OFF-UBCs in response to sinusoidal MF stimulation rate modulations at 0.3, 1, and 3 Hz. The cell displayed in (G) and (H) is plotted in red. Average ± SD are indicated for each modulation frequency.
-
Figure 2—source data 1
Numerical data corresponding to panels B, D, E, F, I of Figure 2.
Each column of the D tab represents raw data for a cell of the experimental set. Other numbers are averages across cells.
- https://doi.org/10.7554/eLife.15872.006
Figure 3
AMPAR activation dominates ON-UBC synaptic responses and presents three components.
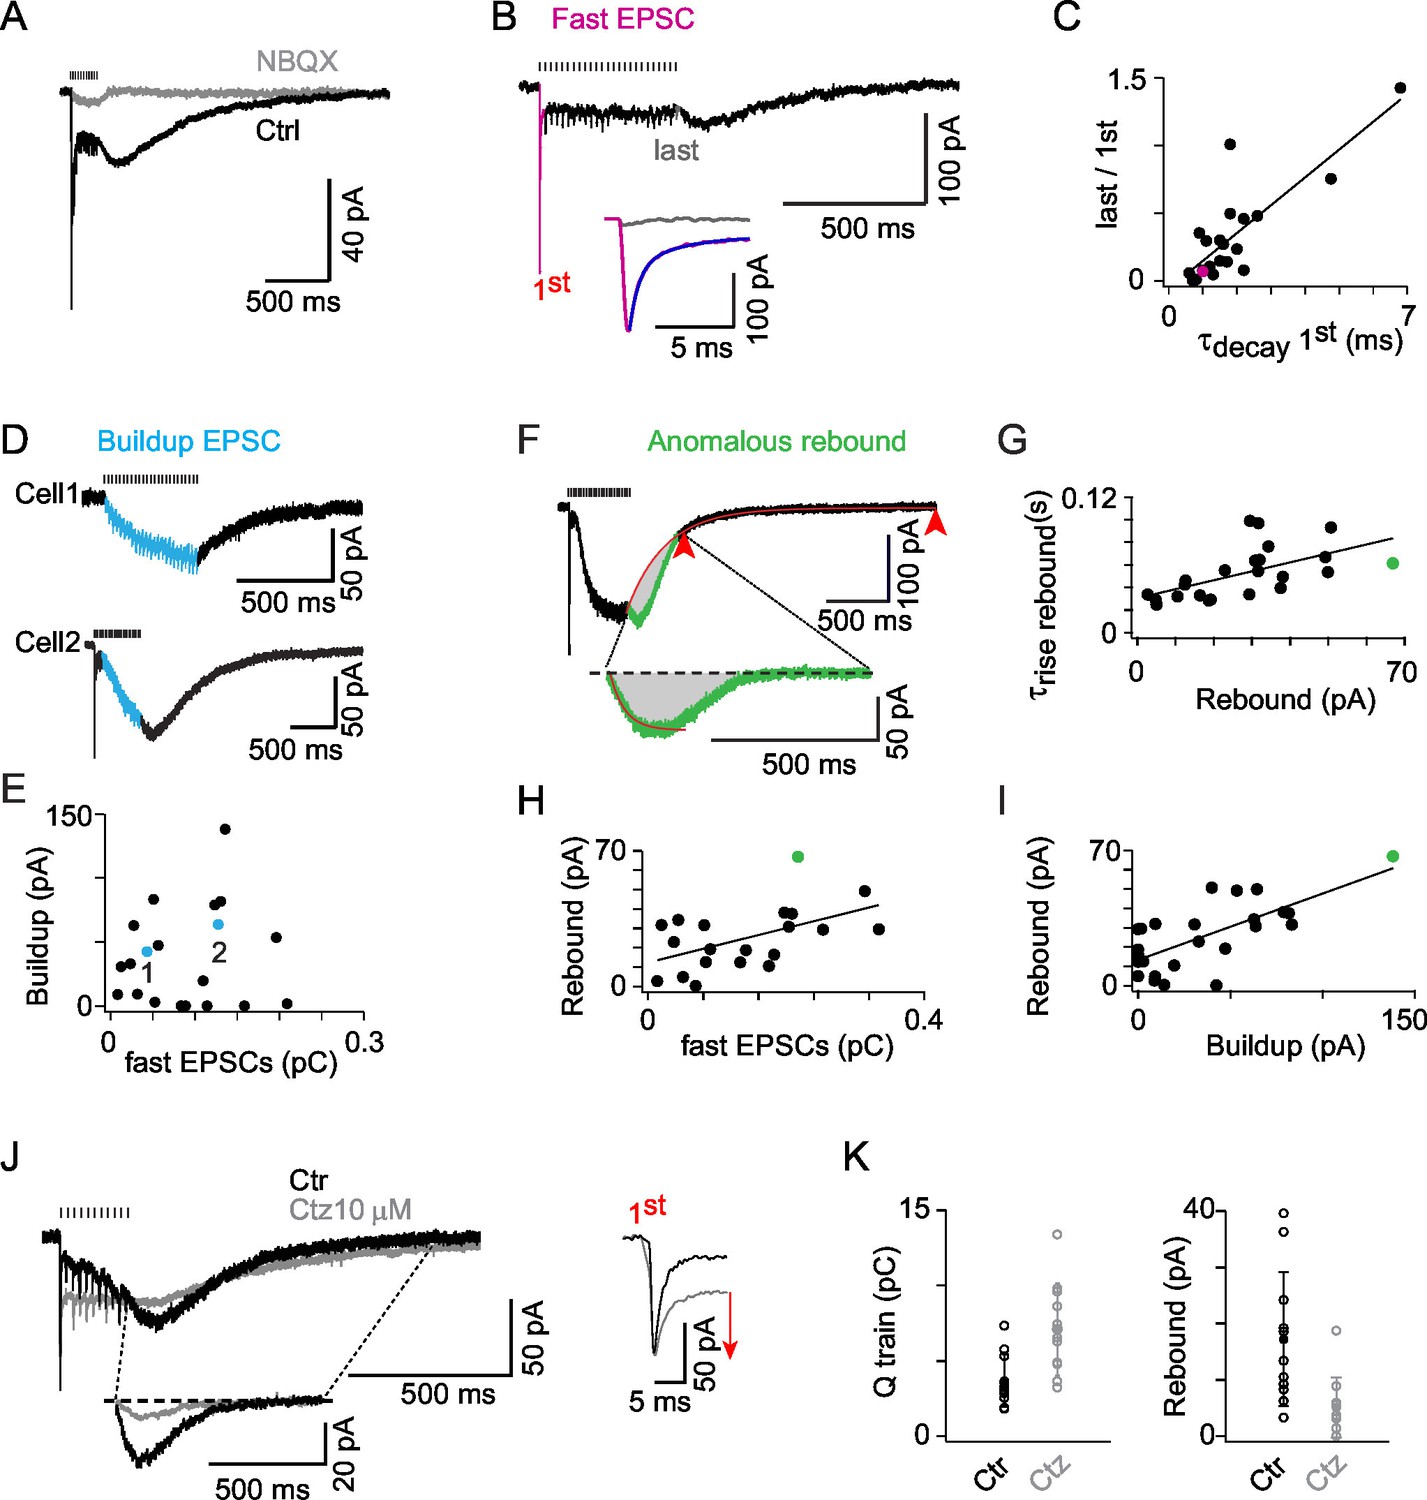
(A) Synaptic currents evoked by a train of MF stimulations of 500 ms at 50 Hz in an ON-UBC before and after perfusion of NBQX (1 μM). Note the transient early EPSC, followed by a slow buildup, and the rebound current at stimulation offset. The stimulation train is shown on top. (B) A sustained steady component persists after desensitization of the phasic response during a train of stimuli. The inset shows a superimposition of the fast EPSCs triggered by the first (pink) and the last (gray) stimulations. The exponential fit of the first EPSCs decay is displayed in purple. (C) Desensitization of the transient EPSCs at the end of a 500 ms stimulation at 50 Hz correlates to the τdecay of the transient EPSCs after the first stimulation (r = 0.823; p<0.001; n = 21). (D) Examples of slow EPSC buildup in two ON-UBCs. (E) The slow EPSCs buildup is not correlated to the first transient EPSC amplitude (n = 20). (F) Analysis of the anomalous rebound at the end of the stimulation. The last 20% of amplitude decay (red arrowheads) are fitted by an exponential function forced at the last point of stimulation (red curve). The isolated rebound current obtained by subtraction of the exponential fit function is displayed in green in the inset. Gray area: charge of rebound current. (G) Correlation of the rebound current amplitude with its rise time (r = 0.583, p =, n = 23). (H) Correlation of the rebound current amplitude with the amplitude of the transient EPSC (r = 0.611, n = 21) (I) Correlation of the rebound current amplitude with the amplitude of the slow EPSCs buildup (r = 0.763, n = 25). Voltage-clamp stimulation protocol in c, d, f, g, h: 500 ms at 50 Hz. (J) AMPA EPSCs before (Ctr, black) and after 10 µM cyclothiazide (Ctz, gray) perfusion. Left bottom inset: isolated rebound current obtained as in (F) in Ctr and Ctz. Right inset: transient EPSCs at the first stimulation in Ctr and Ctz conditions. MF stimulations are shown on top. Voltage-clamp stimulation protocol: 200 ms at 50 Hz. (K) EPSCs charge and rebound amplitude in control condition (Ctr, black) and after 10 µM cyclothiazide perfusion (Ctz, gray; n = 11). Voltage-clamp stimulation protocol in (C), (D), (F), (G), (H), (I): 500 ms at 50 Hz.
-
Figure 3—source data 1
Numerical data corresponding to panels C, E, G, H, K of Figure 3.
Each line is the result for a cell of the experimental set.
- https://doi.org/10.7554/eLife.15872.008
Figure 4

The AMPA rebound current defines the phase shift of UBC responses to sinusoidal input modulations.
(A) AMPA EPSCs of an ON-UBC with early phase shift. (B) Voltage response of the same UBC shown in A. (C) Circular Gaussian fit of the firing rate distributions of the cell shown in (B). (D) Correlation of the response phase at 1 Hz to the ratio charge at the offset of stimulation / total synaptic charge (r = 0.734, p<0.001, n = 22). (E) Correlation of the time delay to maximal firing to τrise of the rebound current (r = 0.87, p<0.001, n= 16). (F) Example of an ON-UBC’s voltage response to 1 Hz sinusoidal modulations of MF stimulation (4 cycles shown out of 10) before (Ctr) and after 10 µM cyclothiazide (Ctz) perfusion. Stimulations are shown on top. (G) Phase shift in control condition (black) and in 10 µM cyclothiazide perfusion (gray, n = 7). (H) ON-UBC responses to sinusoidal MF stimulation rate modulations at 0.3, 1, and 3 Hz. Stimulation protocols are shown on top and one period of recording below. Circular Gaussian fits of the firing rate distributions of the same cell. (I) Modulated firing amplitudes and phase shifts of 25 ON-UBCs in response to sinusoidal MF stimulation rate modulations at 0.3, 1, and 3 Hz. The cell displayed in (H) is plotted in red. Average ± SD are indicated for each modulation frequency. Voltage-clamp stimulation protocol in (D), (E): 500 ms at 50 Hz.
-
Figure 4—source data 1
Numerical data corresponding to panels D, E, G, I of Figure 4.
Each line is the result for a cell of the experimental set.
- https://doi.org/10.7554/eLife.15872.010
Figure 5
Modeling the AMPAR responses of ON-UBCs.
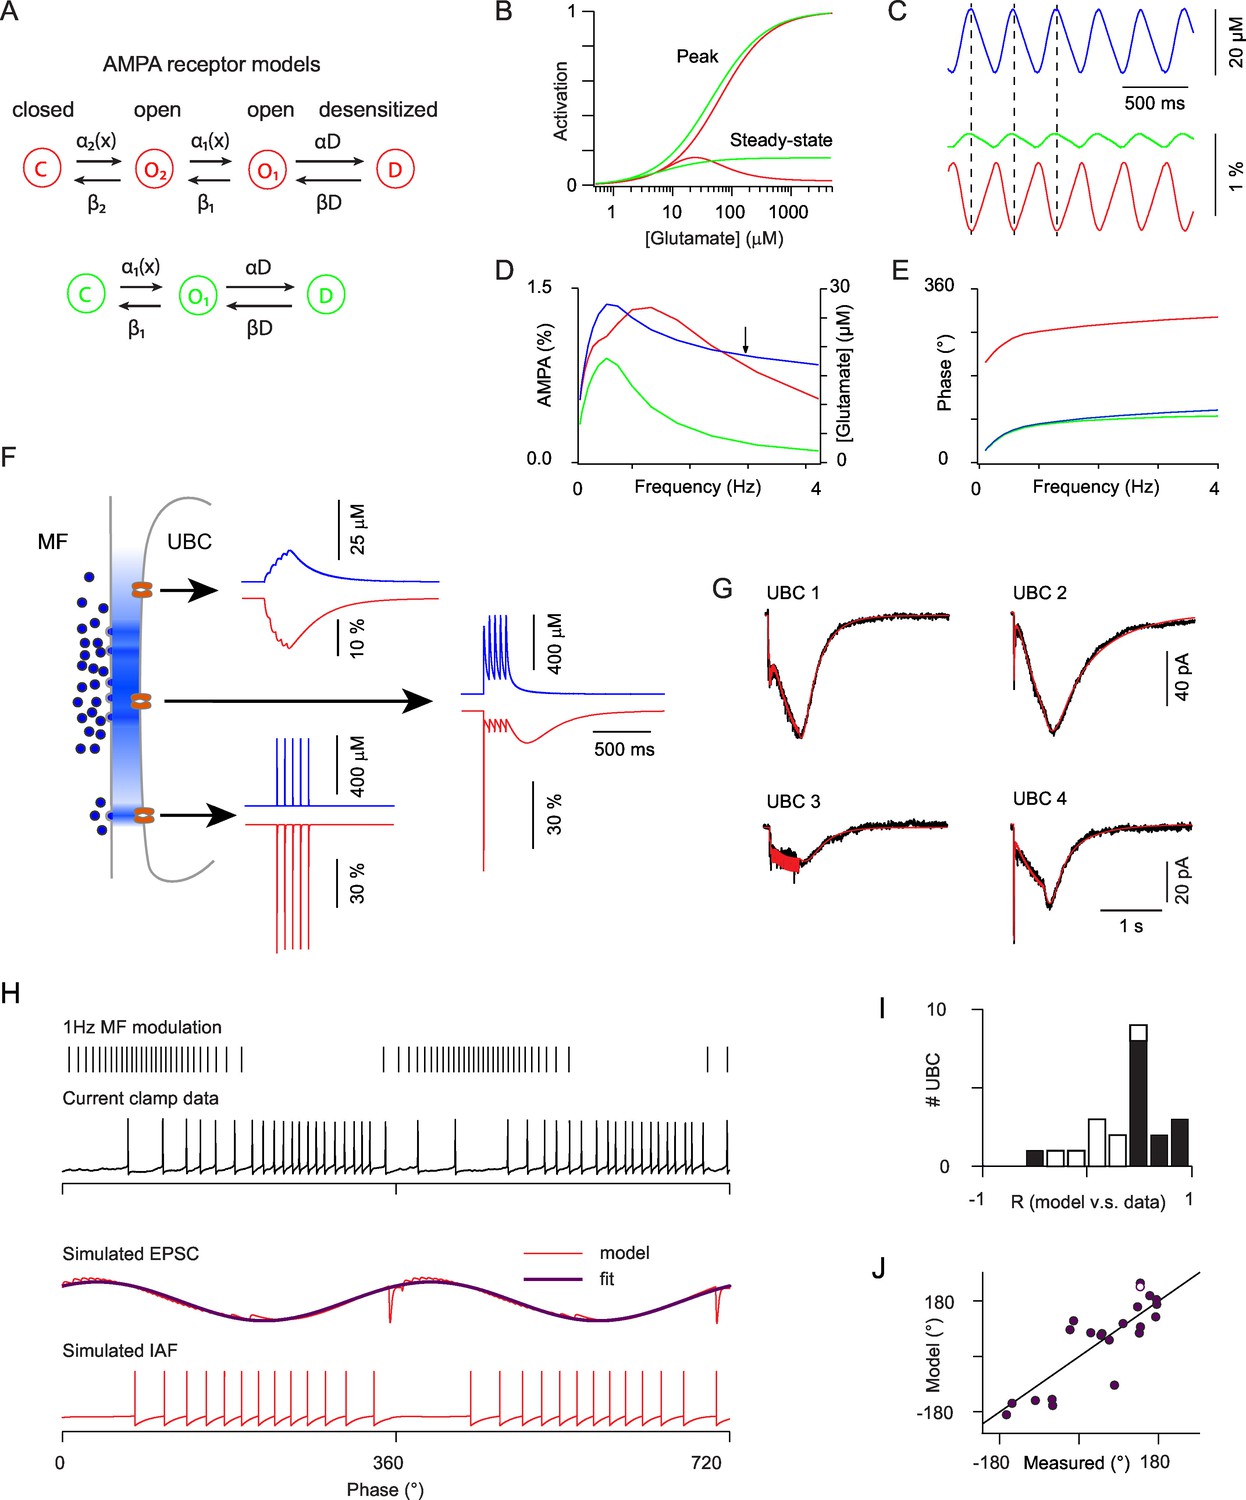
(A) Simple Markov models for desensitizing AMPARs with bell-shaped steady-state activation curve (red) and monotonous steady-state activation (green). (B) Peak and steady-state dose-response curves for the red and green models in (A). (C) Simulated glutamate concentration (blue) and AMPAR activation (red and green) during a 3 Hz sinusoidal stimulation of the presynaptic mossy fiber (same parameters as for the experimental data). Each presynaptic action potential was set to produce a glutamate transient of 2 μM which rose in 15 ms and decayed exponentially with a t of 600 ms. (D) Peak to peak modulation amplitude of the glutamate concentration and fractional AMPAR activation (colors as in C) as a function of the MF firing rate modulation frequency. (E) Phase of the glutamate concentration and AMPAR response relative to the MF modulation. Note the phase inversion of the bell-shaped model. (F) Schematic depiction of glutamate concentration profiles (in blue) at the giant MF-UBC synapse upon multivesicular release. Simulated responses (glutamate in blue, bell-shaped AMPAR Markov model in red) to a train of 5 stimulation at 20 Hz are shown for the following parameters (peak, τrise, τdecay) of action-potential evoked glutamate transients: top inset (4 μM, 20 ms, 250 ms), middle inset (500 μM, 1 ms, 250 ms), lower inset (500 μM, 0 ms, 1.5 ms). (G) Example of the response of 4 ON-UBCs to a 500 ms train of MF stimulation at 50 Hz and of their fit (red curve) by the summed activation of three AMPAR populations submitted to different glutamate transients, as in (F). (H) Response of an ON-UBC to a sinusoidal modulation of its afferent MF firing rate at 1 Hz (black trace) and simulated EPSC obtained with the parameters obtained through fitting in (G) (middle red trace). The response of a simulated integrate and fire neuron to this EPSC is shown in the bottom trace. Purple trace, exponentiated cosine fit of the EPSC used in (J). (I) Correlation between the simulated phase-dependent EPSC and the experimental phase-dependent firing response of UBCs (n = 22). Significant correlations (p=0.05) are displayed in black bars. (J) Correlation between the phase shift of the simulated EPSC and the measured phase shift of the UBC response in current clamp. Line represents equality. Hollow circle: cell displayed in (H).
Figure 6
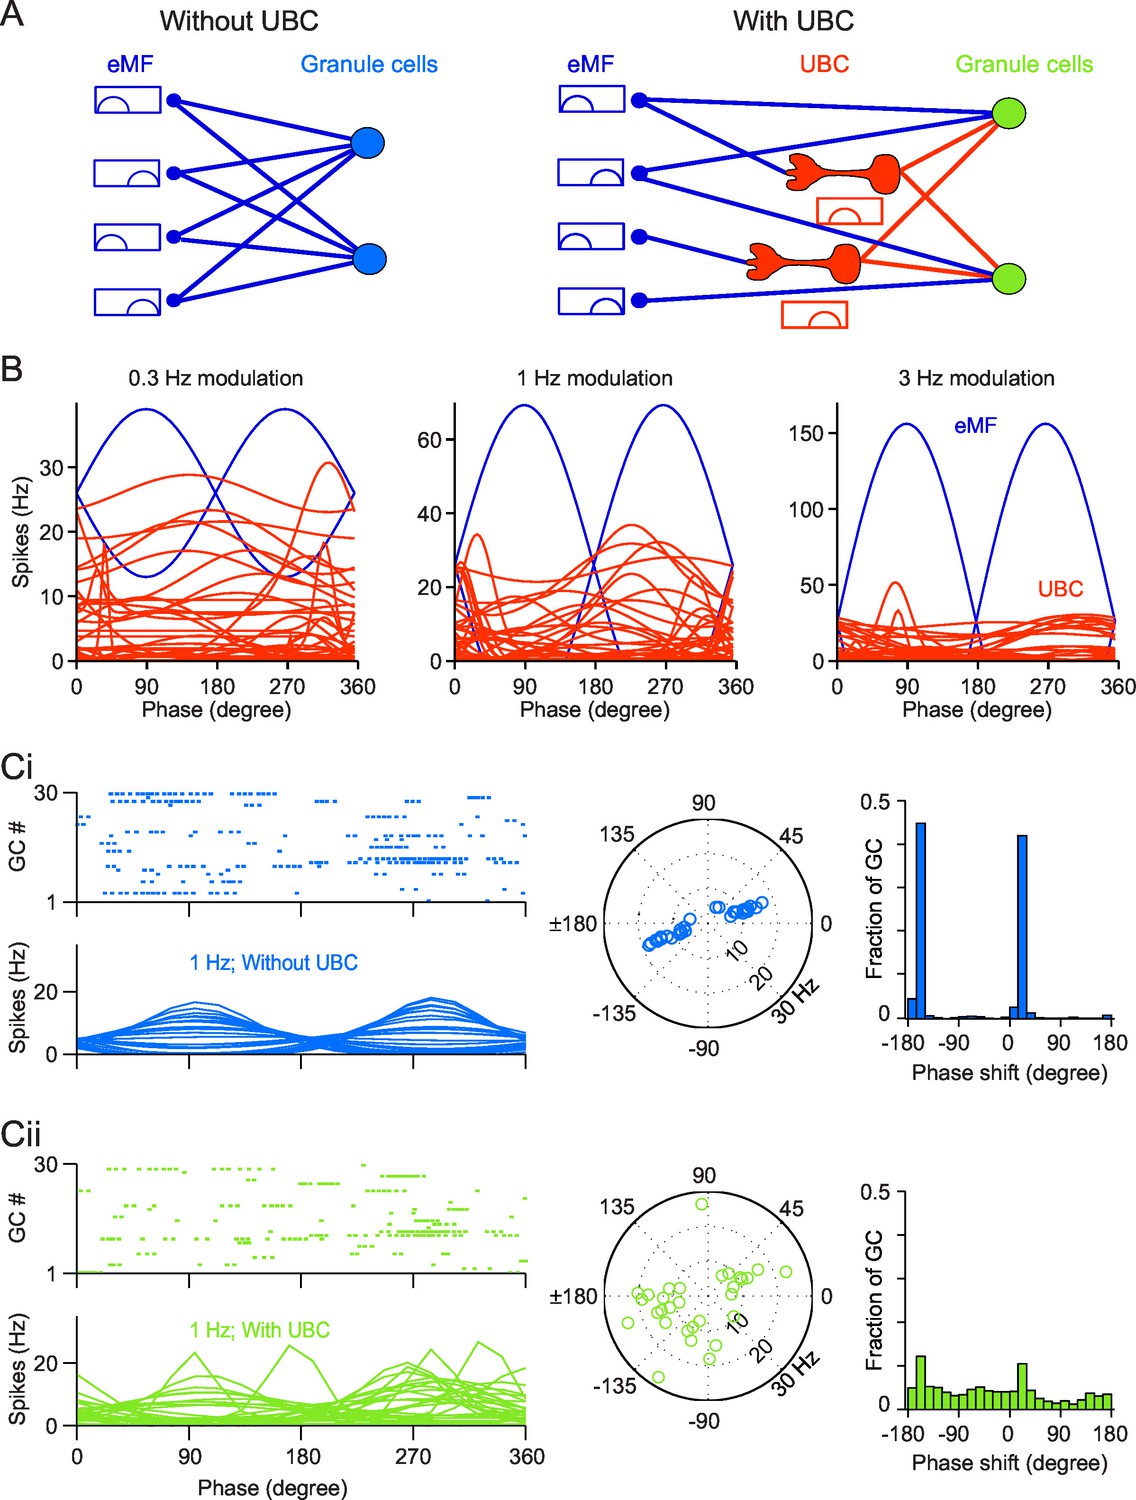
Simulation of a Granular network with/without UBCs.
(A) Illustration of the Granular network. Granular cells receive inputs from only eMFs without UBCs (left) and both eMFs and UBCs (right),. UBCs have different phase shifts. (B) Firing rate vs phase curves of simulated eMFs (blue) and all recorded UBCs (red) at 0.3 Hz (left), 1 Hz (middle) and 3 Hz (right) modulations. (Ci) Sample Granular cell outputs without UBCs in the network. (left, upper) Raster plots of 30 random selected GCs in one input period, and (left, bottom) their averaged firing rate curve; (right) polar plots of GC phase shifts. (Cii) Same as (Ci), but for sample Granular cell outputs with UBCs in the network.
Figure 7
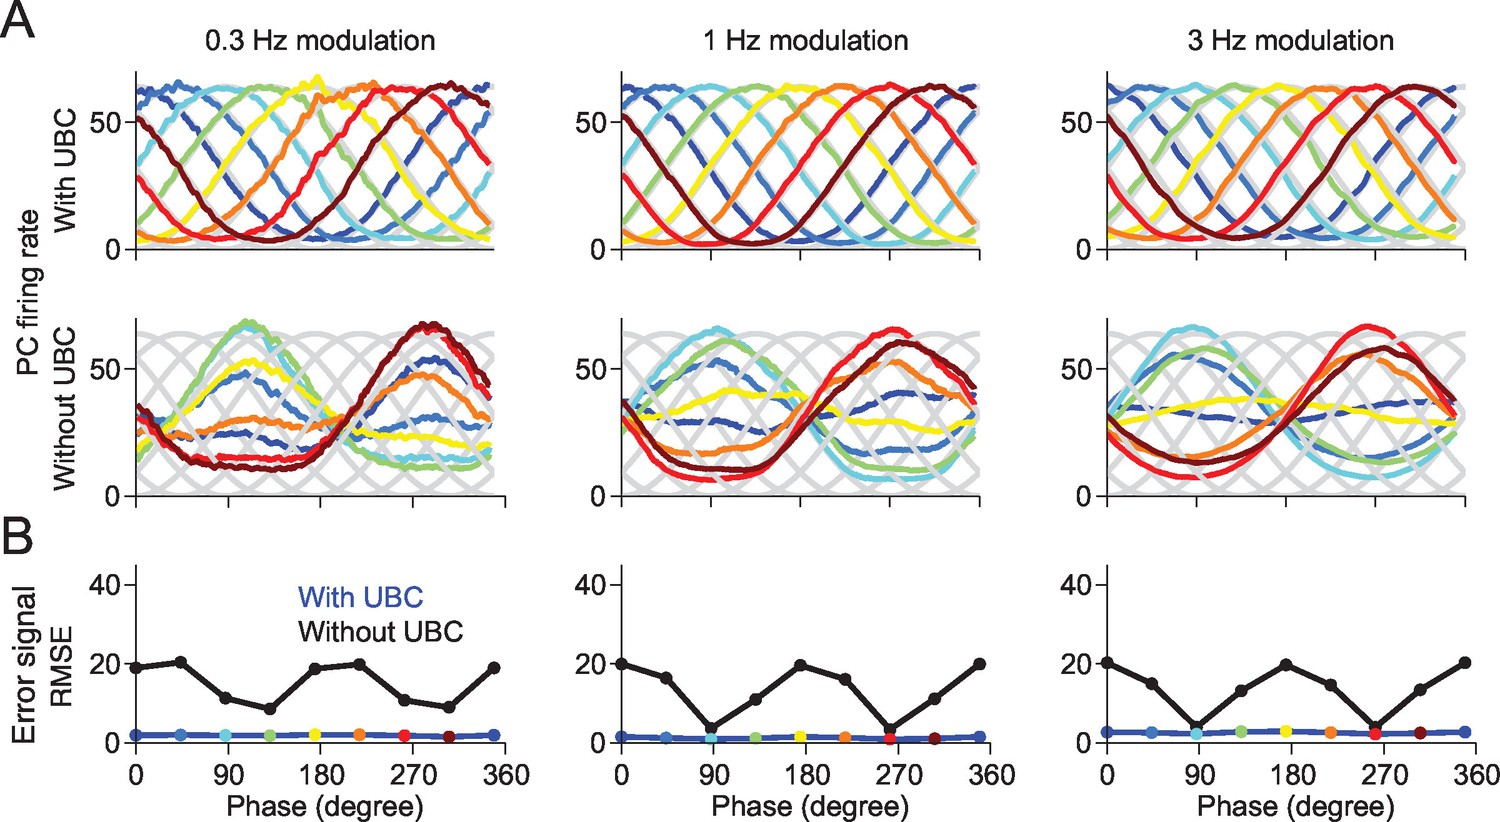
A downstream Purkinje cell can learn to fire at arbitrary phases in a network containing UBCs.
(A) The responses of the Purkinje cell are tuned to the given target phase in the network with UBCs. Each target phase is indicated by each color. (B) The mean square error (MSE) between the target and the response of Purkinje cell is systematically smaller in the network with UBC (blue) than those without UBC (black). Each color point indicates the PC’s response shown in (A).
Tables
Table 1
Parameters of synapses
| Synapse | Strength | EPSC kinetics | Short-term plasticity | |||||
|---|---|---|---|---|---|---|---|---|
| Pre-Post | type | (nS) | (1/ms) | (ms) | (ms) | (ms) | (ms) | |
| eMF-GC | 0.4 | 3 | 0.3 | 0.8 | 0.5 | 600 | 600 | |
| 0.8 | 0.3 | 0.5 | 5 | 0.5 | 600 | 600 | ||
| NMDA | 0.96 | 0.35 | 8 | 30 | 0.05 | n.a. | n.a. | |
| UBC-GC | 1.6 | 3 | 0.3 | 0.8 | 0.5 | 12 | 12 | |
| 3.2 | 0.3 | 0.5 | 5 | 0.5 | 12 | 12 | ||
| NMDA | 3.84 | 0.35 | 8 | 30 | 0.05 | n.a. | n.a. | |
Download links
A two-part list of links to download the article, or parts of the article, in various formats.
Downloads (link to download the article as PDF)
Open citations (links to open the citations from this article in various online reference manager services)
Cite this article (links to download the citations from this article in formats compatible with various reference manager tools)
Mechanisms and functional roles of glutamatergic synapse diversity in a cerebellar circuit
eLife 5:e15872.
https://doi.org/10.7554/eLife.15872


