Astrocyte morphology is confined by cortical functional boundaries in mammals ranging from mice to human
- The Weizmann Institute of Science, Israel
Figures
Figure 1
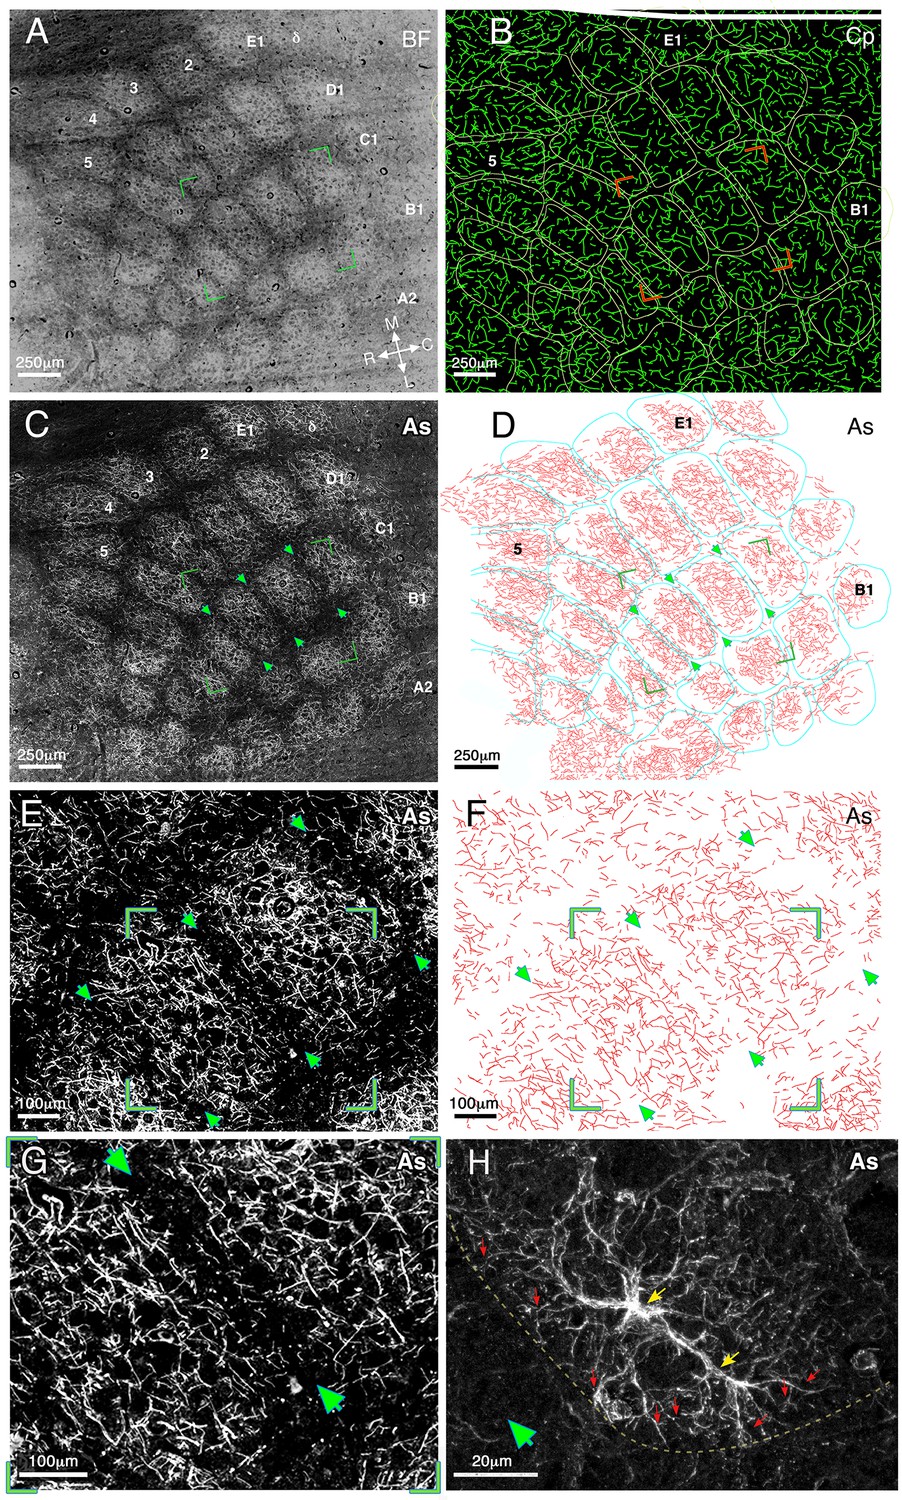
Relationship of astrocyte branches and capillaries to the barrels borders in cortical layer IV at medium and high magnifications.
(A) A dark field illumination image (inverted contrast) of the barrel field (BF) area of a flattened left hemisphere. The barrel borders are evident as dark septa surrounding a lighter core. Barrel rows A–E and arcs 1–5 as well as the medial–lateral and rostral–caudal axes are indicated. (B) Reconstruction of the capillaries (Cp) visualized using fluorescein dextran. Barrel borders (derived from A) marked by yellow lines, were superimposed on the drawing of capillaries. The two images were aligned using penetrating blood vessels as landmarks. (C) Fluorescent micrograph of GFAP immunostaining (CY3 conjugated) of astrocyte processes (As). The image consists of 90 tiles that were assembled together revealing the lateral distribution of the processes. (D) A reconstruction of the astrocyte processes of image C performed by manual drawing of their branches at high magnification. The borders of the barrel field (marked in turquoise) and astrocyte processes were aligned as in B. Green arrowheads indicate three barrel borders shown in enlarged view in E and F. All the images were taken from the same tissue section. (E) Enlarged florescent image of stained astrocyte processes (same as in C) showing further details of the processes. Arrow heads point to a clearly visible gap in the astrocyte distribution at three barrel boundaries. Green corners indicate the enlarged image shown in G. (F) A reconstruction of the astrocyte processes (drawn manually at high magnification) shown in E. (G) An enlarged fluorescent image view of the area bounded by the green box in E, showing the astrocyte distribution relative to the barrel borders (arrows). (H) A high magnification confocal image demonstrates the fine processes of two astrocytes at the border between barrels and septa (green arrowhead) indicated by a yellow line. The astrocyte cell bodies are indicated by yellow arrows and examples of their processes by red ones.
Figure 2
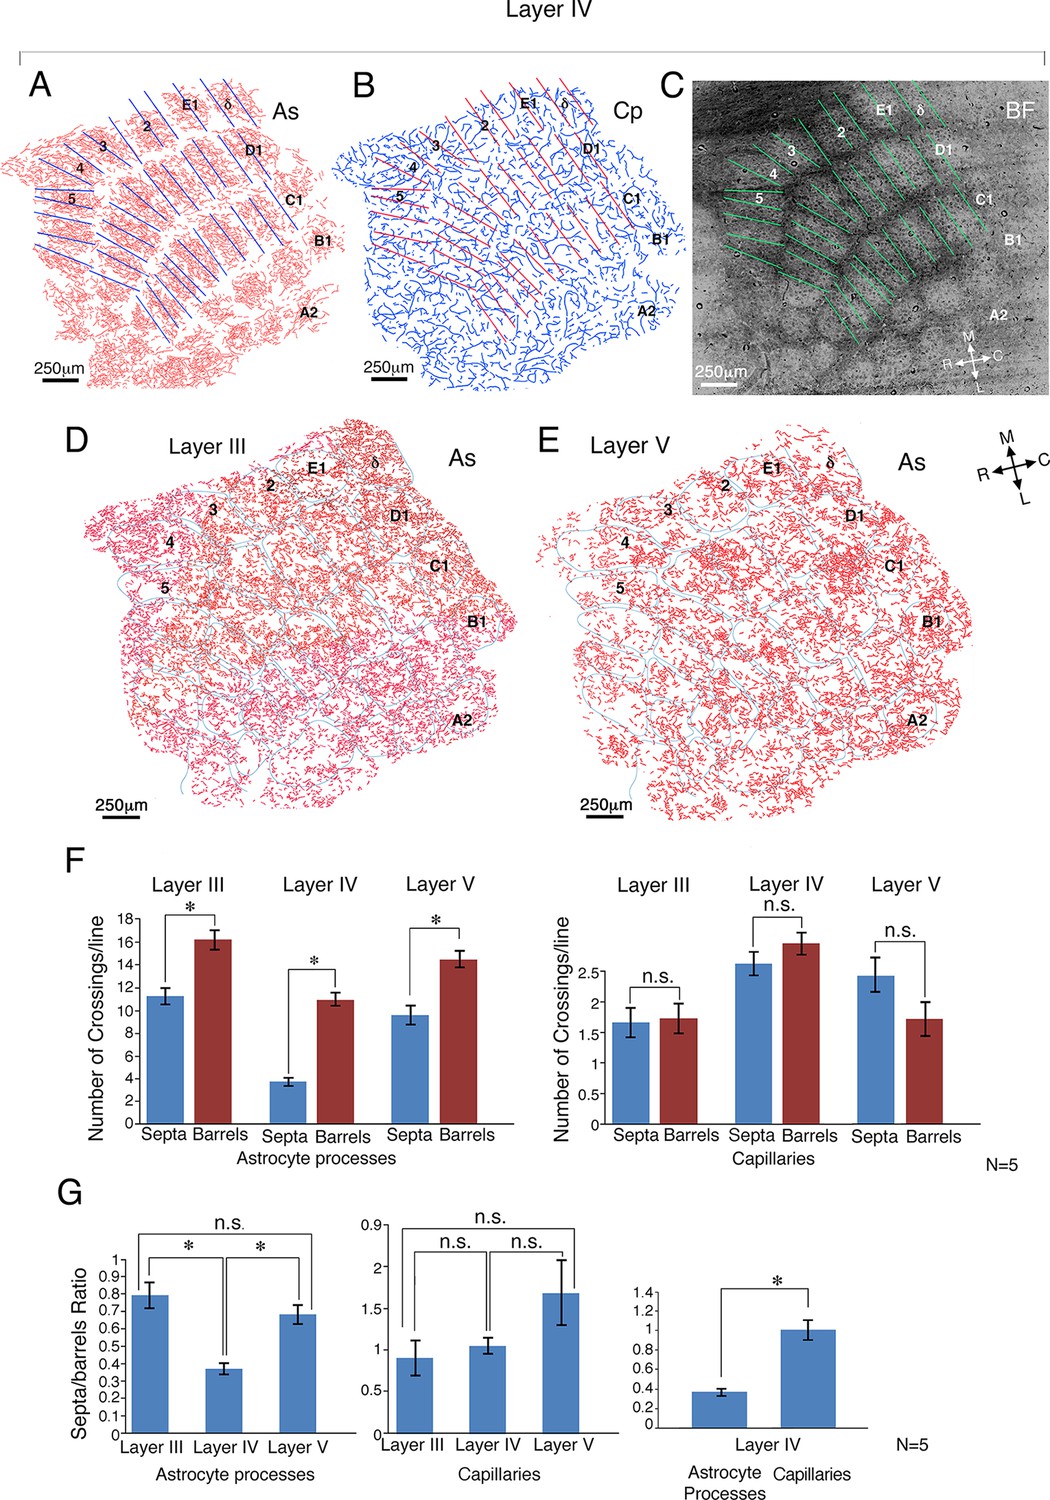
Quantitative comparison of astrocyte and capillary crossings in the core and septa of the barrels in layer IV as well as of the corresponding regions in the supra-granular and infra-granular layers.
(A) Astrocyte process (As) reconstructions from the barrel field (BF) of layer IV. (B) Capillary (Cp) reconstruction of the same field. (C) A matrix of lines (375 µm length) was drawn at the center of the septa aligned with the border's orientation. For comparison, lines of identical length and orientation were superimposed at the center of the barrel cores (see Materials and methods for details). Septa and core related lines superimposed on the astrocyte and the capillary drawings in A and B respectively were aligned using penetrating arterioles. (D and E) Drawings of astrocyte distribution in layers III (supra-granular) (left) and layer V (infra-granular) (right) of the cortex, 80 µm above and below the barrel field borders. The boundaries of the barrels were transferred from the dark field image of layer IV and superimposed upon the astrocyte processes of layer III and V. All the images were aligned according to penetrating arterioles. The matrix of lines was also transferred from layer IV (not shown). (F) Histograms depicting the number of astrocyte processes and capillaries respectively, crossing the septal and barrel cores at layers III-V. (G) Histograms displaying septa/barrel crossing ratio (see Materials and methods) for the astrocyte (left) and capillary (middle) crossings, across the different layers, as well as a histogram comparing the ratio of astrocytes with capillaries in layer IV (right). Means ± s.e.m., *p<0.0001; n.s., non-significant.
Figure 3
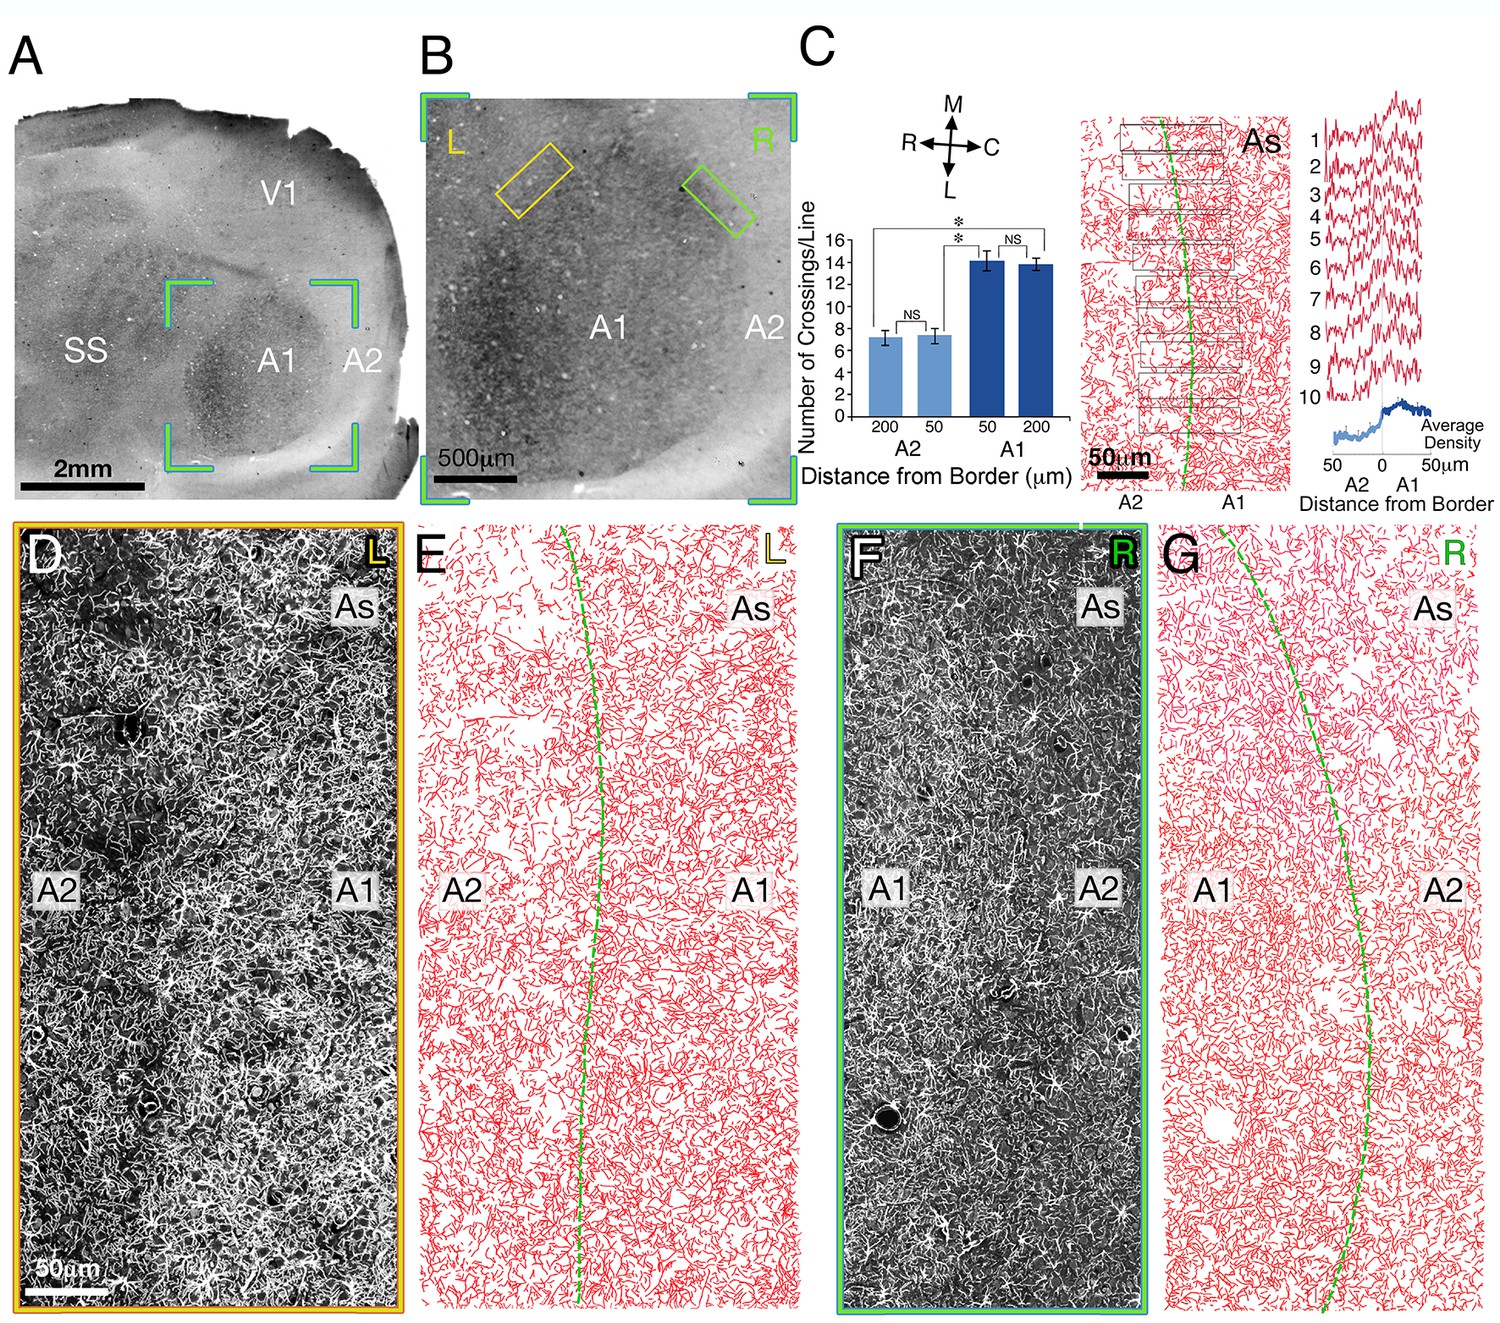
The relationship between astrocyte processes and the A1/A2 border in layer IV of rat auditory cortex.
(A) Low magnification of a dark field illuminated image of a tangential section through layer IV. (B) Dark field illuminated image of areas A1 (primary auditory cortex, dark round area) and A2 (secondary auditory fields, bright area surrounding A1), taken from the green bounded region in A. (C) Left panel: graphical representation of the number of astrocyte processes (AS) crossing a matrix of lines (50 µm length) which were drawn at A1 and A2 areas, 50 and 200 µm from the A1/A2 border aligned with the border's orientation (not shown). Right panel: density plot measurements of ten 25 µm wide bands located perpendicular to the border’s orientation (middle panel) in areas A1/A2 (individual traces-red, average-blue). (D and F) An enlarged fluorescent images of the astrocyte processes in the area bounded by the yellow and green boxes in B left (L) and right (R) border of A1/A2, respectively. (E and G) A manual reconstruction of the astrocyte processes in images D and F, respectively. The border between A1 and A2 is demarcated by a green line. SS, somatosensory cortex.V1, primary visual cortex
Figure 4 with 1 supplement
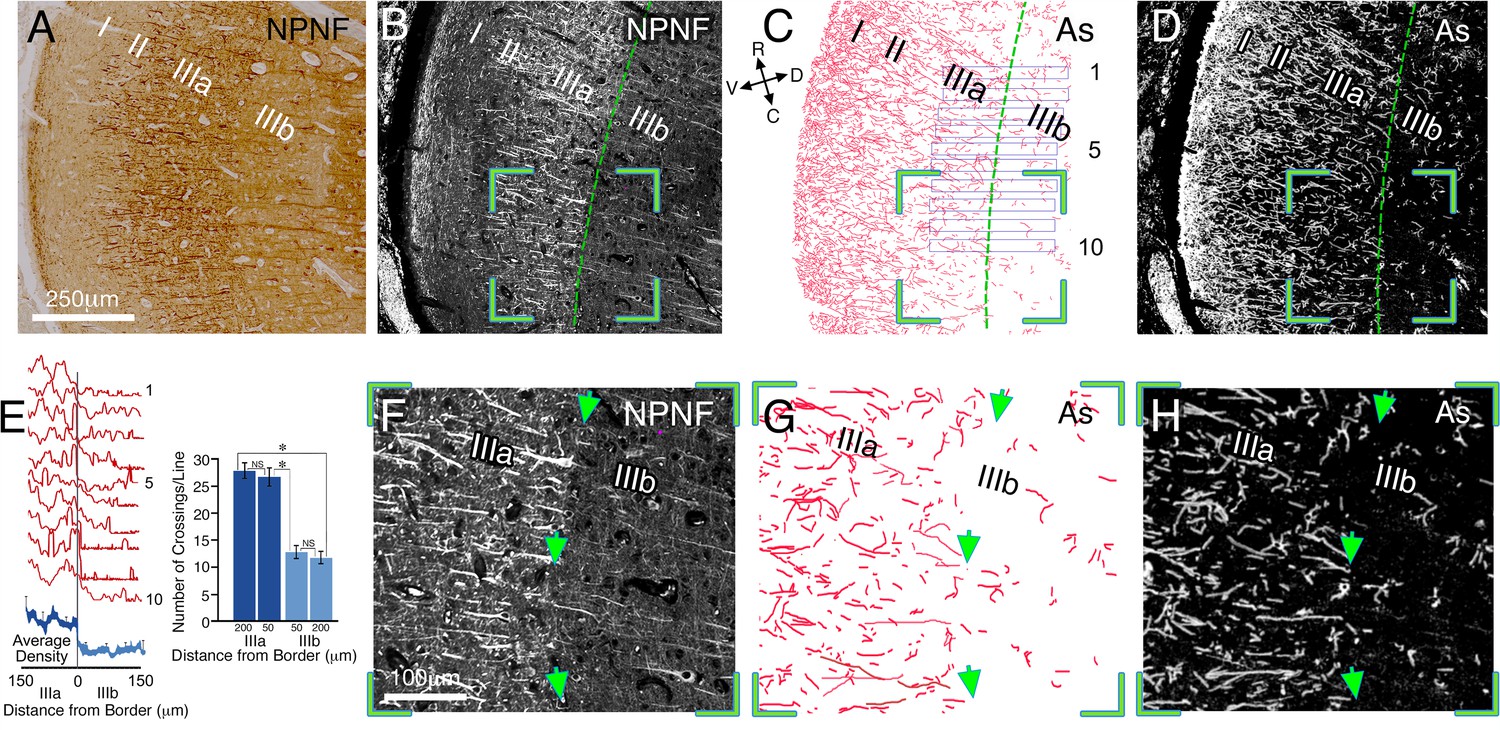
Relationship between interlaminar astrocyte processes and the sublaminar border of layers IIIa/IIIb in the post-mortem human striate cortex.
Immunohistochemical staining of coronal sections of human area V1, illustrating the relationship between interlaminar astrocyte processes and the sublaminar border of layers IIIa/IIIb. (A) Bright field photograph of coronal section through V1 stained for NPNF (non-phosphorylated neurofilament), a higher magnification, image of the area is shown in Figure 4—figure supplement 1D. The border between IIIa/IIIb is demarcated by the heavily (II & IIIa) and lightly (IIIb) stained bands. (B and D) Immunofluorescent double staining for NPNF (B) and GFAP (D), respectively, on a section adjacent to that of A. The border between IIIa/IIIb is demarcated by a green line. (C) A manual reconstruction of the astrocyte processes (As) in image D. (E) Left panel: superimposed density plot measurements of ten 30 µm wide bands perpendicular to the border (plotted in C) in layers IIIa/IIIb (individual traces-red, average-blue). Right panel: a graphic representation of the number of astrocyte processes crossing a matrix of lines (375 µm length), which were drawn at layers IIIa and IIIb, 50 and 200 µm from the IIIa/IIIb border aligned with the border's orientation (not shown). (F–H) Enlarged image of stained pyramidal cell bodies and apical dendrites, as well as astrocyte processes taken from the green bounded region in B–D, respectively, showing further details of the astrocyte processes. Arrow heads point to a clearly visible IIIa/IIIb border
Figure 4—figure supplement 1
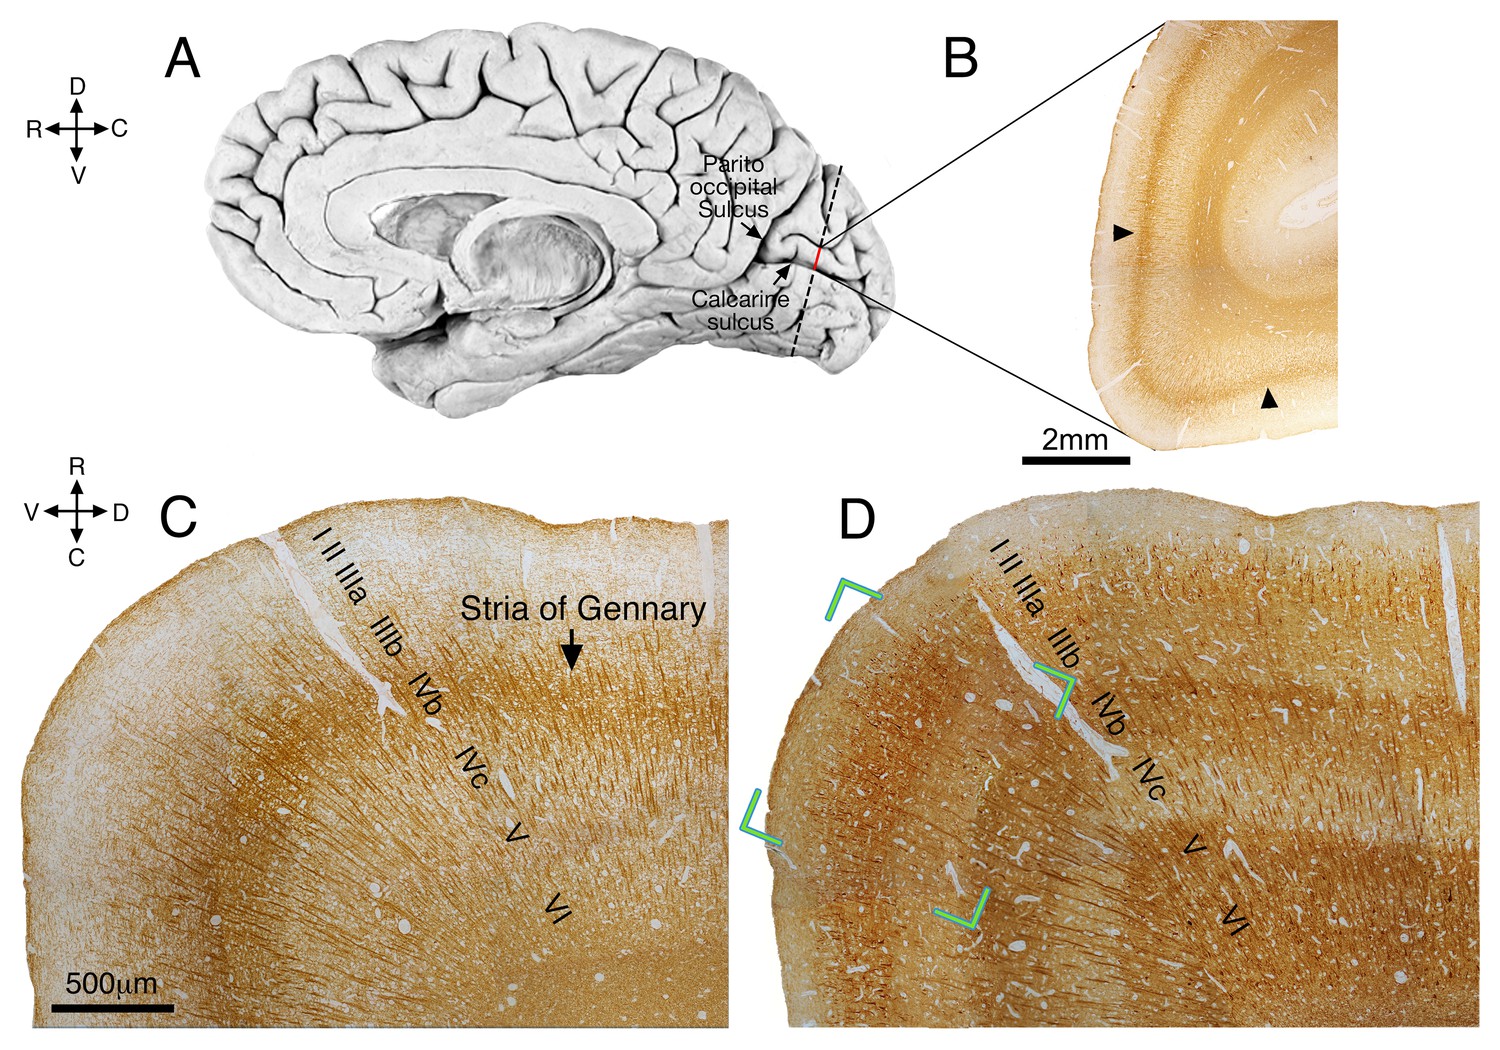
Low magnification view of the human occipital lobe.
(A) A semi-schematic illustration of the right hemisphere of the brain. The vertical dotted line in the occipital lobe corresponds to the plane of sections B–D. (B) A Coronal section through the Calcarine sulcus of area V1 (marked by red line in A), stained for myelin. The dark, densely stained stripe demarcates the Stria of Gennary (arrow heads). (C) Higher magnification micrograph of the section in B, rotated 90º CW, demonstrating the Stria of Gennary in layer IVb. (D) A sequential section of C, immunostained for non-phosphorylated neurofilament (NPNF), showing dark staining bands in layers IIIa, IVb, V and VI. The green corners indicate the area of the image in Figure 4A (see main text).
Figure 5
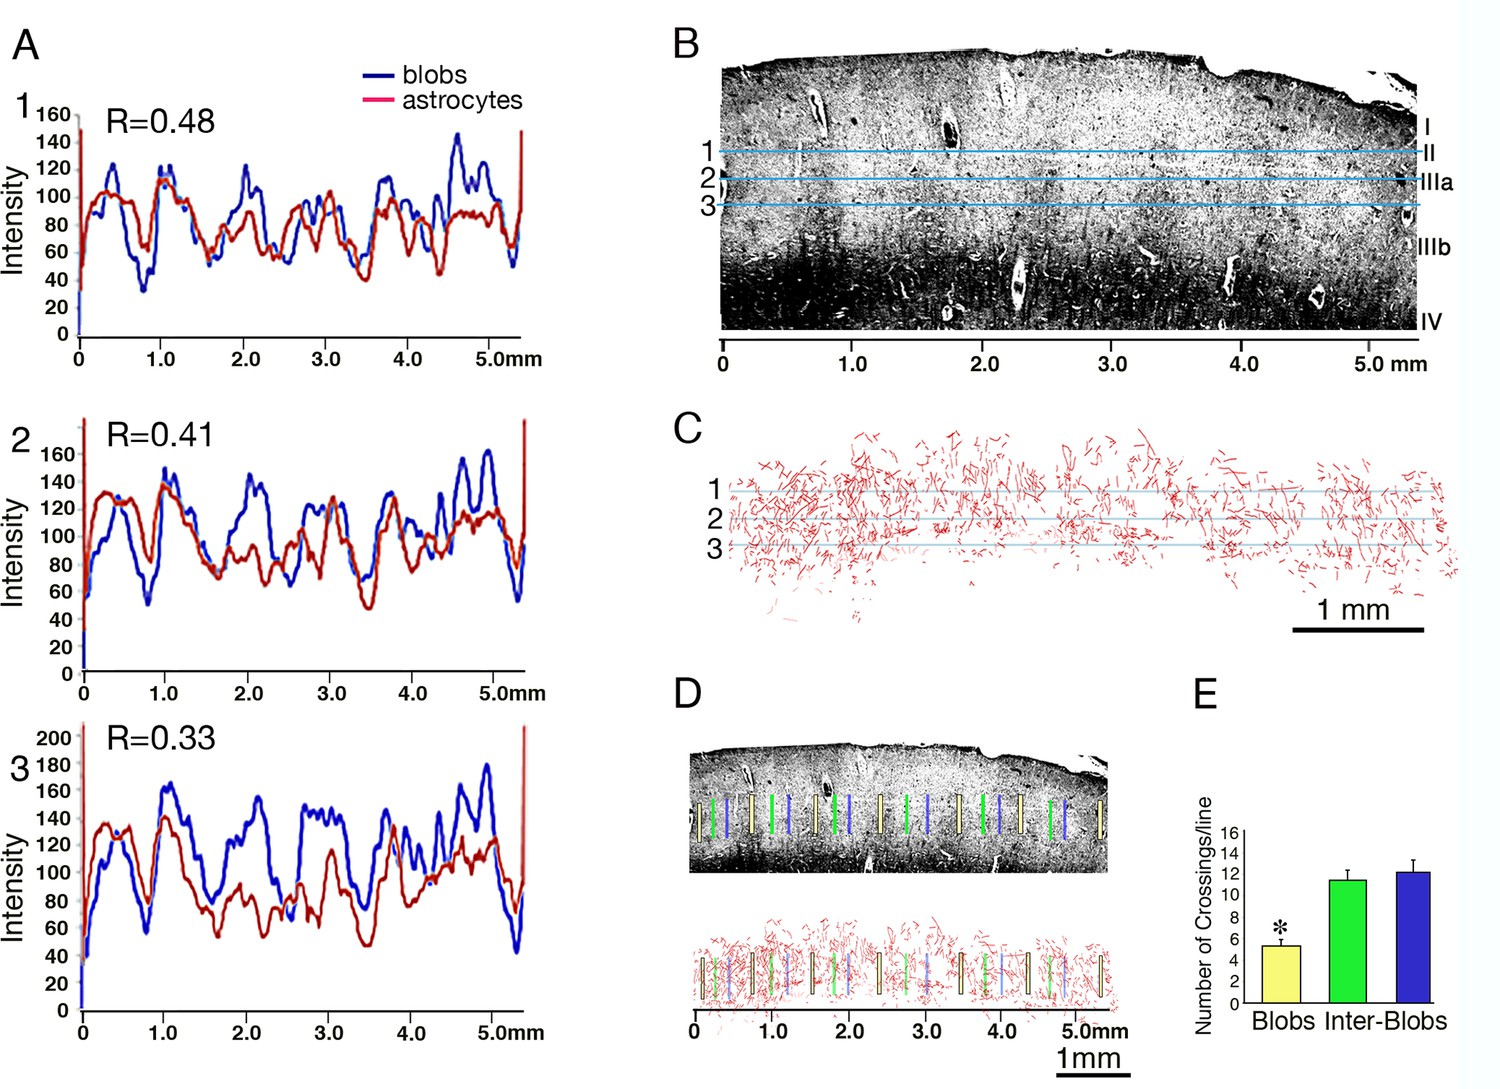
Relationship between CO-blobs and astrocyte density in the post-mortem human striate cortex.
The relationship between the intensity of cytochrome oxidase (B, blue) and astrocytic GFAP staining (C, red) along cortical layer II and IIIa is depicted in a coronal section from human striate cortex. (A) 1–3; transmission plots of bright-field CO histochemistry (high-CO indicated by low levels of transmission, blue lines) and astrocyte process density (red). R-values (Pearson coefficients of correlation) indicate a significant CO-modulation of astrocyte density and blob-interblob organization. (B) A section stained for cytochrome oxidase shows a dense band in layer IV and periodic vertical regions of enhanced enzyme activity in the upper layers (blobs), interspersed with inter-blob regions at about 1 mm period. Horizontal lines (numbered 1–3) depict the density measurement lines shown in A1-3 respectively. (C) Astrocyte process reconstruction in layer II and IIIa of an adjacent section stained for GFAP. Horizontal blue lines, similar to B. (D) Same sections as in B and C, indicating the location of 500 micron vertical lines that were placed at the center of blobs (yellow), the center of inter-blobs (green) and at the left margin of inter-blobs (blue). (E) Histograms depict the number of astrocyte crossings across each of the vertical lines shown in D. Note the significant increase in astrocyte processes crossing in inter-blobs compared to the CO blobs proper (*p<0.005).
Download links
A two-part list of links to download the article, or parts of the article, in various formats.
Downloads (link to download the article as PDF)
Open citations (links to open the citations from this article in various online reference manager services)
Cite this article (links to download the citations from this article in formats compatible with various reference manager tools)
Astrocyte morphology is confined by cortical functional boundaries in mammals ranging from mice to human
eLife 5:e15915.
https://doi.org/10.7554/eLife.15915


