Clathrin modulates vesicle scission, but not invagination shape, in yeast endocytosis
- European Molecular Biology Laboratory, Germany
- MRC Laboratory of Molecular Biology, United Kingdom
- University of Geneva, Switzerland
Figures
Figure 1 with 1 supplement
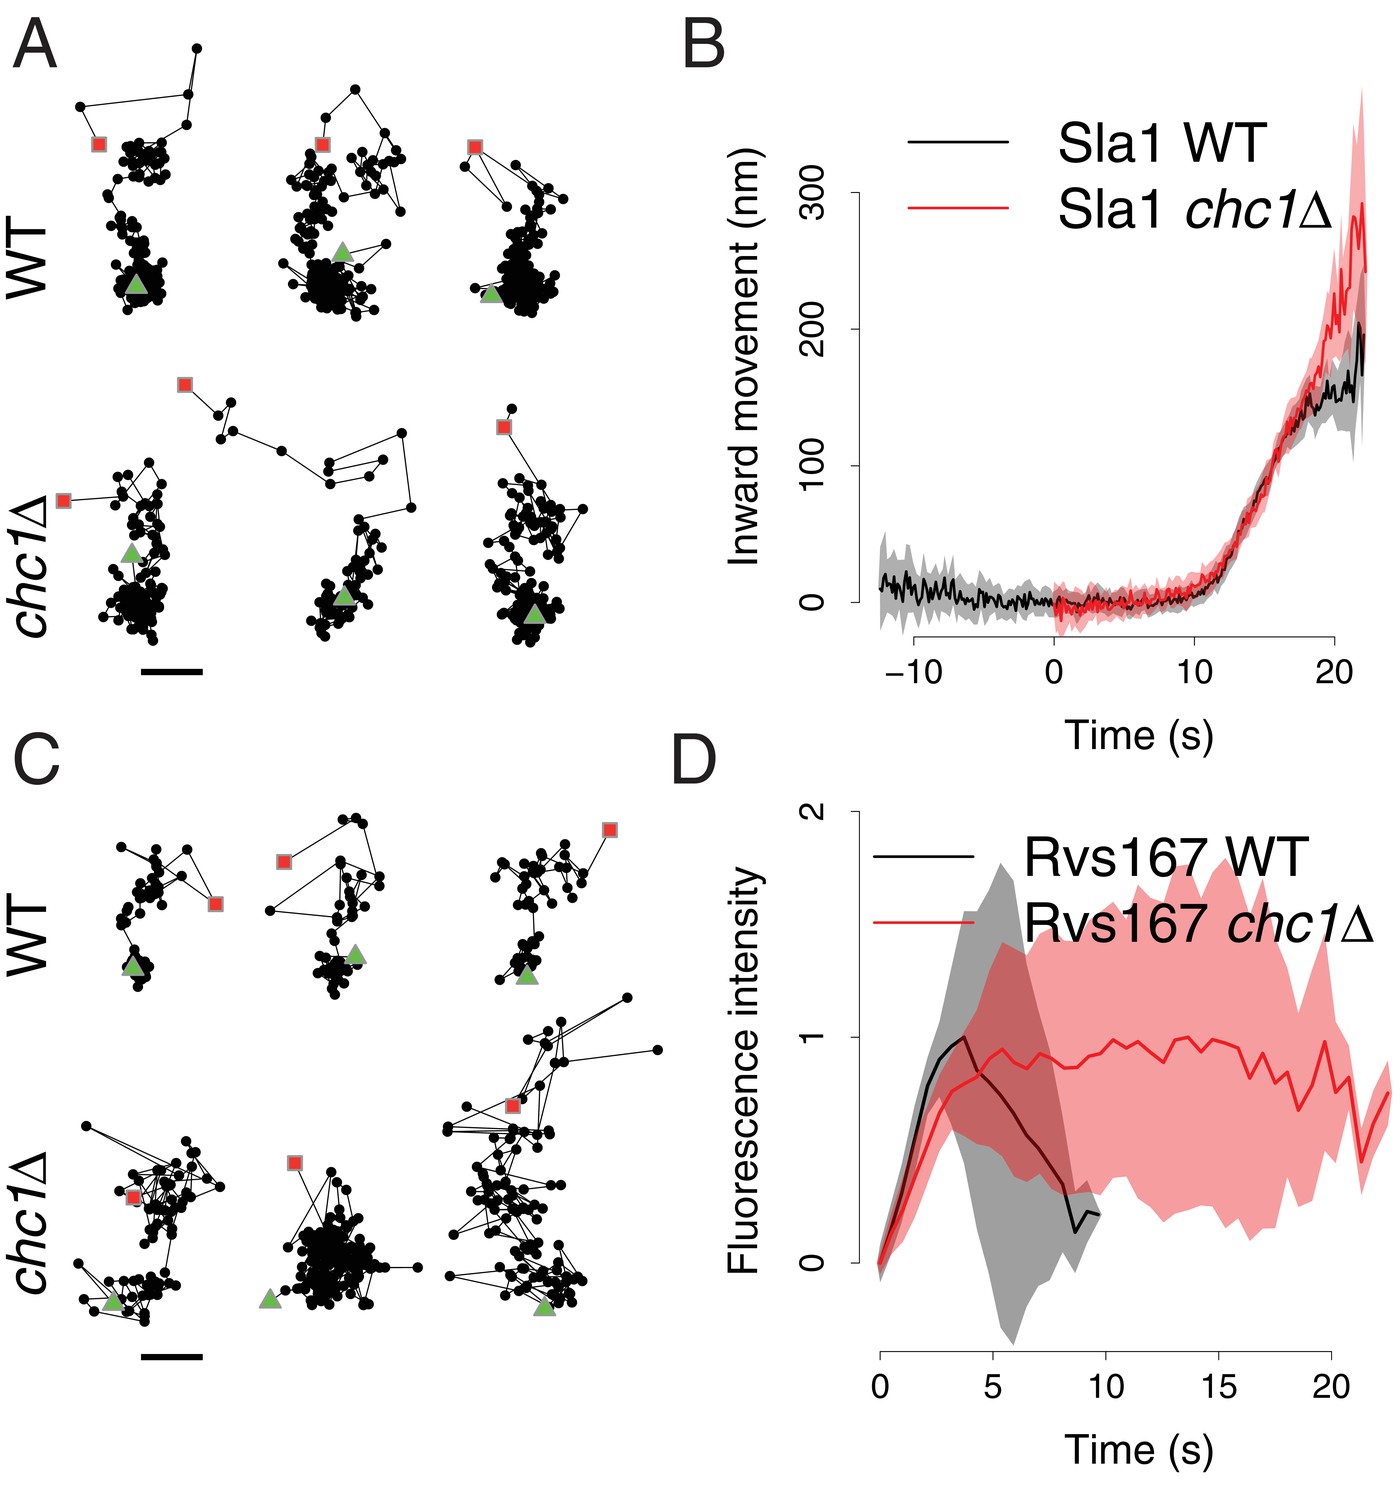
Sla1 and Rvs167 dynamics in chc1Δ cells.
(A) Representative examples of Sla1-GFP trajectories from wild-type (upper row) and chc1Δ cells (lower row). Green triangles and red squares mark start and end points of the trajectories, respectively. Scale bar is 100 nm. (B) Average Sla1-GFP inward movement over time, in wild-type cells (black line, n = 50 trajectories) and chc1Δ (red line, n = 41 trajectories). Shadings indicate the 95% confidence interval. (C) Representative examples of Rvs167-GFP trajectories from wild-type (Picco et al., 2015) (upper row) and chc1Δ cells (lower row). Green triangles and red squares mark start and end points of the trajectories, respectively. Scale bar is 100 nm. (D) Average Rvs167-GFP fluorescence intensity over time, in chc1Δ (red line, n = 56 trajectories) and wild-type cells (black line, n = 54 trajectories). Fluorescence intensity profiles have been normalized between 0, which corresponds to their minimum in intensity, and 1, which corresponds to their maximum in intensity. Shadings indicate the standard deviations from the mean.
Figure 1—figure supplement 1
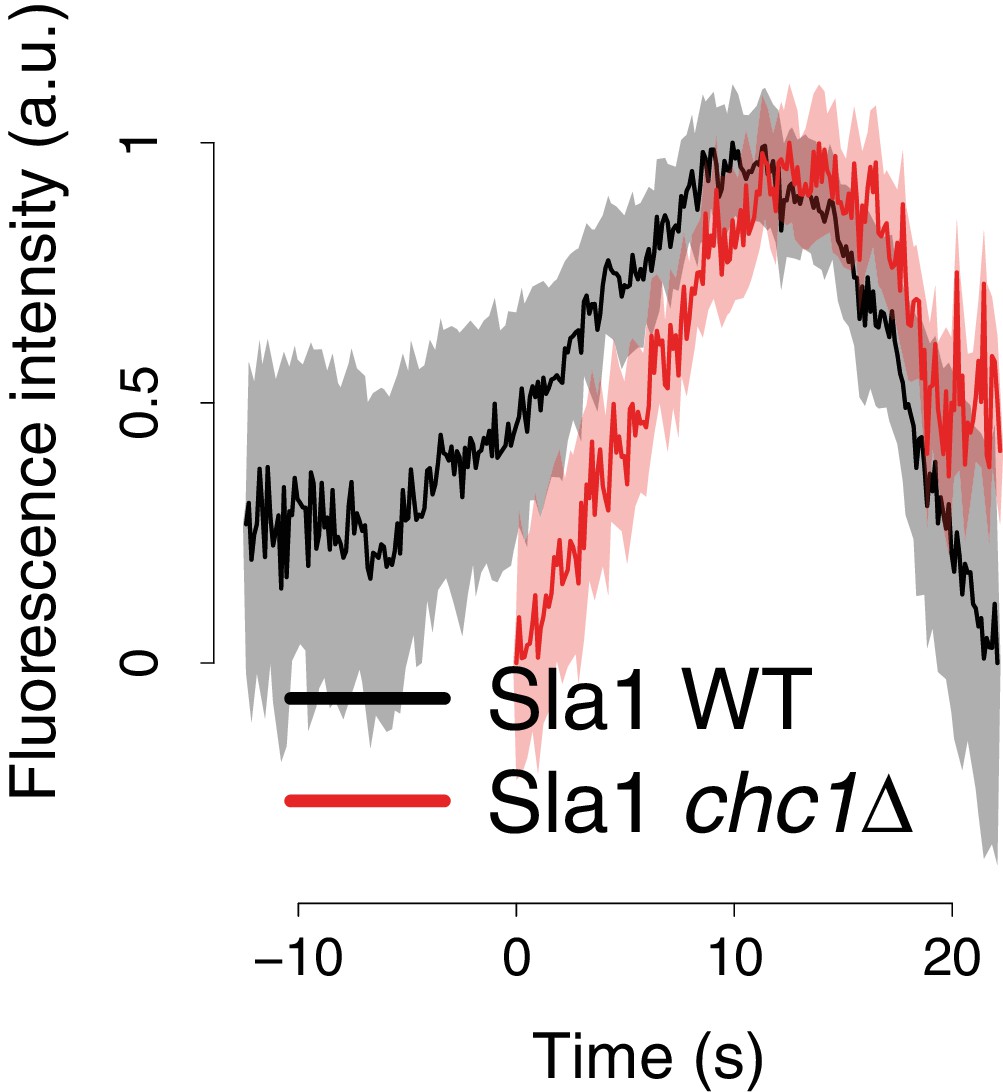
Sla1-GFP fluorescence intensity in chc1Δ cells.
Average Sla1-GFP fluorescence intensity over time, in wild-type cells (black line), and chc1Δ (red line). Fluorescence intensity profiles have been normalized between 0, which corresponds to their minimum in intensity, and 1, which corresponds to their maximum in intensity. The average fluorescence intensity curves are aligned in time like the average trajectories shown in Figure 1B. Shadings indicate the 95% confidence interval.
Figure 2 with 1 supplement
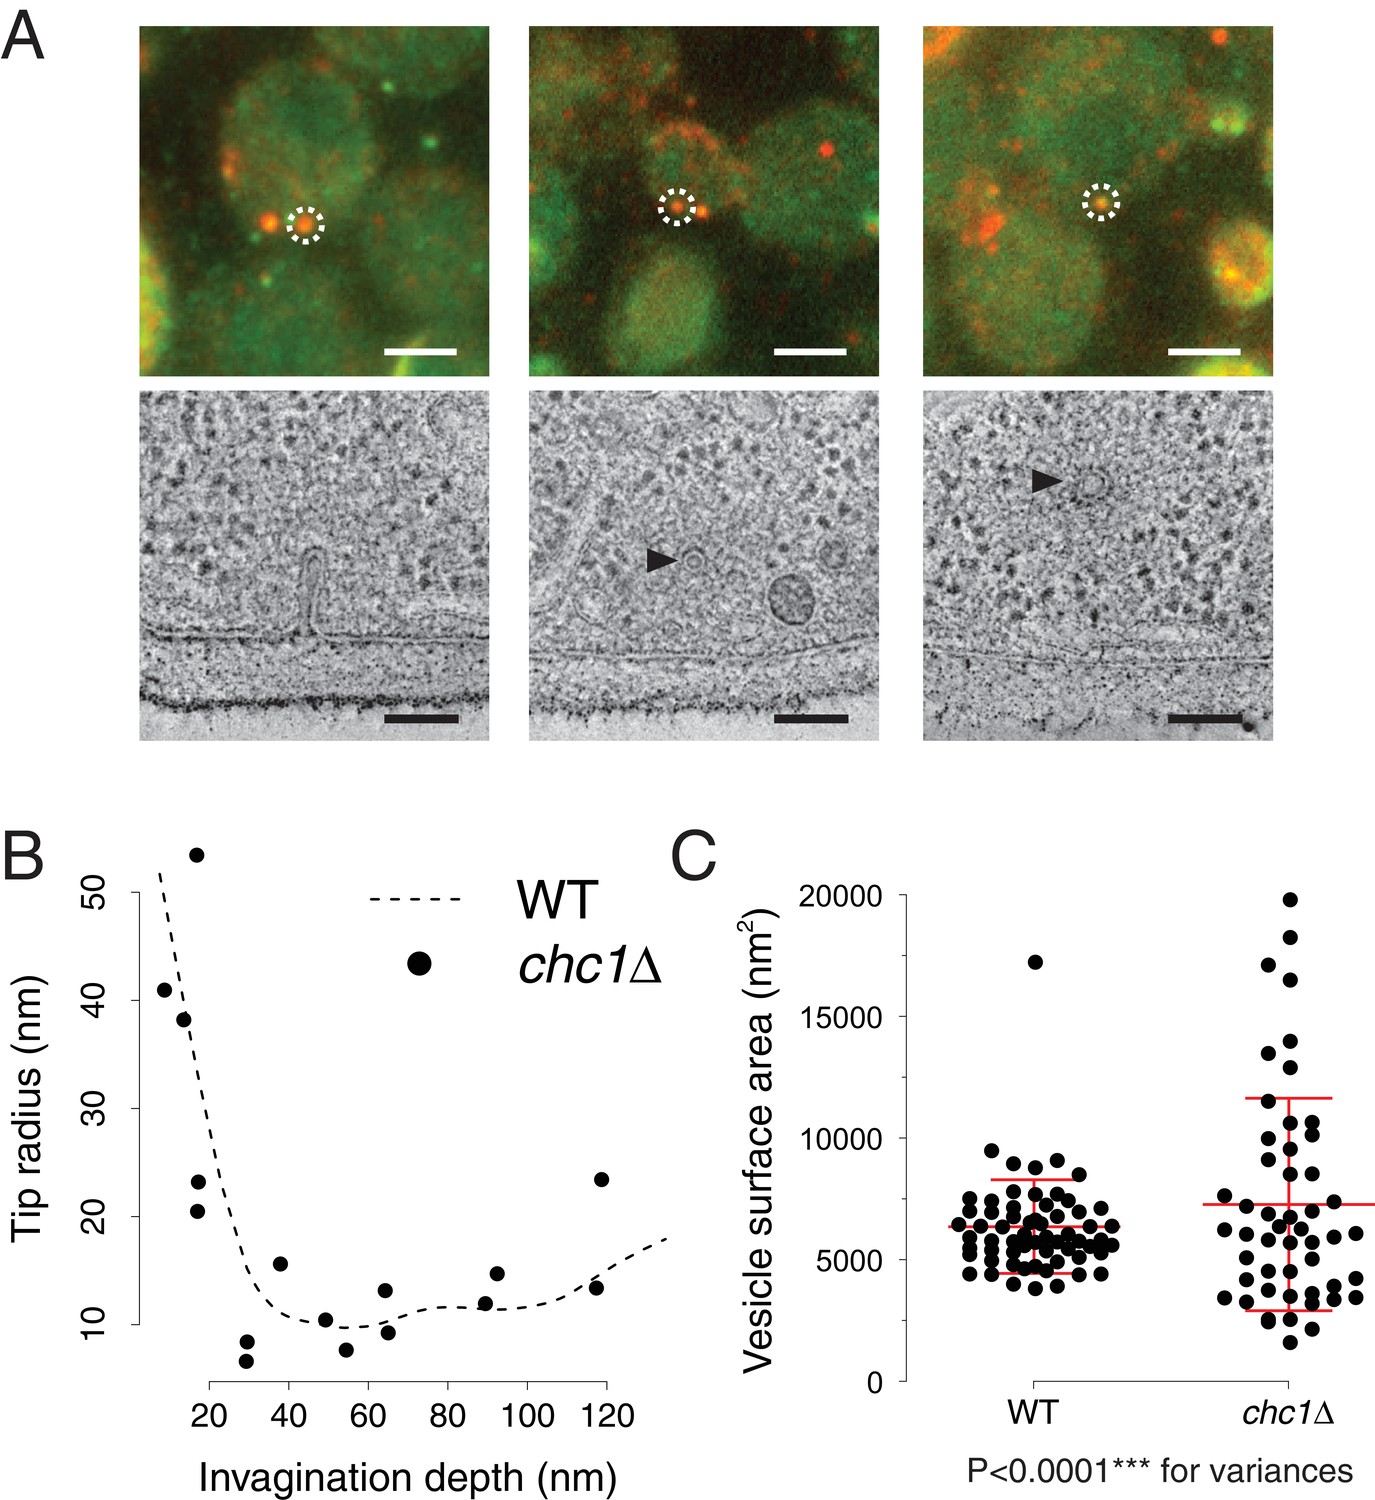
Endocytic membrane morphologies in chc1Δ cells.
(A) Correlative fluorescence and electron microscopy of chc1Δ yeast cells expressing Sla1-GFP, Abp1-mCherry. Three examples of membrane ultrastructures underlying sites of Sla1 and Abp1 colocalization. Upper panel shows overlays of RFP and GFP channel images, lower panel images are virtual slices through electron tomograms, acquired at positions corresponding to the fluorescent spots marked by the white dashed circles. Black arrowheads indicate endocytic vesicles. Scale bars are 2 µm in the upper panel, 100 nm in the lower panel. (B) Curvature of invagination tips identified by correlative microscopy in chc1Δ, plotted against the invagination depths. The dashed line is a cubic smoothing spline fitted to the data points of wild-type invagination tip curvatures, published in (Kukulski et al., 2012a). (C) Surface areas of vesicles identified by correlative microscopy in chc1Δ and compared to wild-type cells (Kukulski et al., 2012a). Red central line represents the mean, upper and lower red lines represent standard deviations.
Figure 2—figure supplement 1
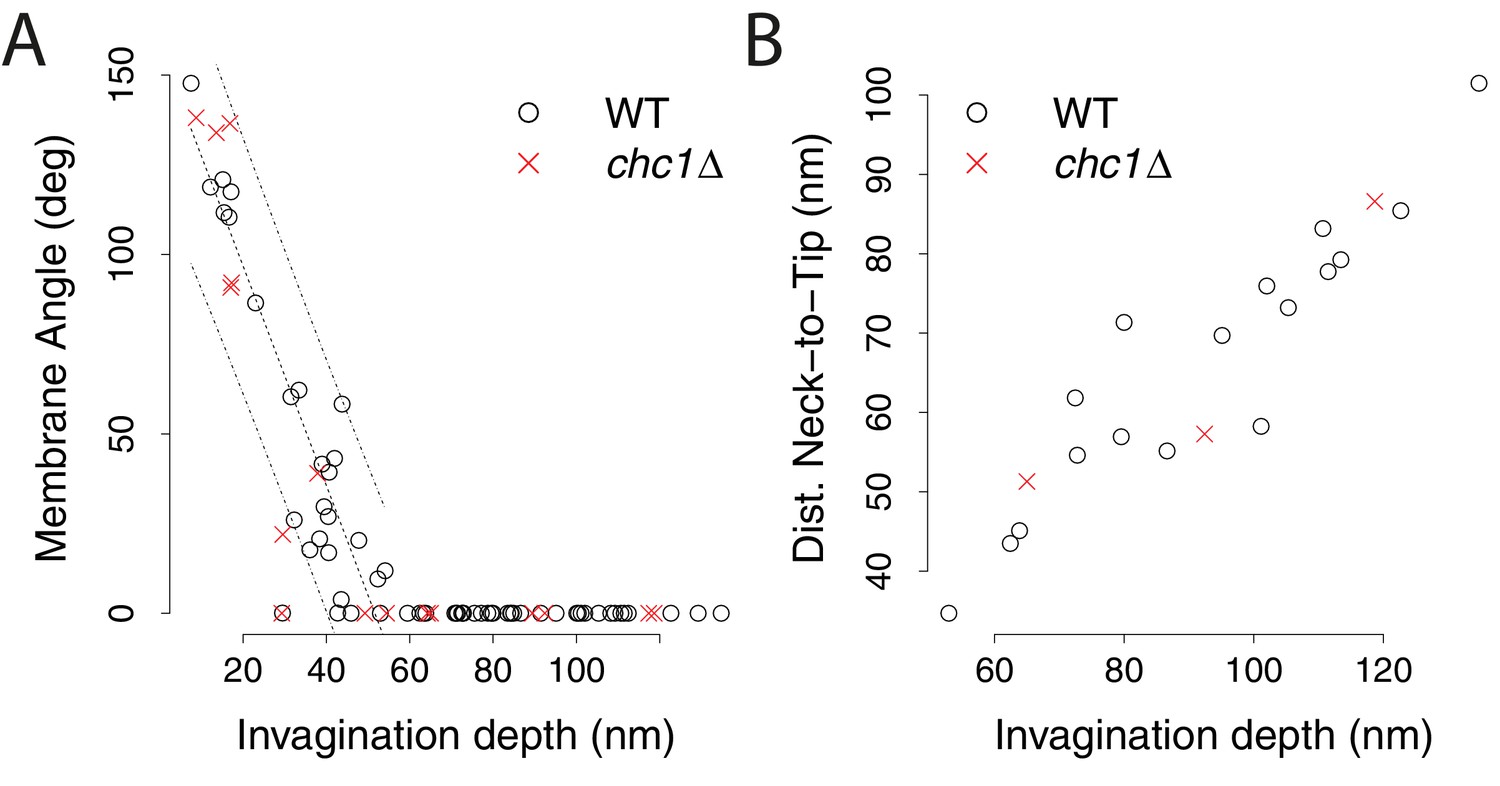
Membrane shape parameters in chc1Δ cells.
(A) Appearance of tubular segments. The angles between the two sides of invagination membrane profiles are plotted against invagination depth. When the angle reaches zero degrees, the invagination consists of a tubular segment. Wild-type data points are from (Kukulski et al., 2012a). The dashed lines show the regression line describing the wild-type data and its prediction band (95% prediction interval), calculated based on invaginations with a membrane angle >0. The difference between the wild-type and chc1Δ data points is not significant (p value > 0.1). (B) Position of the neck along the invagination. Only invaginations with a width that corresponds to less than 80% of the tip diameter are considered to have a neck. The distance of the neck to the invagination tip is plotted against invagination depth. Wild-type data points are from (Kukulski et al., 2012a). The percentage of invaginations with neck (19% of all chc1Δ invaginations have a neck) is similar to wild-type cells (27% of all wild-type invaginations have a neck).
Download links
A two-part list of links to download the article, or parts of the article, in various formats.
Downloads (link to download the article as PDF)
Open citations (links to open the citations from this article in various online reference manager services)
Cite this article (links to download the citations from this article in formats compatible with various reference manager tools)
Clathrin modulates vesicle scission, but not invagination shape, in yeast endocytosis
eLife 5:e16036.
https://doi.org/10.7554/eLife.16036


