Loss of Frataxin induces iron toxicity, sphingolipid synthesis, and Pdk1/Mef2 activation, leading to neurodegeneration
- Baylor College of Medicine, United States
- Howard Hughes Medical Institute, Baylor College of Medicine, United States
- Texas Children’s Hospital, United States
Figures
Figure 1 with 2 supplements
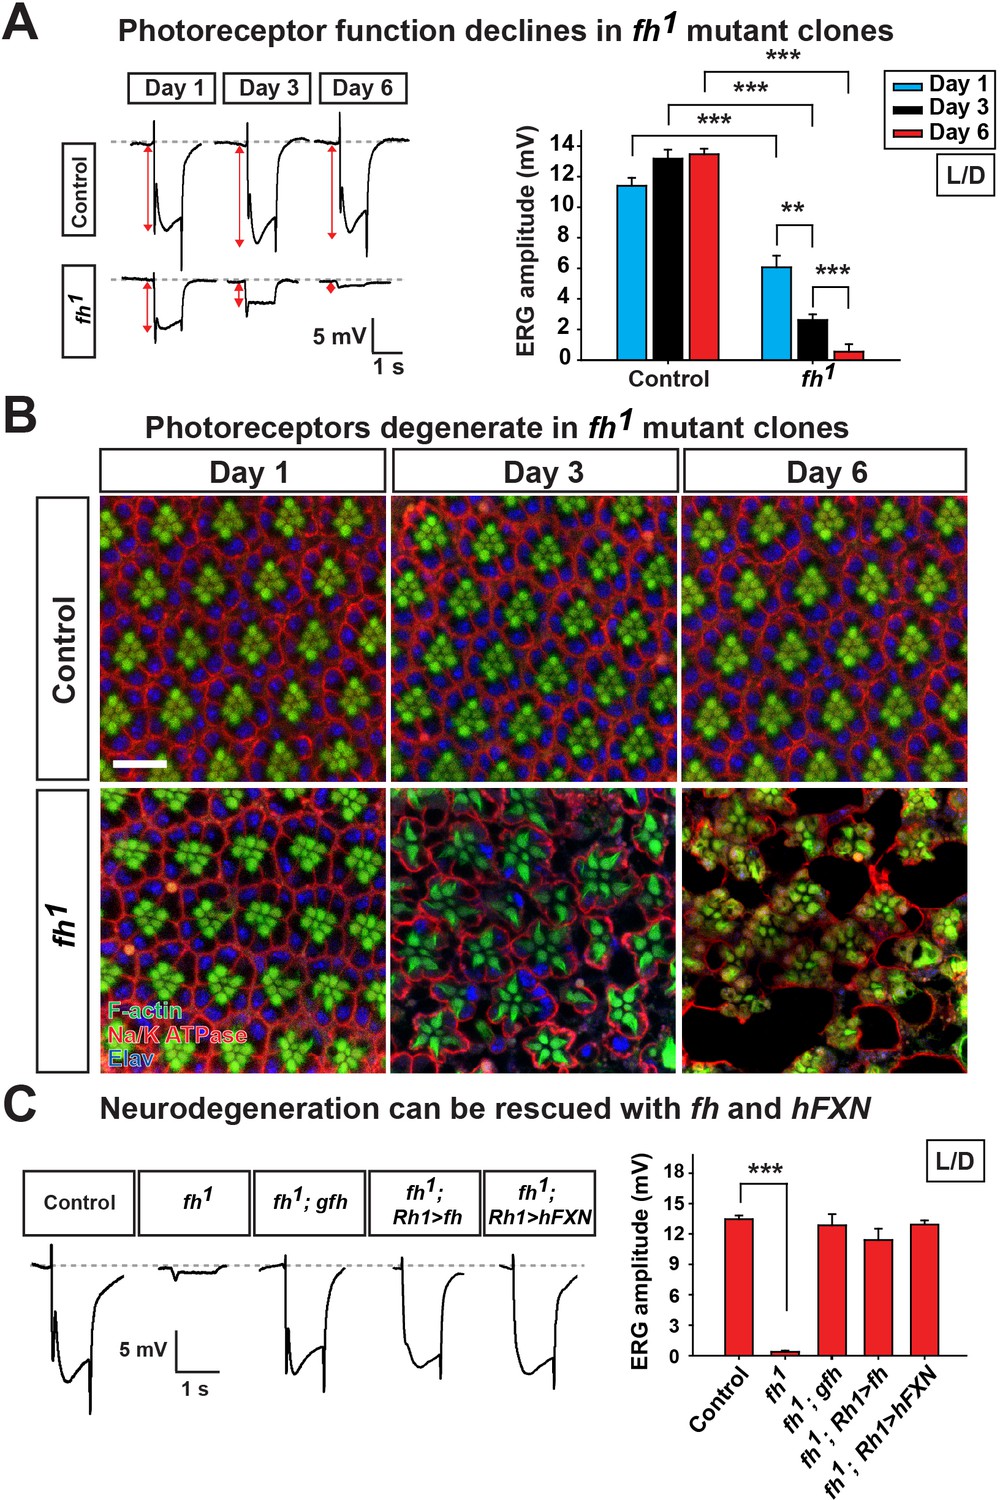
Loss of fh results in age dependent neurodegeneration in photoreceptors.
(A) ERG of control (y w FRT19A) and fh (y w fh FRT19A) mosaic eyes. The ERG amplitudes from Day 1 to Day 6 are indicated by red double arrows. Quantification of the ERG amplitudes of control (y w FRT19A) and fh (y w fh FRT19A) is on the right. (B) Retina morphology of control (y w FRT19A) and fh mosaic eyes. Rhabdomeres are labeled by phalloidin (green), whereas anti-Na/K ATPase antibody (red) marks the photoreceptor membranes. Neuronal nuclei are labeled by anti-Elav antibody (blue). Scale bar: 10 µm. (C) ERG of control (y w FRT19A), fh mutants, fh mutants carrying a genomic fh construct (fh; gfh), and fh mutants that express the fh cDNA (fh; Rh1>fh) or human FXN cDNA (fh; Rh1>hFXN) in photoreceptors using a Rh1-GAL4 driver. The ERG amplitudes were recorded at Day 6. Data are presented as mean ± SEM. **p<0.01, ***p<0.001, Student’s t-test. L/D, flies are raised in 12 hr light and dark cycle.
Figure 1—figure supplement 1
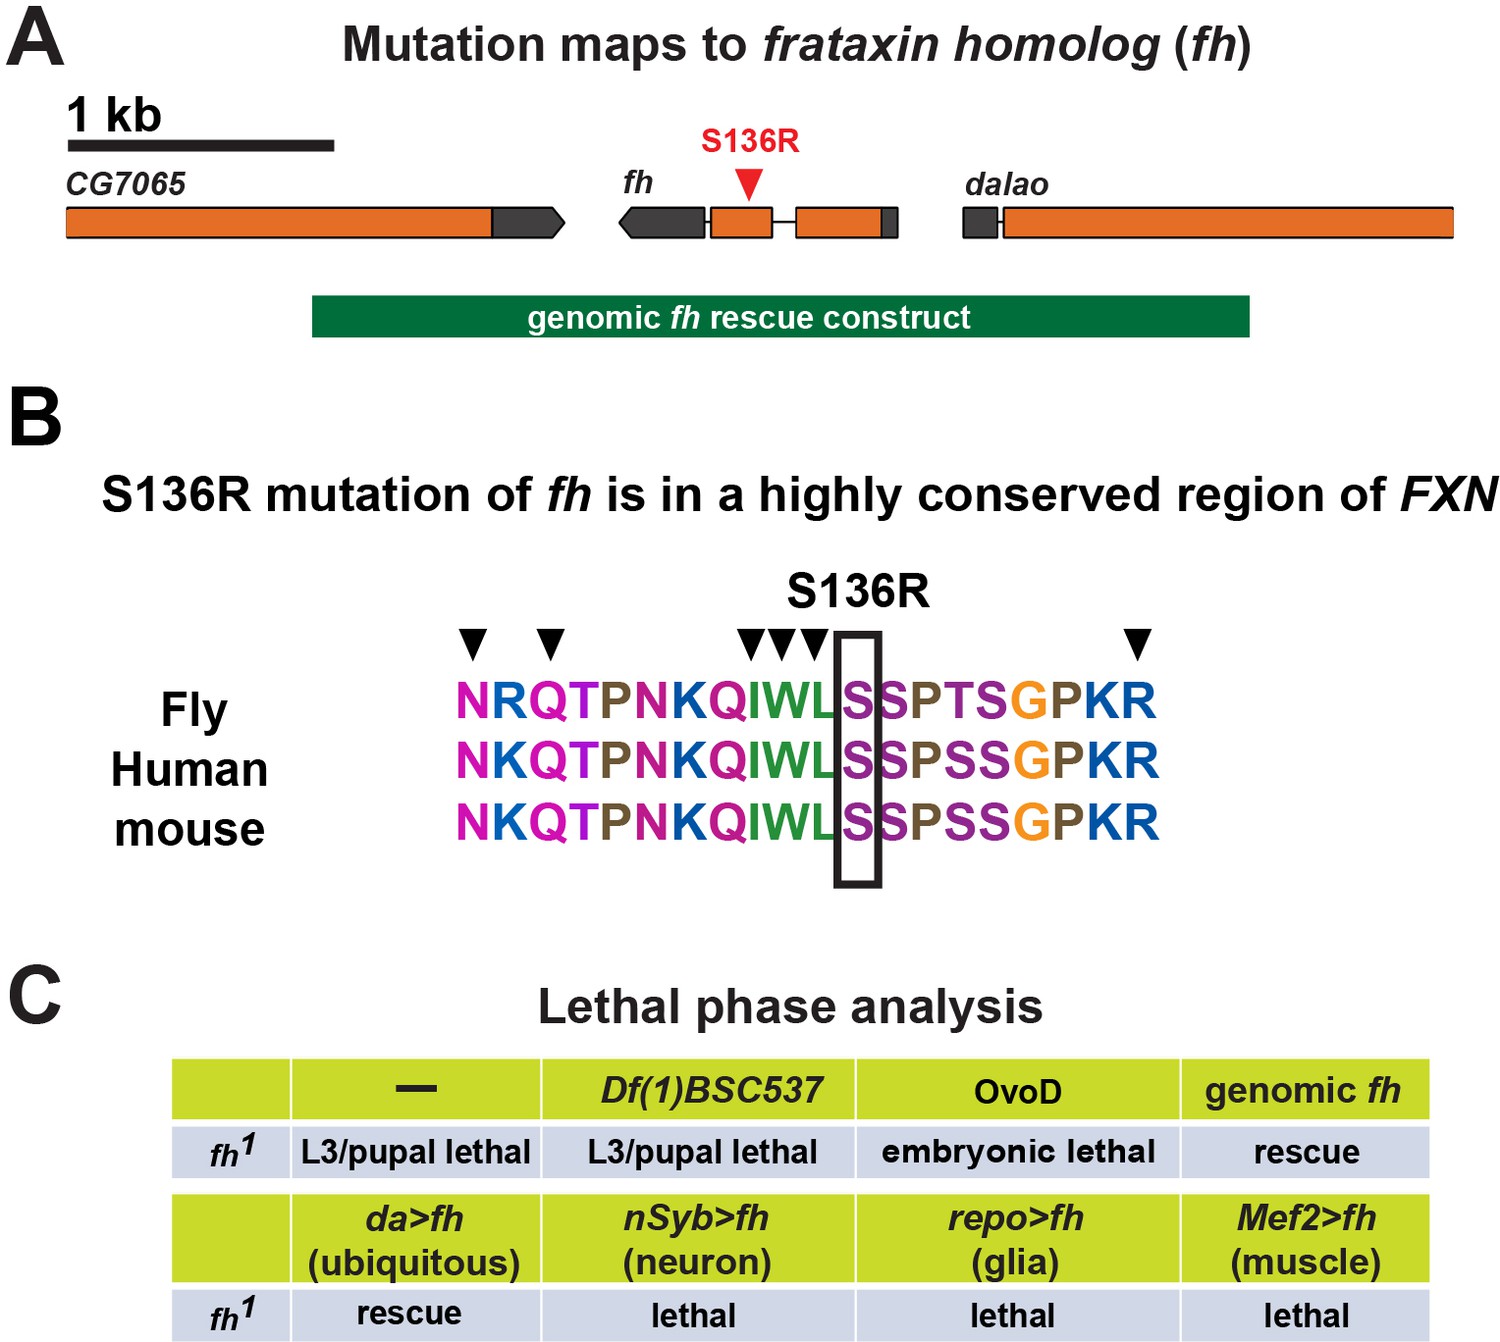
Mutation and lethal phase analysis of fh mutants.
(A) Molecular lesion of fh mutants. A 3.4 kb genomic rescue construct is shown below the gene. (B) FXN sequences alignment between fly, human, and mouse. Mutation S136R identified in fh mutants is indicated by a box. Black arrow heads indicate the point mutations identified in the FRDA patients. (C) Lethal phase analysis of fh mutants. The lethality can be rescued by a genomic fh construct, or expressing fh cDNA by the ubiquitous driver daughterless-GAL4. Overexpression of fh cDNA in a tissue specific manner cannot rescue lethality. Finally, removing maternal Fh proteins in the female germ line by using OvoD (Perrimon and Gans, 1983) leads to embryonic to early L1 lethality.
Figure 1—figure supplement 2
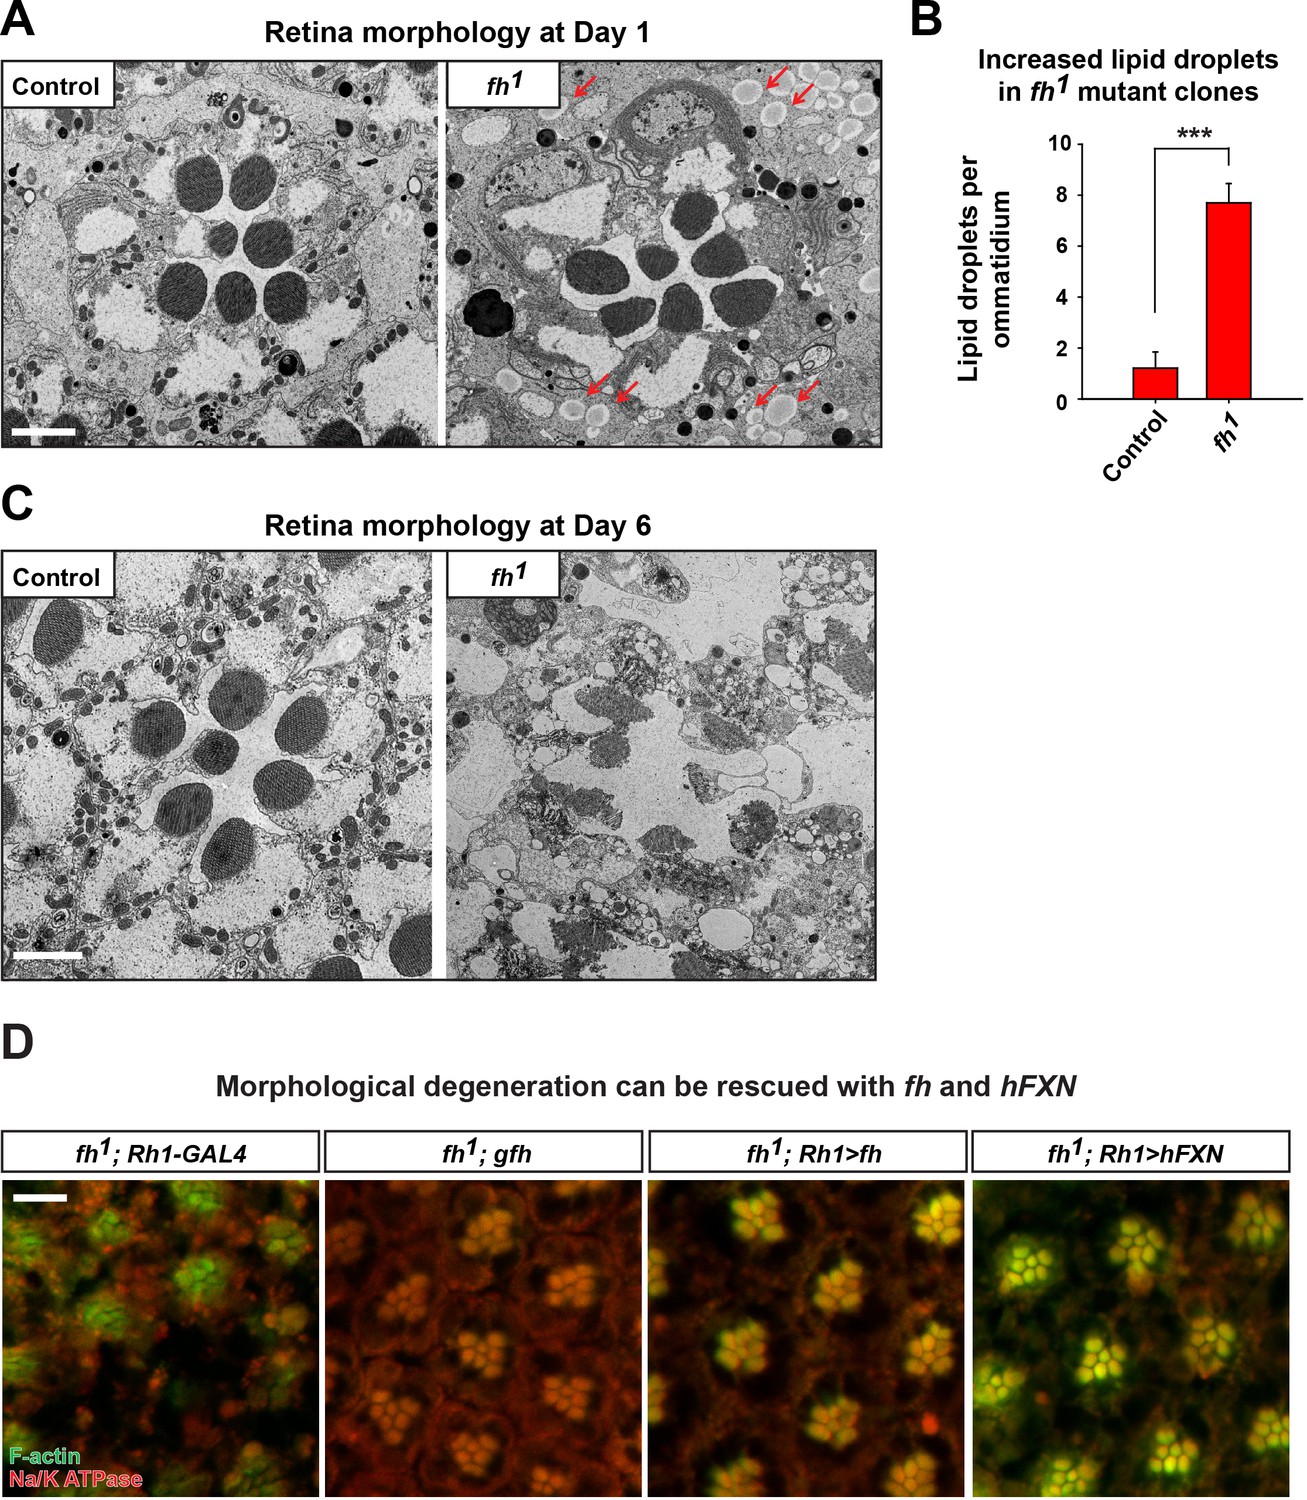
Ultrastructure of adult eyes exhibits morphological defects in fh mutant clones.
(A) Transmission electron microscopy (TEM) images of retina morphology in control (y w FRT19A) and fh mutant clones at Day 1. Lipid droplets are indicated by red arrow. Scale bar: 2 µm. (B) Quantification of lipid droplet in Day 1 retina of control (y w FRT19A) and fh mutants. n = 6. (C) Retina morphology in control (y w FRT19A) and fh mutant clones at Day 6. Scale bar: 2 µm. (D) Retina morphology of fh mutants (fh; Rh1-Gal4), fh mutants carrying a genomic fh construct (fh; gfh), and fh mutants that express the fh cDNA (fh; Rh1>fh) or human FXN cDNA (fh; Rh1>hFXN). Rhabdomeres are labeled by phalloidin (green), whereas anti-Na/K ATPase antibody (red) marks the photoreceptor membranes. The red eye marker (w+) of Rh1-GAL4 creates autofluorescence background that makes imaging difficult. Scale bar: 10 µm. Data are presented as mean ± SEM. ***p<0.001, Student’s t-test.
Figure 2 with 2 supplements
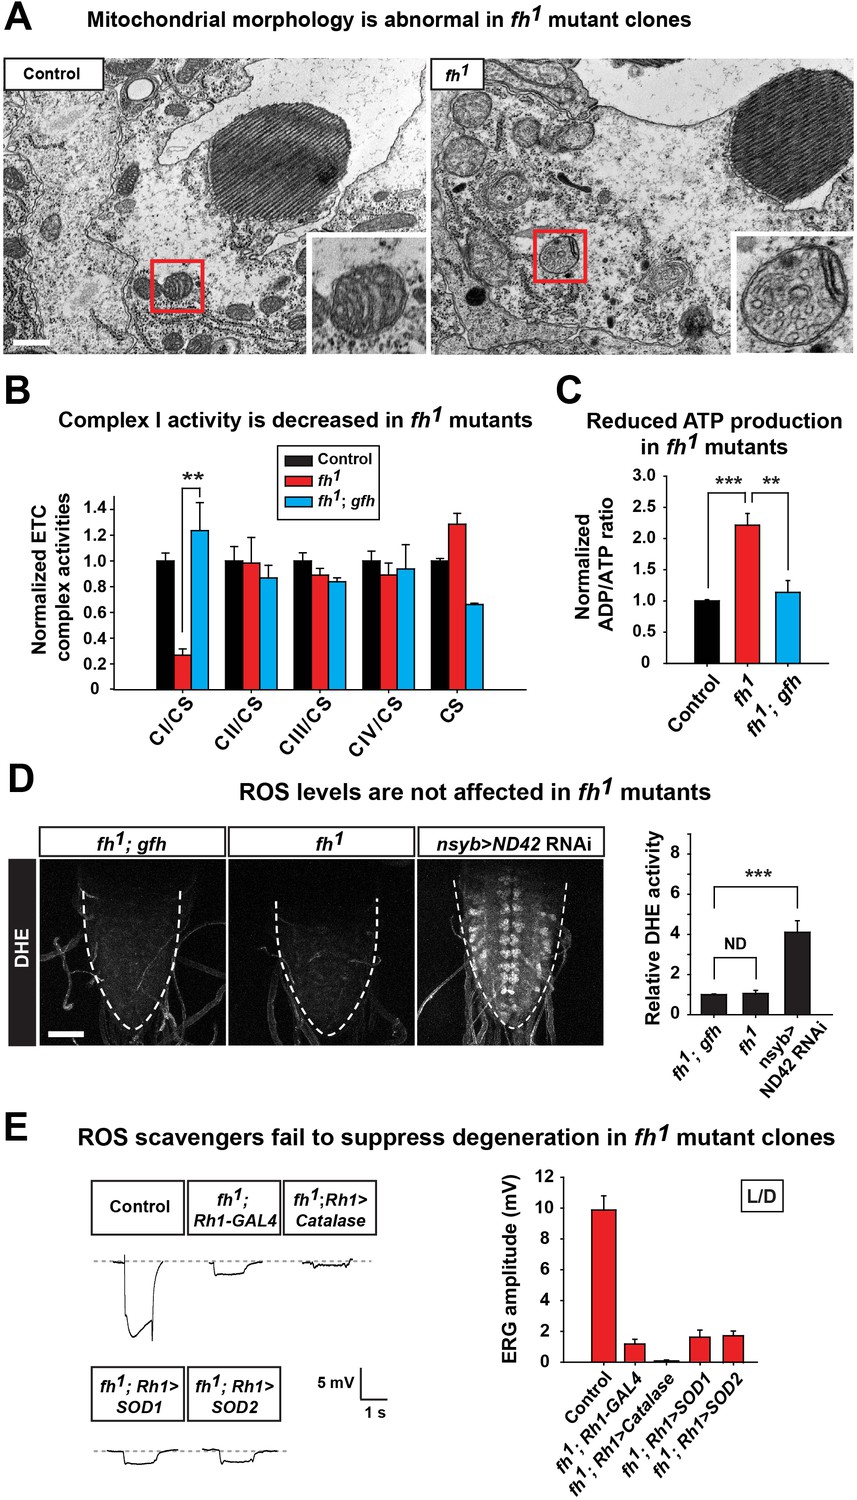
Loss of fh causes impaired mitochondria, and reducing ROS levels fails to suppress degeneration in fh mutants.
(A) TEM images of mitochondria in photoreceptors of control (y w FRT19A) and fh mutant clones. The insets show a single mitochondrion (red box). Scale bar: 500 nm. (B) ETC complex activities in control (y w FRT19A), fh mutant, and genomic rescued animal (fh; gfh). Complex activities are normalized to citrate synthase (CS), which act as a control of mitochondrial mass. n = 3. (C) ADP/ATP ratio in control (y w FRT19A), fh mutant, and rescued animal (fh; gfh). n = 3. (D) ROS levels are measured by DHE in the larval ventral nerve cord. Neuronal down-regulation of ND42 (nSyb>ND42 RNAi), a subunit of CI, acts as a positive control. Quantification of DHE fluorescence is on the right. n = 8. Scale bar: 50 µm. (E) Day 3 ERG of control (y w FRT19A; Rh1-GAL4) and fh mutants in which ROS scavengers are overexpressed in photoreceptors. Data are presented as mean ± SEM. **p<0.01, ***p<0.001, Student’s t-test. ND, no significant difference. L/D, flies are raised in 12 hr light and dark cycle.
Figure 2—figure supplement 1
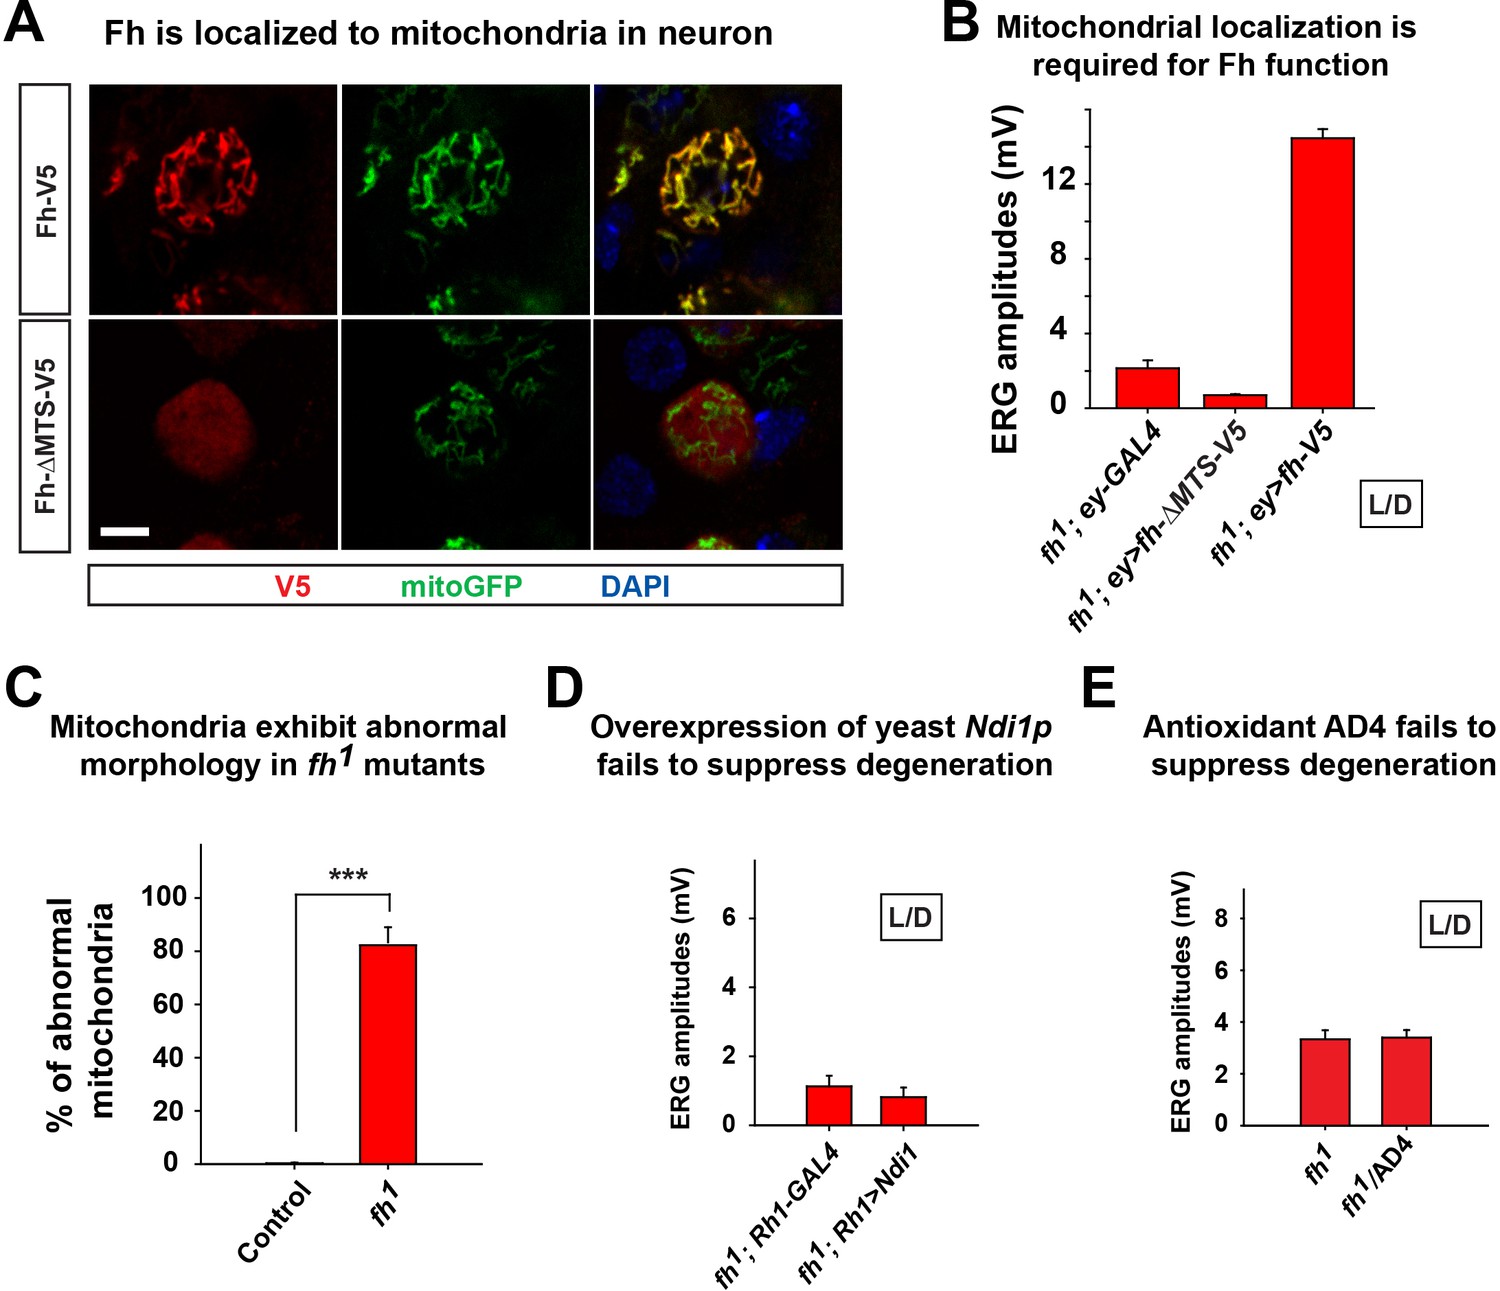
Mitochondrial phenotype of fh mutants.
(A) The immunostaining of larval motor neuron cell body with expression of fh or fh without the mitochondrial targeting sequence (MTS) (Fh-∆MTS). Fh and Fh-∆MTS are labeled by V5 (red), and mitochondria are labeled by mitoGFP (green). The nuclei are marked by DAPI (blue). Scale bar: 5 µm. (B) Quantification of ERG amplitudes of fh mutants with different cDNA constructs at Day 3. (C) Quantification of abnormal mitochondria in photoreceptor in TEM image. n = 6. (D) Day 6 ERG of fh mutants (fh; Rh1-GAL4) in which yeast Ndi1p are overexpressed in photoreceptors. (E) Quantification of ERG amplitudes of fh mutants at Day 3. Treating fh mutants with an antioxidant drug AD4 with 40 μg/ml concentration does not suppress degeneration. Data are presented as mean ± SEM. ***p<0.001, Student’s t-test. L/D, flies are raised in 12 hr light and dark cycle.
Figure 2—figure supplement 2
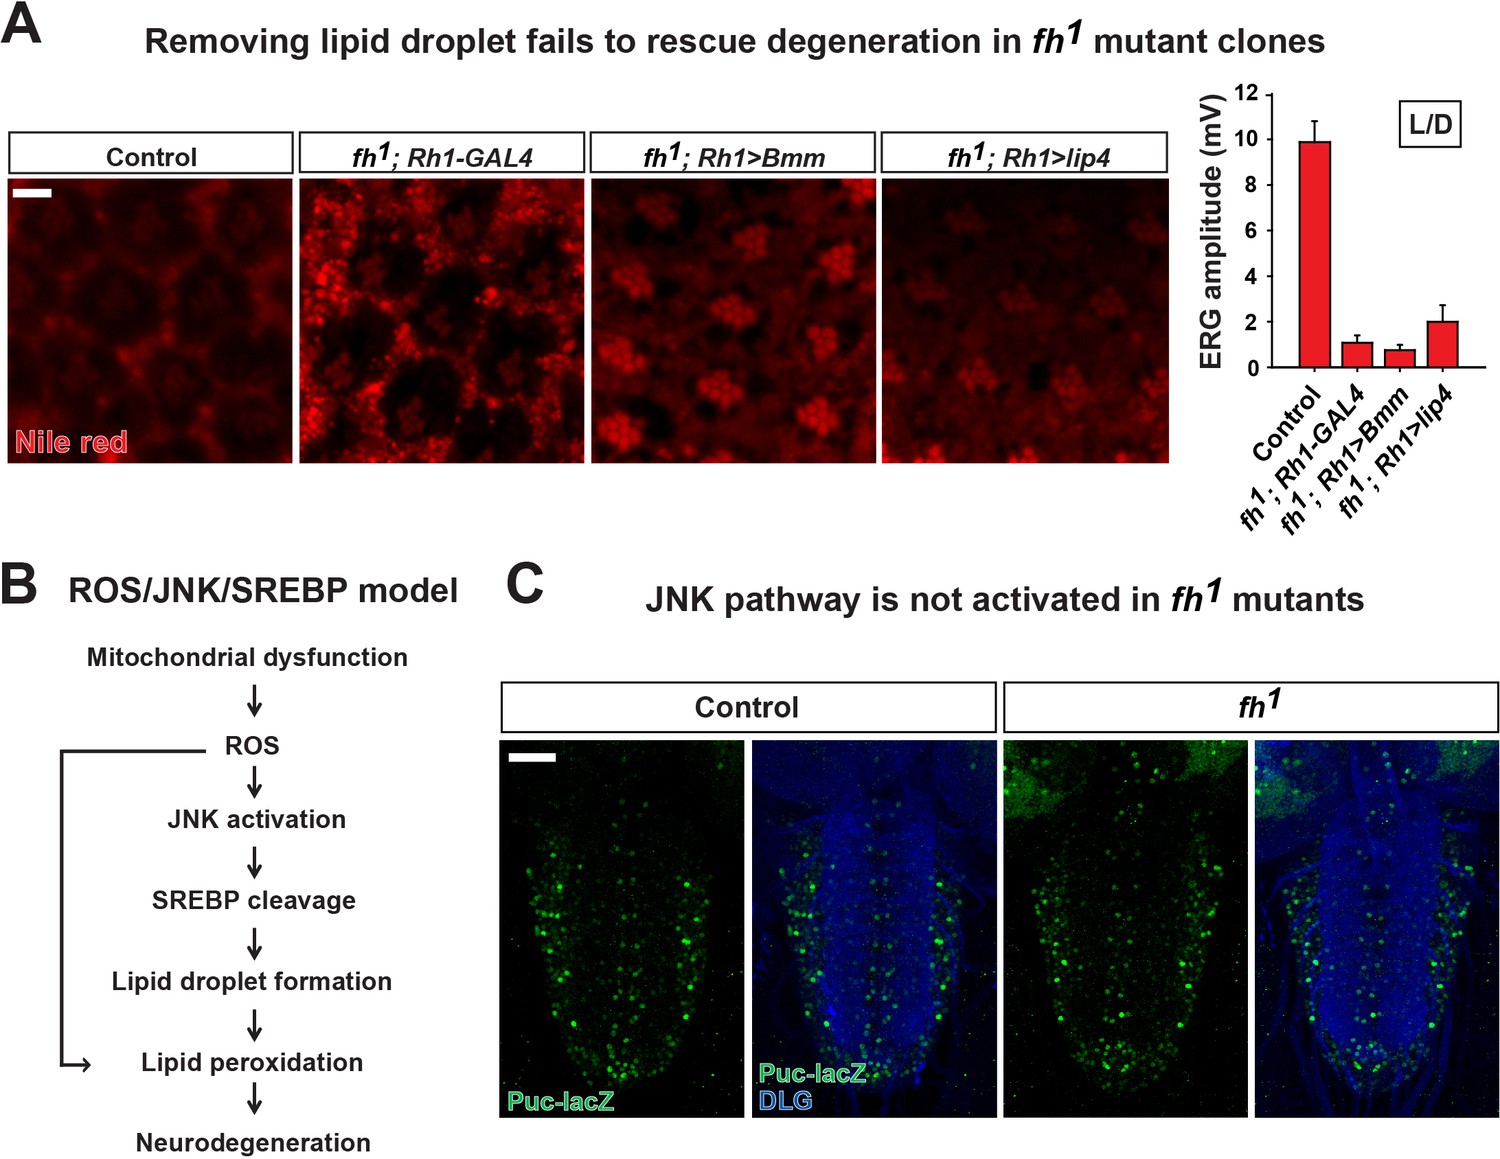
ROS/JNK/SREBP pathway does not contribute to degeneration in fh mutants.
(A) Nile red staining of control (y w FRT19A; Rh1-GAL4) and fh mutants that overexpress lipases. Quantification of ERG amplitudes at Day 3 is on the right. Scale bar: 5 µm. (B) ROS/JNK/SREBP pathway causes accumulation of lipid droplets and degeneration in other mitochondrial mutants (Liu et al., 2015). (C) The levels of puc-lacZ (green) in the larval ventral nerve cord of control (y w FRT19A) and fh mutants. Neuronal membrane is marked by anti-DLG antibody (blue). Scale bar: 40 µm. Data are presented as mean ± SEM.
Figure 3 with 1 supplement
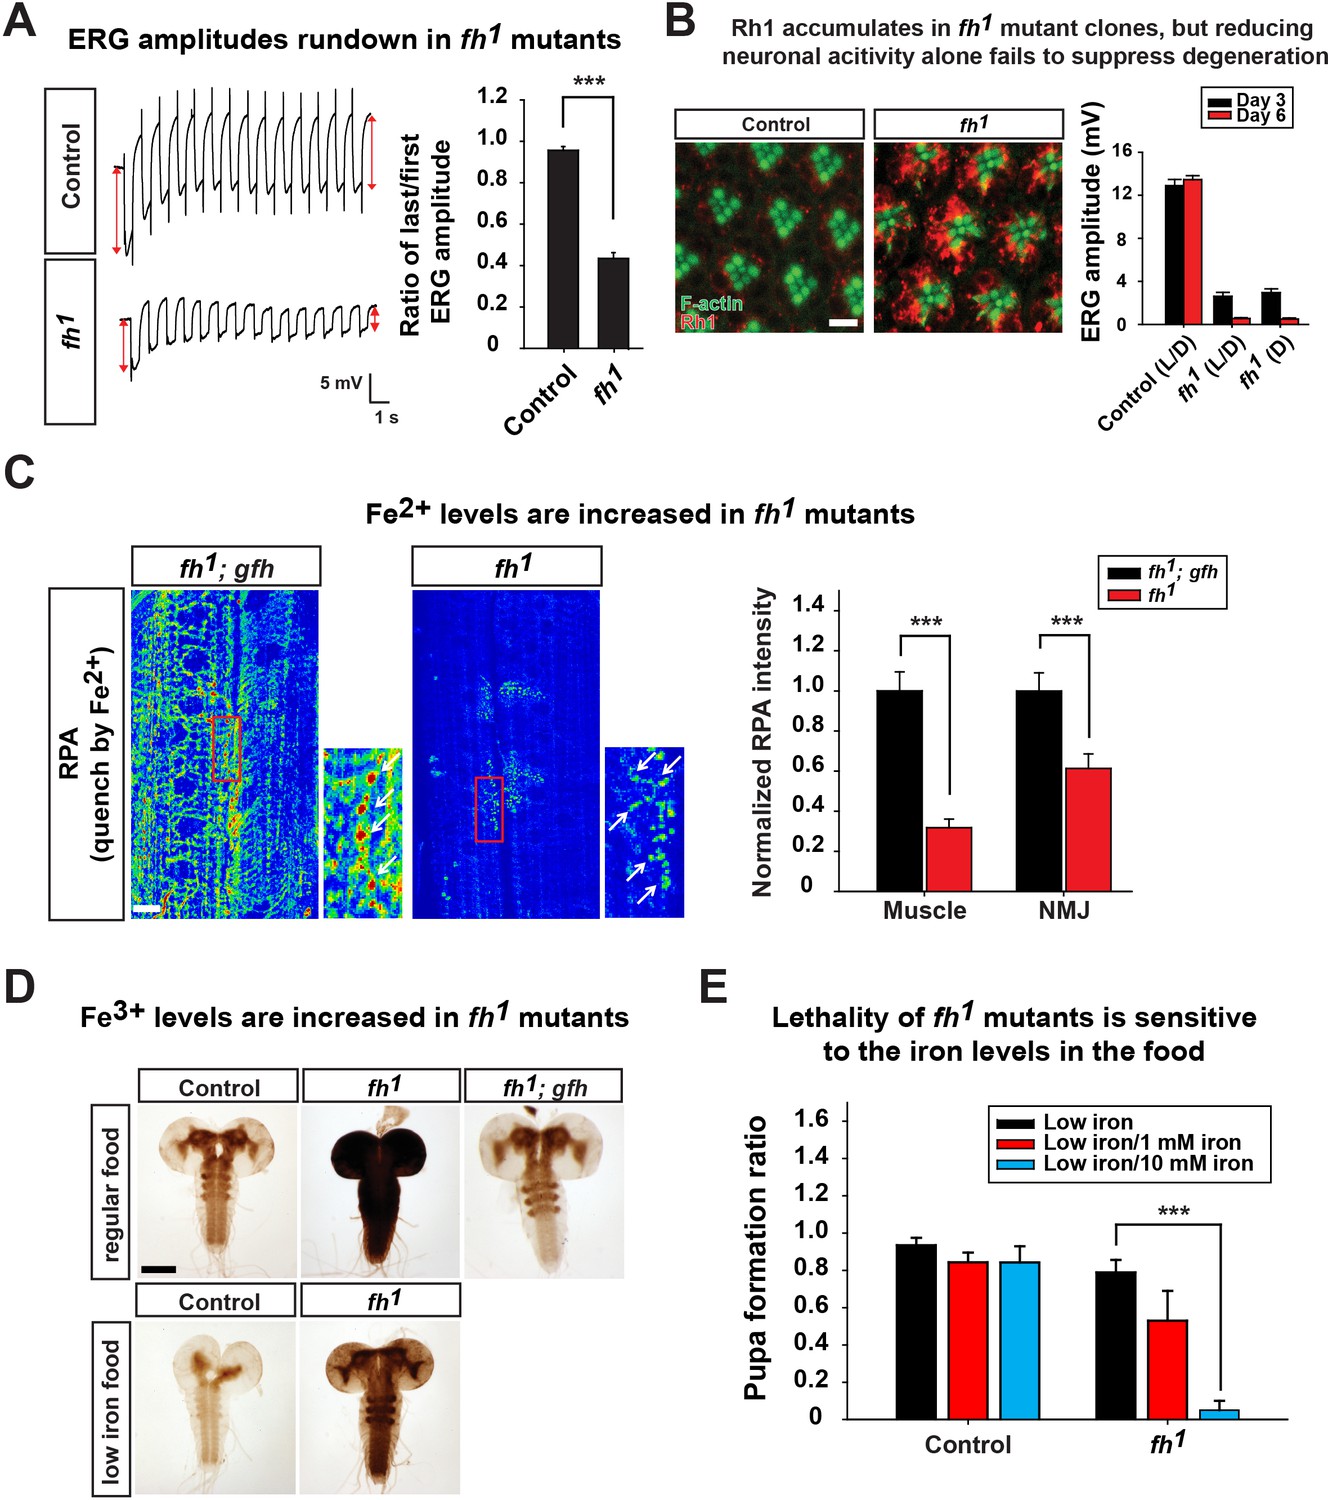
Loss of fh causes Rh1 accumulation and iron deposit.
(A) ERG traces upon repetitive light stimulation in both control (y w FRT19A) and fh mutants. The double red arrows indicate ERG amplitudes of the first and last trace during the stimulation. Quantification of the ratio of last/first ERG amplitude is on the right. (B) Rh1 distribution in control (y w FRT19A) and fh mutant clones after a 12 hr light exposure. Rh1 is labeled in red, and rhabdomeres are labeled in green. Scale bar: 5 µm. Quantification of ERG amplitudes of control (y w FRT19A) and fh mutant clones in different light conditions is on the right. L/D, flies are raised in 12 hr light and dark cycle. D, flies are raised in dark. (C) Fe2+ levels are assessed by RPA in larval muscle and NMJ in fh mutants and rescued animals (fh; gfh). RPA fluorescence is represented as a heat map. The NMJ boutons are indicated by white arrows. Quantification of normalized RPA intensity is on the right. n = 8. Scale bar: 20 µm. (D) Larval brain Perls’/DAB staining of control (y w FRT19A), fh mutants, and rescued animals (fh; gfh) with regular food or low iron food conditions. Scale bar: 100 µm. (E) Percent of animals that develop into pupae in control (y w FRT19A) and fh mutants when animals are raised by low iron food with different iron concentration. n = 3. Data are presented as mean ± SEM. ***p<0.001, Student’s t-test.
Figure 3—figure supplement 1
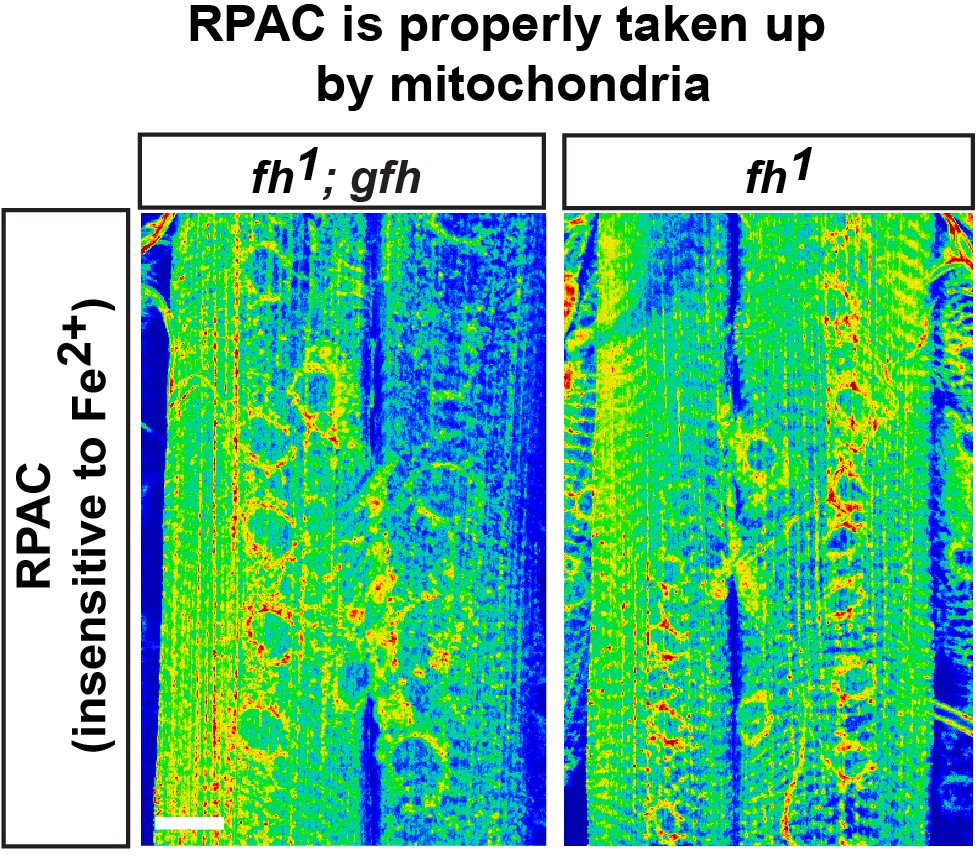
Fe2+ staining control.
RPAC intensity in larva muscle and NMJ of fh mutants and rescued animals (fh; gfh). Scale bar: 25 µm.
Figure 4 with 1 supplement
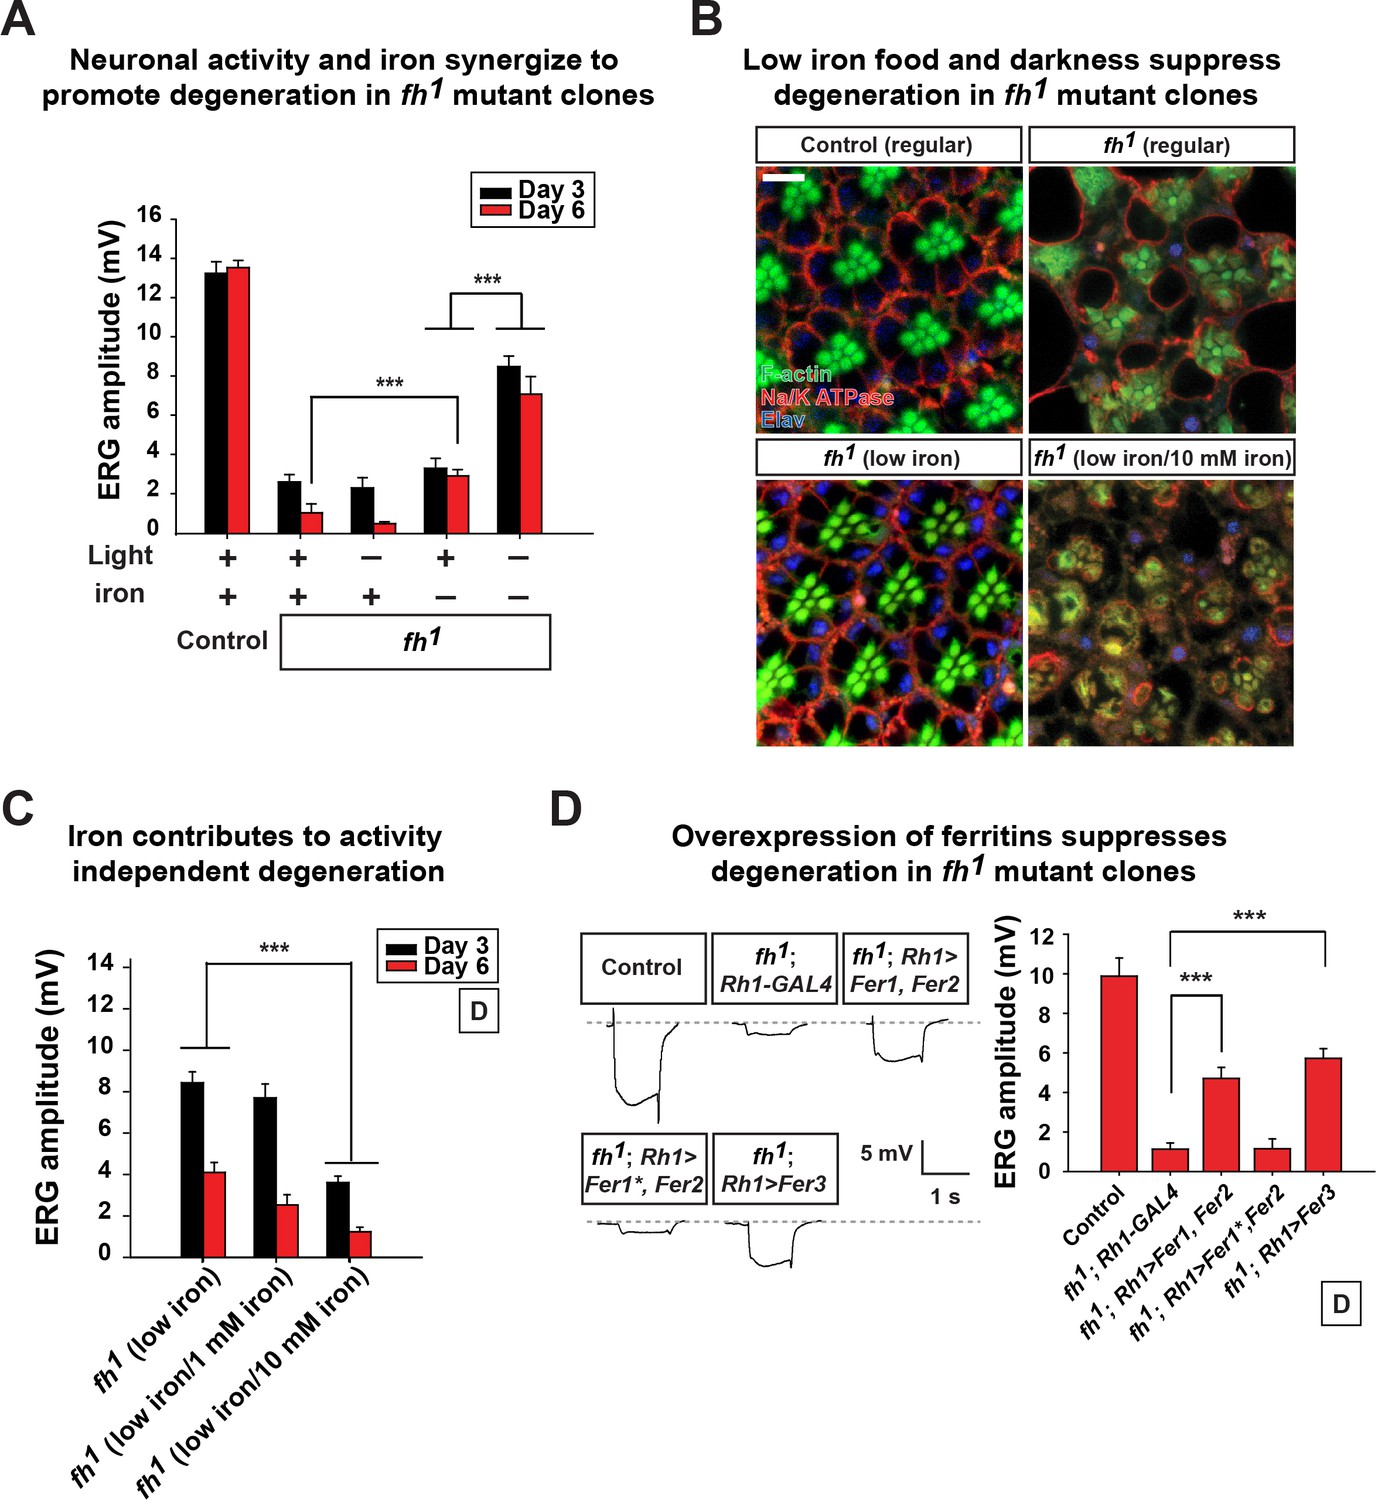
Neuronal activity and iron interact synergistically to contribute to photoreceptor degeneration in fh mutants.
(A) Quantification of ERG amplitudes of control (y w FRT19A) and fh mutants under different light and iron conditions. (B) Retina morphology of control (y w FRT19A) and fh mutants under different food conditions at Day 6. All animals are raised in dark. Regular, flies are raised in regular food. Low iron, flies are raised in low iron food. Scale bar: 5 µm. (C) Quantification of ERG amplitudes of fh mutants in low iron food with different iron concentrations. (D) ERG of control (y w FRT19A; Rh1-GAL4) and fh mutants in which ferritins are overexpressed. Fer1*, enzymatic dead form of Fer1HCH. Data are presented as mean ± SEM. ***p<0.001, Student’s t-test.
Figure 4—figure supplement 1
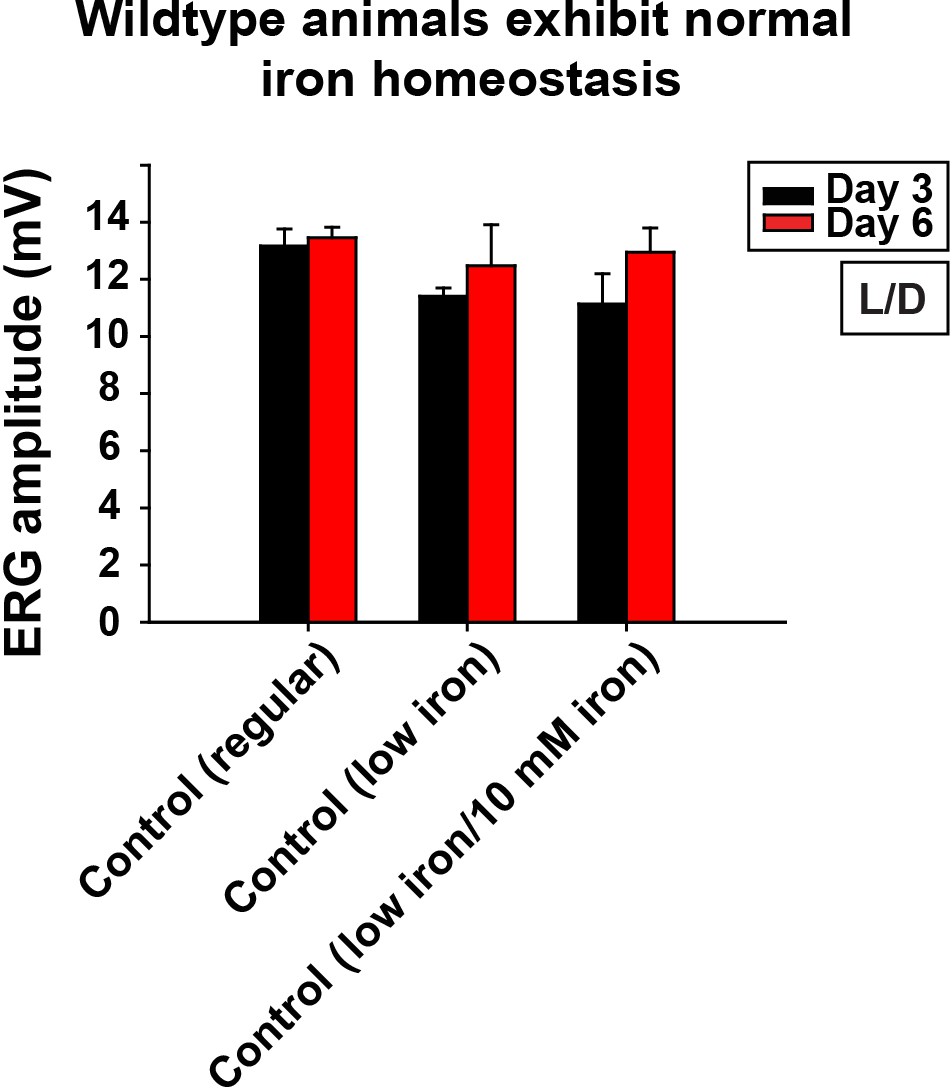
Control of low iron food treatment.
Quantification of ERG amplitudes of control animals (y w FRT19A) in different food and iron conditions. Regular, flies are raised in regular food. Low iron, flies are raised in low iron food. Data are presented as mean ± SEM. L/D, flies are raised in 12 hr light and dark cycle.
Figure 5 with 1 supplement

Increased sphingolipids contribute to degeneration of fh mutants.
(A) Mass spectrometry analysis of sphingolipids in control (y w FRT19A), fh mutants, and rescued animals (fh; gfh). dhsph, dihydrosphingosine; dhCer, dihydroceramide; Cer, ceramide; Sph, sphingosine. n = 2. (B) ERG of control (y w FRT19A; Rh1-GAL4), and fh mutants in which an RNAi against lace is expressed. (C) ERG amplitude and retinal morphology of fh mutants treated with 100 μM myriocin. Scale bar: 5 µm. (D) Quantification of Day 3 ERG amplitudes of fh mutants with low iron food and myriocin treatments. Data are presented as mean ± SEM. The error bars represent the range of data in (A). **p<0.01, ***p<0.001, Student’s t-test. D, flies are raised in dark.
Figure 5—figure supplement 1
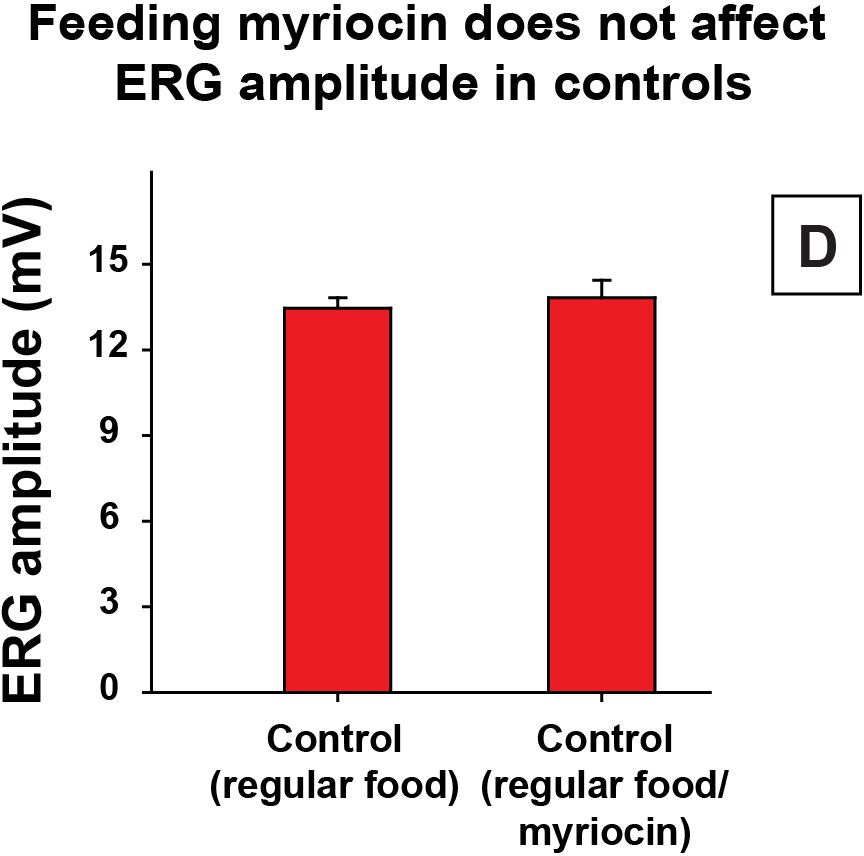
Control of myriocin treatment.
Quantification of Day 6 ERG amplitudes of control animals (y w FRT19A) with myriocin treatment. Data are presented as mean ± SEM. D, flies are raised in dark.
Figure 6 with 1 supplement
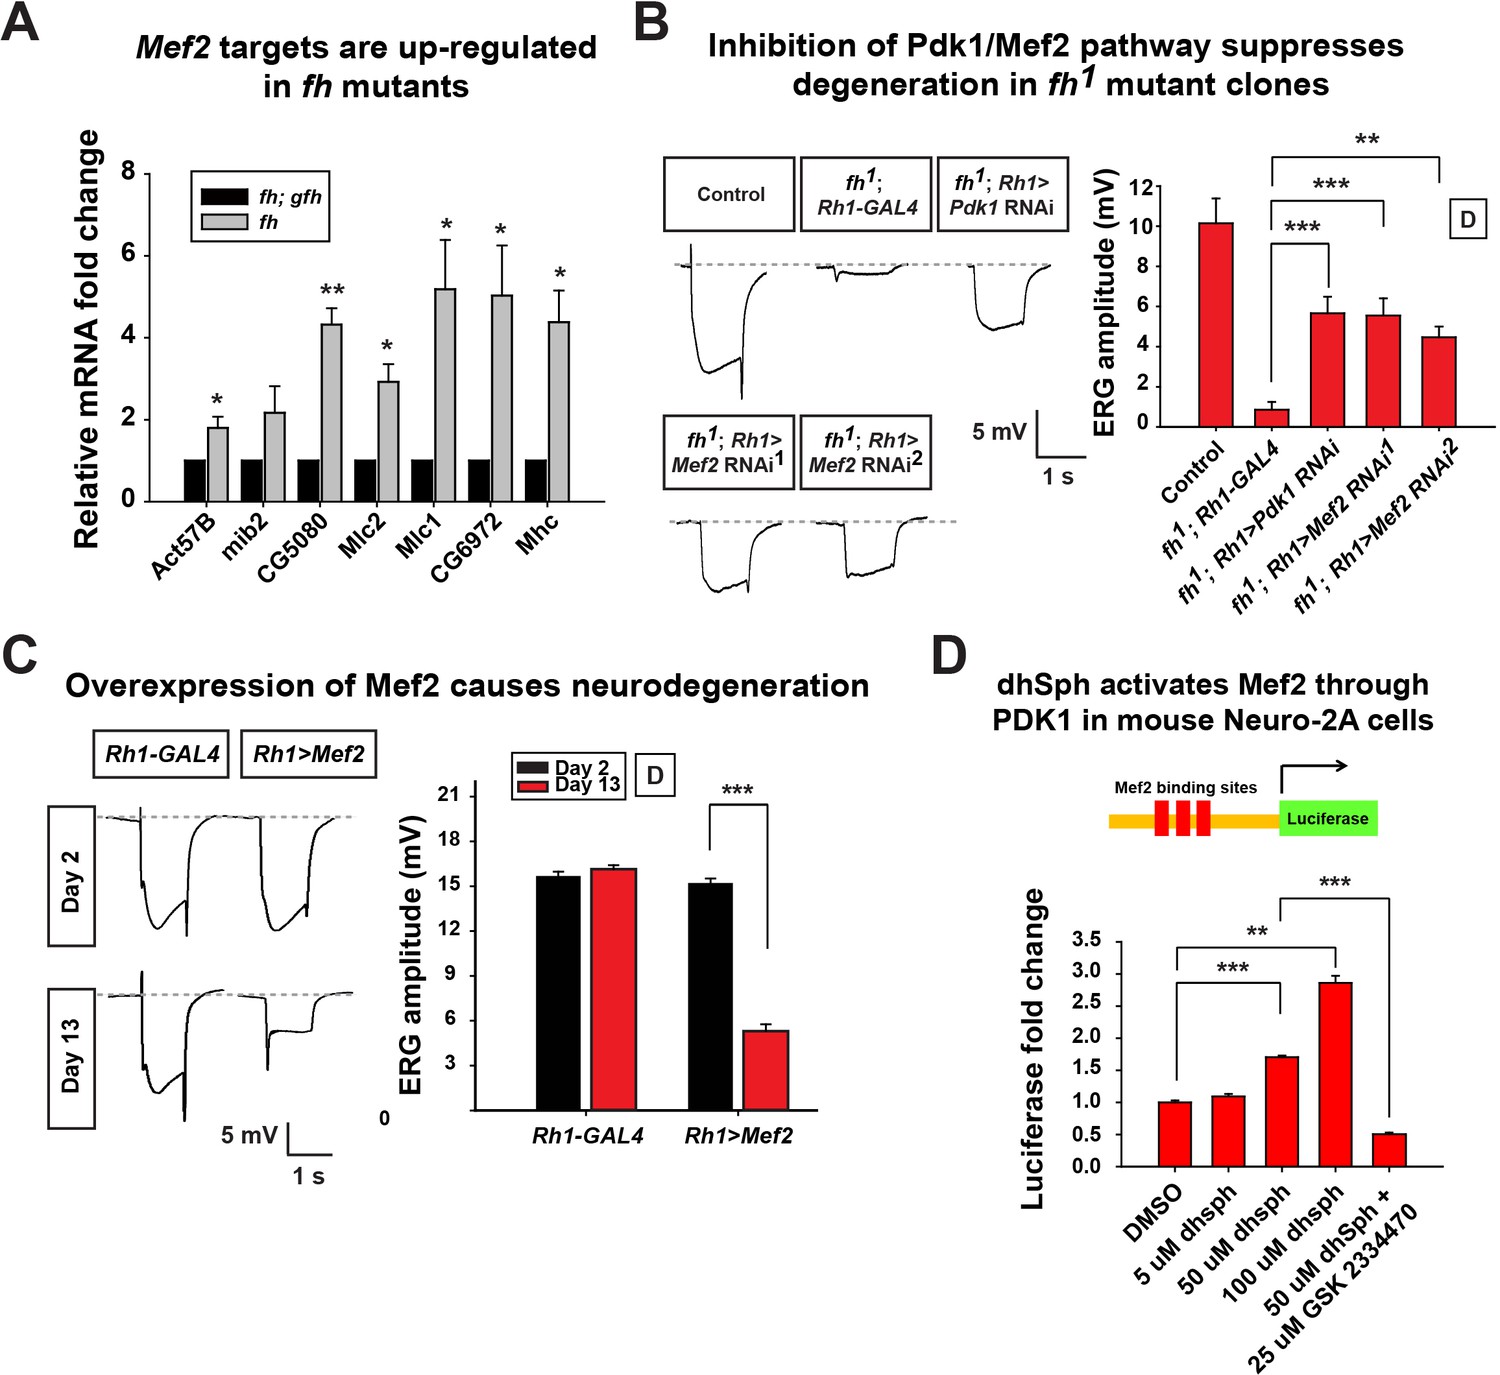
Activated Pdk1/Mef2 pathway causes degeneration in fh mutants.
(A) mRNA levels of Mef2 downstream targets in fh mutants and rescued animals (fh; gfh). n = 3. (B) Day 3 ERG of control (y w FRT19A; Rh1-GAL4) and fh mutants in which an RNAi against Pdk1 or Mef2 is expressed. (C) ERG of flies with Mef2 overexpression in the eye. (D) Mef2 luciferase reporter assay in Neuro-2A cells with different concentration of dhSph treatment. GSK 2334470, a PDK1 inhibitor. n = 4. Data are presented as mean ± SEM. *p<0.05. **p<0.01. ***p<0.001, Student’s t-test. D, flies are raised in dark.
Figure 6—figure supplement 1
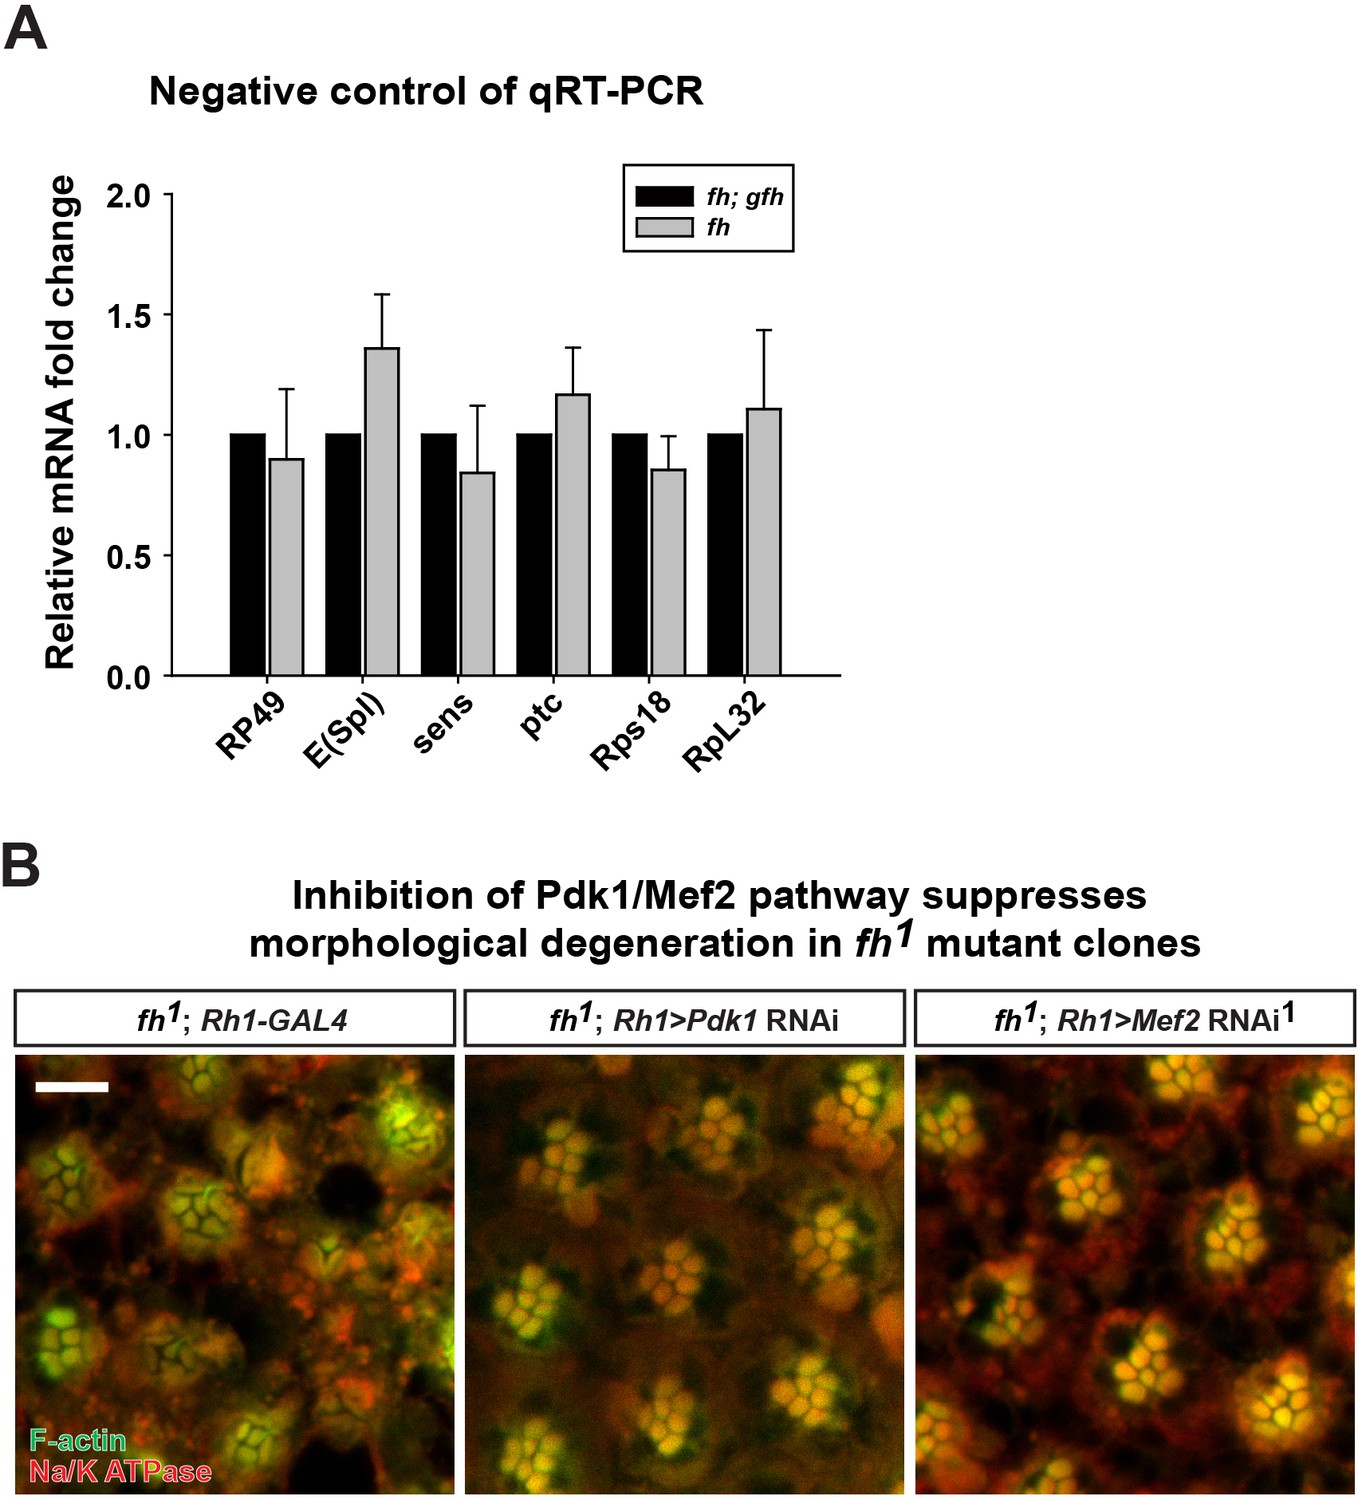
Control of qRT-PCR.
(A) mRNA levels of downstream targets of Notch, Wingless, and Hedgehog pathway as well as several ribosomal genes are not changed in fh mutants. (B) Retina morphology of fh mutants, and fh mutants that express Pdk1 or Mef2 RNAi. Rhabdomeres are labeled by phalloidin (green), whereas anti-Na/K ATPase antibody (red) marks the photoreceptor membranes. Scale bar: 10 µm. Data are presented as mean ± SEM.
Download links
A two-part list of links to download the article, or parts of the article, in various formats.
Downloads (link to download the article as PDF)
Open citations (links to open the citations from this article in various online reference manager services)
Cite this article (links to download the citations from this article in formats compatible with various reference manager tools)
Loss of Frataxin induces iron toxicity, sphingolipid synthesis, and Pdk1/Mef2 activation, leading to neurodegeneration
eLife 5:e16043.
https://doi.org/10.7554/eLife.16043


