Secretagogin expression delineates functionally-specialized populations of striatal parvalbumin-containing interneurons
- University of Oxford, United Kingdom
- Karolinska Institutet, Sweden
- Emory University, United States
Figures
Figure 1
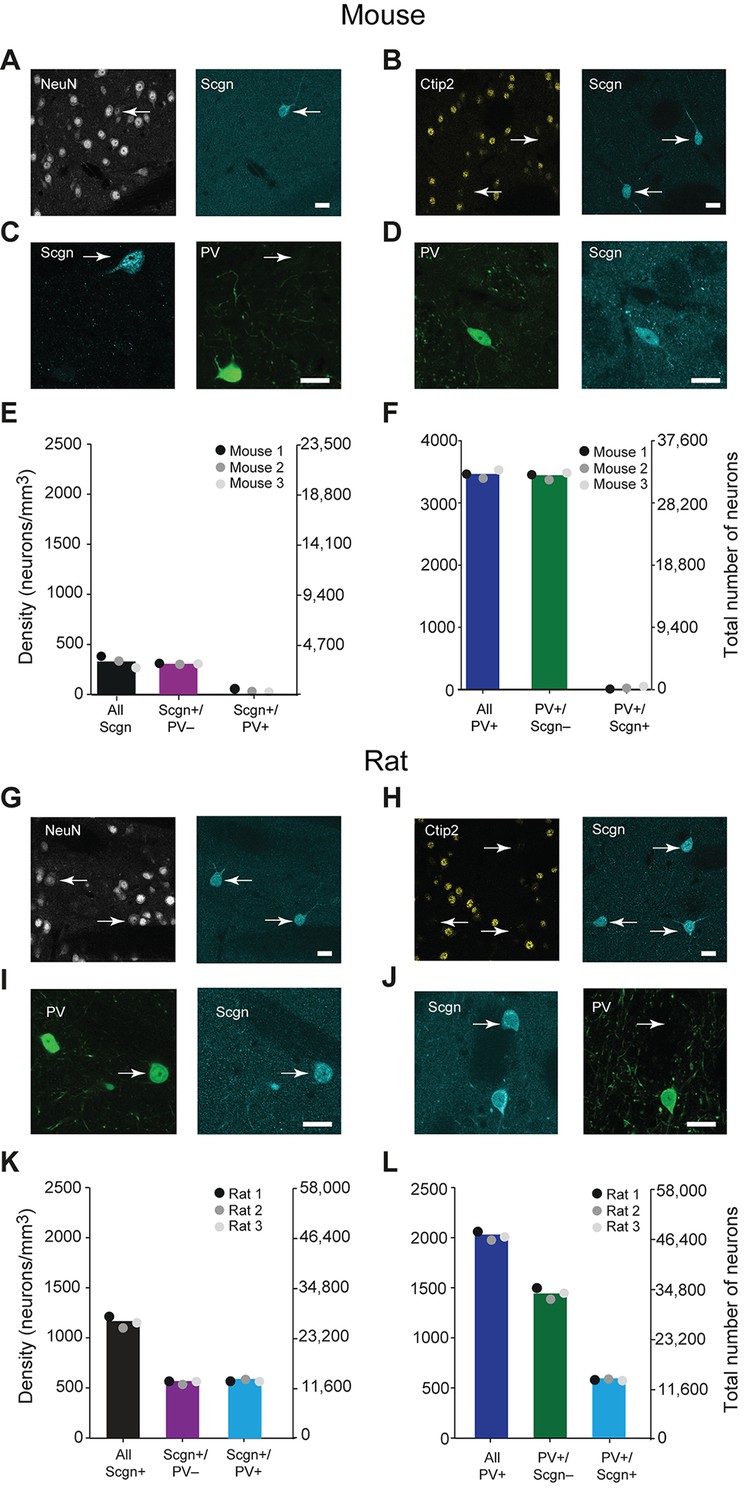
A large subpopulation of PV+ interneurons co-express Scgn in the dorsal striatum of rats, but not in mice.
(A–F), Co-expression of PV and Scgn in the dorsal striatum of the mouse. (A, B) Immunofluorescence signals for Scgn (arrows), the pan-neuronal marker NeuN (A) and SPN-specific marker, Ctip2 (B). Scgn+ cells express NeuN, but not Ctip2, indicating they are interneurons. (C, D), Immunofluorescence signals for PV and Scgn. The vast majority of Scgn+ neurons did not co-express PV (C, white arrow) although a few did (D). (E, F) Densities and numbers of interneurons expressing combinations of PV and/or Scgn. PV and Scgn were seldom expressed by the same interneurons in the mouse dorsal striatum. (G–L) As in A–F, but all data are from the dorsal striatum of rat. (G, H) Scgn+ cells express NeuN, but not Ctip2, indicating they are interneurons. (I, J) In contrast to mouse, Scgn+ interneurons that co-expressed PV were common (I, white arrow), as were those that did not (J, white arrow,). (K, L) Densities and numbers of interneurons expressing combinations of PV and/or Scgn in the rat. About one half of Scgn+ interneurons co-expressed PV (K). About one quarter of PV+ interneurons co-expressed Scgn (L). (Scale bars A–D and G–J, 20 µm)
-
Figure 1—source data 1
Source data for Figures 1E,F,K,L.
- https://doi.org/10.7554/eLife.16088.003
Figure 2
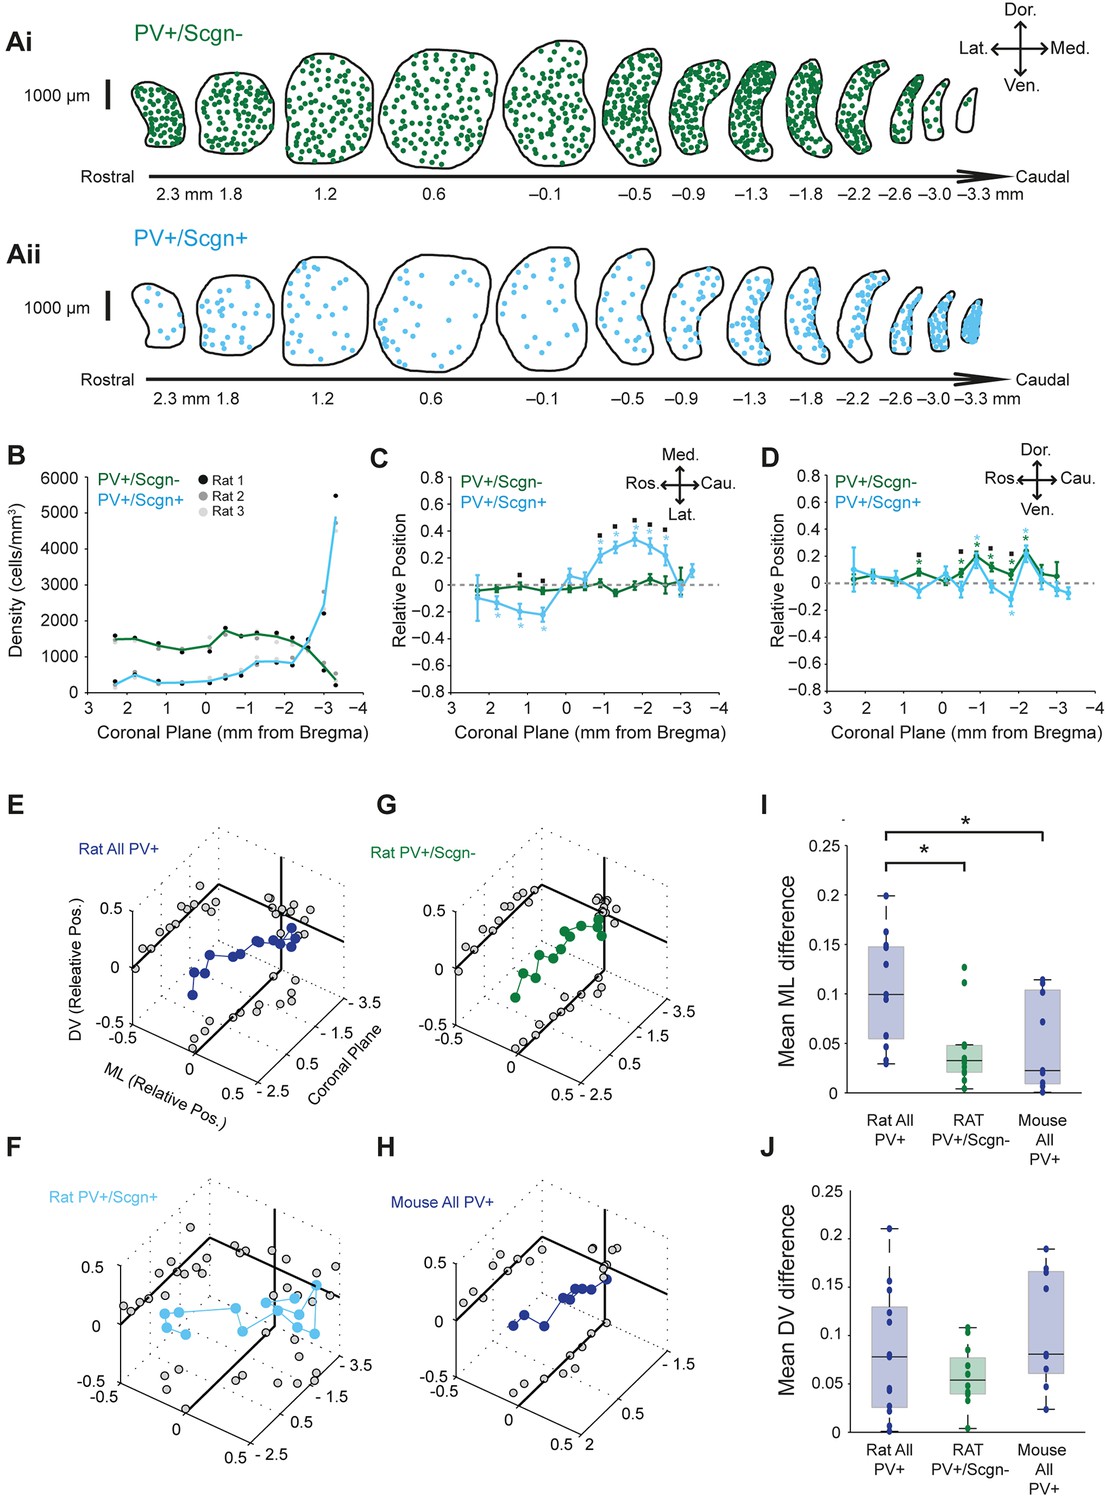
PV+/Scgn+ and PV+/Scgn- interneurons have different biases in their distributions in the dorsal striatum of the rat.
(A) Typical distributions of PV+/Scgn- interneurons (Ai) and PV+/Scgn+ interneurons (Aii) across 13 coronal planes encompassing the dorsal striatum in rat, with each dot representing a single neuron. (B) Densities of PV+/Scgn+ and PV+/Scgn- interneurons along the rostro-caudal axis of striatum. Note the increase in density of PV+/Scgn+ interneurons, and the small decrease in density of PV+/Scgn- interneurons, from rostral to caudal striatum. C,D Medio-lateral (C) and dorso-ventral (D) distributions of PV+/Scgn- interneurons (green line) and PV+/Scgn+ interneurons (blue line) along the 13 coronal planes. The presence of the asterisk (*) indicates a distribution that is significantly biased in one direction along the specified axis. Squares (□) indicate a significant difference in the distribution of the two populations of PV+ interneurons along the specified axis within a given coronal plane. Data are means of the normalized positions of allneurons counted ± SEMs. (E–G) Mean normalized medio-lateral (ML) and dorso-ventral (DV) positions of all PV+ (E), PV+/Scgn+ (F) and PV+/Scgn- (G) interneurons in each of 13 coronal planes (with respect to Bregma) of rat dorsal striatum. Grey circles on the end panels show the distribution of the mean values in each dimension. Note that clear biases in ML positions of all PV+ interneurons are similar to those of PV+/Scgn+ interneurons, whereas PV+/Scgn- interneurons are not clearly biased. (H) Mean normalized medio-lateral and dorso-ventral co-ordinates of all PV+ interneurons in each of 9 coronal planes of mouse dorsal striatum. Note that their positions are not clearly biased. (I, J) The difference in mean medio-lateral positions (I), but not dorso-ventral positions (J), between coronal planes of all rat PV+ interneurons is significantly higher than that of rat PV+/Scgn- interneurons and all PV+ interneurons in the mouse (Kruskal-Wallis ANOVA on ranks with post-hoc Dunn tests).
-
Figure 2—source data 1
Source data for Figures 2 B–H.
- https://doi.org/10.7554/eLife.16088.006
Figure 3

PV+/Scgn+ and PV+/Scgn- interneurons have different biases in their distributions in the caudate and putamen of macaque monkey.
(Ai, Aii) Confocal micrographs of the macaque striatum showing PV-expressing interneurons that co-expressed (Ai) and did not co-express (Aii) Scgn (arrow). (B) Typical distributions of PV+/Scgn- interneurons (left) and PV+/Scgn+ interneurons (right) across 7 coronal planes of macaque caudate and putamen, with each dot representing a single neuron. (C) Mean densities of all PV+ interneurons across the entirety of the caudate nucleus (Ci) and the putamen (Cii), including those populations that co-express Scgn (blue) and do not express Scgn (green). In the macaque caudate-putamen, PV+/Scgn+ neurons represent nearly three quarters of all PV-expressing neurons. Dots and squares indicate the values for individual animals. (D) Densities of PV+/Scgn+ interneurons (blue) and PV+/Scgn- interneurons (green) along the rostro-caudal axis of the caudate (Di) and the putamen (Dii). Note that the PV+/Scgn+ population in the macaque increases in density towards the caudal planes of the caudate and the putamen. (E) Medio-lateral distribution of PV+/Scgn+ and PV+/Scgn- interneurons along 7 coronal planes of the caudate nucleus (Ei) and the putamen (Eii). The presence of the asterisk (*) indicates a distribution that is significantly biased in one direction along the specified axis. Squares (□) indicate a significant difference in the distribution of the two PV+ interneuron populations along the specified axis within a given coronal plane. Data are means of the position of all neurons counted ± SEMs.
-
Figure 3—source data 1
Source data for Figures 3B–E.
- https://doi.org/10.7554/eLife.16088.008
Figure 4
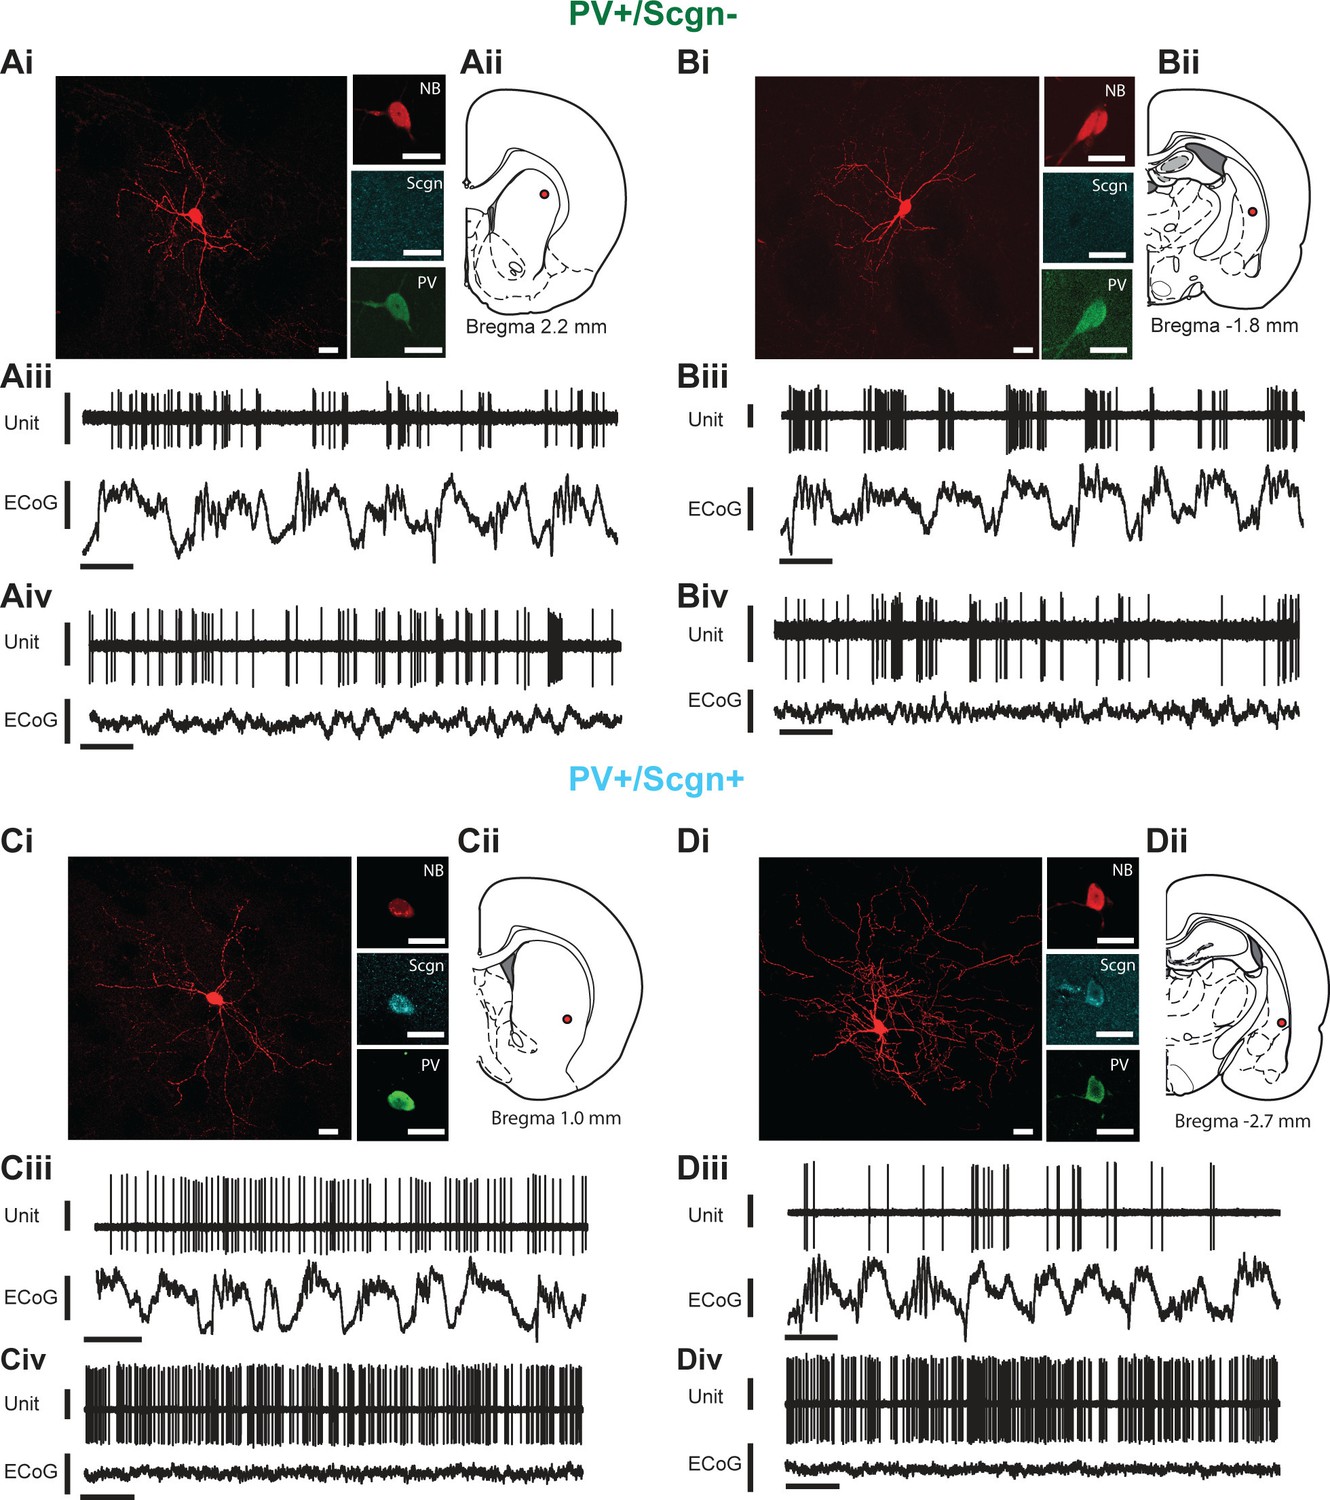
In vivo electrophysiological properties of identified PV+/Scgn- and PV+/Scgn+ striatal interneurons in the rat.
(A,D) Juxtacellularly-labeled PV+/Scgn- interneurons (A,B) and PV+/Scgn+ interneurons (C,D), identified by their co-localization of fluorescent labeling for neurobiotin (NB) and calcium-binding proteins. PV+ interneurons were recorded in the rostral (Aii), central (Cii) and caudal (Bii, Dii) aspects of dorsal striatum. (Aiii–Diii) Spontaneous action potential discharges (unit activity) of the same individual PV+/Scgn- and PV+/Scgn+ interneurons during robust cortical slow-wave activity (SWA), defined using the frontal electrocorticogram (ECoG). (Aiv–Div) Firing of the same interneurons during spontaneous cortical activation. (Ai–Di) Scale bars are 20 µM. (Aii–iii-Dii-iii) Vertical scale bars for unit activity are 0.5 mV; Vertical scale bars for ECoG are 1 mV; Horizontal scale bars are 1 s).
Figure 5
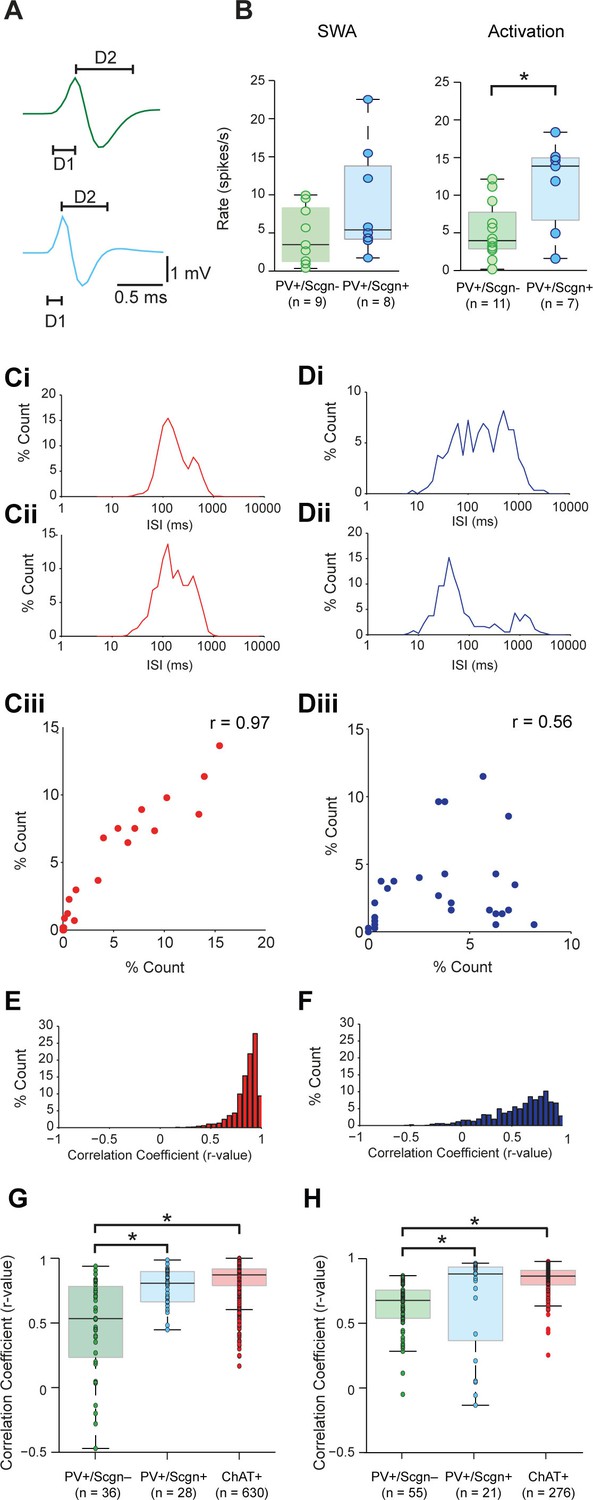
Identified PV+/Scgn- and PV+/Scgn+ interneurons in the dorsal striatum of rats have distinct electrophysiological properties.
(A) The mean action potential waveforms of PV+/Scgn-(green) and PV+/Scgn+(blue) interneurons. Both groups had short waveforms (around 1 ms). Waveforms were split in to D1 (baseline to its peak) and D2 (return to the baseline from peak). The D1 segment of PV+/Scgn+interneurons was significantly shorter than that of PV+/Scgn- interneurons. (B) The median firing rates of the two populations of PV+ interneuron were similar during SWA, but PV+/Scgn+ interneurons had a significantly higher firing rate than PV+/Scgn- interneurons during cortical activation. (C–F) The similarity of firing patterns between pairs of PV+/Scgn-, PV+/Scgn+ and cholinergic (ChAT+) interneurons was assessed by calculating the correlation coefficient (Spearman) between interspike interval (ISI) histograms. (Ci–ii) ISI histograms from the spike trains for two cholinergic interneurons recorded separately during cortical activation. (Ciii) Scatter plot of the % count in each ISI bin for the two ChAT+ interneurons plotted against each other. Because of the similar (unimodal) ISI distributions, the Spearman Rho correlation coefficient (r) for the pair of ChAT+ interneurons is relatively high. (Di–ii) As in C, but the analysis is now performed on two separately recorded PV+ interneurons. (Diii) Because of the more variable ISI distributions, the correlation coefficient (r) is relatively low. (E) Histogram of the correlation coefficients of 276 cholinergic interneuron pairs from recordings during cortical activation. The majority of correlations are high, indicating similar ISI histograms across the population. (F) Histogram of the correlation coefficients of 325 PV+ interneuron pairs from recordings during cortical activation. Correlations strengths are relatively spread; indicating ISI histograms are less similar than those of the cholinergic population. (G, H) Comparison of Spearman correlation coefficients of all PV+/Scgn-, PV+/Scgn+ and ChAT+ interneuron pairs recorded in SWA (G) and cortical activation (H). In both brain states, the correlation coefficients between pairs of PV+/Scgn+ ISI histograms was significantly higher than that of PV+/Scgn- pairs, but not significantly different to ChAT+ interneuron pairs.
-
Figure 5—source data 1
Source data for Figure 5A,B,G,H.
- https://doi.org/10.7554/eLife.16088.011
Figure 6
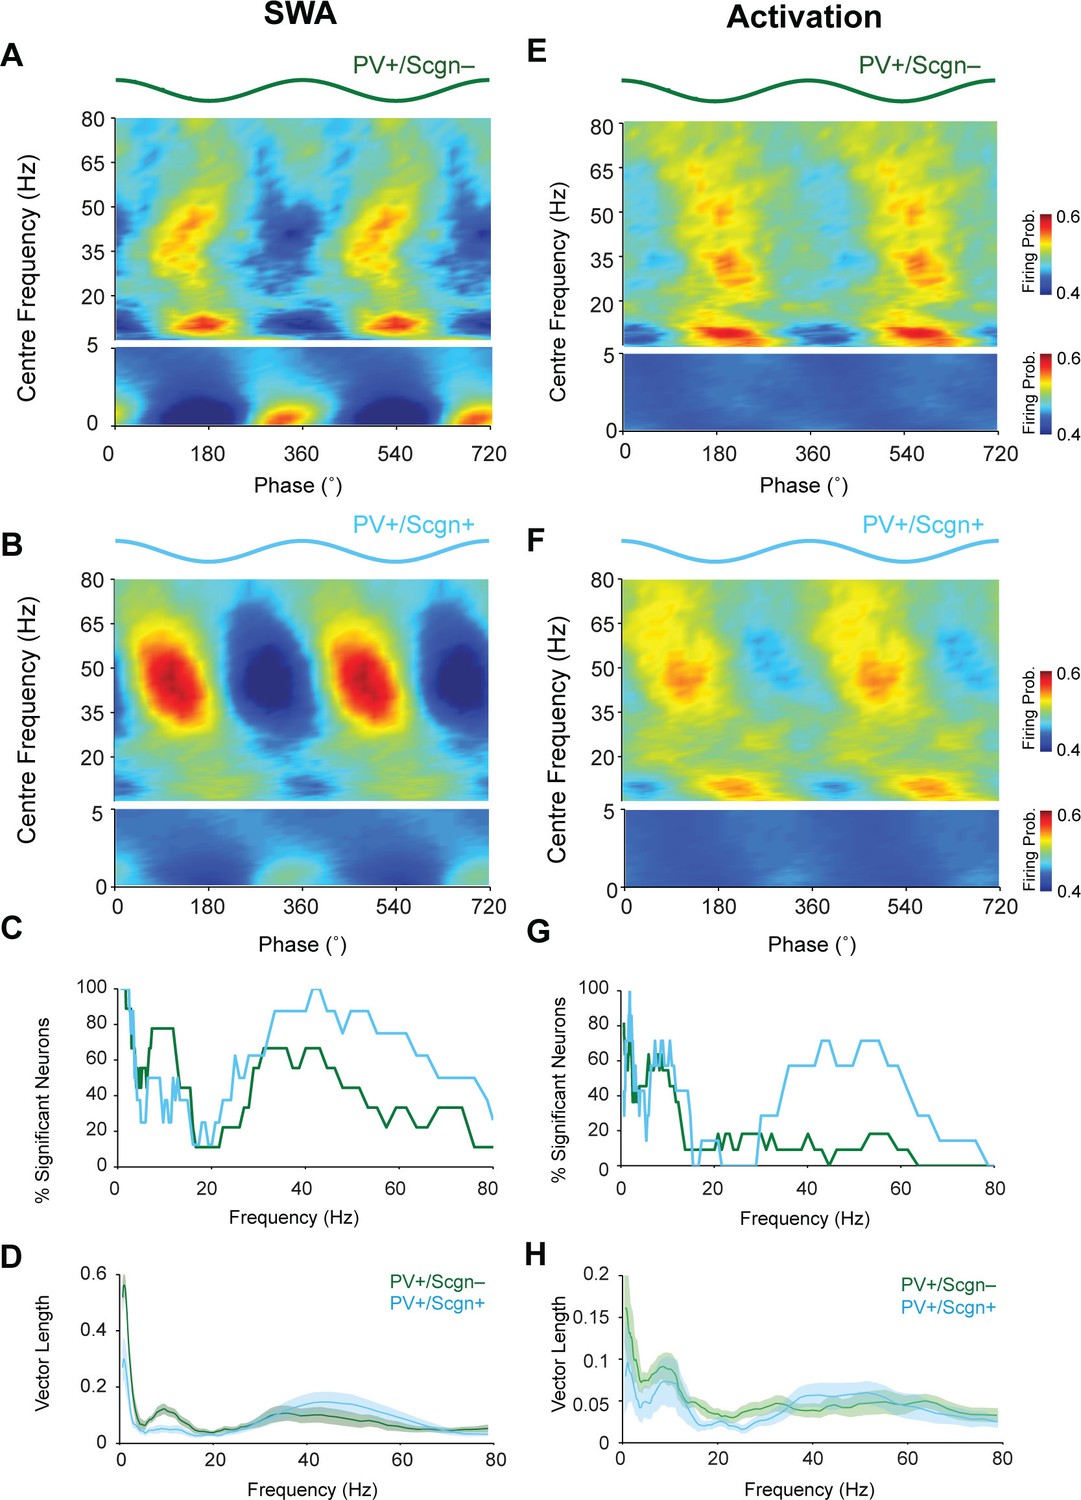
The firing of PV+/Scgn- and PV+/Scgn+ striatal interneurons is distinctly phase locked to cortical oscillations in the rat.
(A,B) Mean phase histograms of the firing of striatal PV+/Scgn- (A) and PV+/Scgn+ (B) interneurons with respect to cortical oscillations of 0.4–80 Hz during SWA. Note the stronger locking of the firing of PV+/Scgn- interneurons to slow (0.4–1.6 Hz) and spindle (7–12 Hz) frequencies, and the stronger locking of PV+/Scgn+ interneurons to gamma oscillations (30–80 Hz) (C) Histogram showing the proportions of PV+/Scgn- (green) and PV+/Scgn+ (blue) interneurons that exhibited significantly phase-locked firing (as measured by the Raleigh test, with p<0.05) in each frequency range of cortical oscillation during SWA. (D) Mean vector lengths calculated across all PV+/Scgn- (green) and PV+/Scgn+ (blue) neurons recorded during SWA (PV+/Scgn+ n = 9; PV+/Scgn- n = 8) from 0 to 80 Hz. Shaded areas show SEMs across neurons. (E,F) Mean phase histograms of striatal PV+/Scgn- (E) and PV+/Scgn+ (F) interneurons for cortical oscillations of 0.4–80 Hz during cortical activation. (G) Histogram showing the proportions of PV+/Scgn- (green) and PV+/Scgn+ (blue) neurons that were significantly locked in each frequency range of cortical oscillation during cortical activation. (H) Mean vector lengths calculated across all PV+/Scgn- (green) and PV+/Scgn+ (blue) neurons recorded during cortical activation (PV+/Scgn+ n = 11; PV+/Scgn- n = 7). Shaded areas show SEMs across neurons. (A, B, E, F, frequencies between 0–5 Hz are separated to allow for a wider color scale)
-
Figure 6—source data 1
Source data for Figures 6C,D,G,H.
- https://doi.org/10.7554/eLife.16088.013
Figure 7

Appositions formed by the axons of PV+ interneurons with the somata of SPNs are associated with the post-synaptic marker gephyrin.
(A) Confocal micrograph stack of an SPN cell body, labeled with DARPP-32 (purple), that is apposed by the boutons of a neurobiotin (NB)-labeled axon of a PV+/Scgn+ interneuron (blue). The section has also been labeled with an antibody against the post-synaptic structural protein gephyrin (yellow). Scale bar = 5 µm. (B–F), Single-plane confocal micrographs showing the xy axis and the corresponding orthogonal views; xz (top) and yz (right) of the 5 appositions labeled in A. Axes crossing points are marked by colored lines. The top right corner panel shows a magnification of the apposition in the xy axis. Note that, for each apposition, there is a punctate gephyrin signal located between the axonal bouton and the soma, indicating the presence of a putative GABAergic synapse.
Figure 8
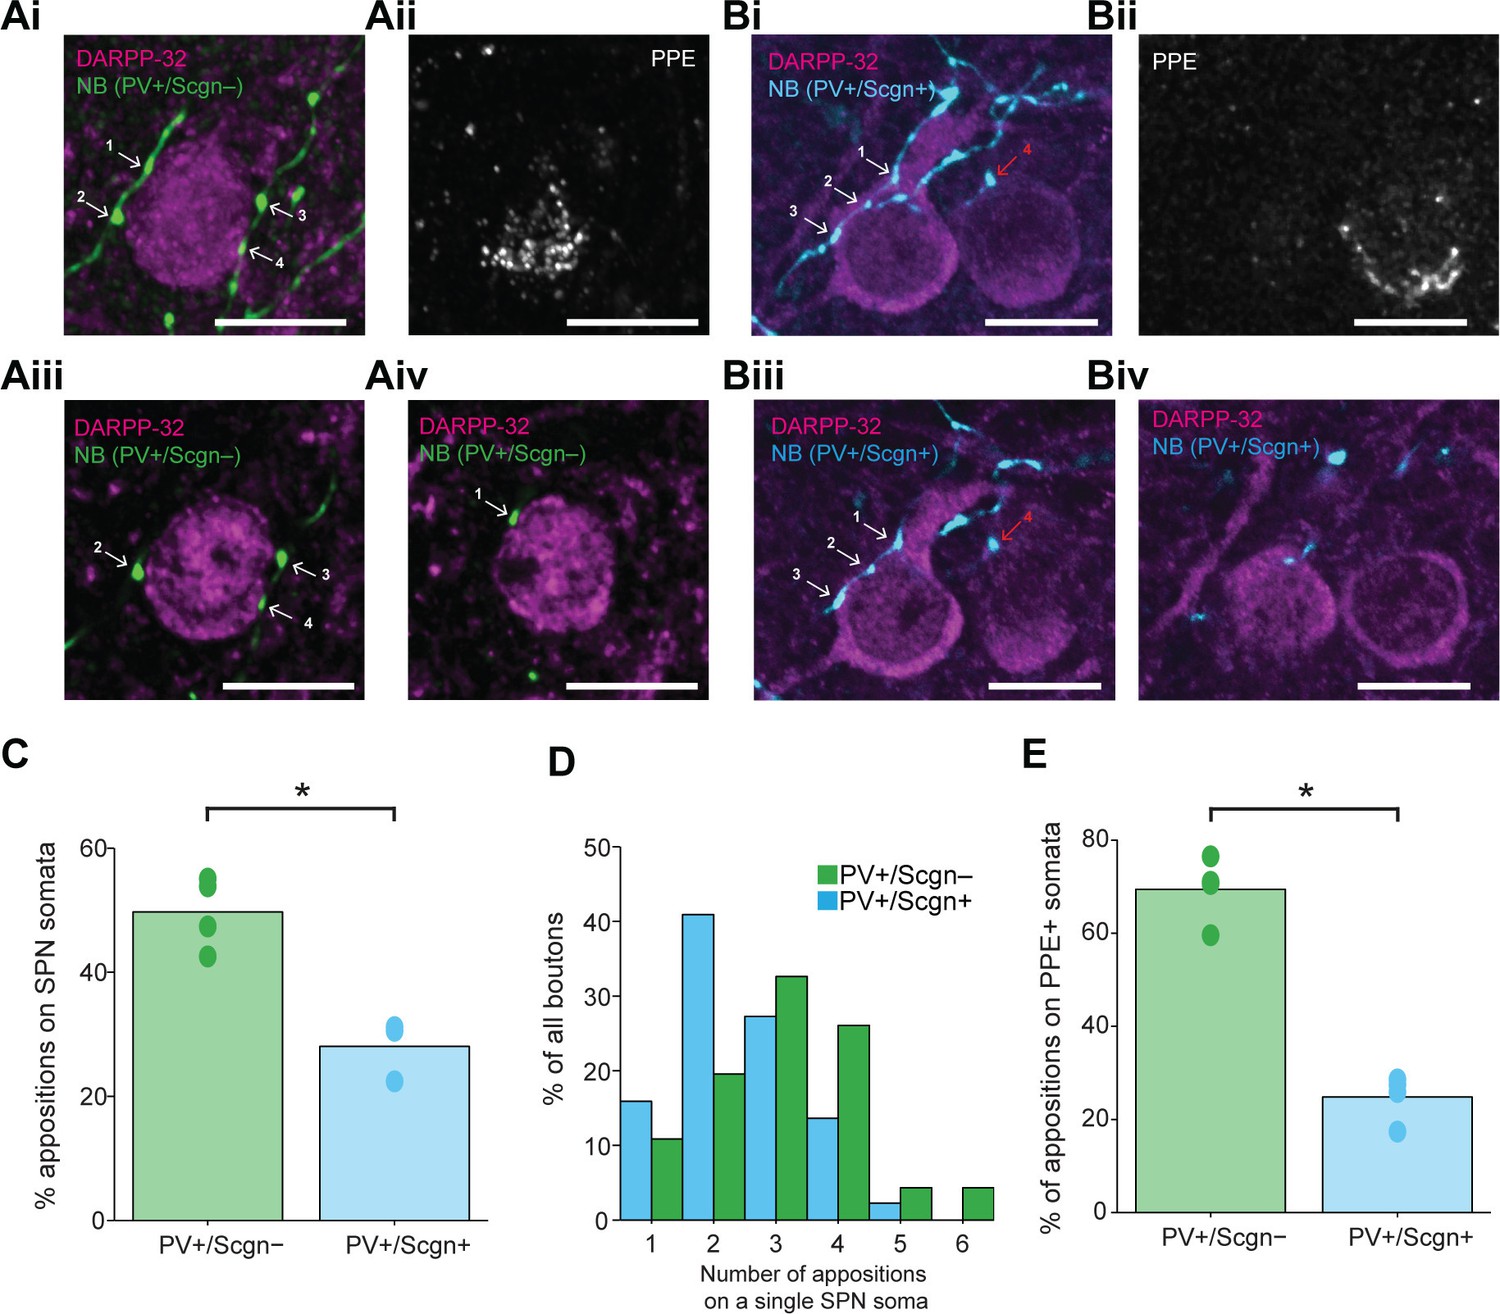
PV+/Scgn- and PV+/Scgn+ striatal interneurons selectively target the somata of SPNs in the direct or indirect pathway.
(Ai) Confocal fluorescent micrograph stack of a neurobiotin (NB)-labeled axon of a PV+/Scgn- interneuron (green) targeting a SPN revealed with DARRP-32 (purple). The interneuron axon forms 4 appositions (numbered white arrows) with the SPN soma. (Aii) The SPN expresses preproenkephalin (PPE, white), indicating it is in the indirect pathway (iSPN). (Aiii, Aiv) Single-plane confocal micrographs verifying that each of the 4 boutons is closely apposed to the SPN soma. (Bi) Confocal fluorescent micrograph stack of the NB-labeled axon of a PV+/Scgn+ interneuron (blue) traversing close to two SPNs. The axon forms 3 appositions (white arrows) with the SPN soma on the left, and appears to form a single apposition (red arrow) with the SPN on right. (Bii) The right SPN expresses PPE (iSPN), while the left SPN does not, indicating it is in the direct pathway (dSPN). (Biii, Biv), Single-plane confocal micrographs verifying that boutons 1–3 are apposed to the soma of the dSPN, while bouton 4 is not directly apposed to the iSPN. (C) Quantitative analyses of the NB-labeled axonal boutons of PV+/Scgn- and PV+/Scgn+ interneurons revealed that the axons of PV+/Scgn- interneurons were more likely to be opposed to the somata of SPNs. (D) Histogram of the frequency of different numbers of appositions formed with an individual SPN soma for both types of interneuron. (E) The axons of PV+/Scgn- interneurons were more likely than the axons of PV+/Scgn+ interneurons to target the somata of PPE+ SPNs of the indirect pathway.(A,B, scale bars are 20 µm.)
-
Figure 8—source data 1
Source data for Figure 8C,D,E.
- https://doi.org/10.7554/eLife.16088.016
Figure 9
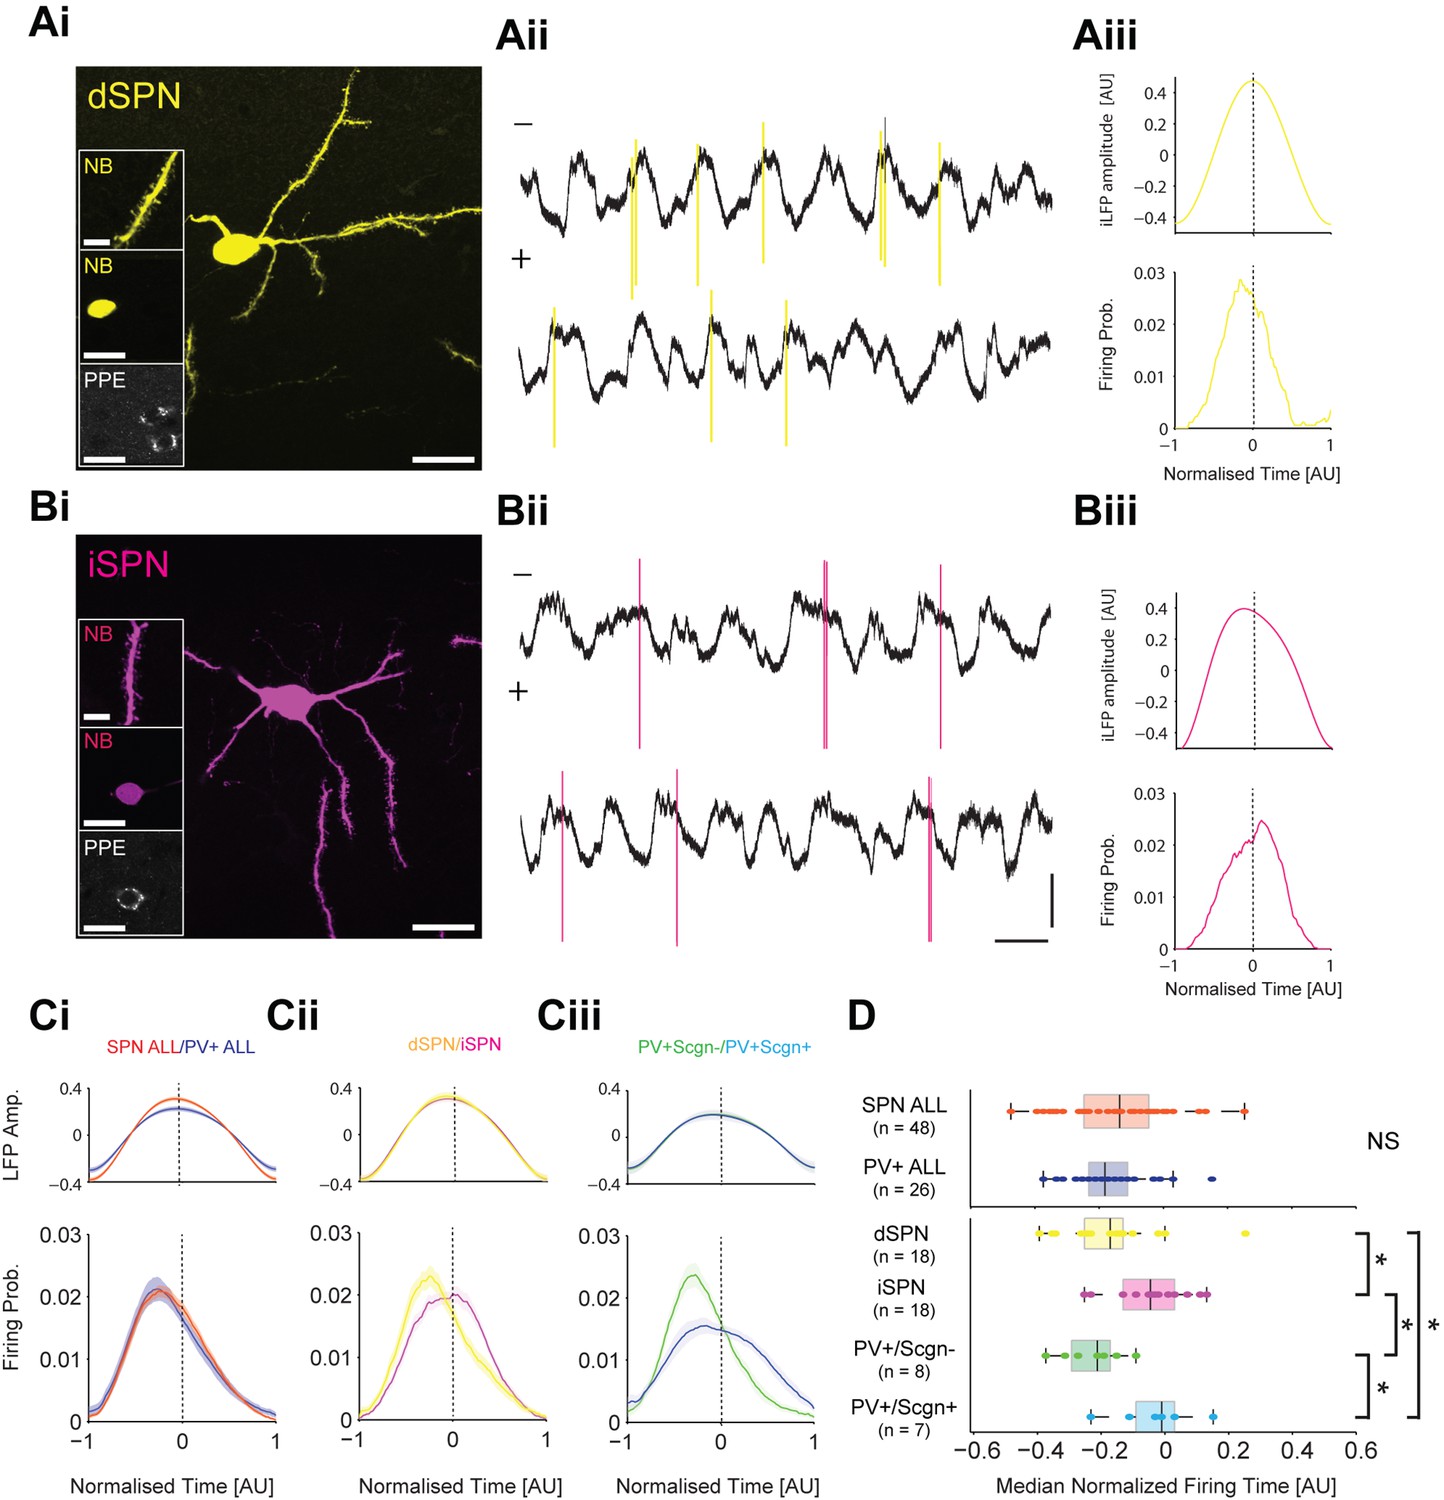
PV+/Scgn- and PV+/Scgn+ interneurons differ in their temporal relationships with spiny projection neurons of the direct and indirect pathways.
(Ai) Striatal projection neuron (SPN), juxtacellularly labelled with neurobiotin (NB) and identified by its densely spiny dendrites (top inset). This neuron’s soma does not express immunoreactvity for PPE (middle and bottom insets), identifying it as a direct pathway SPN (dSPN). (Aii) Two 10 s epochs of the inverted local field potential (iLFP) that were simultaneously recorded with single-unit activity in the striatum (all from same glass electrode). The identified dSPN tended to fire action potentials (yellow) just before and around the peaks of the iLFP. (Aiii) Histograms of iLFP amplitude (top) and dSPN spike firing (below), confirming that the dSPN fires most often before the center of the iLFP peak. (Bi) Juxtacellularly-labelled indirect pathway SPN (iSPN), identified by its somatic expression of PPE. (Bii, Biii) The iSPN tended to fire action potentials (magenta) just after and around the peaks of the iLFP (Bii), which is confirmed by the histograms of iLFP amplitude and spike firing (Biii). (C) Mean iLFP histograms and spike-firing probability histograms for all SPNs and all PV+ interneurons recorded (i), for identified dSPNs and iSPNs (ii), and for identified PV+/Scgn- and PV+/Scgn+ interneurons (iii). Note that, when considered as whole populations, SPNs and PV+ interneurons fire at similar times with respect to the iLFP, but also that firing times diverge when the SPN and PV+ interneuron populations are divided according to their dichotomous molecular identities. (D) The median firing times of all SPN and all PV+ interneurons are not significantly different (upper plot). When the subpopulations are analyzed (lower plots), dSPNs fire significantly earlier than iSPNs, and PV+/Scgn- interneurons fire significantly earlier that PV+/Scgn+ interneurons. Furthermore, PV+/Scgn- interneurons fire significantly earlier than iSPNs, but not dSPNs. Note also that PV+/Scgn+ interneurons fire significantly later than dSPNs (Kruskal Wallis ANOVA on rank [p=0.0006] with post-hoc Dunn tests). AU, arbitrary units. (Ai, Bi, Scale bars are 20 µM, except for those in dendrite images, which are 5 µM Aii, Bii, Vertical scale bars for unit activity and iLFPs are 1 mV; Horizontal scale bars are 1 s).
-
Figure 9—source data 1
Source data for Figure 9C, D.
- https://doi.org/10.7554/eLife.16088.018
Figure 10
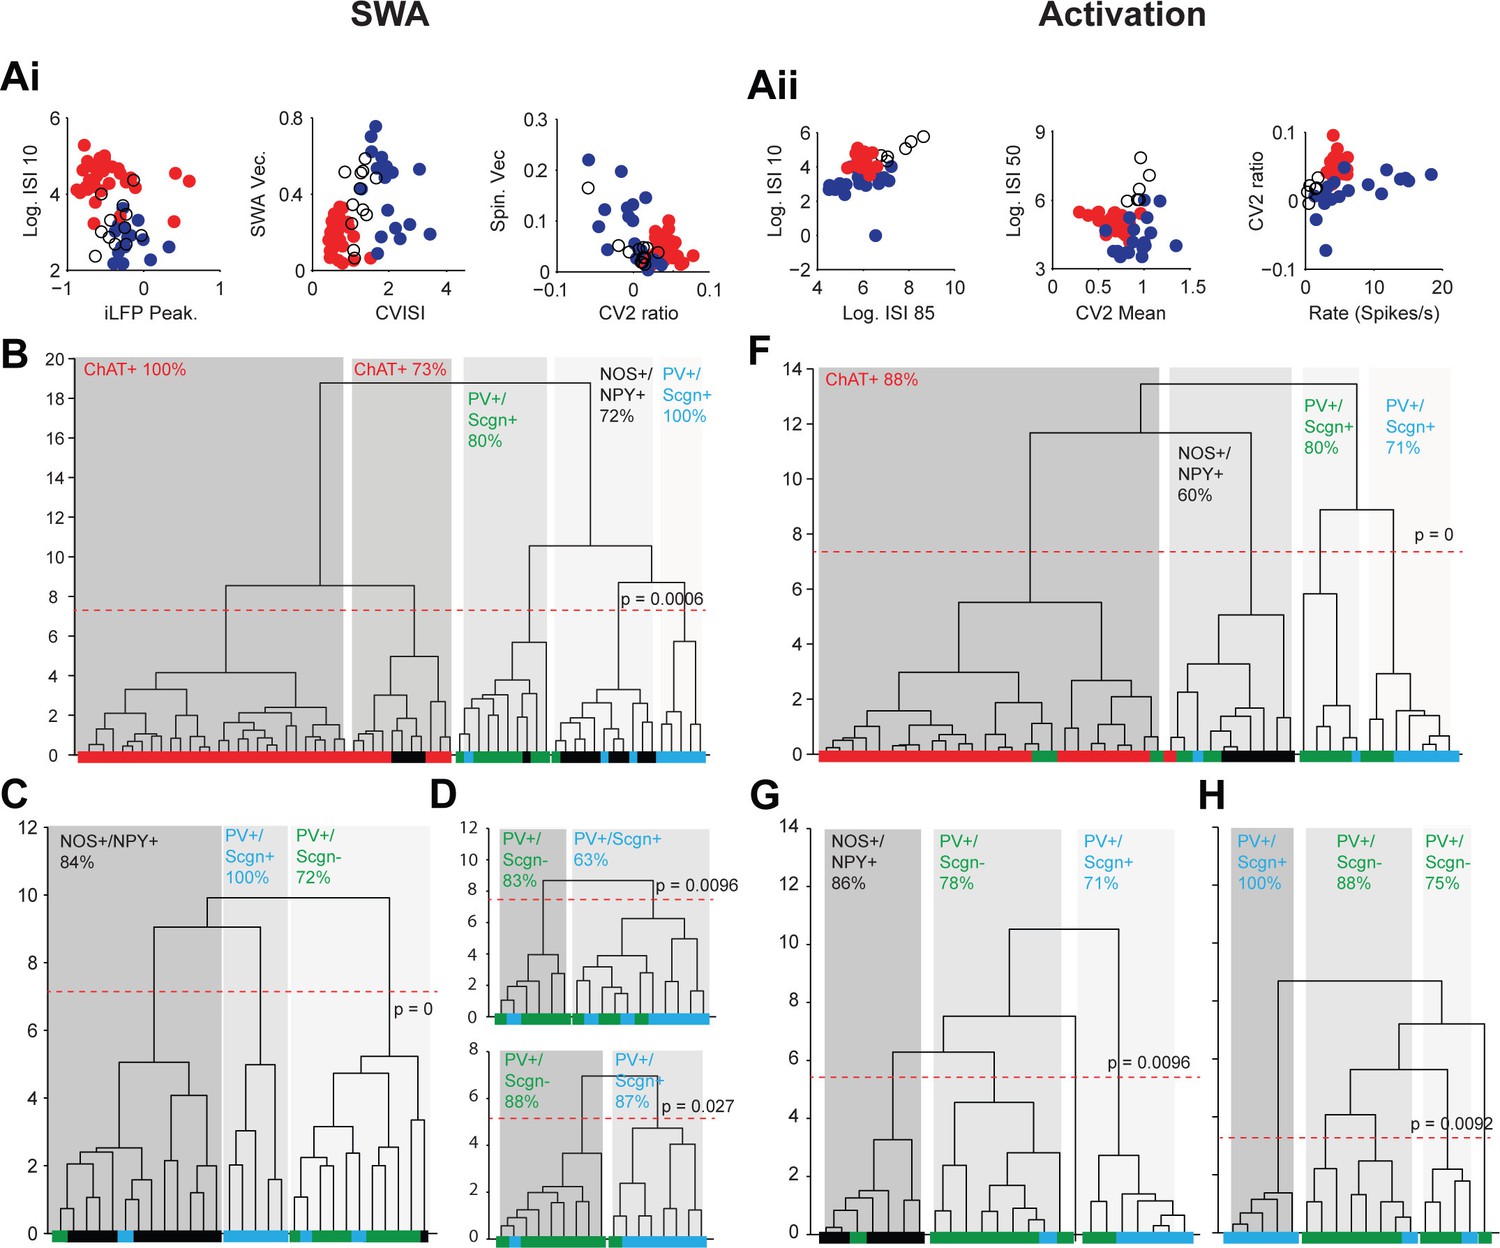
Unsupervised hierarchical clustering of electrophysiological parameters segregate PV+/Scgn+ interneurons from established striatal interneuron types.
(A) Scatter plots showing the values of 6 electrophysiological parameters used in the cluster analysis of juxtacellularly-labelled ChAT+ (red), GABAergic NOS+/NPY+ (black circles) and PV+ (dark blue) interneurons recorded during SWA (Ai) and cortical activation (Aii). See Materials and ethods for definitions of each parameter. Each variable separates two or more of the interneuron groups. (B) Dendrogram derived from 7D-cluster analysis using Ward’s method with a squared Euclidian distance measure to classify 65 striatal interneurons recorded during SWA using the parameters in Ai and one other (ECoG gamma vector length). The x-axis represents individual cells (ChAT+ in red, NOS+/NPY+ in black, PV+/Scgn- in green, PV+/Scgn+ in light blue), the y-axis represents average linkage distance between neurons, where longer distance represents greater dissimilarity. The dotted redline represents the threshold for separating clusters, which are highlighted by grey boxes, together with the p-value for this threshold. Five clusters are formed, two made up mostly of ChAT+ interneurons and the other three of different types of GABAergic interneurons. (C, D) The same analysis run only on the GABAergic interneurons (C) and only on PV+ interneurons (D). (C) The three significant clusters correspond to the three different molecular marker combinations with >70% accuracy. (D) Upper, in the 7D space, the two significant clusters for PV+ interneurons are roughly segregated according to Scgn expression. Lower, 4D-cluster analysis using only parameters related to population locking. The two significant clusters are almost completely predicted by Scgn expression. (E) Dendrogram of 6D cluster analysis of 48 interneurons recorded during cortical activation using the parameters in Aii. 4 clusters are significantly segregated, each with a clear majority of cells with a single molecular identity. (F) Analysis of only GABAergic interneurons leads to 3 significant clusters highly correlated with the 3 interneuron types. (G) Analysis of only PV+ interneurons led to 3 significant clusters, 2 of which were predominantly comprised of PV+/Scgn- interneurons. The third cluster, which had the widest segregation, was comprised only of PV+/Scgn+ interneurons.
-
Figure 10—source data 1
Source data for Figure 10.
- https://doi.org/10.7554/eLife.16088.020
Tables
Table 1
Primary antibodies used in this study.
| Molecular Marker | Host Organism | Dilution used | Source and catalog number | Research Resource Identifier (RRID) |
|---|---|---|---|---|
| Choline acetyltransferase | Goat | 1:500 | Millipore AB144P | RRID:AB_2079751 |
| Ctip2 | Rat | 1:500 | Abcam AB18465 | RRID:AB_2064130 |
| Dopamine and cAMP-regulated phosphoprotein-32 (DARPP-32) | Goat | 1:100 | Santa Cruz Biotechnology SC-8483 | RRID:AB_639002 |
| Gephyrin | Mouse | 1:500 | Synaptic Systems 147021 | RRID:AB_2232546 |
| Neuron-specific nuclear antigen (NeuN) | Mouse | 1:200 | Millipore MAB377 | RRID:AB_2298772 |
| Nitric Oxide Synthase | Mouse | 1:500 | Sigma N2280 | RRID:AB_260754 |
| Neuropeptide Y | Rabbit | 1:5000 | ImmunoStar 22940 | RRID:AB_2307354 |
| Parvalbumin | Guinea Pig | 1:1000 | Synaptic Systems 195004 | RRID:AB_2156476 |
| Preproenkephalin | Rabbit | 1:5000 | LifeSpan Biosciences LS-C23084 | RRID:AB_902714 |
| Secretagogin | Goat | 1:1000 | R&D Systems AF4878 | RRID:AB_2269934 |
| Secretagogin | Rabbit | 1:500 | Abcam AB111871 | RRID:AB_10864618 |
Additional files
-
Supplementary file 1
Distribution of PV+/Scgn– and PV+/Scgn+ interneurons in the rat striatum.
- https://doi.org/10.7554/eLife.16088.021
-
Supplementary file 2
Distribution of PV+/Scgn– and PV+/Scgn+ interneurons in the macaque caudate and putamen.
- https://doi.org/10.7554/eLife.16088.022
Download links
A two-part list of links to download the article, or parts of the article, in various formats.
Downloads (link to download the article as PDF)
Open citations (links to open the citations from this article in various online reference manager services)
Cite this article (links to download the citations from this article in formats compatible with various reference manager tools)
Secretagogin expression delineates functionally-specialized populations of striatal parvalbumin-containing interneurons
eLife 5:e16088.
https://doi.org/10.7554/eLife.16088


