The impact of pyrethroid resistance on the efficacy and effectiveness of bednets for malaria control in Africa
- Imperial College London, United Kingdom
- Liverpool School of Tropical Medicine, United Kingdom
- Queen Mary’s University, United Kingdom
Figures
Figure 1 with 2 supplements
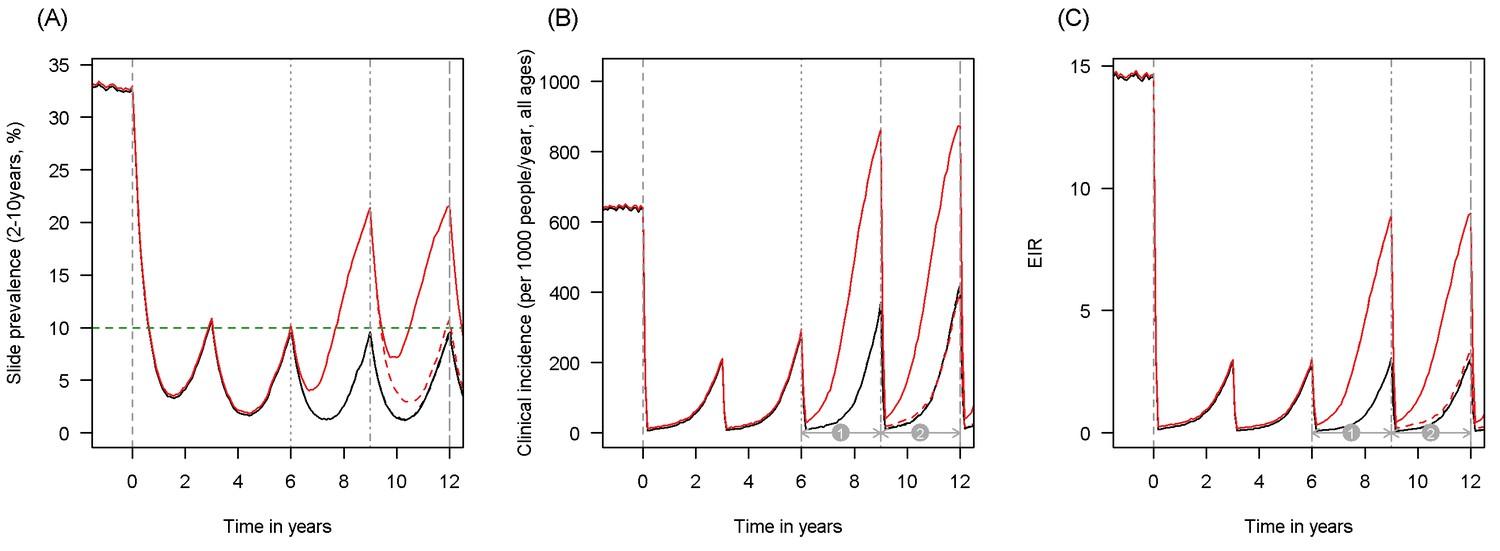
Scenario under investigation: timings for the introduction of LLINs, insecticide resistance and PBO LLINs for different malaria metrics.
The figure illustrates how insecticide resistance is incorporated into the mathematical model. Panel (A) shows parasite prevalence by microscopy in 2–10 year olds, (B) clinical incidence in the entire population (cases per 1000 people per year) and (C) the annual entomological inoculation rate (EIR). In all three panels 4 different scenarios are run: black line shows a situation with no insecticide resistance whilst red line illustrates resistance arriving at year 6 (moderate, 50% survival measured in a bioassay); solid lines show non-PBO LLIN whilst dashed lines show PBO LLINs introduced at year 9 (vertical dotted-dashed grey line). There is no vector control in the population up until time zero (vertical dashed grey line) at which time there is a single mass distribution of non-PBO LLINs to 80% of the population. LLINs are redistributed every 3 years to the same proportion of the population. Mosquitoes are entirely susceptible up until resistance arrives overnight at the start of year 6 (vertical grey dotted line). Endemicity (a variable in Figures 4 and 5) is changed by varying the slide prevalence in 2–10 year olds at year 6 (by changing the vector to host ratio) and in this plot takes a value of 10% (as illustrated by the horizontal green dashed line in A). The impact of insecticide resistance is predicted (in Figure 4) by averaging the clinical incidence and EIR for the solid red lines (resistance) and solid black lines (no resistance) between the years 6 and 9 (period  ). Similarly, the impact of switching to PBO LLINs (in Figure 5) is estimated by averaging the clinical incidence and EIR for the solid red line (standard LLINs) and dashed red lines (switch to PBO LLINs) lines between the years 9 and 12 (period
  ). Different scenarios with a low and high prevalence of pyrethroid resistance are shown in Figure 1—figure supplements 1 and 2.
Figure 1—figure supplement 1

Scenario under investigation: example of a mosquito population with a low population prevalence of resistance.
The figure illustrates how insecticide resistance is incorporated into the mathematical model. Panel (A) shows parasite prevalence by microscopy in 2–10 year olds, (B) clinical incidence in the entire population (cases per 1000 people per year) and (C) the annual entomological inoculation rate (EIR). In all three panels 4 different scenarios are run: black line shows a situation with no insecticide resistance whilst red line illustrates resistance arriving at year 6 (20% survival measured in a bioassay); solid lines show non-PBO LLIN whilst dashed lines show PBO LLINs introduced at year 9 (vertical dotted-dashed grey line). There is no vector control in the population up until time zero (vertical dashed grey line) at which time there is a single mass distribution of non-PBO LLINs to 80% of the population. LLINs are redistributed every 3 years to the same proportion of the population. Mosquitoes are entirely susceptible up until resistance arrives overnight at the start of year 6 (vertical grey dotted line). Endemicity (a variable in Figures 4 and 5) is changed by varying the slide prevalence in 2–10 year olds at year 6 (by changing the vector to host ratio) and in this plot takes a value of 10% (as illustrated by the horizontal green dashed line in A). The impact of insecticide resistance is predicted (in Figure 4) by averaging the clinical incidence and EIR for the solid red lines (resistance) and solid black lines (no resistance) between the years 6 and 9 (period  ). Similarly, the impact of switching to PBO LLINs (in Figure 5) is estimated by averaging the clinical incidence and EIR for the solid red line (standard LLINs) and dashed red lines (switch to PBO LLINs) lines between years 9 and 12 (period
  ).
).
Figure 1—figure supplement 2
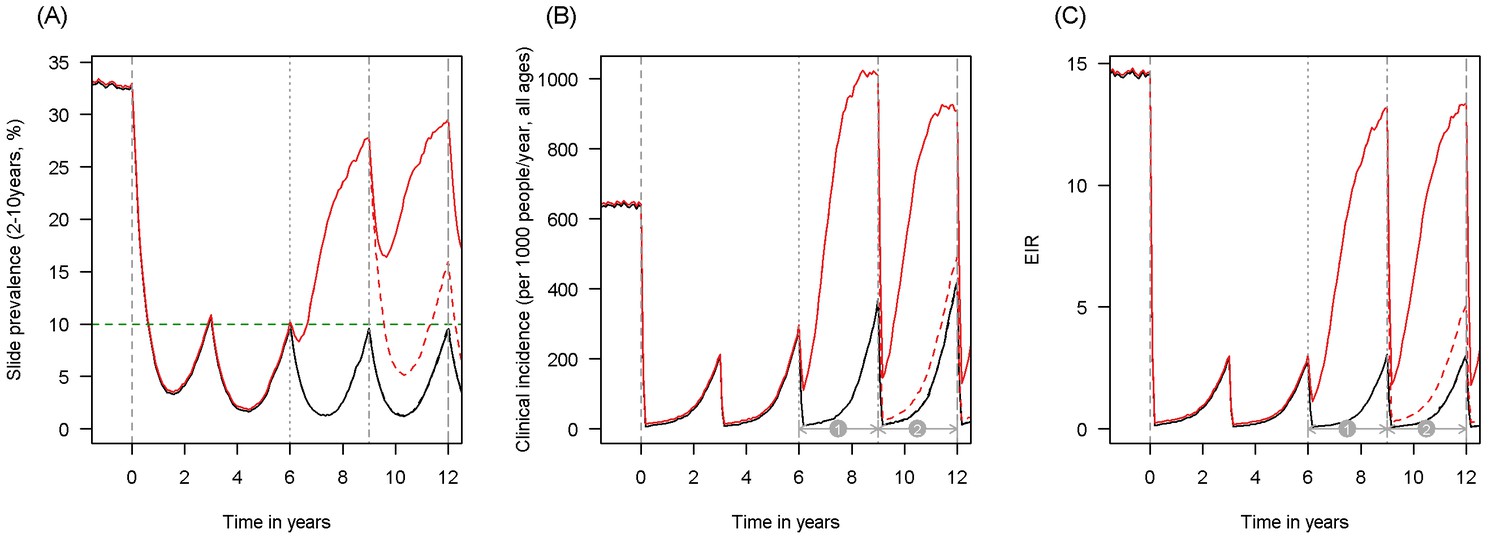
Scenario under investigation: example of a mosquito population with a high population prevalence of resistance.
The figure illustrates how insecticide resistance is incorporated into the mathematical model. Panel (A) shows parasite prevalence by microscopy in 2–10 year olds, (B) clinical incidence in the entire population (cases per 1000 people per year) and (C) the annual entomological inoculation rate (EIR). In all three panels 4 different scenarios are run: black line shows a situation with no insecticide resistance whilst red line illustrates resistance arriving at year 6 (80% survival measured in a bioassay); solid lines show non-PBO LLIN whilst dashed lines show PBO LLINs introduced at year 9 (vertical dotted-dashed grey line). There is no vector control in the population up until time zero (vertical dashed grey line) at which time there is a single mass distribution of non-PBO LLINs to 80% of the population. LLINs are redistributed every 3 years to the same proportion of the population. Mosquitoes are entirely susceptible up until resistance arrives overnight at the start of year 6 (vertical grey dotted line). Endemicity (a variable in Figures 4 and 5) is changed by varying the slide prevalence in 2–10 year olds at year 6 (by changing the vector to host ratio) and in this plot takes a value of 10% (as illustrated by the horizontal green dashed line in A). The impact of insecticide resistance is predicted (in Figure 4) by averaging the clinical incidence and EIR for the solid red lines (resistance) and solid black lines (no resistance) between the years 6 and 9 (period  ). Similarly, the impact of switching to PBO LLINs (in Figure 5) is estimated by averaging the clinical incidence and EIR for the solid red line (standard LLINs) and dashed red lines (switch to PBO LLINs) lines between years 9 and 12 (period
  ).
).
Figure 2

The ability of the pyrethroid resistance test (the percentage mosquito survival in a bioassay) to predict the results of experimental hut trials and the increase in mosquito mortality caused by the synergist PBO.
Panel A: The relationship between mosquito mortality measured in non-PBO WHO tube bioassay and experimental hut trials (the percentage of mosquitoes, which enter the house that die within the next 24 hr). Solid grey line shows the best fit model for all mosquito species combined. Panel B: Differences in mosquito mortality caused by adding PBO to a pyrethroid bioassay. Panel C: Best fit models from Panel A and Panel B were combined to predict the change in mortality seen by adding PBO to a pyrethroid LLIN for mosquito populations with different levels of insecticide resistance. Points show the different mortalities measured from the limited number of experimental hut trials where PBO and non-PBO nets were simultaneously tested. Overall the model appears to be a good predictor of these data, both visually and statistically (Analysis of Variance test shows there was no significant difference between model predictions and observed data p-value=0.25). No experimental hut trial data were available for validation of the Anopheles funestus model. Throughout all panel colour denotes mosquito species, either Anopheles gambiae sensu lato (red) or A. funestus (blue), whilst the shape of points indicates the type of pyrethroid used: permethrin (circle), deltamethrin (square), or other pyrethroid (diamond). In panels A and B the fill of the points indicates the type of bioassay used (filled points = WHO cone; no fill = WHO tube; light fill = CDC bottle). Solid line shows the best fit model whilst the shaded areas indicate the 95% credible intervals around the best fit line. In all panels the dashed lines show no difference between the x and y axes. Pre-defined search string used in the meta-analyses are listed in Figure 2—source data 1 whilst raw data from panels A,B and C are provided in Figure 2—source data 2, Figure 2—source data 3, and doi:10.5061/dryad.13qj2 respectively.
-
Figure 2—source data 1
Summary of the different predefined search strings used for meta-analysis M1, M2 and M3.
Different search engines were used on different dates (each with their own search numbering)
- https://doi.org/10.7554/eLife.16090.008
-
Figure 2—source data 2
Summary of data from meta-analysis M1 presented in Figure 2A.
- https://doi.org/10.7554/eLife.16090.009
-
Figure 2—source data 3
Summary of data from meta-analysis M2 presented in Figure 2B.
- https://doi.org/10.7554/eLife.16090.010
Figure 3 with 1 supplement
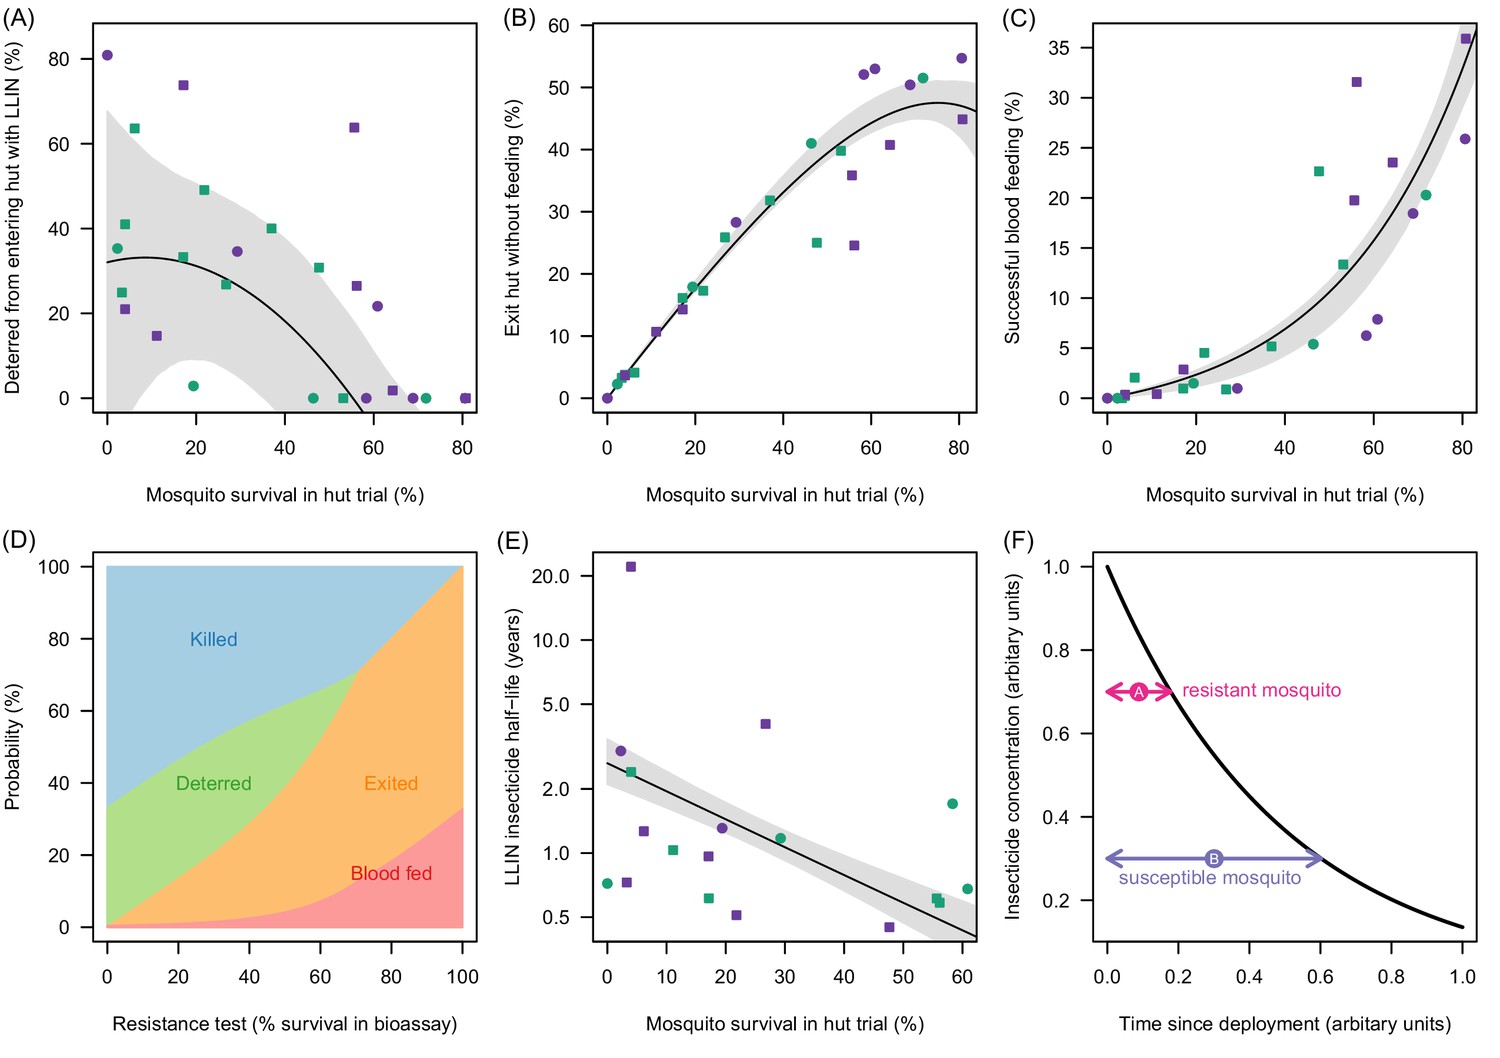
Meta-analysis of how the different outcomes of experimental hut trials which impact LLIN efficacy change with the percentage of mosquitoes which survive after entering the hut.
(A) The probability that mosquitoes will be deterred away from a hut with an LLIN, (B) once entered the hut the mosquito will exit without feeding, or (C) will successfully feed. Panel (D) shows how the average probability that a bloodfeeding mosquitoes will be killed, deterred from entering, exit without feeding or successfully feed and survive during a single feeding attempt and how this changes with the population prevalence of pyrethroid resistance (as measured as the percentage survival in a pyrethroid bioassay). The lines are drawn using the best fit estimates from (A–C). Panel (E) shows how the longevity of the insecticide activity (estimated from washed nets) is longer in mosquito populations with high mosquito mortality in experimental hut trials. A possible hypothesis for this change is proposed in (F) where the black line indicates how insecticide concentration might decay over time. The time taken for a hypothetical resistant mosquito to survive the insecticide concentration (pink arrow) may be shorter than a susceptible mosquito (purple arrow). In Panels (A), (B), (C) and (E) the points show data from experimental hut trials with standard (green) or PBO (purple) LLINs. In (A) points which fell below the line (i.e. mosquitoes were more likely to enter huts with LLINs) were set to zero. The black line shows the best fit model to these data whilst the shaded area denotes the 95% credible interval estimates for the best fit line. Graphical assessment of the validity of the distributional assumptions and the posterior distributions for each parameter are shown in Figure 3—figure supplement 1A).
Figure 3—figure supplement 1
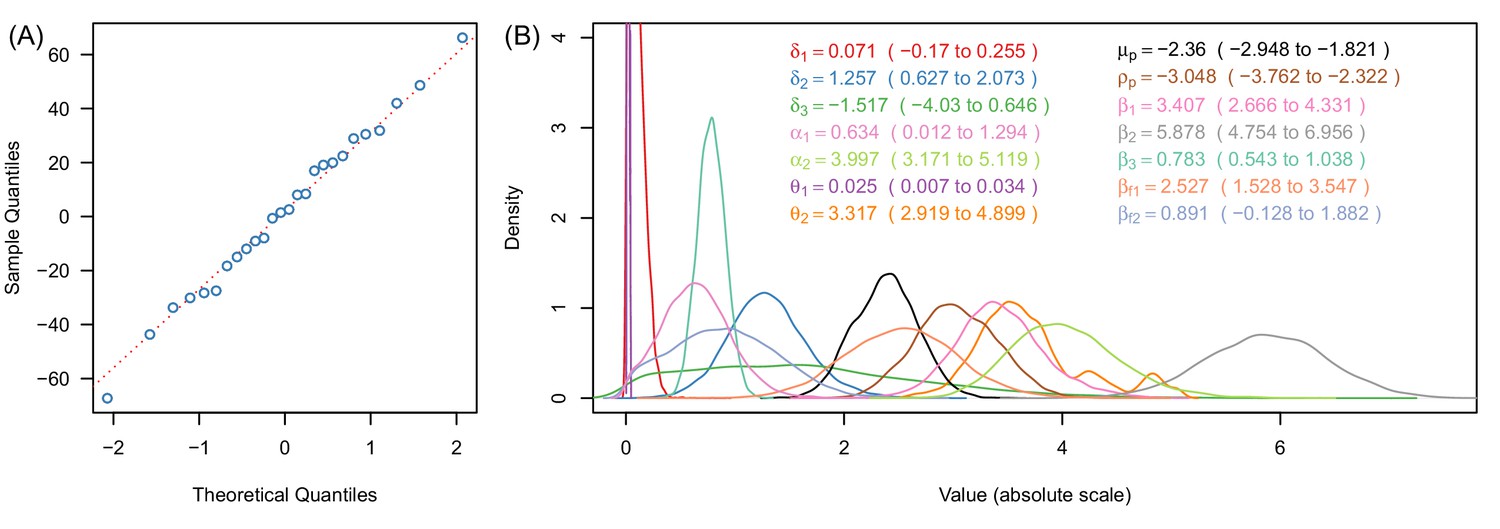
Justification of normality distributed errors in the deterrence dataset (A) and posterior distributions of parameter estimates (B).
(A) shows a normal quantile-quantile plot for the residuals of the data for the relationship between deterrence and mosquito survival in experimental hut trials (Figure 3A, Equation [9]). The linearity of the residuals (the proximity of the blue dots to the red dotted line) indicates that the error in these data are adequately described by the normal distribution (Equation [9]). Panel (B) shows a kernel density plot for the posterior distributions for all model parameters. Line colours match legend colours (with values indicating median and 95% credible intervals for all parameters). In panel (B) all x-axes values are shown on the absolute scale.
Figure 4 with 5 supplements
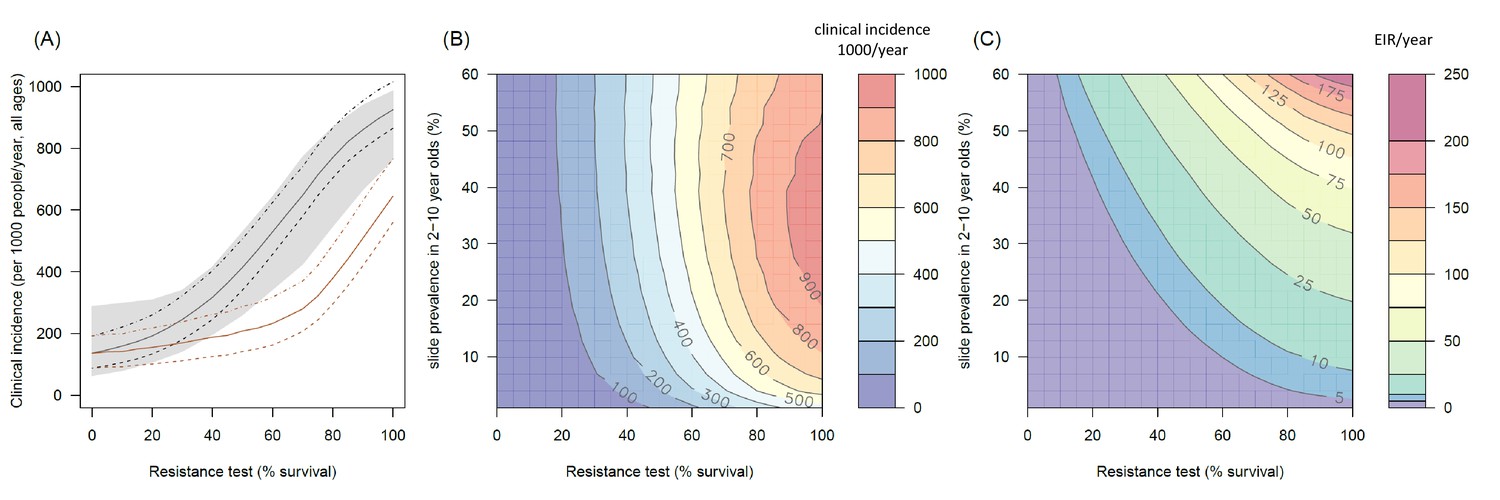
The predicted impact of pyrethroid resistance on the clinical incidence of malaria (Panels A and B) and the force of infection (Panel C).
Panel (A) shows how the number of clinical cases in the population increases with the population prevalence of pyrethroid resistance (as assessed by the percentage survival in a pyrethroid bioassay) for a single setting (with 10% slide prevalence). Black lines show the full resistance model whilst the brown lines give predictions for mosquito populations where the rate of change in insecticide activity over time is the same for all mosquitoes (i.e. resistance has no impact on LLIN longevity). Solid lines show the average for the population, shaded grey area indicates the 95% credible intervals around this best fit line, dashed lines denote those using bednets whilst dotted-dashed lines show those who do not. Panel (B) shows the 3D relationship between prevalence of resistance (x-axis), endemicity (y-axis) and the absolute increase in the number of clinical cases (contours, see colour legend) per 1000 people (all ages). Panel (C) presents the same model as (B) though showing the absolute increase in the entomological inoculation rate (EIR, the average number of infectious bits per person per year). In this figure it is assumed that the mosquito species is Anopheles gambiae sensu stricto and that there is 80% LLIN coverage. Figure 4—figure supplement 1 shows the same figure with 50% LLIN coverage. Further secondary figures indicate how the impact of resistance changes with mosquito species, be it Anopheles arabiensis (Figure 4—figure supplement 2) or Anopheles funestus (Figure 4—figure supplement 3). Panel (A) shows the importance of the rate of change in insecticide activity over time. Figure 4—figure supplement 4 shows how Panels B and C would change if the rate of decay in insecticide activity was the same for resistant and susceptible mosquitoes. The uncertainty in the three LLIN efficacy parameters used to generate the confidence interval estimates in Panel (A) are shown in (Figure 4—figure supplement 5) for different levels of pyrethroid resistance.
Figure 4—figure supplement 1

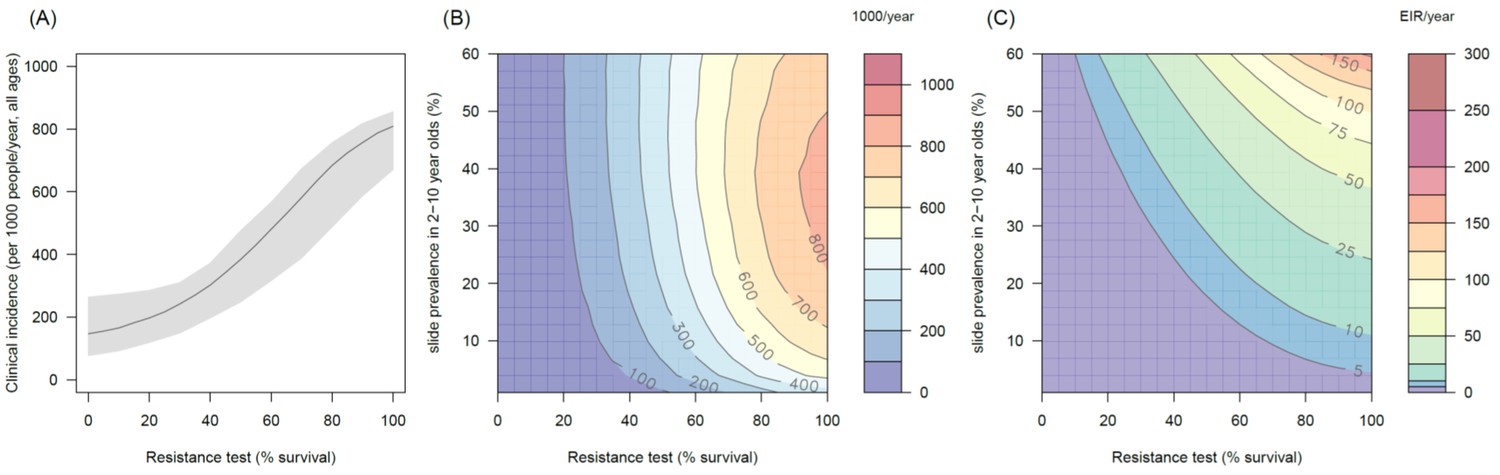
The predicted impact of pyrethroid resistance on the clinical incidence of malaria (Panels A and B) and the force of infection (Panel C) in an area with A. gambiae s.s. mosquitoes and 50% LLIN coverage.
Panel (A) shows how the number of clinical cases in the population increases with the population prevalence of pyrethroid resistance (as assessed by the percentage survival in a pyrethroid bioassay) for a single setting (with 10% slide prevalence). Solid lines show the average for the population whilst shaded grey area indicates the 95% credible intervals around this best fit line. Panel (B) shows the 3D relationship between prevalence of resistance (x-axis), endemicity (y-axis) and the absolute increase in the number of clinical cases (contours, see colour legend) per 1000 people (all ages). Panel (C) presents the same model as (B) though showing the absolute increase in the entomological inoculation rate (EIR, the average number of infectious bits per person per year). In all figures it is assumed that the mosquito species is Anopheles gambiae sensu stricto and that there is 50% LLIN coverage.
Figure 4—figure supplement 2
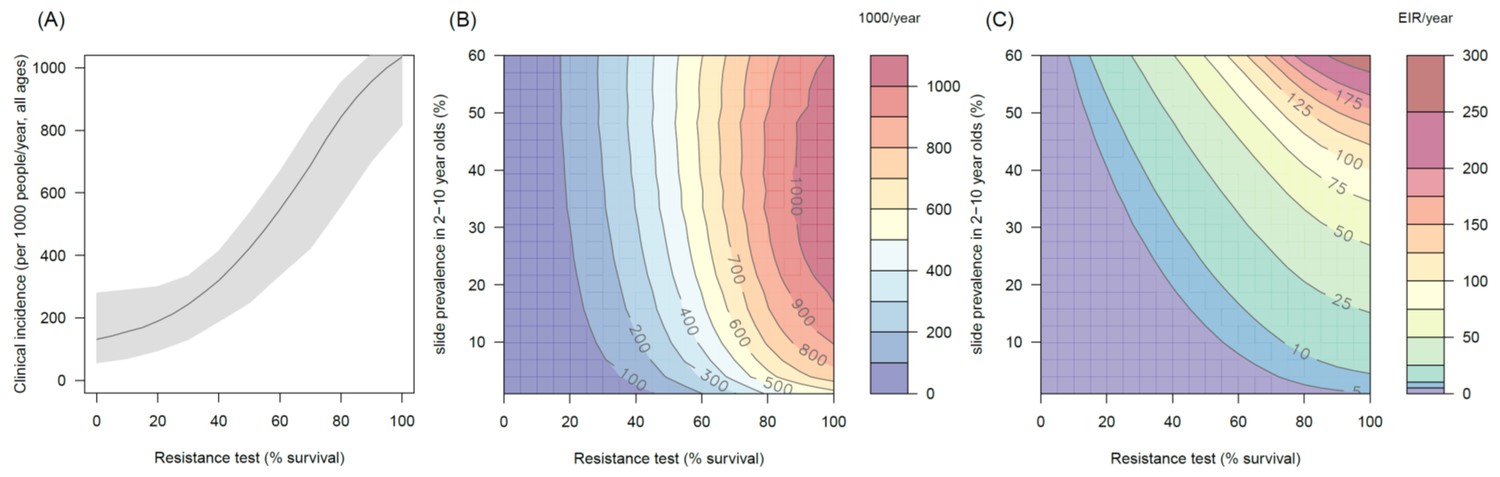
The predicted impact of pyrethroid resistance on the clinical incidence of malaria (Panels A and B) and the force ofinfection (Panel C) in an area with A. arabiensis mosquitoes and 80% LLIN coverage.
Panel (A) shows how the number of clinical cases in the population increases with the population prevalence of pyrethroid resistance (as assessed by the percentage survival in a pyrethroid bioassay) for a single setting (with 10% slide prevalence). Solid lines show the average for the population whilst shaded grey area indicates the 95% credible intervals around this best fit line. Panel (B) shows the 3D relationship between prevalence of resistance (x-axis), endemicity (y-axis) and the absolute increase in the number of clinical cases (contours, see colour legend) per 1000 people (all ages). Panel (C) presents the same model as (B) though showing the absolute increase in the entomological inoculation rate (EIR, the average number of infectious bits per person per year). In all figures it is assumed that the mosquito species is Anopheles arabiensis and that there is 80% LLIN coverage.
Figure 4—figure supplement 3
The predicted impact of pyrethroid resistance on the clinical incidence of malaria (Panels A and B) and the force of infection (Panel C) in an area with A. funestus mosquitoes and 80% coverage.
Panel (A) shows how the number of clinical cases in the population increases with the population prevalence of pyrethroid resistance (as assessed by the percentage survival in a pyrethroid bioassay) for a single setting (with 10% slide prevalence). Solid lines show the average for the population whilst shaded grey area indicates the 95% credible intervals around this best fit line. Panel (B) shows the 3D relationship between prevalence of resistance (x-axis), endemicity (y-axis) and the absolute increase in the number of clinical cases (contours, see colour legend) per 1000 people (all ages). Panel (C) presents the same model as (B) though showing the absolute increase in the entomological inoculation rate (EIR, the average number of infectious bits per person per year). In all figures it is assumed that the mosquito species is Anopheles funestus and that there is 80% LLIN coverage.
Figure 4—figure supplement 4
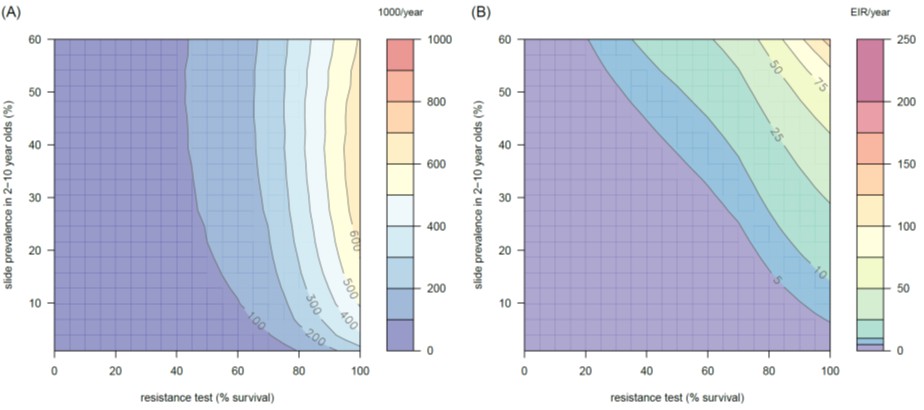
The predicted impact of pyrethroid resistance on (A) the clinical incidence of malaria and (B) the force of infection when pyrethroid resistance does not influence the rate of decay in LLIN insecticide activity over time (i.e. resistance has no impact on LLIN longevity).
Panel (A) shows the 3D relationship between population prevalence of resistance (x-axis), endemicity (y-axis) and the absolute increase in the number of clinical cases (contours, see legend) per 1000 people (all ages). Panel (B) presents the same model as (A) though showing the absolute increase in the entomological inoculation rate (EIR, the average number of infectious bits per person per year). These panels can be directly compared to panels (4B) and (4C) of the main text where pyrethroid resistant mosquitoes overcome the actions of the insecticide earlier.
Figure 4—figure supplement 5
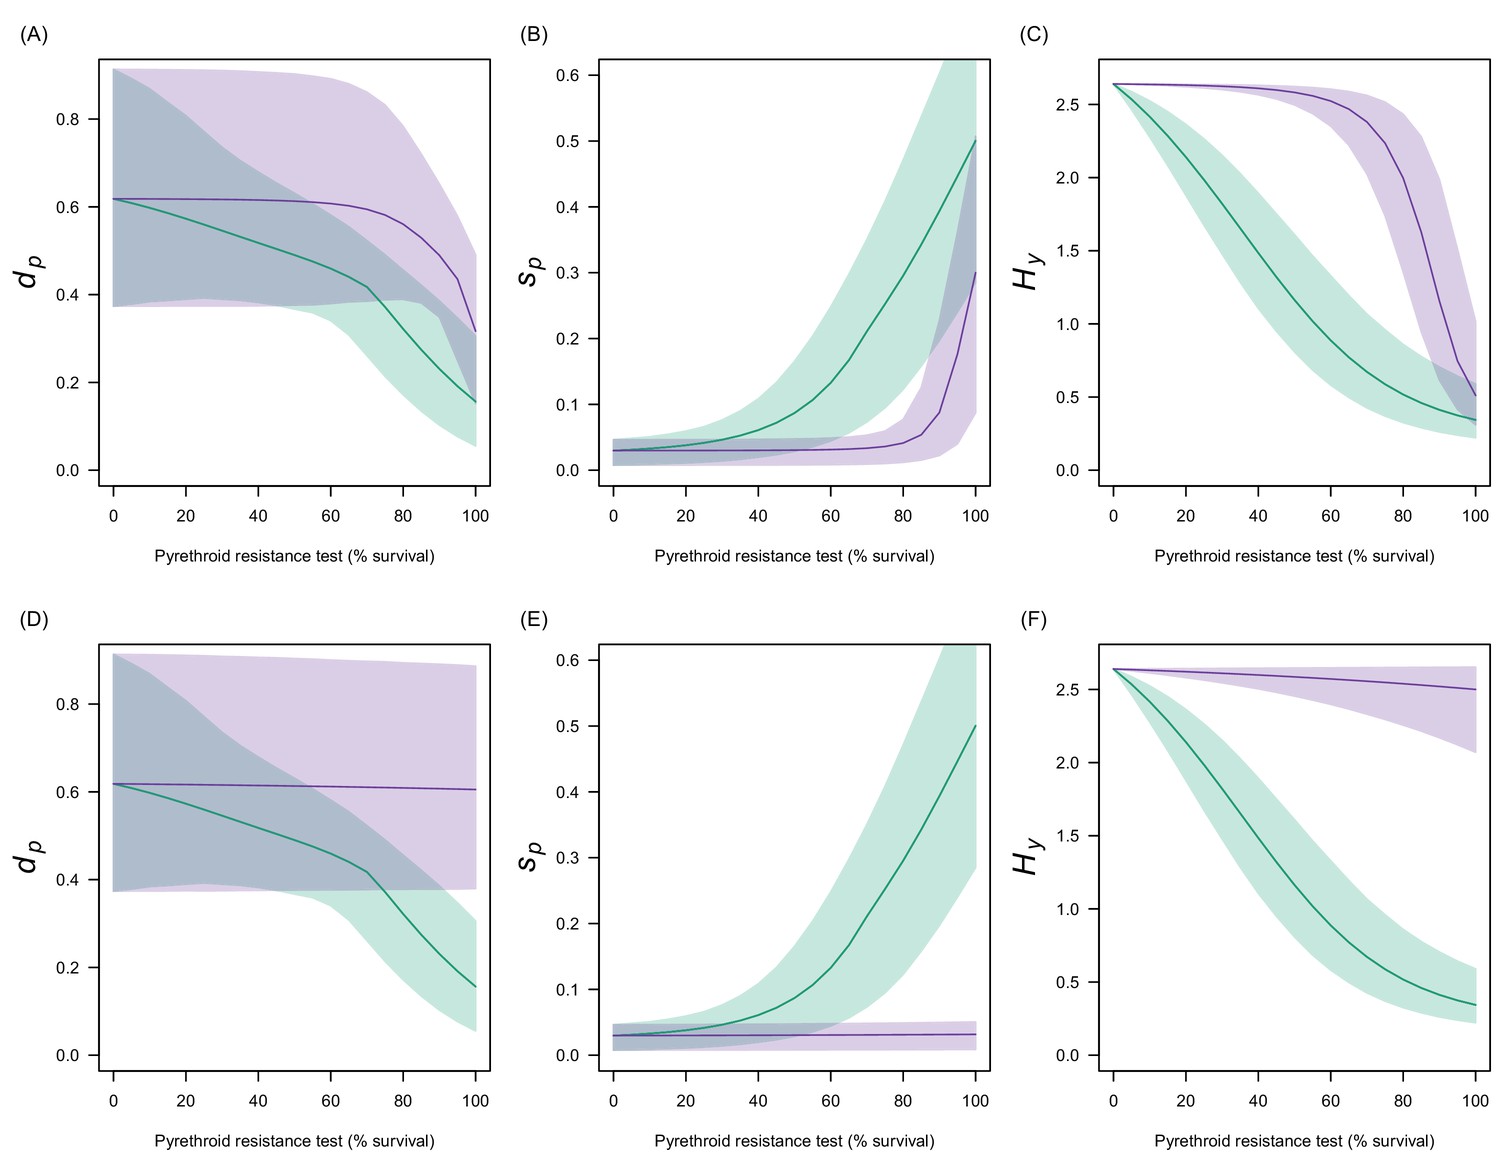
Estimates in the uncertainty of the three LLIN efficacy parameters for different levels of pyrethroid resistance.
Panels (A–C) show values for Anopheles gambiae senu lato whilst (D–F) show Anopheles funestus. (A) and (C) predict the proportion of mosquitoes dying per feeding attempt () whilst (B) and (C) show the proportion of mosquitoes which successfully feed and survive (). Panels (C) and (F) show how the estimated half-life of insecticide activity in years changes () with the pyrethroid resistance test. Green lines denote standard LLINs whilst purple lines indicate PBO LLINs. Solid line represents the best fit estimates whilst the shaded region gives the 95% credible intervals generated by sampling from the individual parameter posterior distributions used within the equation.
Figure 5 with 3 supplements
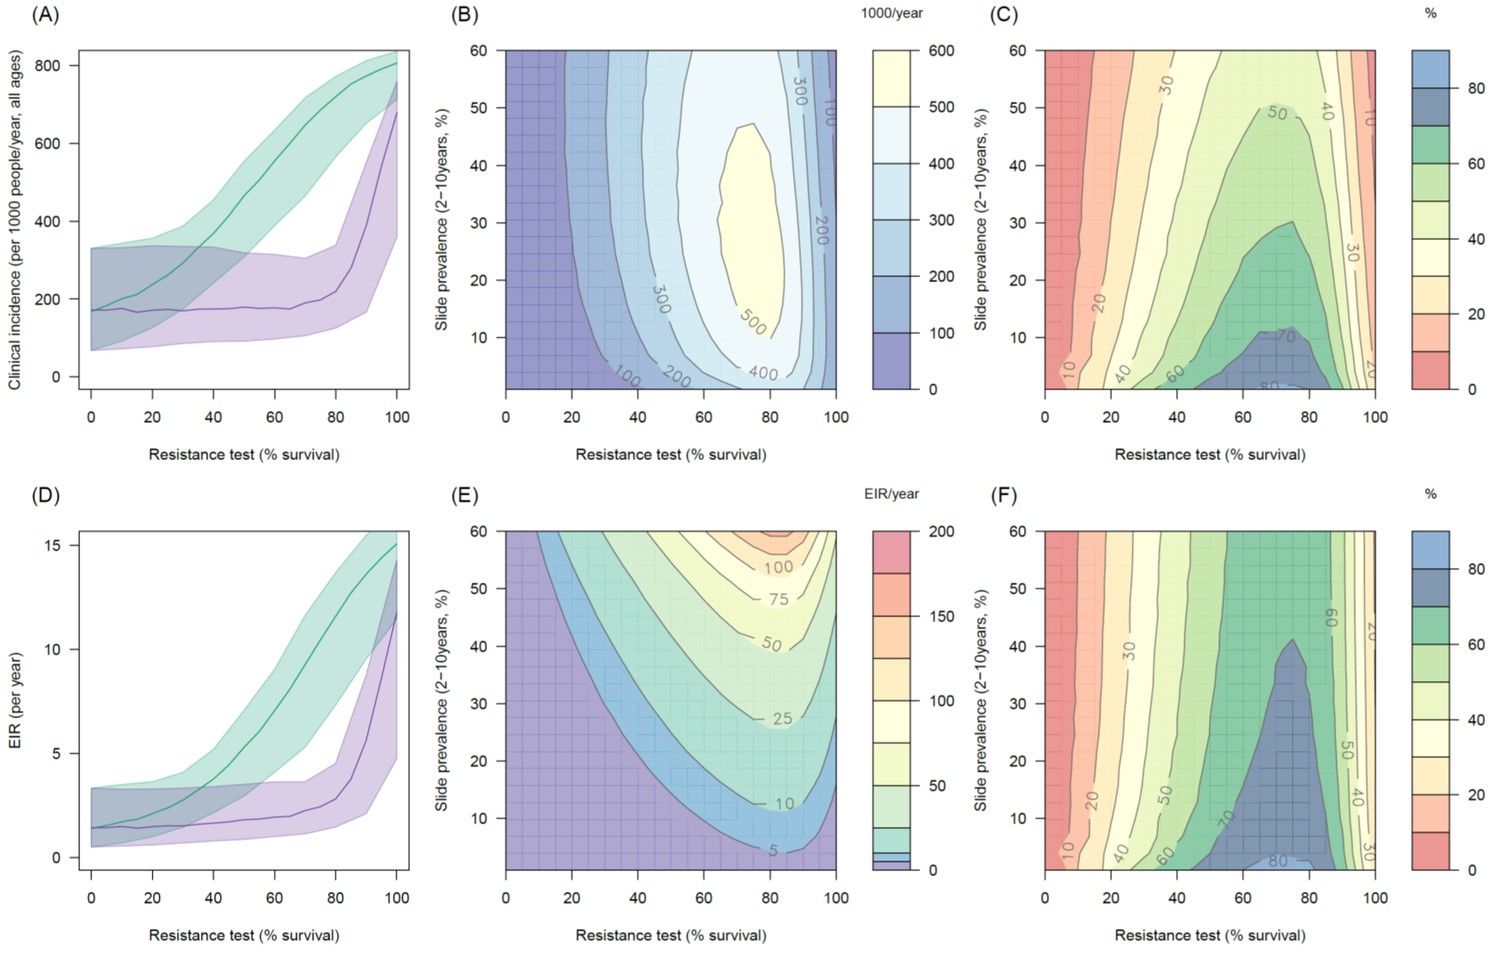
Predicting the added benefit of switching from standard LLINs to combination PBO nets.
Panels (A–C) show clinical incidence (per 1000 people per year, all ages) whilst Panels (D–F) gives the entomological inoculation rate (EIR, infectious bites received per person per year). (A) and (D) show how malaria incidence and the force of infection increase with the population prevalence of pyrethroid resistance (as assessed by the percentage survival in a pyrethroid bioassay) in a single setting (with 10% slide prevalence) for standard LLINs (green line) and PBO LLINs (purple line). Shaded region denotes the 95% credible intervals around the best fit lines. Panels (B) and (E) show the 3D relationship between the prevalence of resistance (x-axis), endemicity (y-axis) and the absolute number of cases (and EIR) averted by switching to PBO LLINs. (C) and (F) give 3D relationship for the percentage reduction in cases and EIR (respectively) caused by switching from standard to PBO LLINs. The non-linear relationship between endemicity, clinical incidence and EIR means that the greatest percentage reduction is seen at low endemicities despite the greatest absolute reduction being in higher transmission settings. In all Panels it is assumed that the mosquito species is Anopheles gambiae sensu stricto and that there is 80% LLIN coverage. Figure 5—figure supplement 1 shows the same figure with 50% LLIN coverage. Further secondary figures indicate how the impact of resistance changes with mosquito species, be it Anopheles arabiensis (Figure 5—figure supplement 2) or Anopheles funestus (Figure 5—figure supplement 3).
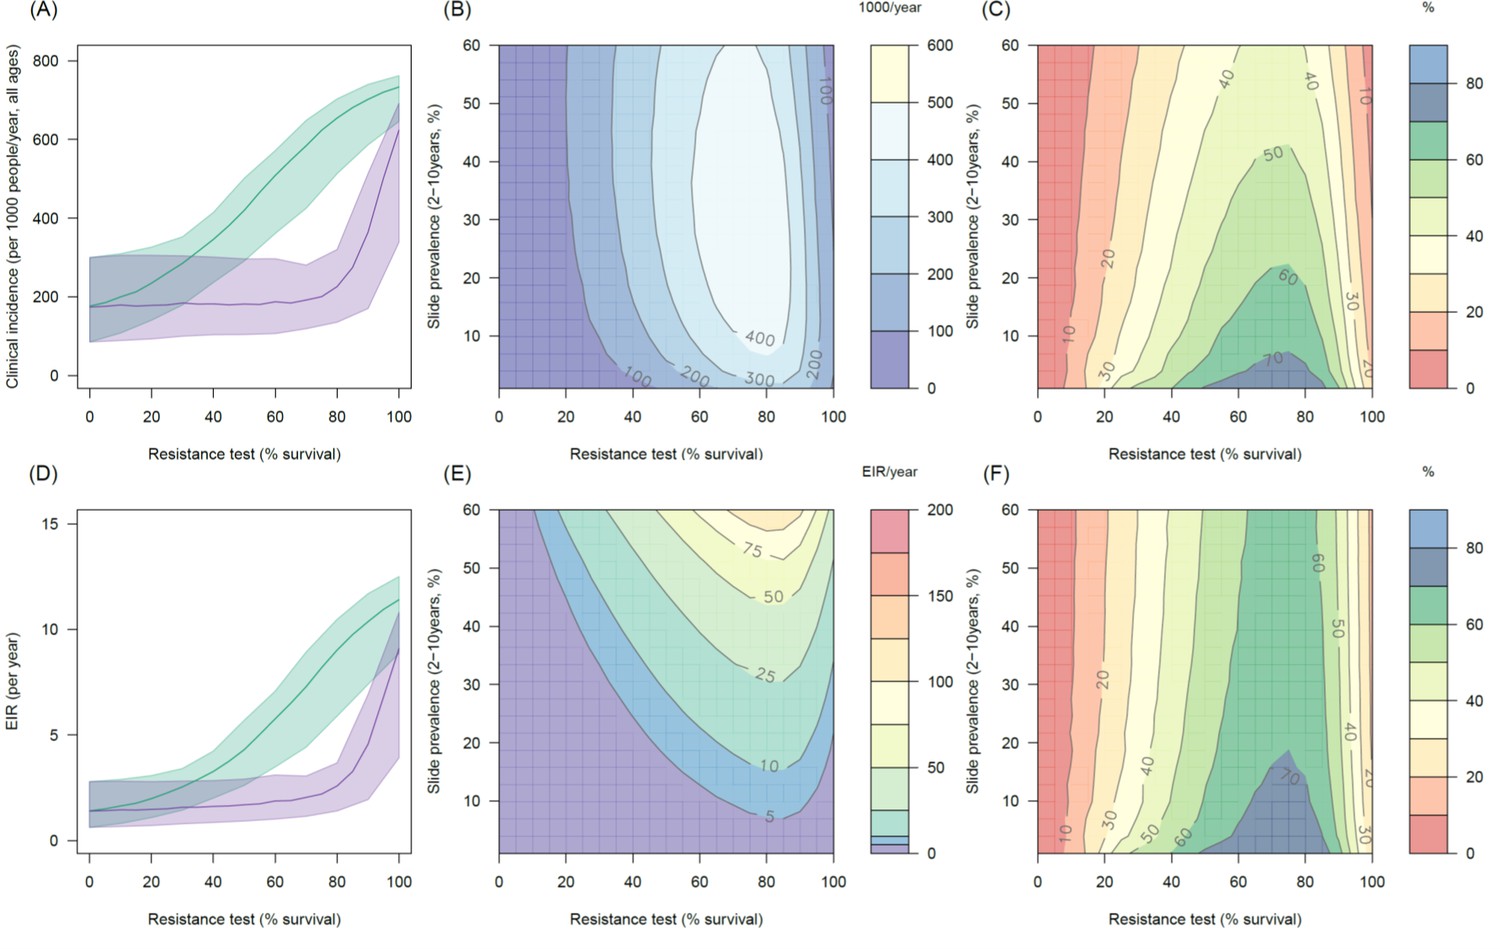
Figure 5—figure supplement 1

Predicting the added benefit of switching from standard LLINs to combination PBO nets in an area with A. gambiae s.s. mosquitoes and 50% LLIN coverage.
Panels (A–C) show clinical incidence (per 1000 people per year, all ages) whilst Panels (D–F) gives the entomological inoculation rate (EIR, infectious bites received per person per year). (A) and (D) shows how malaria incidence and the force of infection increases with the population prevalence of pyrethroid resistance (as assessed by the percentage survival in a pyrethroid bioassay) in a single setting (with 10% slide prevalence) for standard LLINs (green line) and PBO LLINs (purple line). Panels (B) and (E) show the 3D relationship between the prevalence of resistance (x-axis), endemicity (y-axis) and the absolute number of cases (and EIR) averted by switching to PBO LLINs. (C) and (F) give 3D relationship for the percentage reduction in cases (and EIR) caused by switching from standard to PBO LLINs. The non-linear relationship between endemicity, clinical incidence and EIR means that the greatest percentage reduction is seen at low endemicities despite the greatest absolute reduction being in higher transmission settings. In all figures it is assumed that the mosquito species is Anopheles gambiae sensu stricto and that there is 50% LLIN coverage.
Figure 5—figure supplement 2
Predicting the added benefit of switching from standard LLINs to combination PBO nets in an area with A. arabiensis mosquitoes and 80% LLIN coverage.
Panels (A–C) show clinical incidence (per 1000 people per year, all ages) whilst Panels (D–F) gives the entomological inoculation rate (EIR, infectious bites received per person per year). (A) and (D) shows how malaria incidence and the force of infection increases with the population prevalence of pyrethroid resistance (as assessed by the percentage survival in a pyrethroid bioassay) in a single setting (with 10% slide prevalence) for standard LLINs (green line) and PBO LLINs (purple line). Panels (B) and (E) show the 3D relationship between the prevalence of resistance (x-axis), endemicity (y-axis) and the absolute number of cases (and EIR) averted by switching to PBO LLINs. (C) and (F) give 3D relationship for the percentage reduction in cases (and EIR) caused by switching from standard to PBO LLINs. The non-linear relationship between endemicity, clinical incidence and EIR means that the greatest percentage reduction is seen at low endemicities despite the greatest absolute reduction being in higher transmission settings. In all figures it is assumed that the mosquito species is Anopheles arabiensis and that there is 80% LLIN coverage.
Figure 5—figure supplement 3
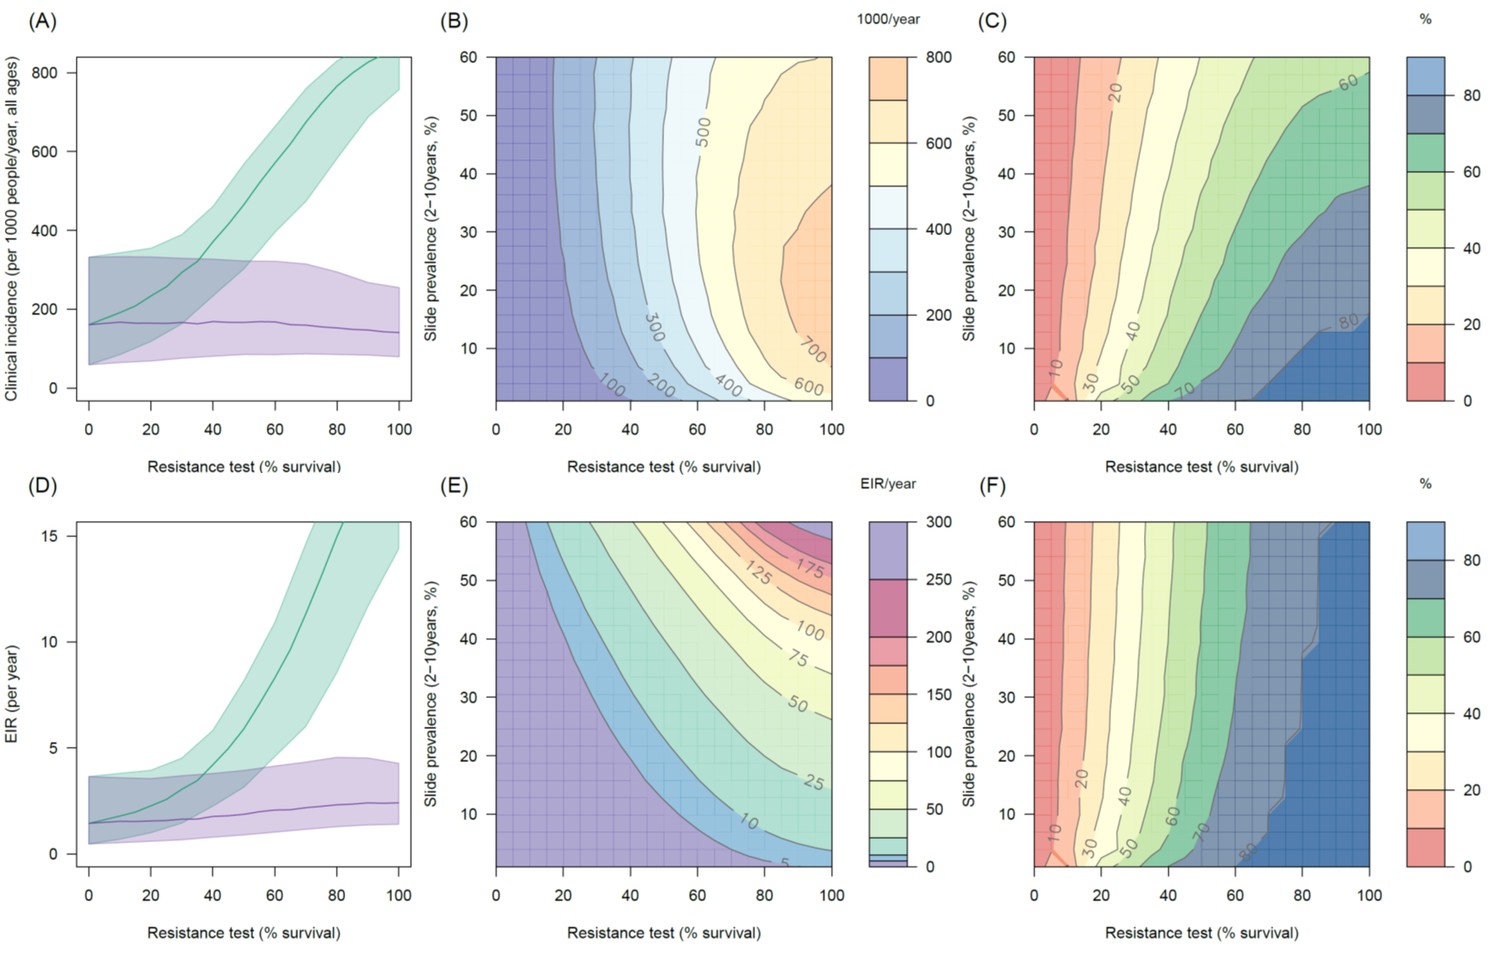
Predicting the added benefit of switching from standard LLINs to combination PBO nets in an area with A. funestus mosquitoes and 80% LLIN coverage.
Panels (A–C) show clinical incidence (per 1000 people per year, all ages) whilst Panels (D–F) gives the entomological inoculation rate (EIR, infectious bites received per person per year). (A) and (D) shows how malaria incidence and the force of infection increases with the population prevalence of pyrethroid resistance (as assessed by the percentage survival in a pyrethroid bioassay) in a single setting (with 10% slide prevalence) for standard LLINs (green line) and PBO LLINs (purple line). Panels (B) and (E) show the 3D relationship between the prevalence of resistance (x-axis), endemicity (y-axis) and the absolute number of cases (and EIR) averted by switching to PBO LLINs. (C) and (F) give 3D relationship for the percentage reduction in cases (and EIR) caused by switching from standard to PBO LLINs. The non-linear relationship between endemicity, clinical incidence and EIR means that the greatest percentage reduction is seen at low endemicities despite the greatest absolute reduction being in higher transmission settings. In all figures it is assumed that the mosquito species is Anopheles funestus and that there is 80% LLIN coverage.
Tables
Table 1
Summary of data collated in the three meta-analyses. The number of data points is subdivided according to the insecticides or LLIN tested and the predominant mosquito species in each population tested. Studies which did not determine species in the Anopheles gambiae complex are shown separately. All Published Data can be downloaded from Dryad Digital Repository whilst a list of the studies included their geographical range are given in the Material and methods.
| Meta-analysis description | Details | No. Studies | Number data points | |||||
|---|---|---|---|---|---|---|---|---|
| Anopheles gambiae s.s. | Anopheles arabiensis | Anopheles gambiae s.l. | Anopheles funestus | Total | ||||
| M1 | Bioassay and experimental hut trial mortality | Deltamethrin | 5 | 2 | 1 | 10 | 0 | 13 |
| Permethrin | 8 | 2 | 1 | 3 | 0 | 6 | ||
| Other | 1 | 0 | 0 | 1 | 1 | 2 | ||
| Total | 13 | 4 | 2 | 14 | 1 | 21 | ||
| M2 | Impact of PBO in pyrethroid bioassays | Deltamethrin | 16 | 15 | 5 | 29 | 8 | 57 |
| Permethrin | 20 | 22 | 7 | 30 | 9 | 68 | ||
| Other | 4 | 2 | 0 | 4 | 6 | 12 | ||
| Total | 24 | 39 | 12 | 63 | 23 | 137 | ||
| M3 | Experimental hut trials of standard and PBO LLINS | Olyset | 6 | 6 | 0 | 10 | 0 | 16 |
| PermaNet | 6 | 18 | 4 | 6 | 0 | 28 | ||
| Total | 12 | 24 | 4 | 16 | 0 | 44 | ||
Table 2
Inclusion and exclusion criteria used when conducting literature searches of published and grey literature. Pre-defined search string used are listed in Figure 2—source data 1.
| Inclusion criteria | Exclusion criteria |
|---|---|
| General criteria across all meta-analyses | |
| – Mosquito belong to the A. gambiae complex or A. funestus group – Study conducted in Africa – Bioassay must be of the standard dose for the particular pyrethroid (WHO, 2013a, 2013b; Brogdon, 2010) – Net must be a pyrethroid LLIN | – Studies which report percentage mortality but not the numbers tested / caught† – Experimental hut trials which do not have adequate design to reduce bias (i.e. treatments arms were not rotated between huts; sleeper bias unaccounted for by preliminary testing; randomisation or rotation; huts were not cleaned between treatments) – Experimental huts of the Ifakara design‡ |
| M1 – Bioassay and experimental hut trial mortality | |
| – Mosquito mortality measured in both an experimental hut study and separate bioassay (e.g. WHO tube assay, WHO cone assay, CDC bottle assay) | – Cone assays where the net had been washed |
| M2 – Impact of PBO in pyrethroid bioassays | |
| – adult mosquito stage exposure to PBO | |
| M3 – Experimental hut trials of standard and PBO LLINS | |
| – Study compares a combination LLIN (PermaNet 3.0 or Olyset Plus) with a conventional LLIN (PermaNet 2.0 or Olyset Net)* – LLINs should be holed (Six 4 × 4 cm holes) | – Studies without both standard and PBO LLINs as non-parallel studies as studies from different sites may bias the difference between LLINs – Trials without untreated control nets – Studies which did not include feeding success |
-
* currently there are only two commercially available LLINs with PBO, PermaNet 3.0 (Vestergaard-Frandsen) and Olyset Plus (Sumitomo Chemicals Ltd). To limit the difference between LLIN types only nets made by the same manufacturer are directly compared.
-
† to increase the size of the bioassay dataset the authors of papers which failed to give sample sizes were contacted directly.
-
‡ The probability that a mosquito will die in an experimental hut will depend on the hut design. To minimise the difference between studies, the most common design of hut is used, excluding the small number of studies which use the new Ifakara design (eg. Okumu et al., 2013).
Table 3
List of studies identified in meta-analysis M1 - Predicting LLIN effectiveness from bioassay mortality. Pre-defined search string used in the meta-analyses are listed in Figure 2—source data 1 whilst raw data from are provided in Figure 2—source data 2.
| Study | Reference | Test | Country |
|---|---|---|---|
| 1 | Ngufor et al. (2014a) | WHO tube | Côte d'Ivoire |
| 2 | Ngufor et al. (2014b) | WHO tube | Benin |
| 3 | Kitau et al. (2014) | WHO tube | Tanzania |
| 4 | Asale et al. (2014) | WHO tube | Ethiopia |
| 5 | Ngufor et al. (2014c) | WHO tube | Burkina Faso |
| 6 | Agossa et al. (2014) | WHO tube | Benin |
| 7 | Malima et al. (2013) | WHO tube | Tanzania |
| 8 | Adeogun et al. (2012b) | WHO tube | Nigeria |
| 9 | Koudou et al. (2011) | WHO tube | Côte d'Ivoire |
| 10 | Corbel et al. (2010) | WHO tube | Benin, Burkina Faso, Cameroon |
| 11 | Tungu et al. (2010) | WHO tube | Tanzania |
| 12 | Malima et al. (2008) | WHO tube | Tanzania |
| 13 | Kétoh (2016) | WHO tube | Togo |
| 14 | Toé (2015) | WHO tube | Burkina Faso |
Table 4
List of studies identified in meta-analysis M2 - Estimating the impact of PBO in pyrethroid bioassays. Bioassays run using laboratory strains are denoted. * Pre-defined search string used in the meta-analyses are listed in Figure 2—source data 1 whilst raw data from are provided in Figure 2—source data 3.
| Study | Reference | Test | Country |
|---|---|---|---|
| 1 | Matowo et al. (2015) | CDC tube | Tanzania |
| 2 | Farnahm (1998) | WHO tube | Uganda & Kenya |
| 3 | Choi et al. (2014) | WHO tube | Zambia & Zimbabwe |
| 4 | Edi et al. (2014) | WHO tube | Côte d'Ivoire |
| 5 | Jones et al. (2013) | WHO tube | Zanzibar |
| 6 | Chouaïbou et al. (2014) | WHO tube | Côte d'Ivoire |
| 7 | Koffi et al. (2013) | WHO tube | Côte d'Ivoire |
| 8 | Witzig et al. (2013) | WHO tube | Chad |
| 9 | Darriet and Chandre (2013) | WHO tube | * |
| 10 | Mawejje et al. (2013) | WHO tube | Uganda |
| 11 | Adeogun et al. (2012b) | WHO tube | Nigeria |
| 12 | Nardini et al. (2012) | WHO tube | Nigeria |
| 13 | Darriet and Chandre (2011) | WHO tube | South Africa & Sudan |
| 14 | Kloke et al. (2011) | WHO cone | * |
| 15 | Awolola et al. (2009) | WHO tube | Mozambique |
| 16 | Brooke et al. (2001) | WHO tube | Nigeria |
| 17 | N’Guessan et al. (2010) | WHO tube | Mozambique |
| 18 | Ranson (2015) Personal Communication | WHO tube | Burkina Faso/Benin |
| 19 | Ranson (2015) Personal Communication | WHO tube | Chad colony |
| 20 | Morgan (2015) Personal Communication | WHO tube | Côte d'Ivoire |
| 21 | Ranson (2015) Personal Communication | WHO tube | Benin |
| 22 | Koudou & Malone (2015) Personal Communication | WHO cone | Côte d'Ivoire |
| 23 | PMI (2014). Personal Communication | CDC tube | Mali |
| 24 | Toé (2015) | WHO tube | Burkina Faso |
| 25 | Abílio et al. (2015) | WHO cone | Mozambique |
| 26 | Riveron et al. (2015) | WHO cone | Malawi |
| 27 | Awolola et al. (2014) | WHO cone | Nigeria |
| 28 | Yewhalaw et al. (2012) | WHO cone | Ethiopia |
Table 5
List of studies identified in meta-analysis M3 - Estimating the impact of PBO in experimental hut trials. Pre-defined search string used in the meta-analyses are listed in Figure 2—source data 1 whilst raw data from published studies are provided at doi:10.5061/dryad.13qj2.
| Study | Reference | Country |
|---|---|---|
| 1 | Pennetier et al. (2013) | Benin, Cameroon |
| 2 | Adeogun et al. (2012a)) | Nigeria |
| 3 | Corbel et al. (2010) | Benin, Burkina Faso, Cameroon |
| 4 | Tungu et al. (2010) | Tanzania |
| 5 | N'Guessan et al. (2010) | Benin |
| 6 | Kétoh et al., Unpublished | Togo |
| 7 | Tungu et al., Personal Communication | Tanzania |
| 8 | Toé et al., Personal Communication | Burkina Faso |
Table 6
Parameter definitions and fitted values. Unless otherwise stated, all other parameters used were taken from Griffin et al. (2010). Some parameters are mosquito species-specific whilst others are constant within a species complex (denoted *) or universal (species independent $).
| Parameter definitions | Anopheles gambiae s.s. | Anopheles arabiensis | Anopheles funestus | |
|---|---|---|---|---|
| proportion mosquitoes dying in a discriminating dose pyrethroid bioassay | - | |||
| population prevalence of pyrethroid resistance (percentage survival) estimated using (Equation [1]) | - | |||
| net type under investigation in experimental hut trials: untreated (); standard LLIN (); PBO LLIN (). | - | |||
| probability a mosquito dies during single feeding attempt (Equation [18]) | Estimated from parameters below | |||
| probability a mosquito exits the hut during single feeding attempt (Equation [17]) | Estimated from parameters below | |||
| probability a mosquito feeds during single feeding attempt (Equation [19]) | Estimated from parameters below | |||
| the number of mosquitoes entering a hut with net type (Equation [3]) | - | |||
| proportion of mosquitoes entering a hut with an LLIN to relative to a hut with an untreated bed net (, Equation [8])$. | = 0.071 = 1.26 = 1.52 | |||
| proportion of mosquitoes that enter a hut with net type that die (Equation [2])$ | = 0.63 = 4.00 | |||
| proportion of mosquitoes that enter a hut with net type that successfully feed and survive (Equation [11])$ | = 0.02 = 3.32 | |||
| proportion of mosquitoes that enter a hut with net type that exit without feeding | ||||
| rate of decay in insecticide activity (in washes) for net type (Equation [16])$ | = −2.36 = −3.05 | |||
| proportion of mosquitoes killed in pyrethroid + PBO bioassay (Equation [4])* | = 3.41, = 5.88, = 0.78 | = 2.53 = 0.89 | ||
| constant used to centre the data to aid the fitting process | 0.5 | |||
Relevant parameters previously estimated by Griffin et al. (2010)† and Walker et al. (2015)‡ | ||||
| proportion of mosquitoes that enter a hut with no bednet that successfully feed$ | 0.70† | |||
| insecticide activity half-life in years for a susceptible mosquito population$ | 2.64† | |||
| proportion of mosquitoes which exit the hut when LLIN has no insecticidal activity | 0.24† | 0.24‡ | 0.24† | |
| - | mean life expectancy (days) | 7.6† | 7.6‡ | 8.9† |
| - | proportion blood meals taken on humans without LLINs (human blood index) | 0.92† | 0.71‡ | 0.94† |
| - | proportion of bites taken on humans whilst they are in bed | 0.89† | 0.83‡ | 0.90† |
Additional files
-
Source code 1
All OPENBUGS code used to fit the functional relationships between variables are included below.
- https://doi.org/10.7554/eLife.16090.028
Download links
A two-part list of links to download the article, or parts of the article, in various formats.
Downloads (link to download the article as PDF)
Open citations (links to open the citations from this article in various online reference manager services)
Cite this article (links to download the citations from this article in formats compatible with various reference manager tools)
The impact of pyrethroid resistance on the efficacy and effectiveness of bednets for malaria control in Africa
eLife 5:e16090.
https://doi.org/10.7554/eLife.16090


