Development of pacemaker properties and rhythmogenic mechanisms in the mouse embryonic respiratory network
- Université de Bordeaux, France
- Washington and Lee University, United States
Figures
Figure 1

Functional isolation of embryonic inspiratory pacemaker neurons.
(A) left, Schematic representation of an in vitro embryonic slice preparation used for making electrophysiological macroelectrode recording of preBötC network activity on one side simultaneously with calcium imaging of the contralateral inspiratory network (red square). Right, Image of fluorescence expression by a Ca2+-dye loaded slice obtained with a 40X objective. Numbered yellow circles indicate rhythmically active neurons. (B) Simultaneous recordings of inspiratory population electrical activity (integrated trace in violet, Int preBötC) and calcium transients (ΔF/F, black and red traces) in 16 individual neurons (numbered 1 to 16). All the cells displayed fluorescent changes synchronized to rhythmic electrical activity recorded on the contralateral side in control conditions. (C) After blockade of chemical synapses by a bath- applied cocktail of CNQX (20 µM), AP5 (10 µM), strychnine (1 µM) and bicuculline (10 µM), neurons that remained rhythmically active (red traces) were considered to be pacemakers while those falling silent were considered as non-pacemaker cells (black traces).
Figure 2
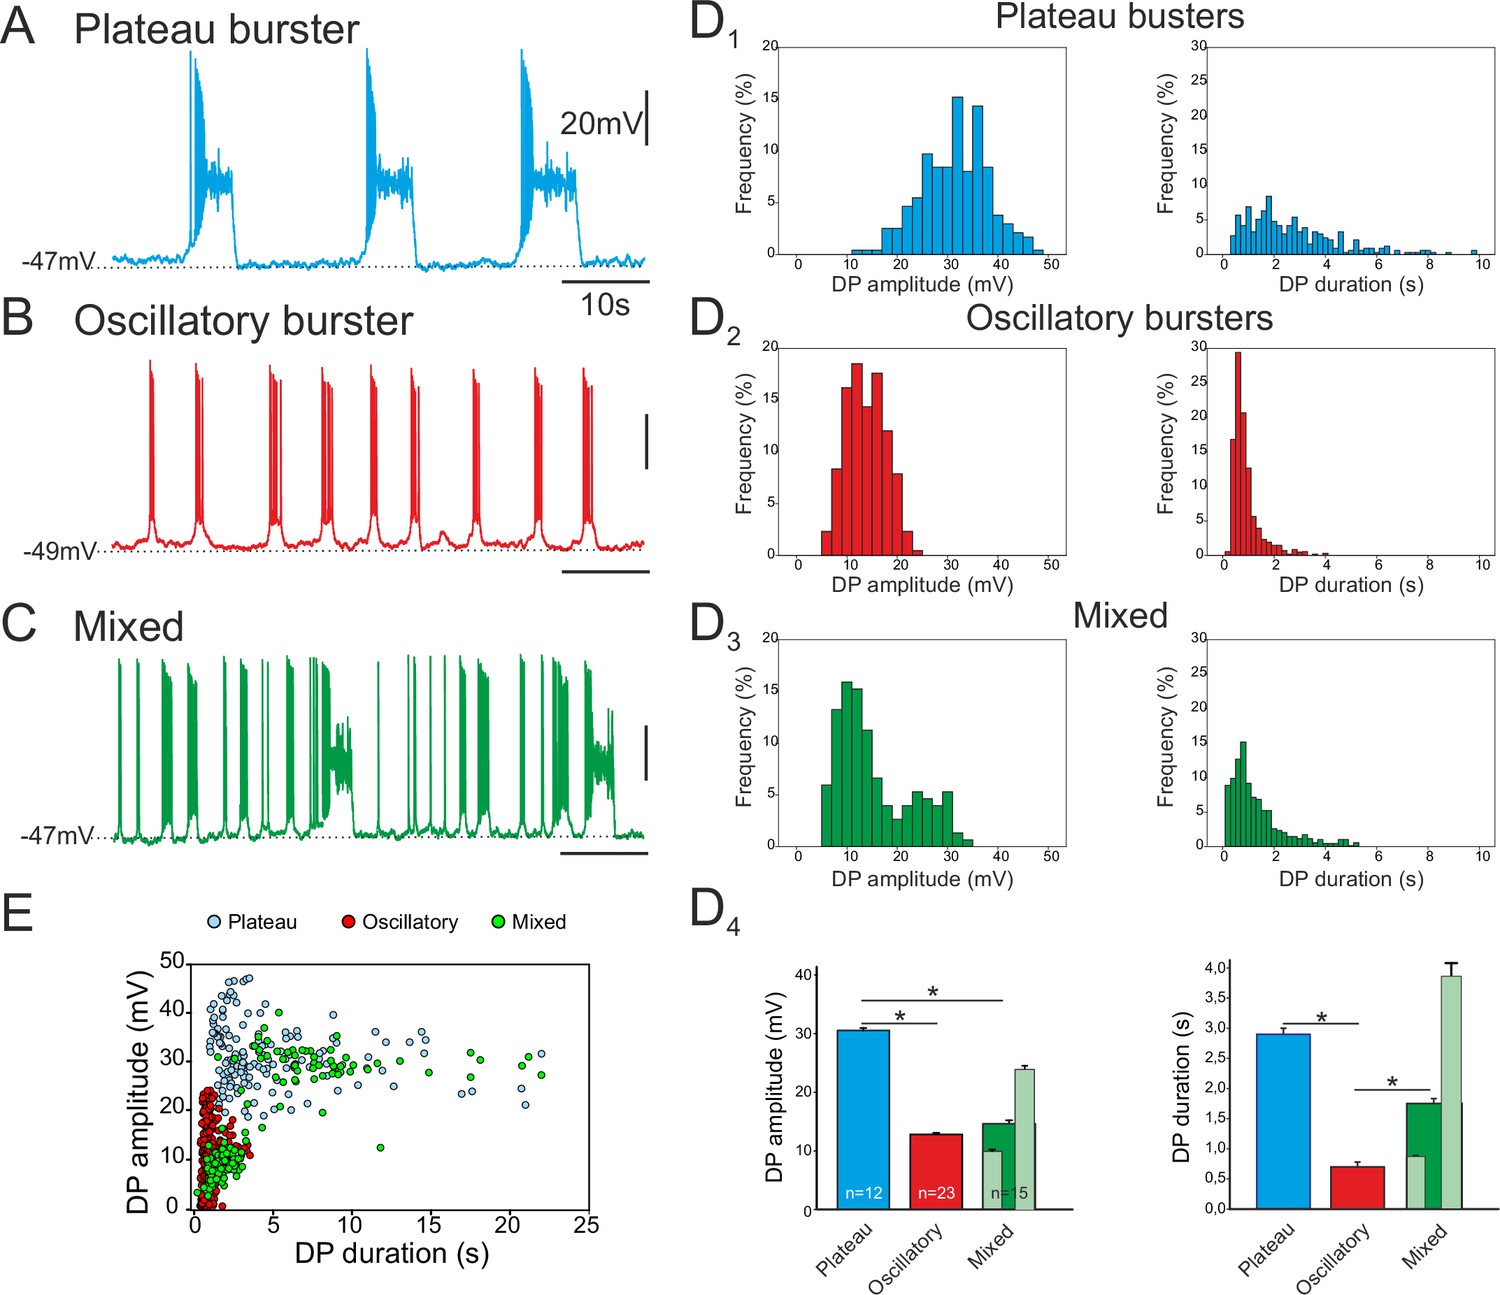
Different discharge patterns expressed by embryonic inspiratory pacemaker neurons.
Patch-clamp recordings of individual pacemaker neurons from three different preparations expressing spontaneous plateau (A), oscillatory (B) or mixed plateau/oscillatory (C) burst firing patterns. (D) Histograms showing frequency distributions of the burst-generating dirve potential (DP) amplitude (D1–3, left column) and duration (D1–3, right column) for the three types of pacemaker neurons. D4: Histograms representing mean DP amplitude ± SEM (left) and mean DP duration ± SEM (right) for pacemaker neurons expressing plateau-like (blue bars), burst-like (red bars) or mixed (green bars; light green bars correspond to short-lasting and long-lasting bursts when grouped separately) activity. Asterisks indicate significant differences (Mann-Whitney test; p<0.001), while numbers of neurons analyzed for each pacemaker phenotype are indicated in the corresponding bar. (E) Distribution plot for DP duration vs DP amplitude measured for neurons recorded for 8 to 10 min (blue, plateau bursting pacemakers (n = 8); red, oscillatory bursting pacemakers (n = 5); green, mixed pacemakers (n = 5). Note that the latter expressed two types of burst duration/amplitude relationship that overlapped with either the purely plateau or oscillatory bursters.
Figure 3
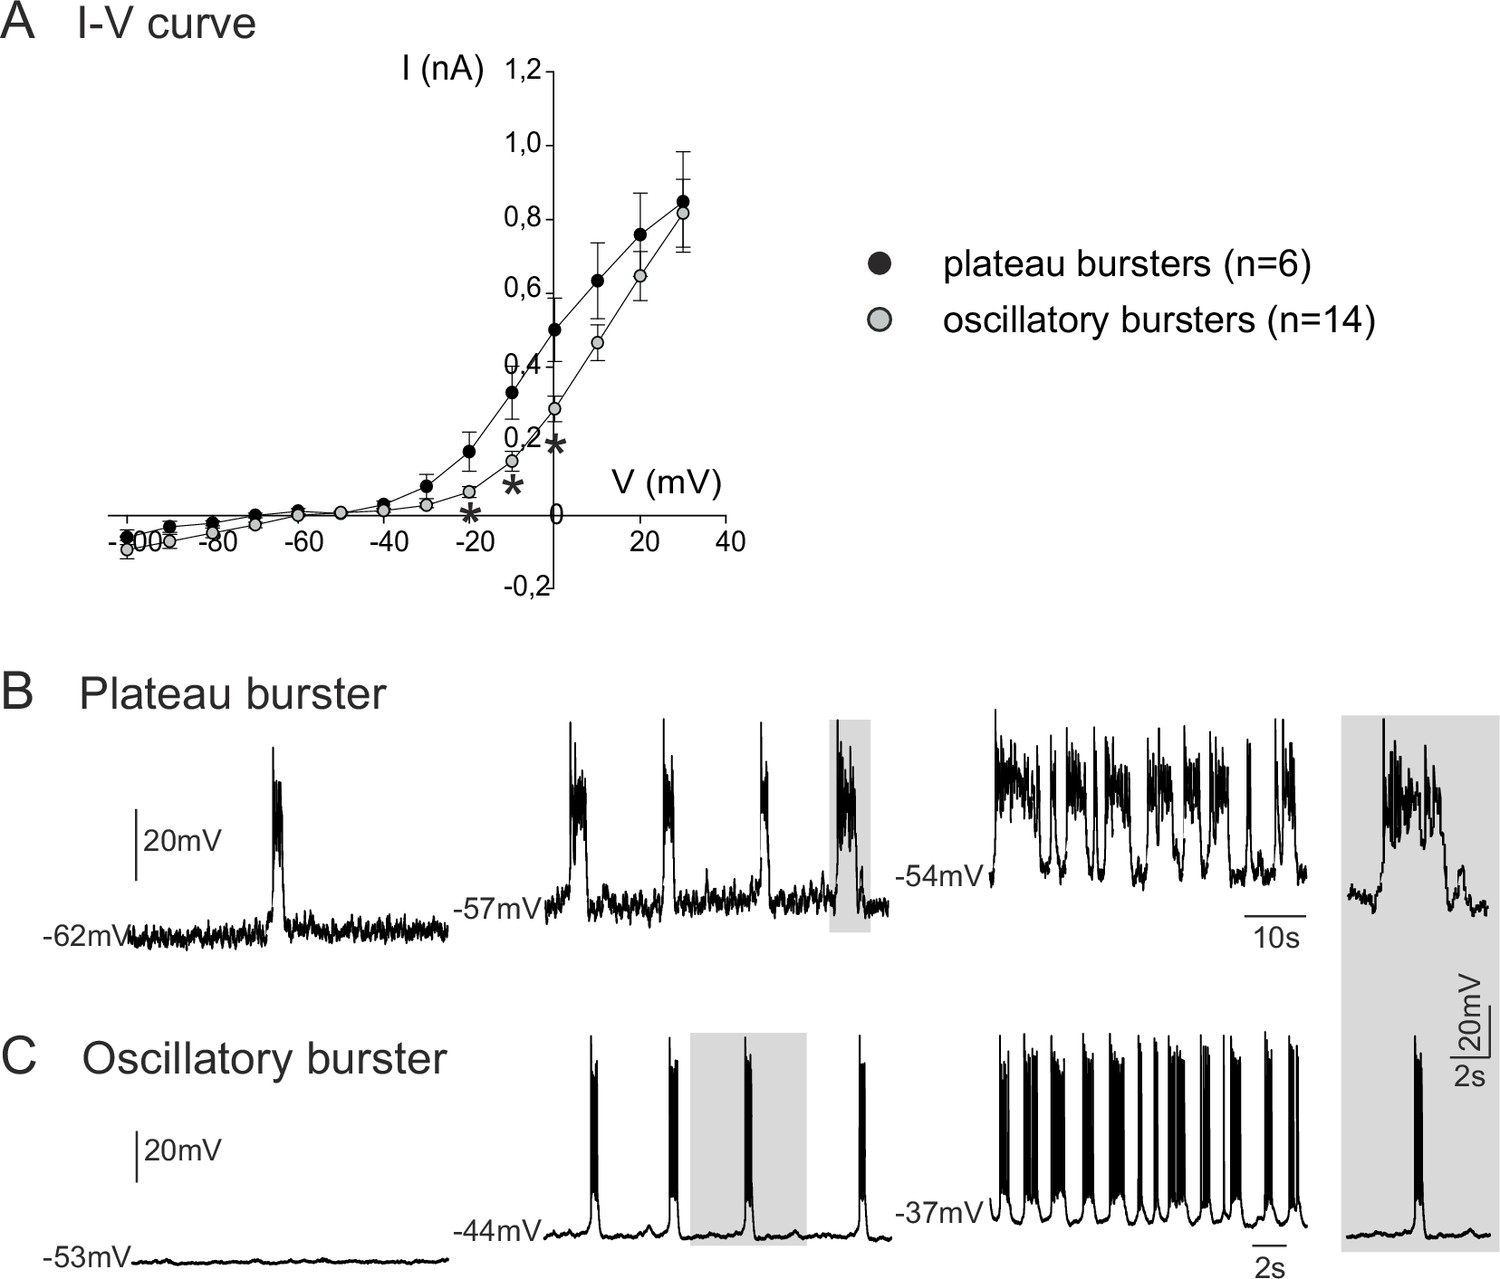
Voltage-dependence of pacemaker neuron properties.
(A) Current-voltage (I-V) relationships for plateau (black circles) and oscillatory bursting (open circles) pacemaker neurons. Individual circles indicate mean (± SEM) current response to an injected step-change voltage pulse; n = number of neurons analyzed for each pacemaker phenotype. Asterisks indicate statistically different values (t-test; p<0.001). (B,C) Patch-clamp recordings of plateau (B) and oscillatory bursting (C) pacemaker neurons displaying cycle frequencies that varied with membrane voltage when held at different indicated membrane potential levels with continuous depolarizing current injection. Right inset: A single burst (indicated by shading) in each pacemaker neuron subtype displayed at the same time scale for burst duration comparison.
Figure 4

Membrane conductances underlying the different discharge patterns.
Patch-clamp recordings of plateau (A), oscillatory (B) and mixed (C) bursting pacemaker neurons in control conditions (top traces), in the presence of either 10 µM Ril or 50 µM FFA (middle traces) or in the presence of 10 µM Ril + 50 µM FFA (bottom traces). The left and right panels in A illustrate two different plateau bursters under different indicated pharmacological treatments. Rhythmic burst activity of the plateau pacemaker was mostly affected (i.e., reduced) by blockade of ICAN channels with FFA (A), whereas the oscillatory pacemaker activity was more sensitive to persistent sodium channel (INaP) blockade with Ril (B). Correspondingly, longer duration plateau driven discharge in the mixed pacemaker phenotype was blocked with FFA alone, whereas remaining short-duration oscillatory bursts were blocked by the addition of Ril (C). Shaded activity at right of each trace: recording excerpts on expanded time-scale to facilitate comparison.
Figure 5
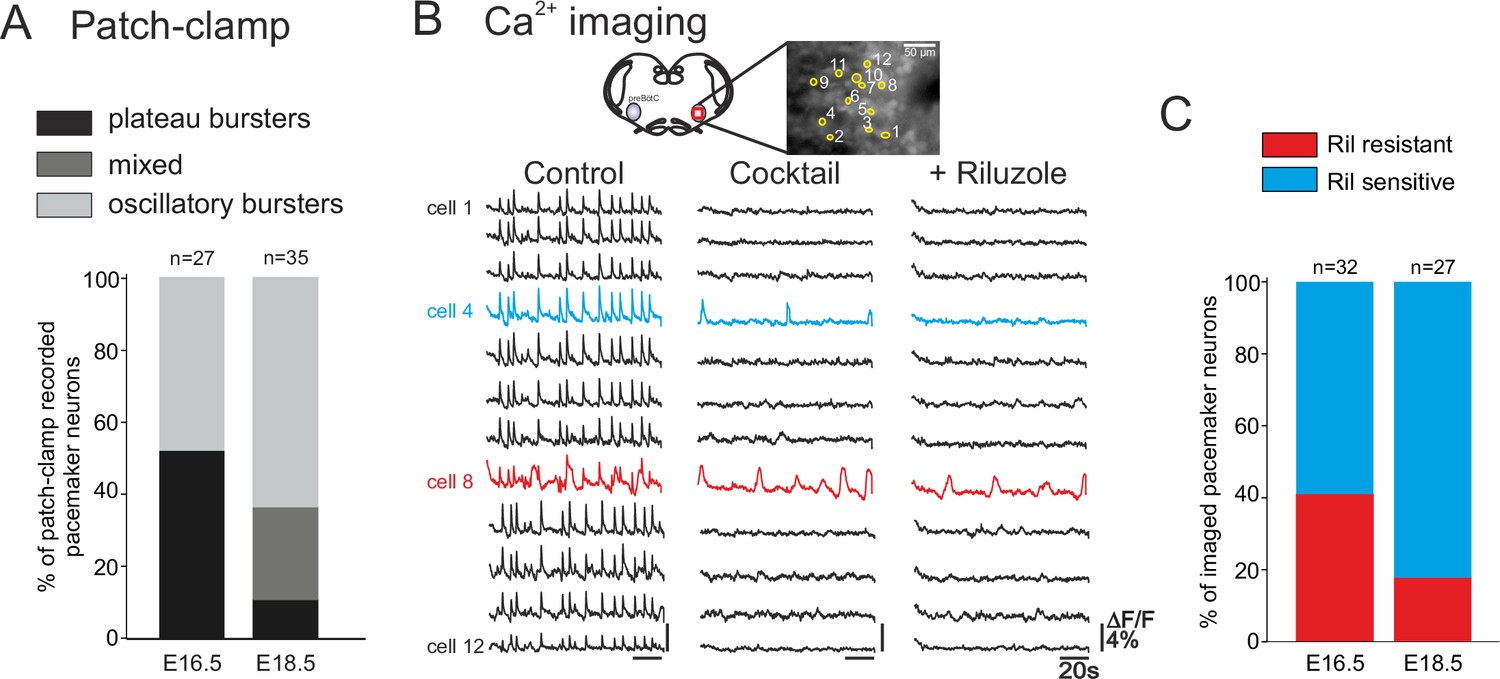
Developmental changes in inspiratory network pacemaker composition.
(A) Bar histograms indicating the mean proportions (as% ) of individual pacemaker neuron subtypes recorded with patch-clamp at E16.5 (n = 27) and E18.5 (n = 35). Plateau bursting neurons, black shading; mixed plateau/oscillatory bursters, dark gray; oscillatory bursting neurons, light gray. (B) Calcium imaging protocol (see also Figure 1) to test the sensitivity of the preBötC pacemaker neuron subpopulation to INaP blockade at E16.5 and E18.5. Calcium transients in 12 monitored inspiratory neurons at E16.5 in control conditions (left column), after synapse blockade (middle column), then under additional exposure to 10 µM riluzole (right column). Black traces correspond to non-pacemaker neurons (i.e., inactive under cocktail); the blue trace denotes a pacemaker neuron whose spontaneous activity was subsequently blocked under riluzole (i.e., an INaP-dependent pacemaker); the red trace corresponds to a pacemaker neuron that remained rhythmically activity under both cocktail and riluzole (i.e., an ICAN-dependent pacemaker). (C) Bar histograms representing the proportions of riluzole-sensitive (blue bar) vs riluzole-resistant (red bars) neurons detected at E16.5 and E18.5. Note the higher proportion of riluzole-sensitive (INaP-dependent) pacemaker neurons at the later embryonic stage.
Figure 6
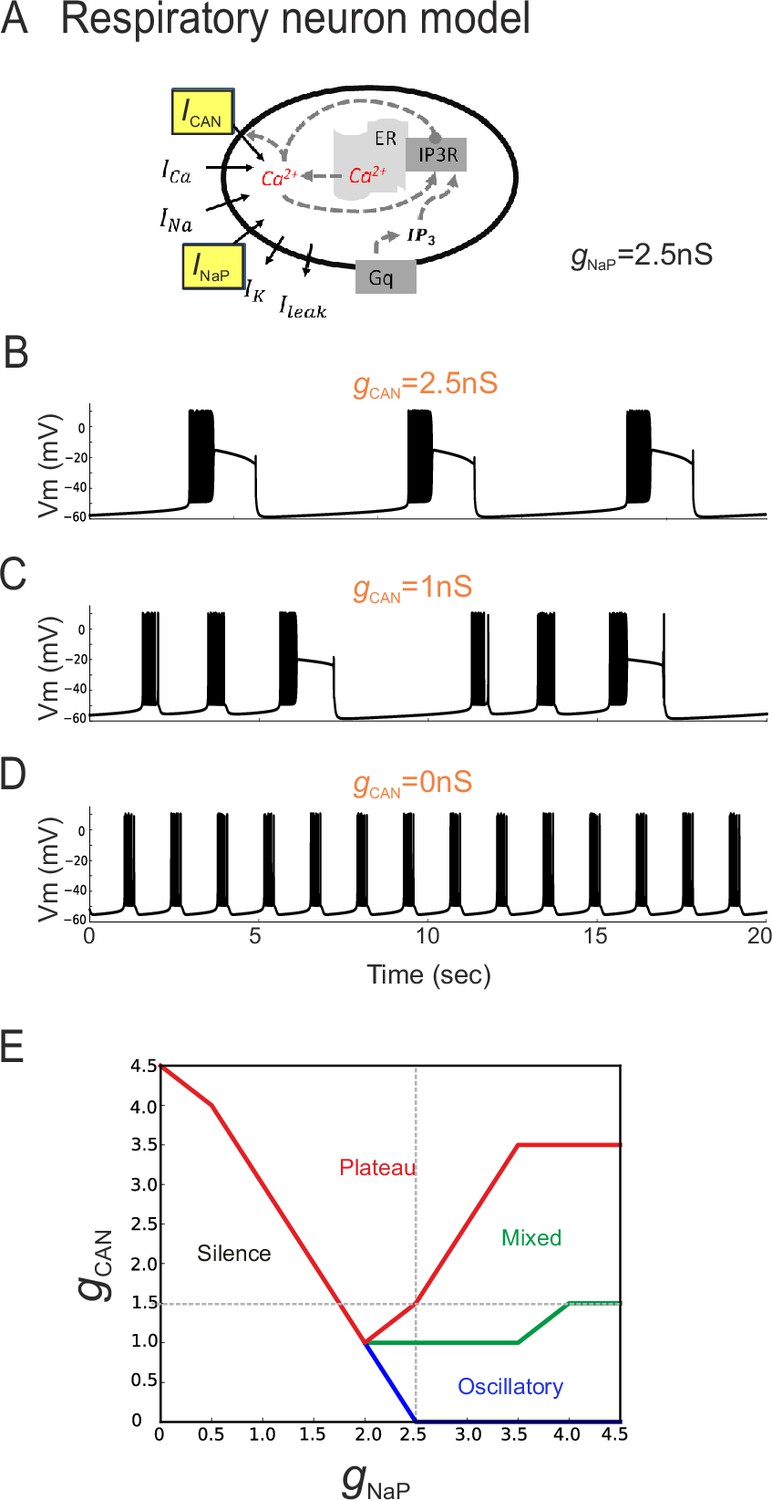
The balance between simulated ICAN and INaP in silico can determine pacemaker discharge phenotype.
(A) Computational model of an inspiratory pacemaker neuron with the main burst-generating currents ICAN and INaP highlighted in yellow. For other abbreviations, see Material and methods and (Toporikova et al., 2015). (B–D) Model neuron voltage traces obtained with INaP conductance (gNaP) held constant at 2.5 nS and gCAN set to different steady state values (indicated in orange). Depending on gCAN magnitude, the model neuron generated plateau bursting discharge (B, gCAN = 2.5 nS), a mixed firing pattern (C, gCAN = 1 nS) or a rhythmic oscillatory burst pattern (D, gCAN = 0 nS). (E) Graph showing the type of model neuron discharge as a function of the proportions of gNaP and gCAN magnitudes. The gray dashed lines correspond to the values of constant gNaP and gCAN used, respectively, in the variable gCAN simulations illustrated in (B-D) and in complementary simulations in which INaP was varied with gCAN held constant (data not shown). Depending on the balance between gNaP and gCAN amplitudes, the model neuron could exhibit the three different patterns observed with patch-clamp recordings in vitro.
Figure 7
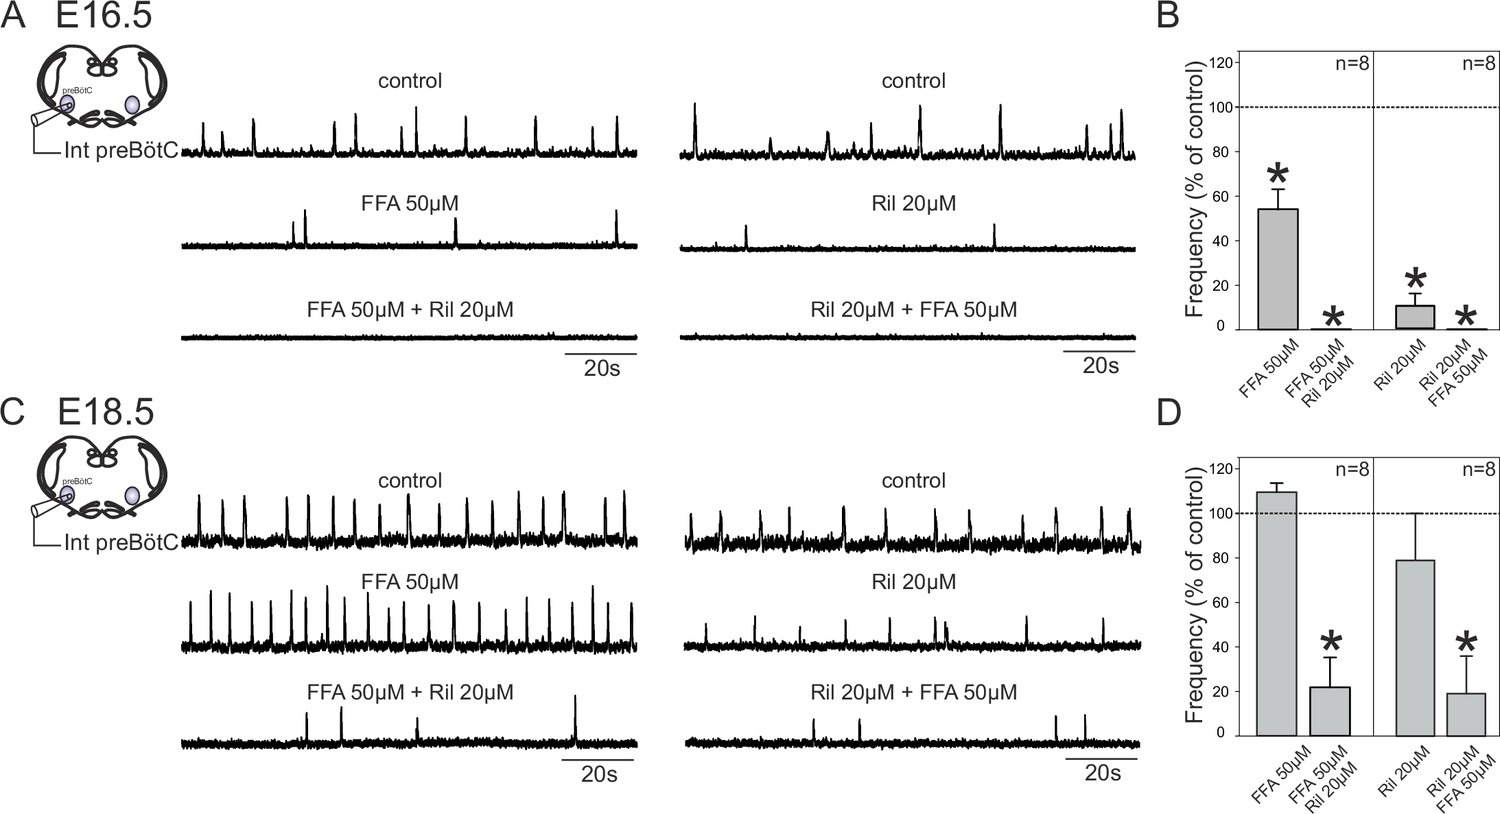
Mechanisms for inspiratory network rhythmogenesis change during embryonic development.
(A) Schematic representation of an in vitro slice preparation used for electrophysiological recording of spontaneous preBötC network activity (integrated traces, Int preBötC) in control conditions (top traces) or in the presence of either FFA (50 µM, middle trace, left) or Ril (20 µM, middle trace, right) alone or in combination (bottom traces) at E16.5. (B) Bar histograms representing the percentages of cycle frequency change (mean ± SEM) compared to control under the different pharmacological conditions illustrated in A. Asterisks indicate significant differences (t-test, p<0.05); n = number of experiments in each case. (C,D) same layout as (A,B) for experiments performed at E18.5. Note that unlike at E16.5 where both FFA and Ril significantly reduced rhythmogenesis, blockade of either ICAN or INaP alone did not significantly perturb rhythm generation at E18.5. Also, blockade of both conductances at E16.5 was sufficient to completely suppress rhythm generation, but not at E18.5.
Figure 8
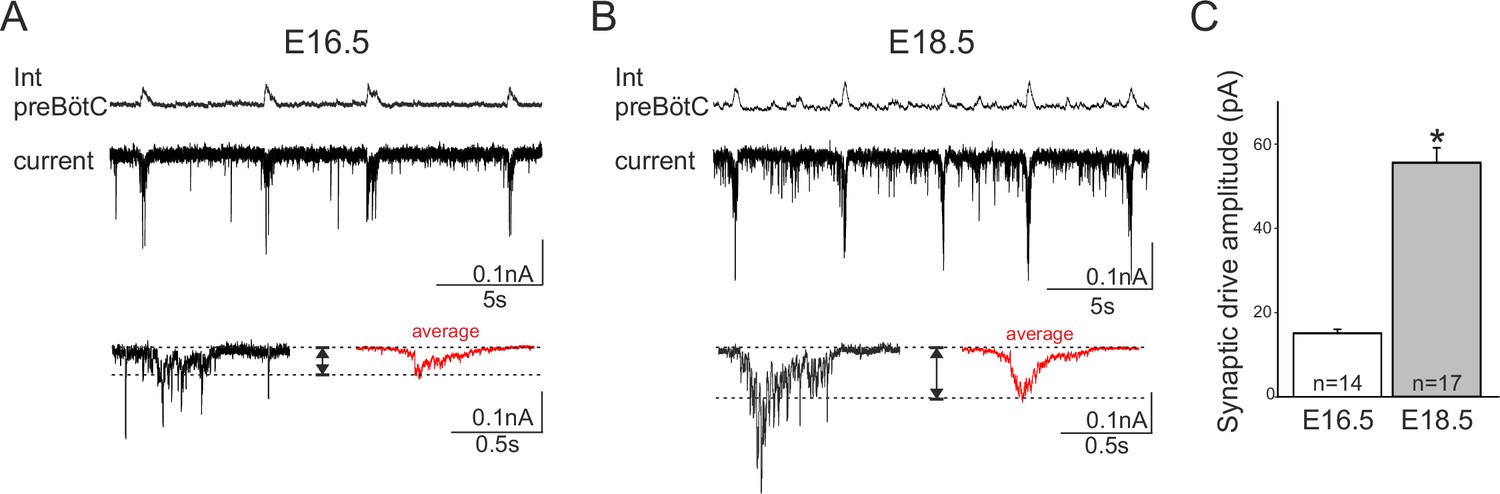
Developmental increase in burst-generating synaptic excitation amongst inspiratory network neurons.
Integrated preBötC network activity (top traces, Int preBötC) with simultaneous intracellular recordings of membrane current fluctuations (lower traces) in rhythmically active preBötC neurons under voltage clamp (holding potential set at −50 mV) obtained at E16.5 (A) and E18.5 (B). Expanded bottom traces in A and B show the excitatory synaptic currents (left side in each case, single burst cycle; right side in red, average of 15 cycles) recorded from individual inspiratory neurons during rhythmic network activity. Dashed lines indicate baseline and maximum amplitude levels of the synaptic currents. Note their larger amplitude at E18.5 for both single cycle and averaged events. (C) Bar histograms representing the mean maximal amplitude (± SEM) of excitatory synaptic current underlying burst discharge measured in 14 neurons at E16.5 (unshaded bar) and 17 neurons at E18.5 (gray bar). The asterisk indicates significant difference (p< 0.001).
Tables
Table 1
Parameters for single cell model.
| Parameter related to: | Parameter values: |
|---|---|
| ; ; ; ; ; | |
| , | |
| ; µM | |
| ; | |
| ; | |
| ; ; ; | |
| ER Ca | ; µM; µM3 ; ; ; ; ; µM; µM; µM |
| Other |
Download links
A two-part list of links to download the article, or parts of the article, in various formats.
Downloads (link to download the article as PDF)
Open citations (links to open the citations from this article in various online reference manager services)
Cite this article (links to download the citations from this article in formats compatible with various reference manager tools)
Development of pacemaker properties and rhythmogenic mechanisms in the mouse embryonic respiratory network
eLife 5:e16125.
https://doi.org/10.7554/eLife.16125


