A hyperspectral method to assay the microphysiological fates of nanomaterials in histological samples
- Stanford University, United States
Figures
Figure 1 with 4 supplements
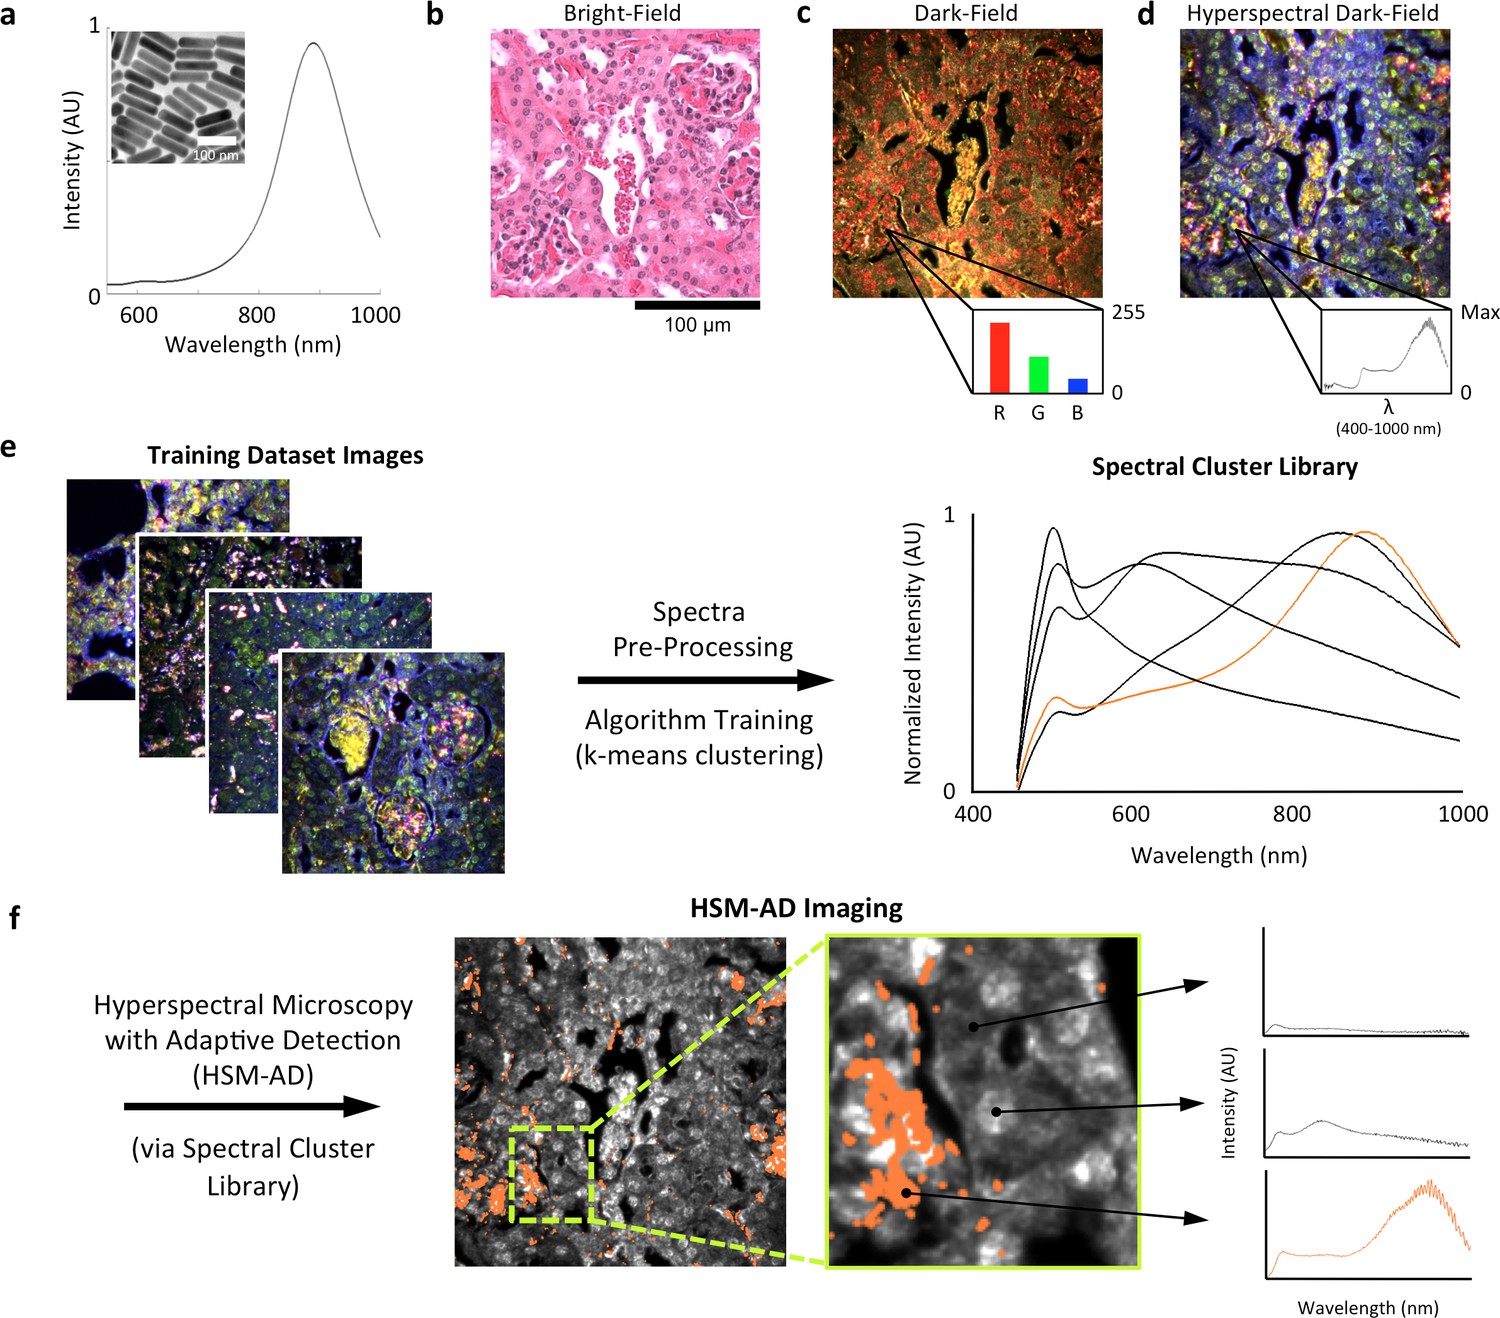
Overview of nanoparticle biodistribution analysis with HSM-AD.
(a) Large gold nanorods (LGNRs, ~100 × 30 nm) exhibiting near infrared plasmon resonance were synthesized, functionalized, and intravenously injected into live nude mice. (b,c) 24 hr post-injection, the animals were euthanized and tissues were resected and prepared as normal histological sections for characterization with bright-field (b) and dark-field microscopy (c) neither of which was able to visualize the distribution of the LGNRs. (d) The same section was then imaged with hyperspectral microscopy, which showed clear signs of LGNRs accumulation (denoted by red hues) in various areas of the tissue and exhibited spectral peaks matching the LGNR plasmon resonance. (e) We then trained an adaptive clustering algorithm for spectral identification of LGNRs with hyperspectral images from injected mice. The algorithm identified several characteristic spectra representing the tissue and the H&E staining, as well as one unique spectrum representing the LGNRs (depicted in orange), altogether representing a library of 5 spectra. Once a spectral cluster library is produced from the training dataset, images of unknown tissue samples can by analyzed for the presence of LGNRs via automated classification. (f) The resulting HSM-AD images depict the location of all points within the sample that exhibit the LGNR spectrum (orange for LGNRs, grayscale for tissue).
Figure 1—figure supplement 1

Diagram of the CytoViva microscope used for dark-field and hyperspectral image acquisition.
https://doi.org/10.7554/eLife.16352.004
Figure 1—figure supplement 2
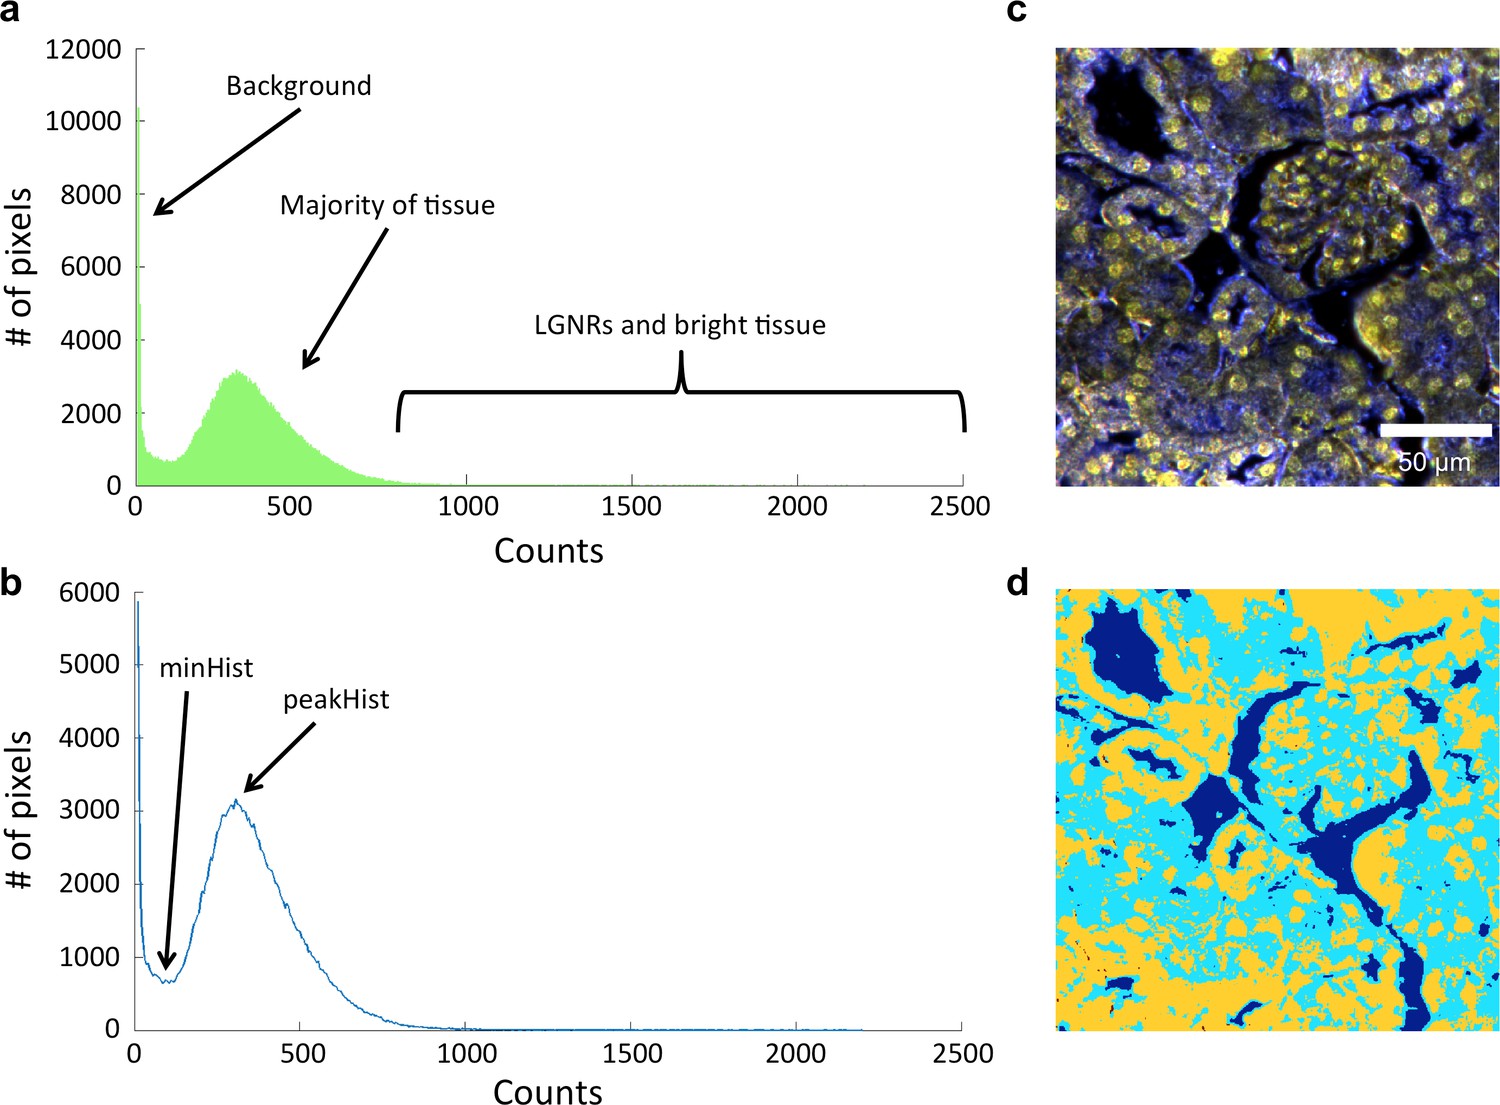
Image segmentation, including method for dynamic threshold determination.
(a) A histogram of the peak intensities of each pixel in an image can be roughly divided into background (noise), tissue scattering, and LGNR and bright tissue scattering. (b) Detection of minHist and peakHist, as described in Methods. (c,d) A characteristic hyperspectral image (c) and its corresponding segmentation map (d) showing background (blue), tissue (cyan), and potential LGNRs and bright tissue (yellow).
Figure 1—figure supplement 3
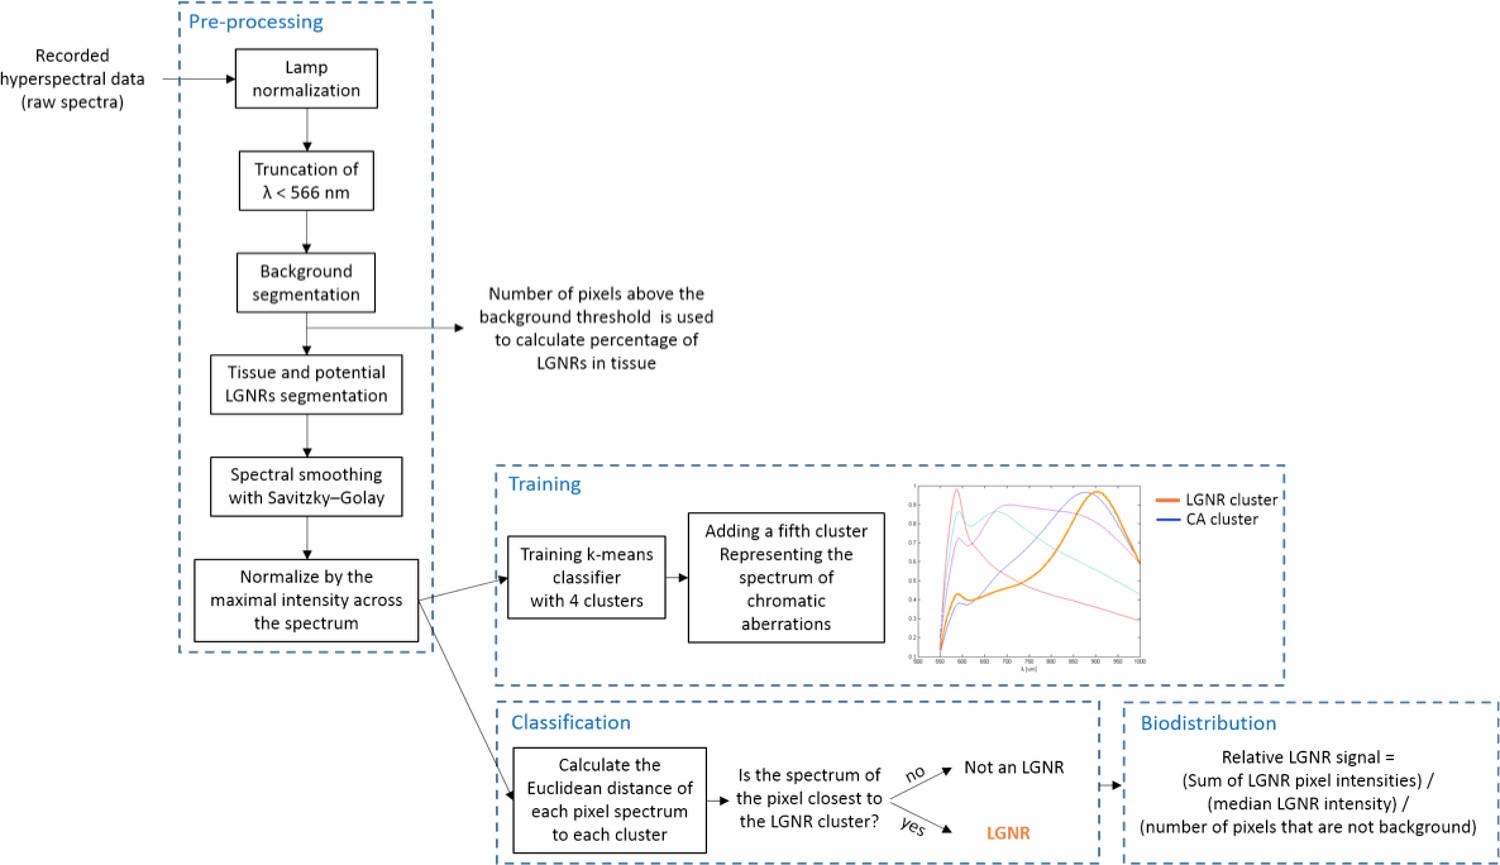
Detailed flowchart of steps used in HSM-AD algorithm.
https://doi.org/10.7554/eLife.16352.006
Figure 1—figure supplement 4
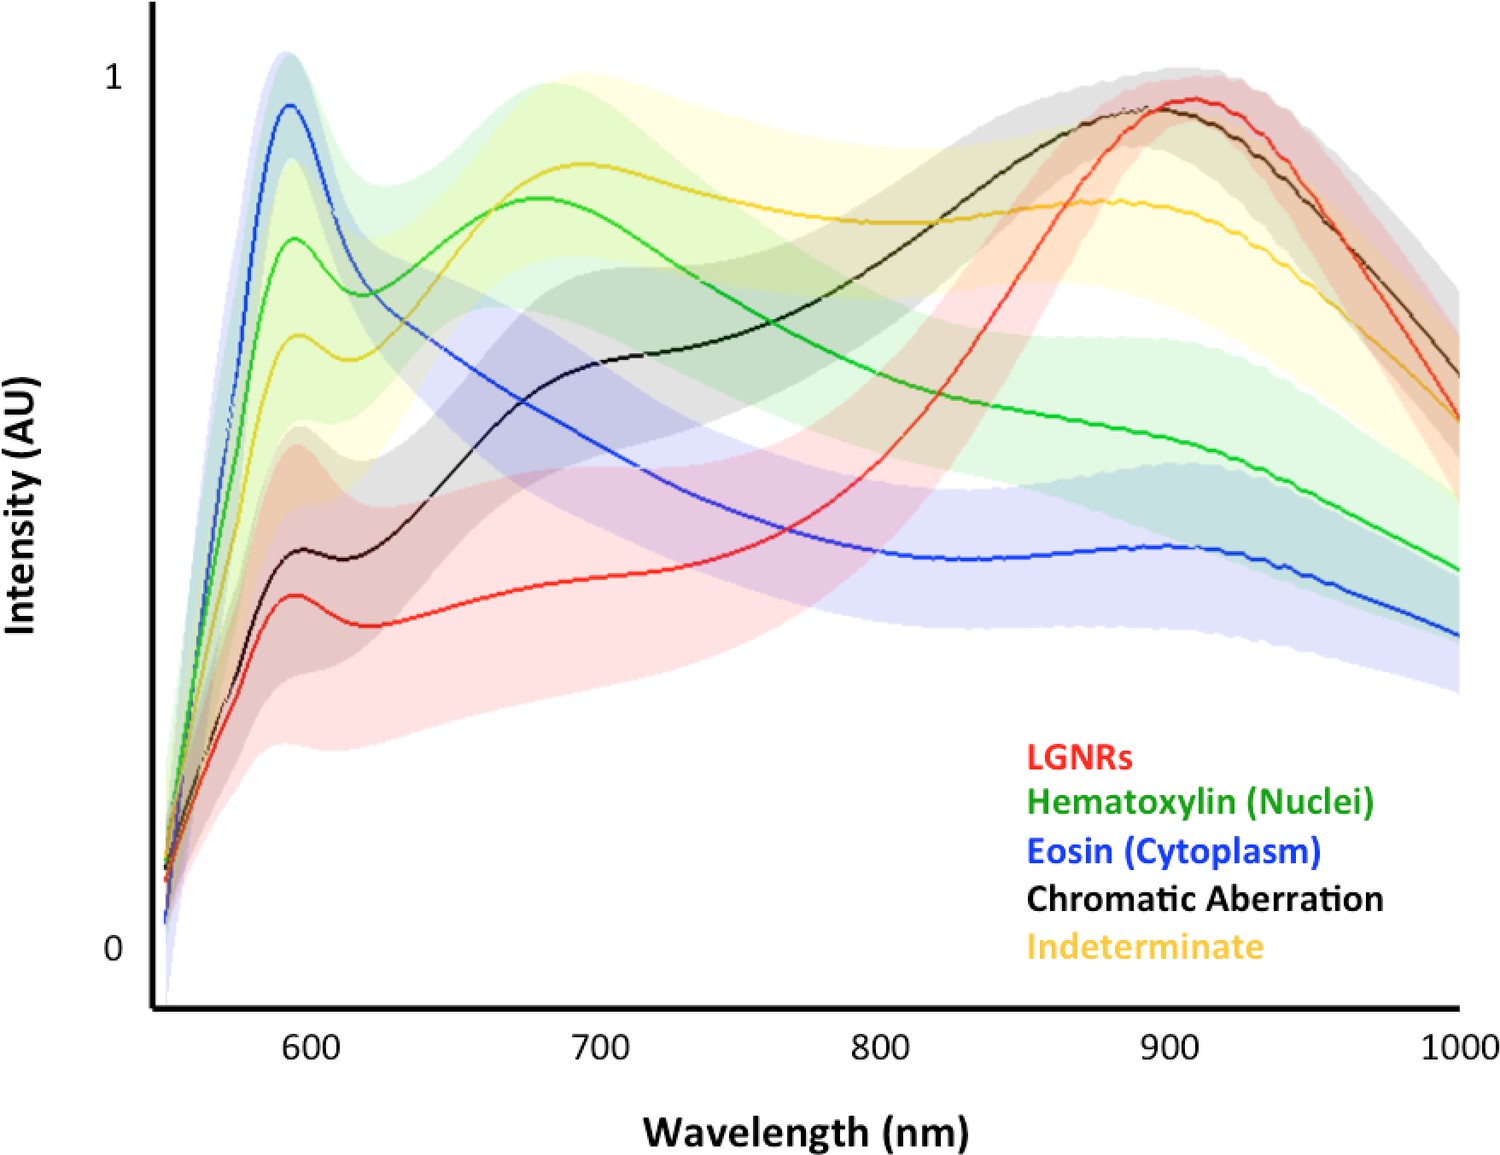
Typical cluster results for pixel classification in an image of tissues with injected LGNRs.
For a given image (>250,000 pixels), each pixel is binned into one of the five spectral clusters. This plot depicts the means (solid lines) and standard deviations (shaded areas) of all classified pixel spectra. Although the adaptive clustering algorithm is agnostic with respect to defining the spectral clusters (with the exception of chromatic aberration, which is user-defined), the learned clusters can be readily correlated to the major scattering components present in each sample, i.e., hematoxylin-stained nuclei (green), eosin-stained cytoplasm (blue), and LGNRs (red).
Figure 2 with 15 supplements
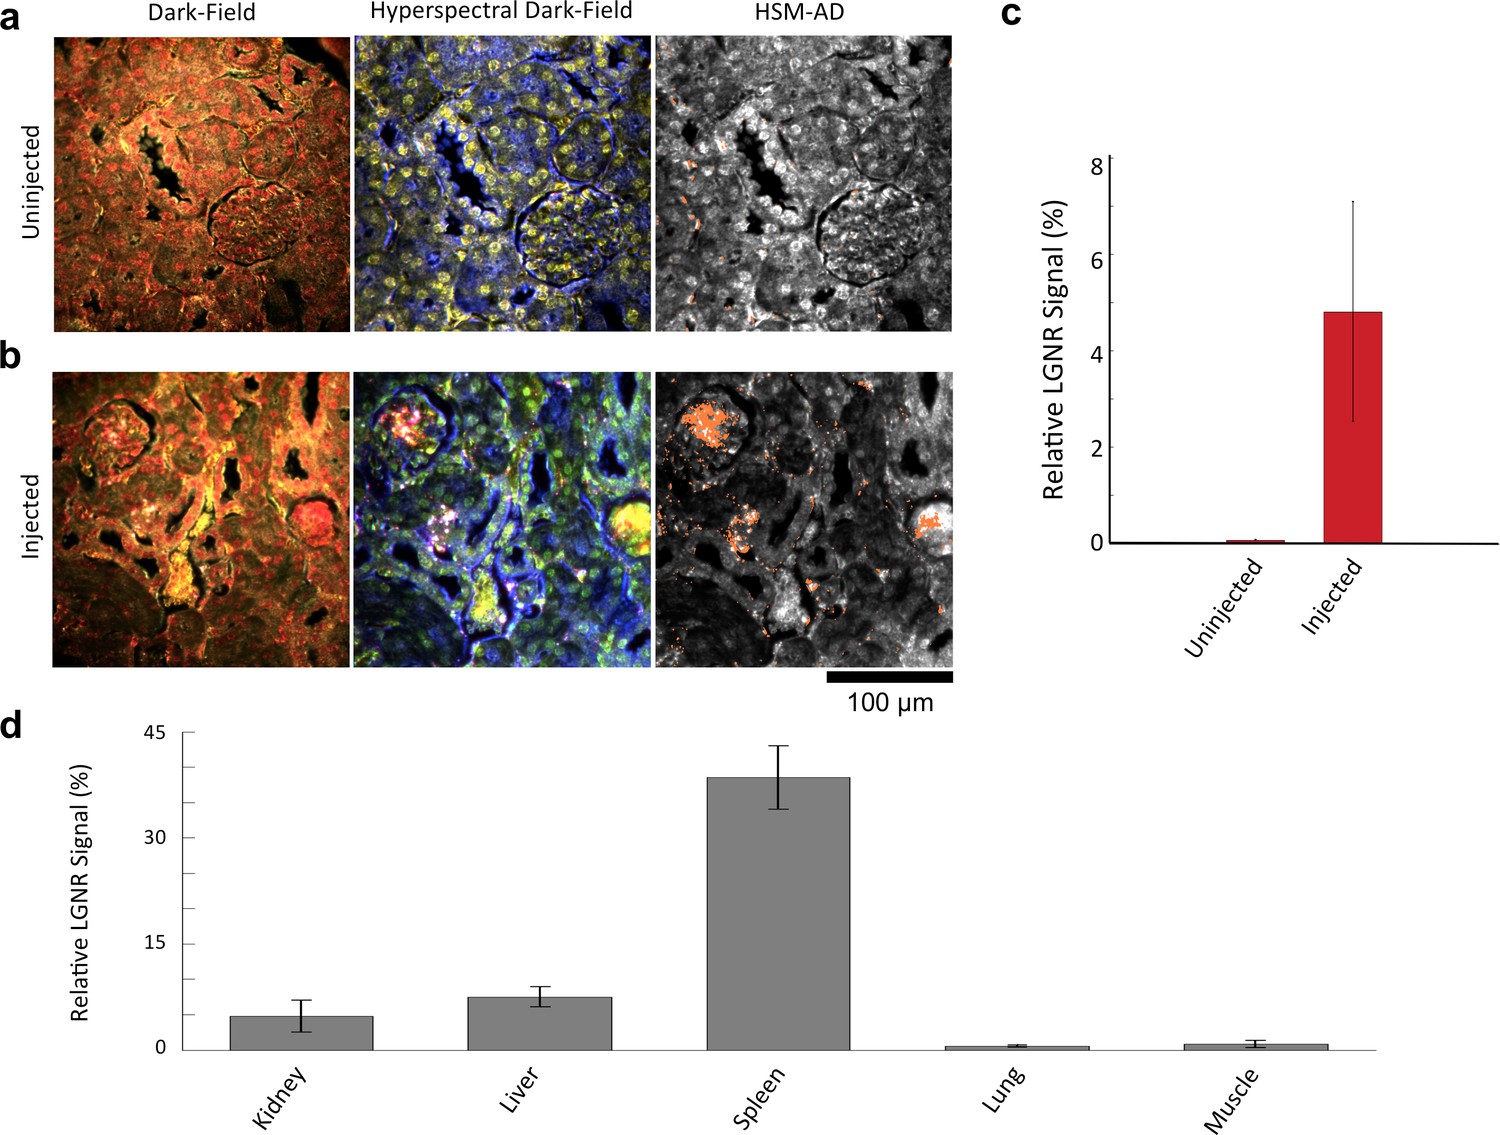
Sensitivity and specificity validation of HSM-AD.
(a,b) Hematoxylin and Eosin (H&E) stained tissue samples (kidney) from uninjected (a) and injected (b) mice were imaged using dark-field and hyperspectral microscopy at 40x magnification and analyzed with HSM-AD to measure LGNR detection specificity and sensitivity. Conventional dark-field images highlight features including nuclei (salmon-pink), cytoplasm (green-brown), and erythrocytes (yellow-orange) within the tissues, but they reveal little information regarding the presence or absence of LGNRs. By comparison, putative LGNRs can be roughly identified as red-orange pixels in false-colored hyperspectral images, while nuclei and cytoplasm appear in green and indigo, respectively. (c) HSM-AD analysis of hyperspectral images demonstrates the absence of LGNRs in uninjected tissues and LGNR presence in injected samples (two-tailed Student’s t-test, p=0.054). Quantification of the relative LGNR signal from n = 4 tissue slices (representing a total of 1.04 million pixels) indicates that the false positive rate for LGNR detection (determined from uninjected tissues) is minimal. A detection specificity of 99.7% was determined from uninjected tissue sections, and a detection sensitivity of 99.4% was measured from samples of pure LGNRs analyzed using HSM-AD (Figure 2—figure supplement 1). (d) HSM-AD analysis of whole tissue sections (n = 4 for each tissue type) reveals quantitative differences in bulk LGNR uptake among various organs, in a manner analogous to conventional biodistribution methods. Quantitative data are presented as mean ± standard error of the mean (s.e.m.).
-
Figure 2—source data 1
Data used for diagnostic and 95% CIs.
- https://doi.org/10.7554/eLife.16352.009
-
Figure 2—source data 2
Data for whole organ uptake quantification.
- https://doi.org/10.7554/eLife.16352.010
Figure 2—figure supplement 1
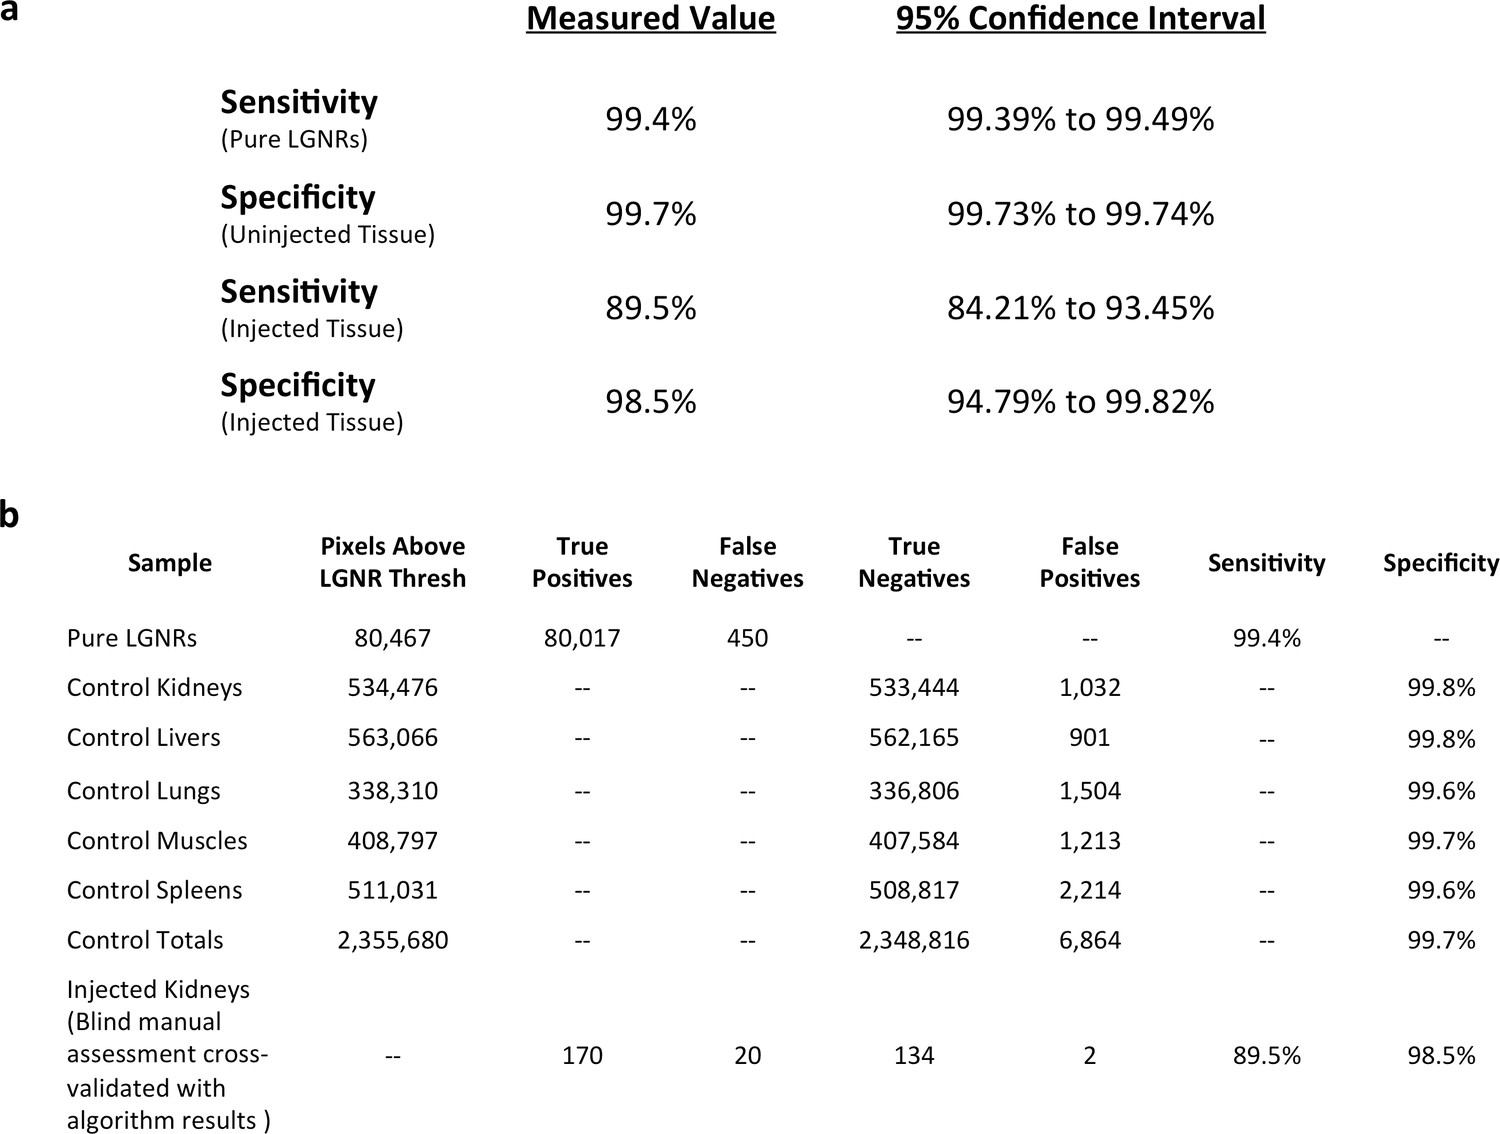
Measured sensitivity and specificity values for HSM-AD method.
(a) Sensitivity values were calculated from pure LGNR samples in CytoSeal on a microscope slide and from blinded manual identification of LGNR spectra from injected sections cross-referenced with algorithm results. Specificity values were calculated directly from uninjected (LGNR-) tissue samples and from blinded manual identification of non-LGNR spectra cross-referenced with algorithm results. 95% confidence intervals were calculated for each sensitivity and specificity measurement. (b) Summary of raw data (pixel counts) for each measurement reported in (a).
Figure 2—figure supplement 2

Dark-field images of additional uninjected H&E-stained tissue sections.
(a) kidney, (b) liver, (c) lung, (d) muscle, and (e) spleen.
Figure 2—figure supplement 3
Hyperspectral images of additional uninjected H&E-stained tissue sections.
(a) kidney, (b) liver, (c) lung, (d) muscle, and (e) spleen.
Figure 2—figure supplement 4
HSM-AD detection of additional uninjected H&E-stained tissue sections.
(a) kidney, (b) liver, (c) lung, (d) muscle, and (e) spleen. Pixels identified as LGNR+ are denoted in orange. These analyzed samples were used for calculations of detection specificity.
Figure 2—figure supplement 5

Analysis of LGNRs on a glass slide.
(a) Hyperspectral image of LGNRs embedded in CytoSeal on a glass slide. (b) a segmentation map showing background in blue & cyan, high-intensity LGNR- pixels in yellow, and LGNR+ pixels in red. (c) HSM-AD detection of the LGNR sample demonstrated high detection sensitivity. (d) Inspection of individual LGNR+ and LGNR- pixels validates the detection efficacy of HSM-AD. The split-peak spectrum of pixel 2, which is not identified as LGNR+, is possibly indicative of LGNR surface plasmon resonance hybridization.
Figure 2—figure supplement 6

Spectral hybridization in partially aggregated LGNRs.
(a) A sample of as-synthesized LGNRs (without additional surface functionalization) was centrifuged and resuspended to produce a sample with partial aggregation and imaged in water with the hyperspectral dark-field microscope. (b) Spectra from various distances from the aggregate center. Spectra from pixels near the edges of particle aggregates displayed scattering peaks similar to disperse LGNRs, while pixels closer to the centers of aggregates exhibited both blue-shifting and multiple spectral peaks.
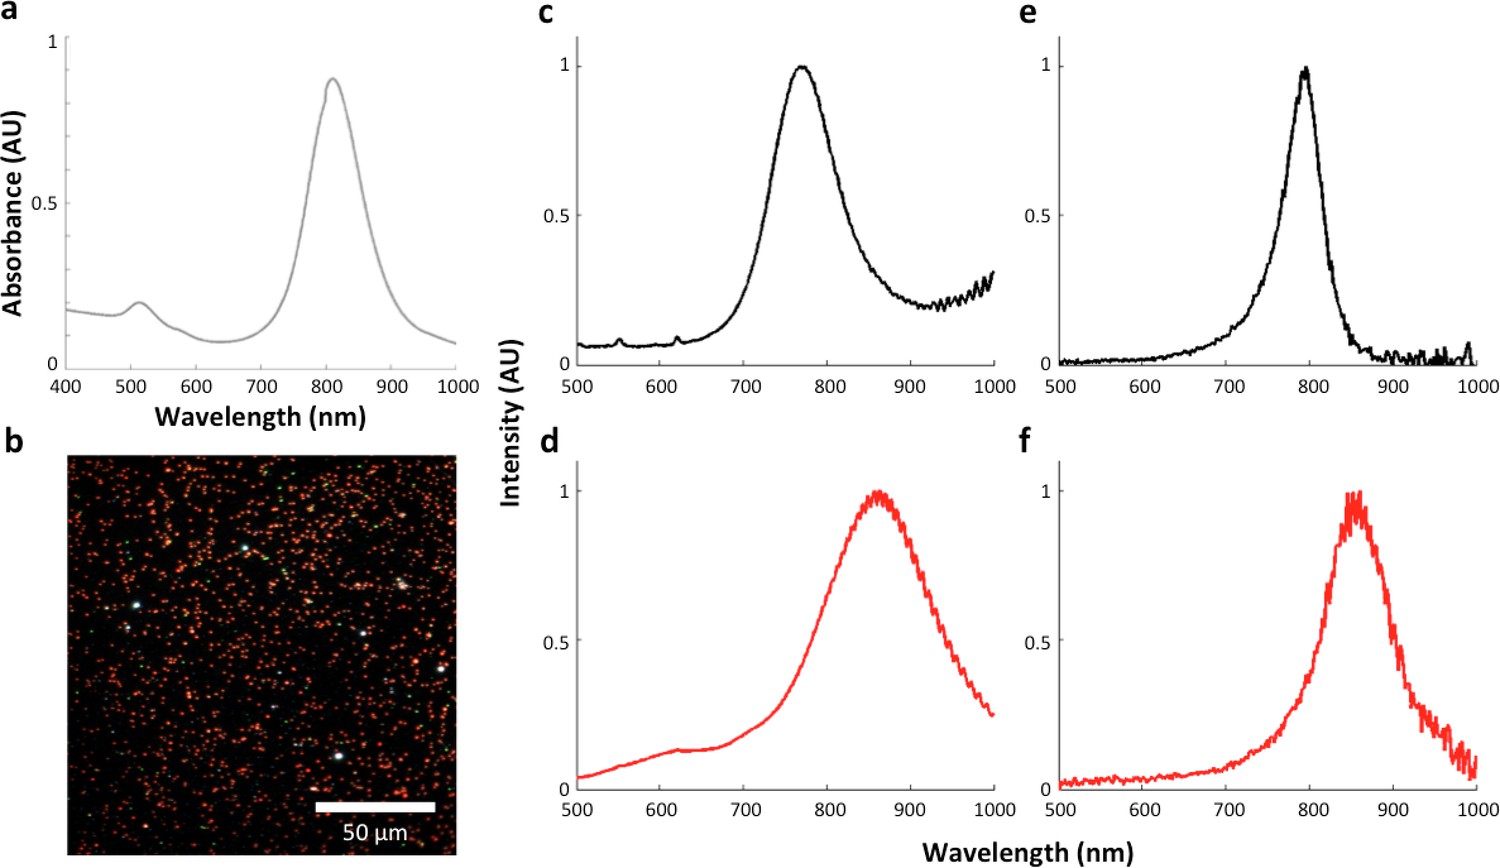
Figure 2—figure supplement 7
The influence of the local refractive index on the observed LGNR spectral peak.
(a) LGNRs exhibited a spectral peak of ~800 nm when measured as a suspension in pure water with visible/near-infrared spectrometry. (b) Dark-field image of LGNRs in water. (c) The average spectrum of LGNRs in water has a peak that is slightly blue-shifted compared to the peak observed by spectrometry (a). (d) The average spectrum of LGNRs in CytoSeal (n = 1.5, matched to microscope immersion oil) produced a red-shift of ~80 nm in the average LGNR spectrum. (e) The spectrum of a single LGNR in water shows a similar peak to the average spectrum of LGNRs in water (c). (f) The spectrum of a single LGNR in CytoSeal shows a similar peak to the average spectrum of LGNRs in CytoSeal (d).
Figure 2—figure supplement 8
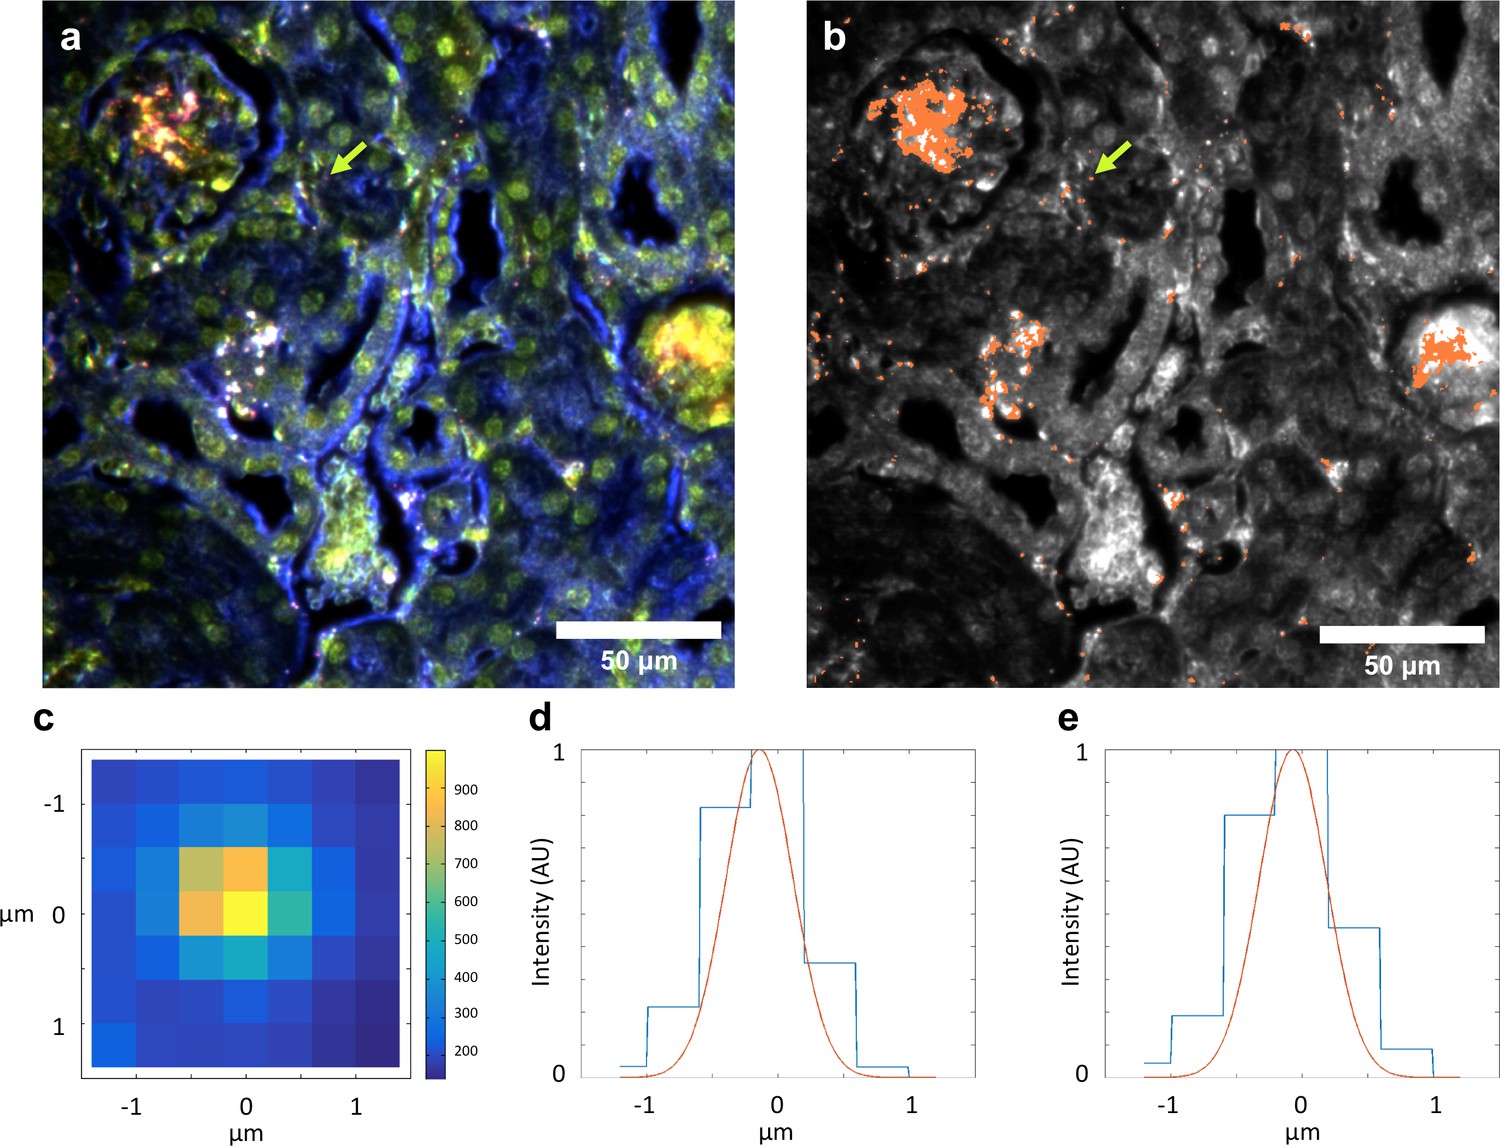
Evidence for single particle detection sensitivity with HSM-AD.
(a, b) Hyperspectral dark-field image (a) and HSM-AD detection (b) of a tissue section which includes presumed single LGNRs, such as the point indicated by the green arrow. (c) A 2D plot of the scattering intensity around the LGNR intensity peak (~900 nm) of pixels in the vicinity of the LGNR+ pixel shown in (b). (d, e) 1D plots of normalized pixel intensity as a function of distance from the center pixel (blue traces) and theoretical intensity profiles of a point scatterer, calculated from a Gaussian point spread function (red traces). The measured intensity plots correlate well with the theoretical intensities in both vertical (d) and horizontal (e) directions. Along with the retention of the LGNR spectral peak, this result suggests that the identified location likely contains a single LGNR. If more than one LGNR were present in the same area of one pixel, the spectrum would possibly change due to plasmonic hybridization and the pixel would not be detected as LGNR+.
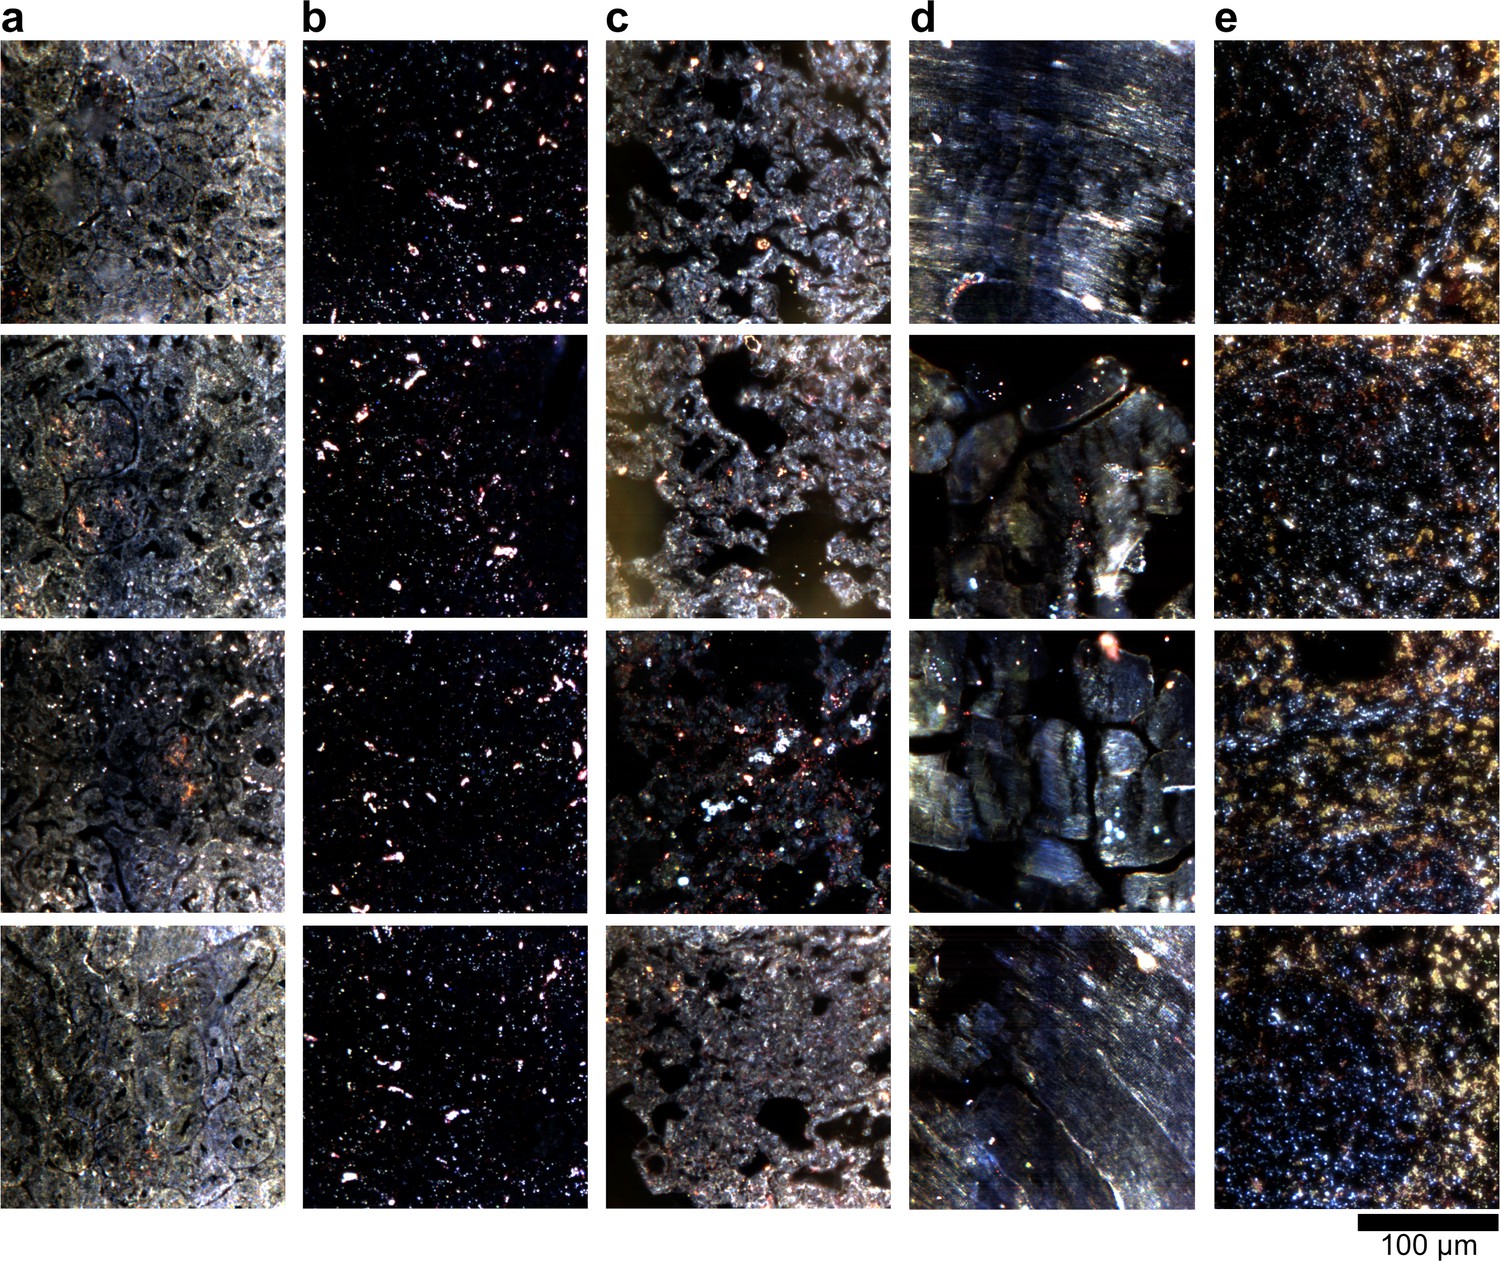
Figure 2—figure supplement 9

Dark-field images of additional LGNR-injected H&E-stained sections.
(a) kidney, (b) liver, (c) lung, (d) muscle, and (e) spleen.
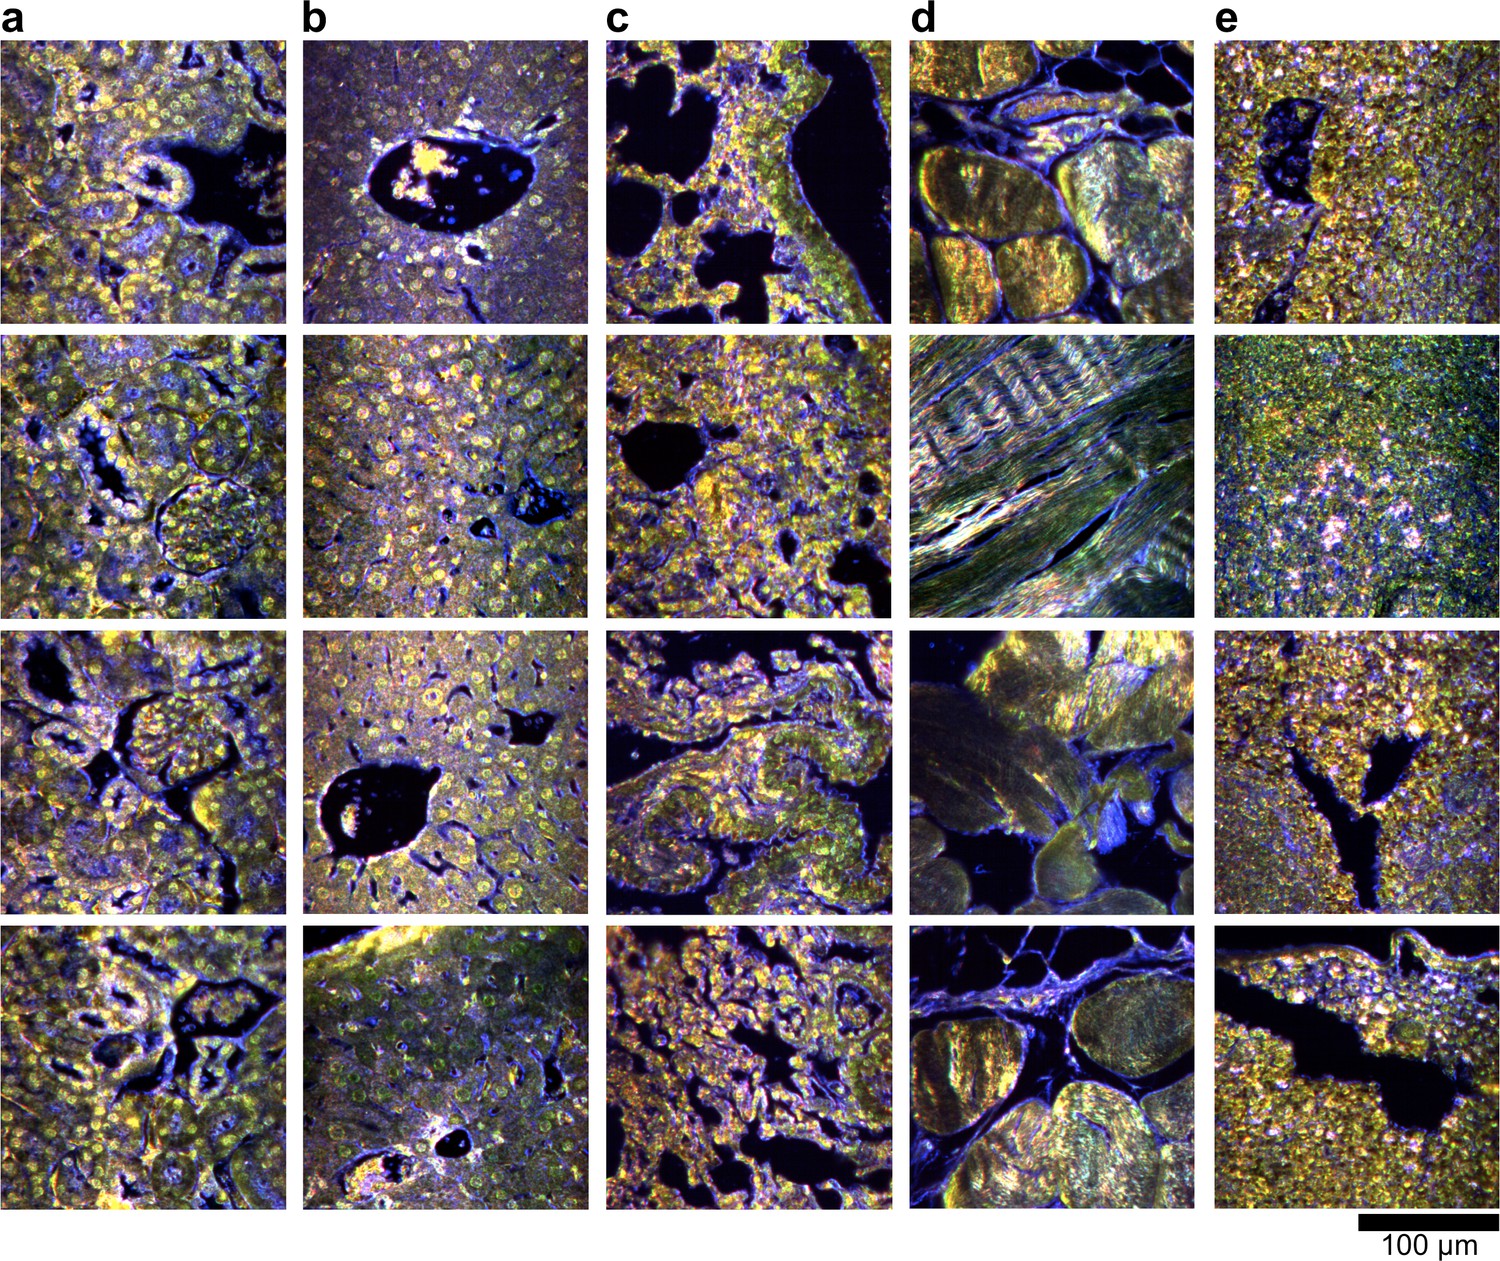
Figure 2—figure supplement 10
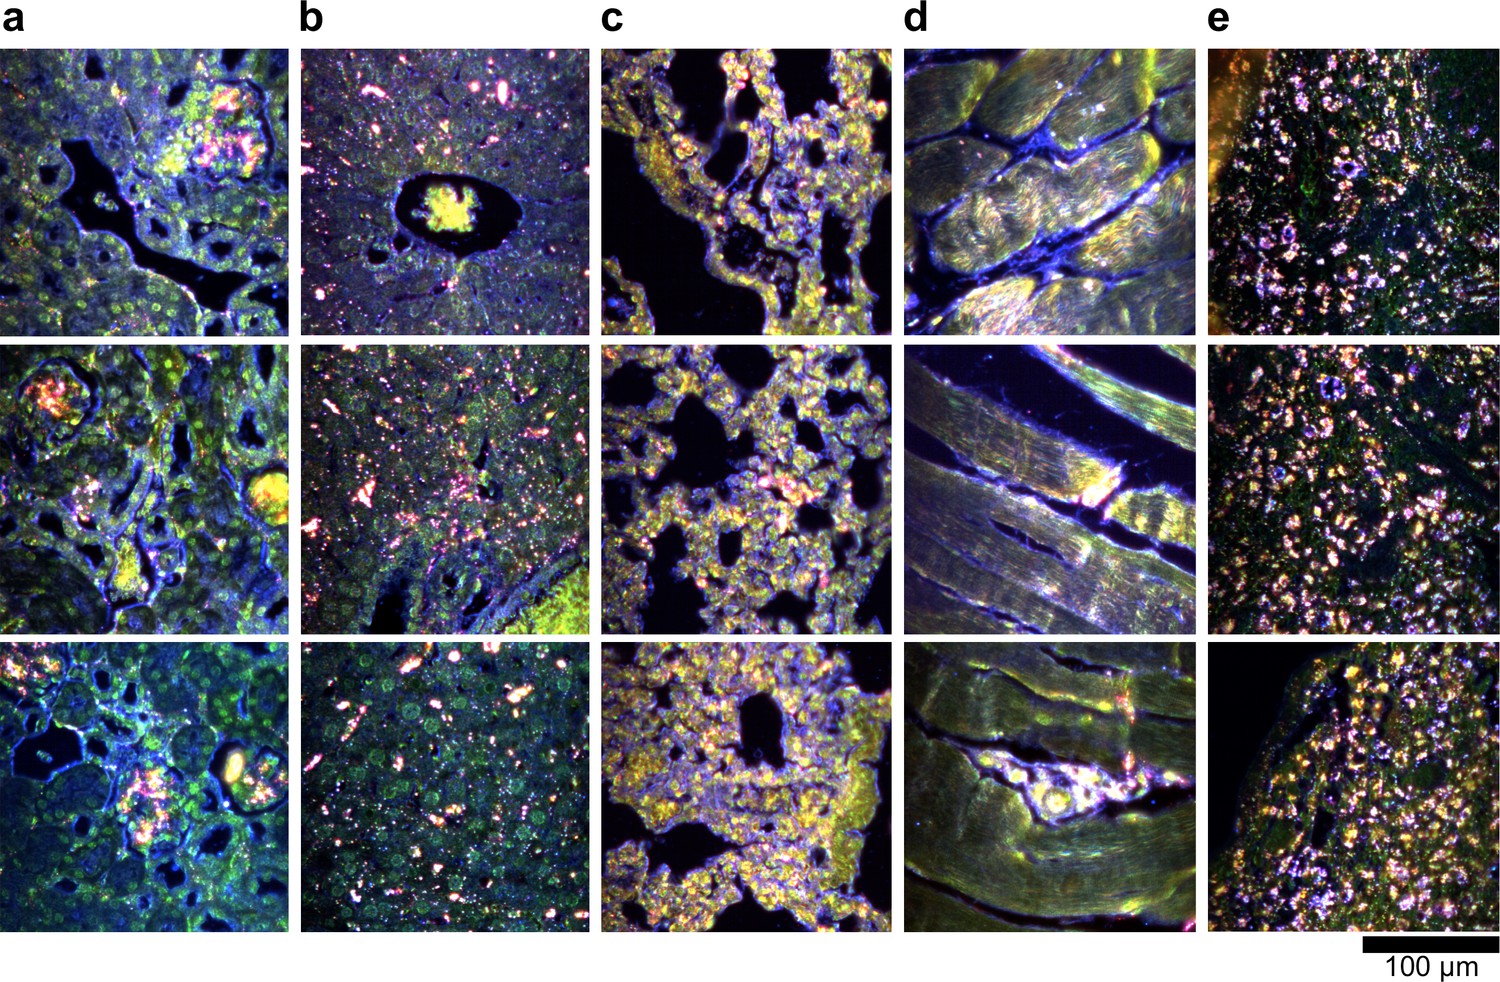
Hyperspectral images of additional LGNR-injected H&E-stained sections.
(a) kidney, (b) liver, (c) lung, (d) muscle, and (e) spleen.
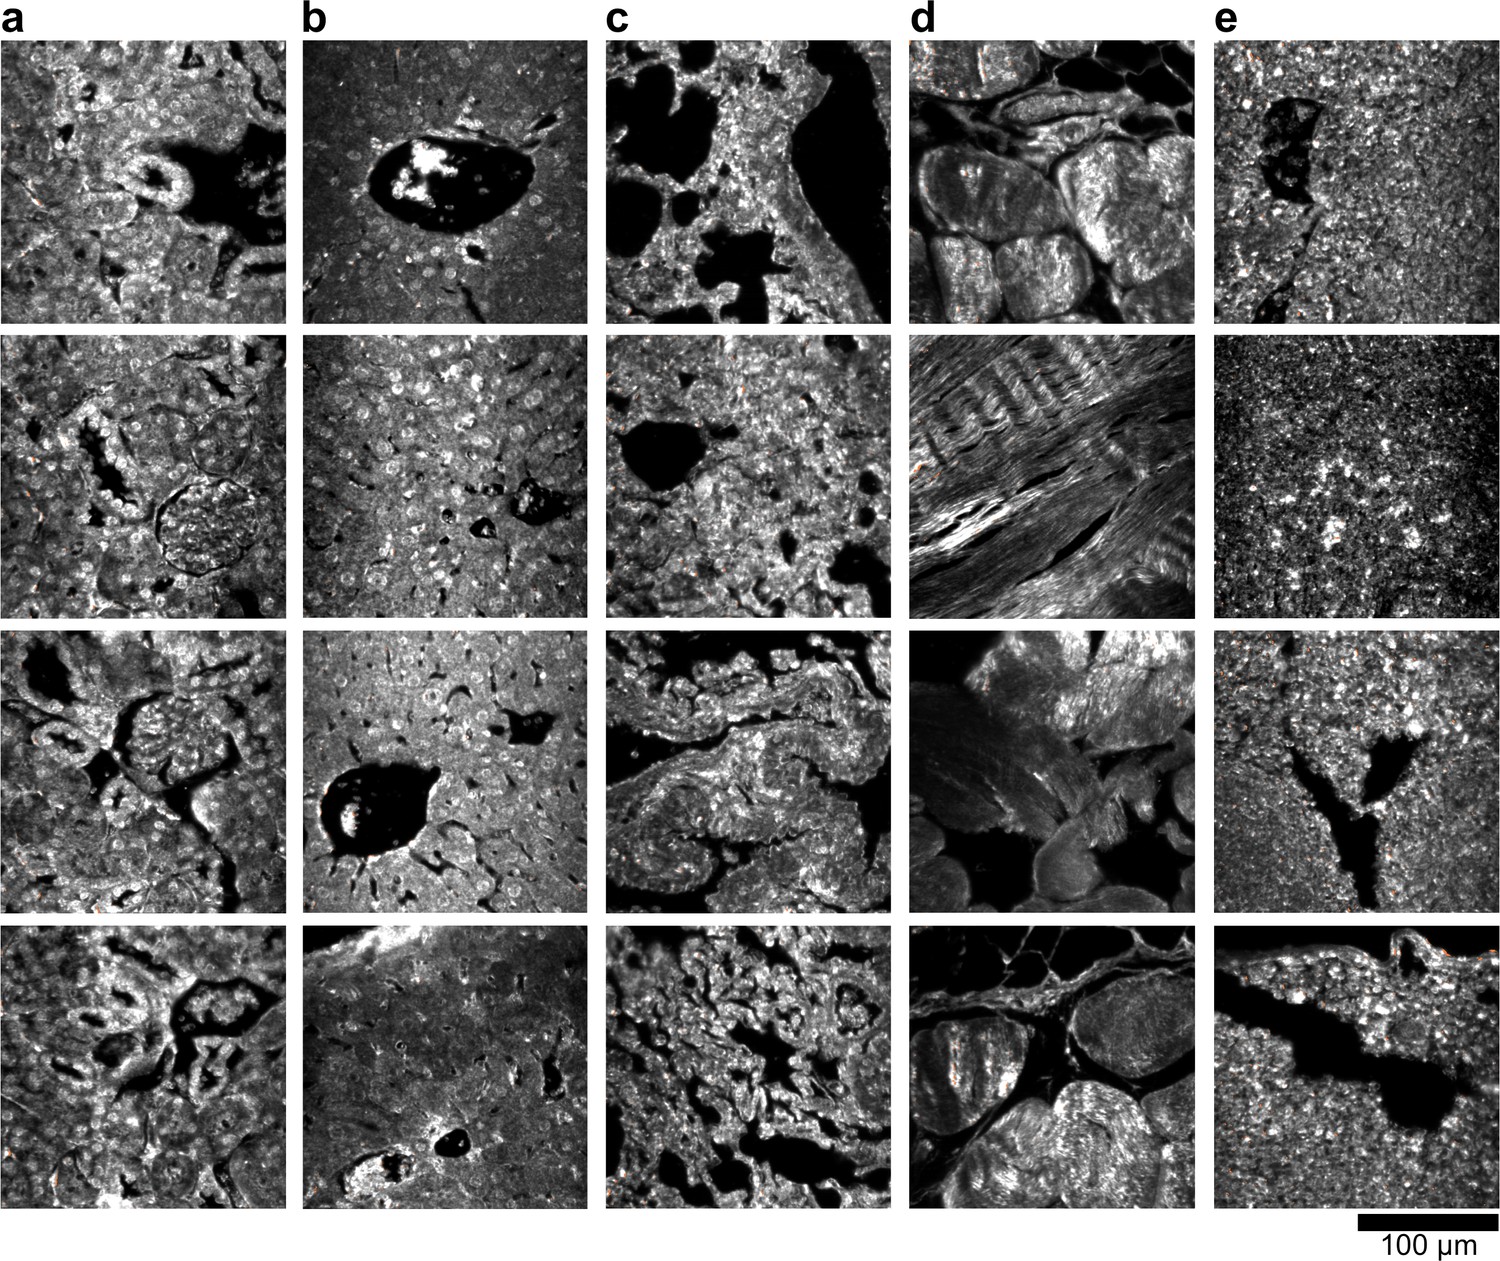
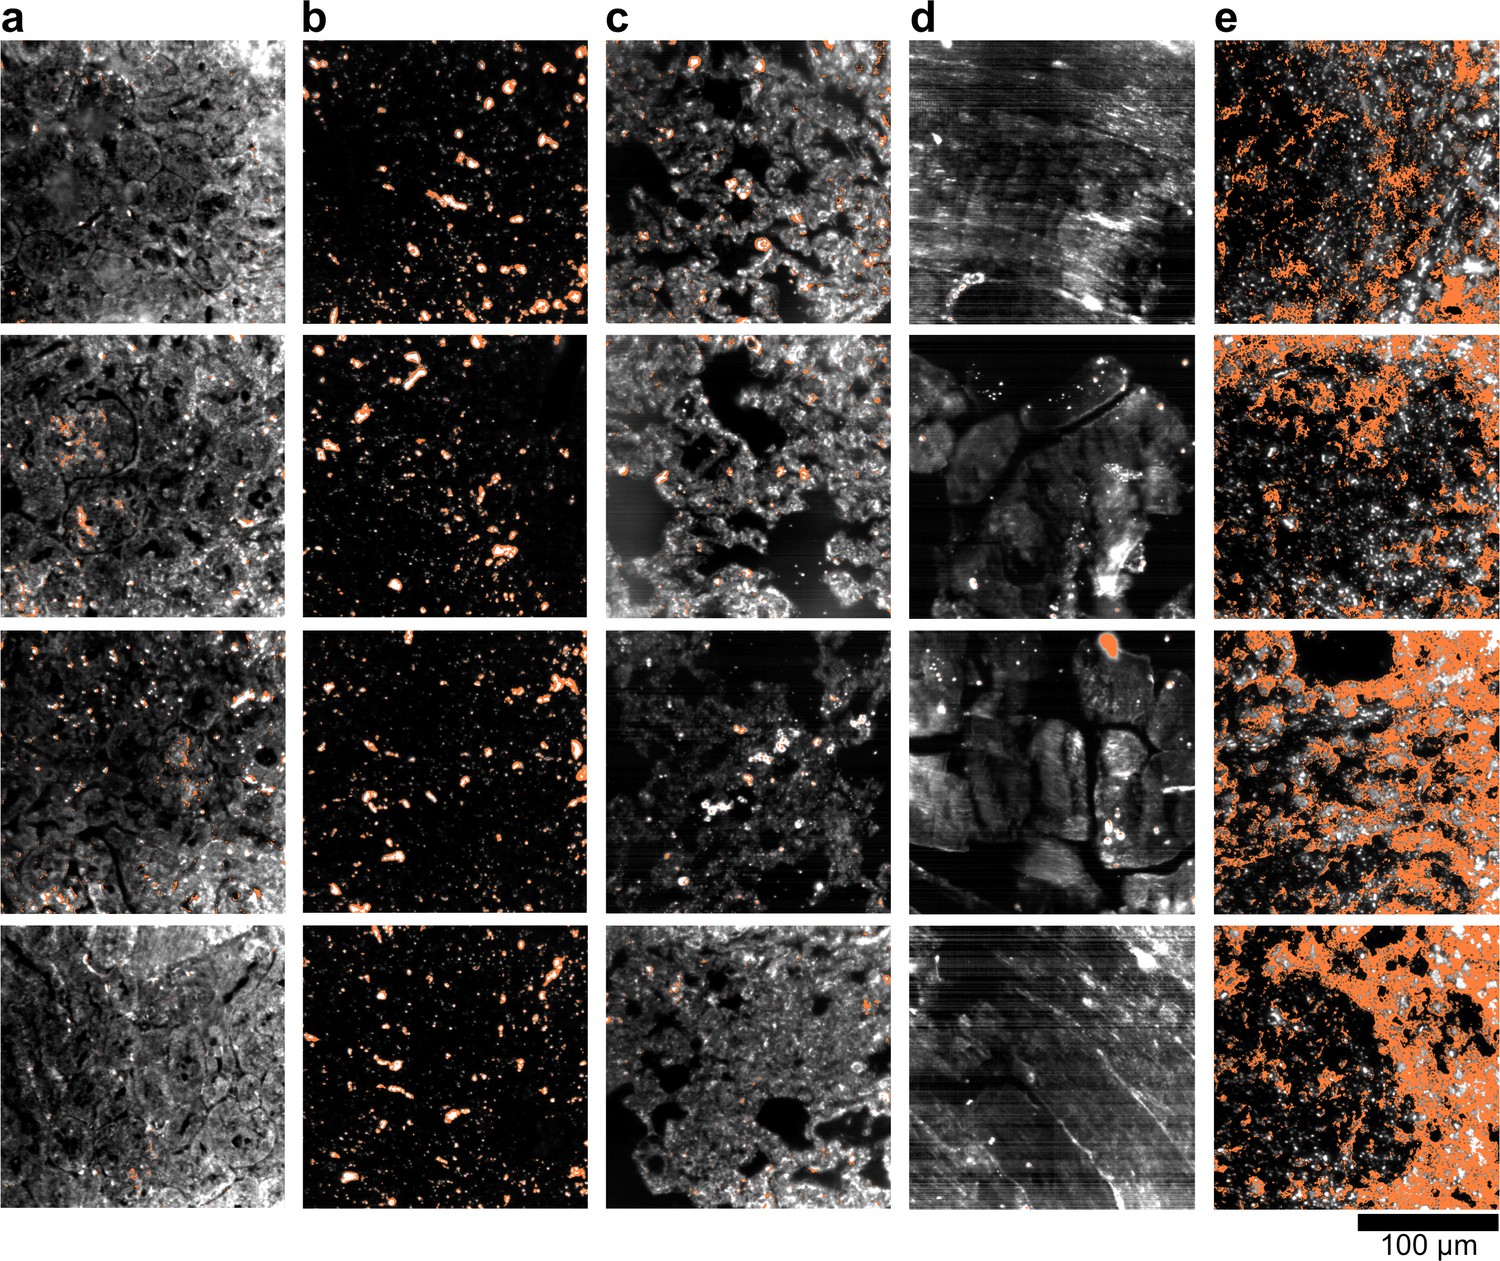
Figure 2—figure supplement 11
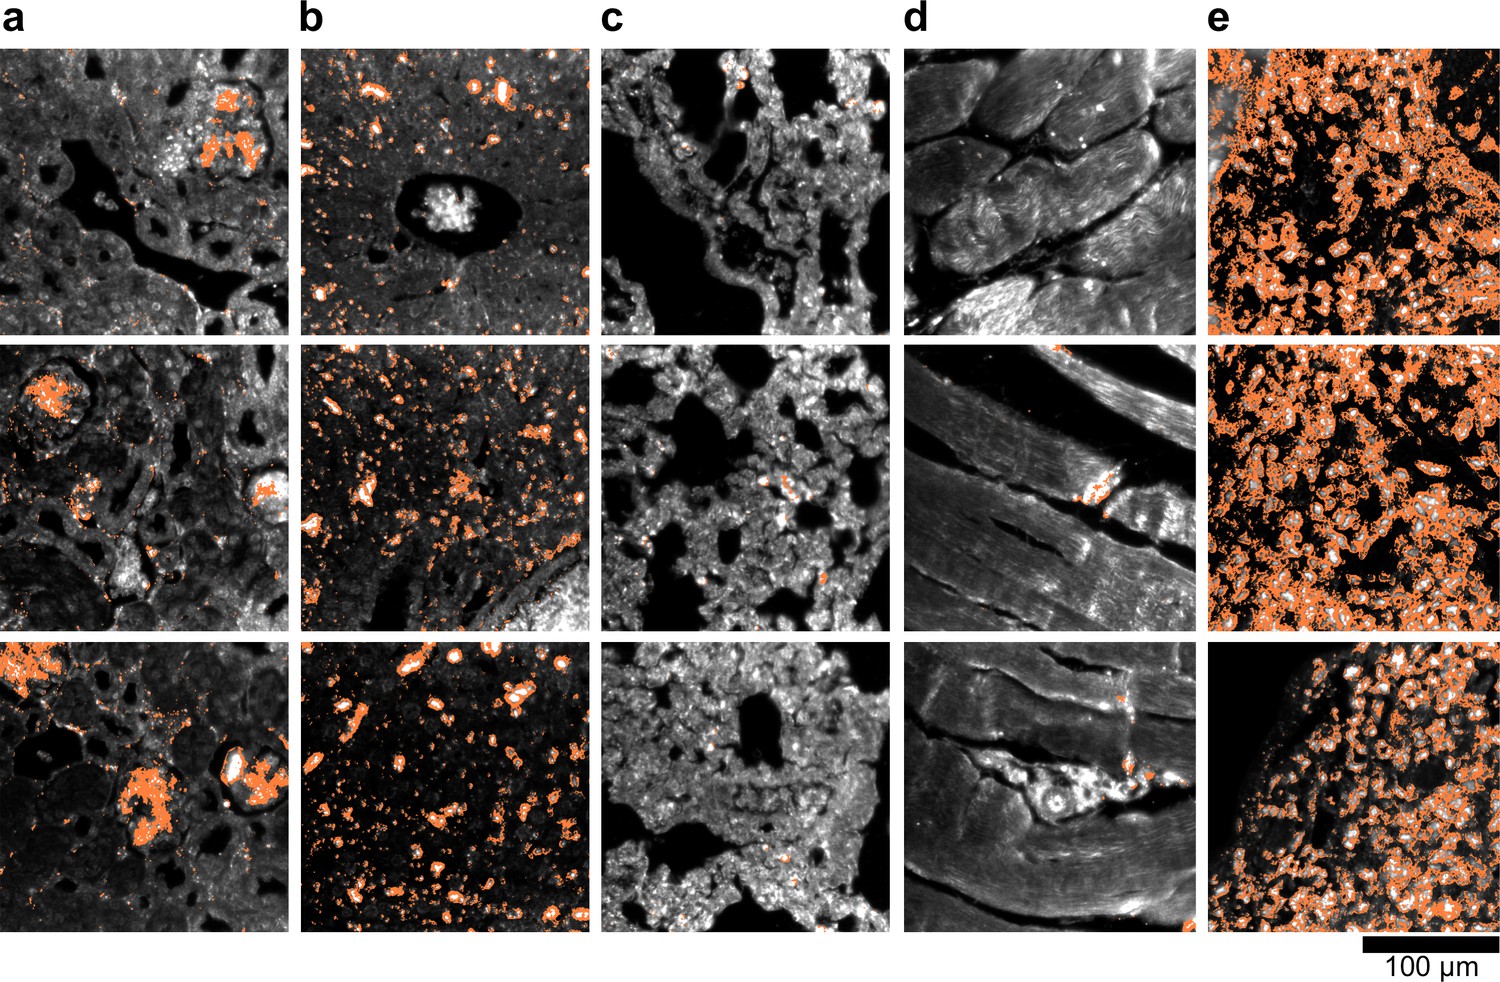
HSM-AD detection of additional LGNR-injected H&E-stained sections.
(a) kidney, (b) liver, (c) lung, (d) muscle, and (e) spleen. LGNR+ pixels are depicted in orange. Along with those in the main figures, these analyzed samples were used for calculations of detection sensitivity and specificity as well as whole-organ LGNR uptake.
Figure 2—figure supplement 12
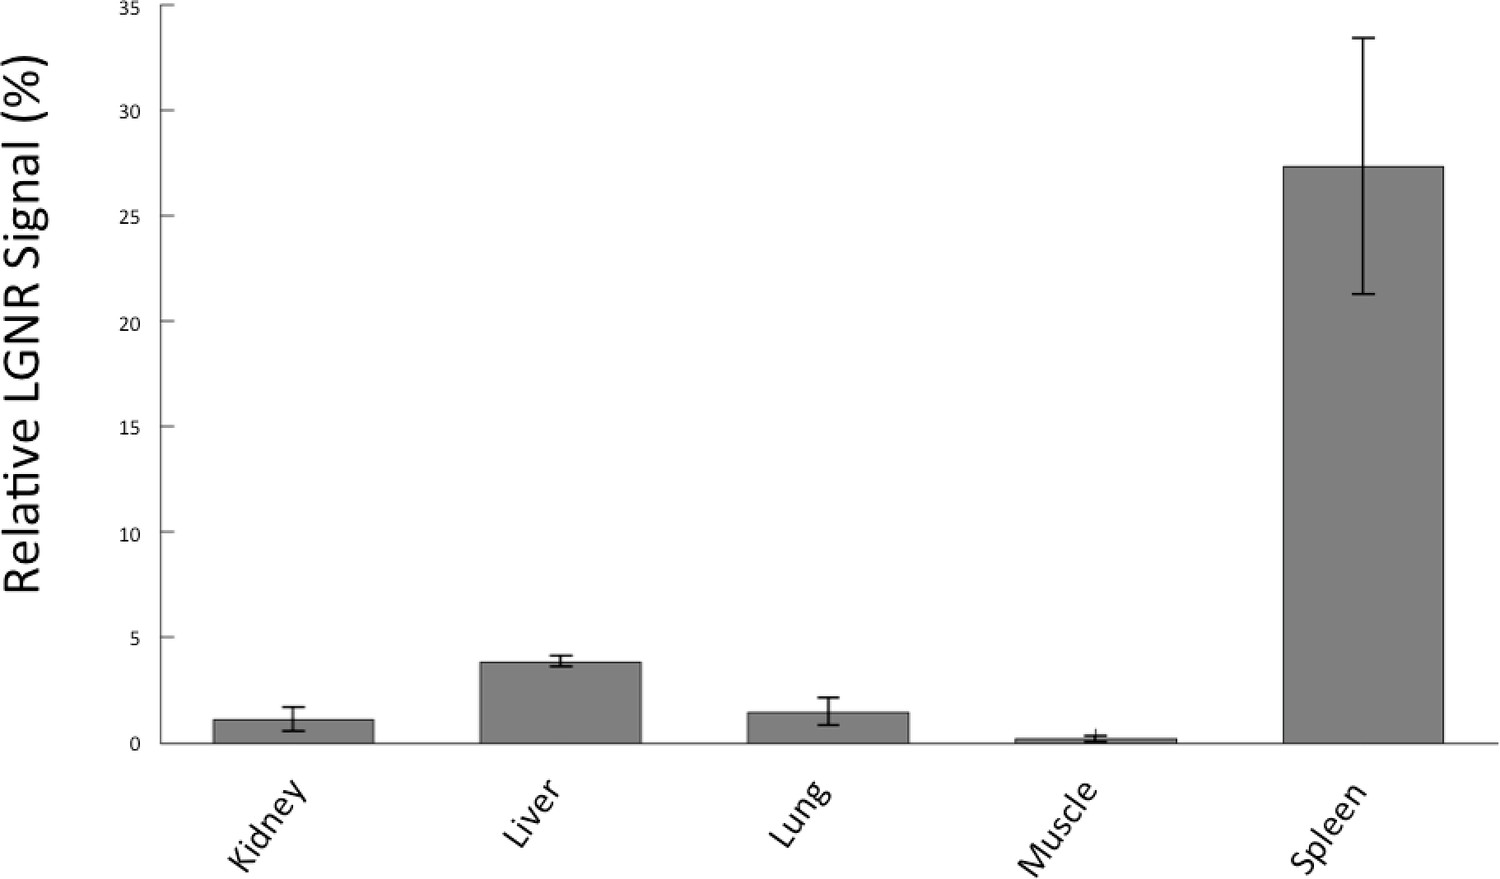
Quantitative whole-organ biodistribution measured with HSM-AD on unstained tissue sections.
All values are presented as the average relative LGNR signal (%) ± standard error of the mean (s.e.m) measured over four fields of view per organ. The results from unstained tissue sections are comparable to the results obtained for H&E stained sections.
Figure 2—figure supplement 13
Dark-field images of LGNR-injected unstained tissue sections.
(a) kidney, (b) liver, (c) lung, (d) muscle, and (e) spleen.
Figure 2—figure supplement 14
HSM-AD detection of LGNR-injected unstained tissue sections.
(a) kidney, (b) liver, (c) lung, (d) muscle, and (e) spleen. LGNR+ pixels are depicted in orange. These samples were used to calculate the values of LGNR uptake in unstained sections.
Figure 2—figure supplement 15
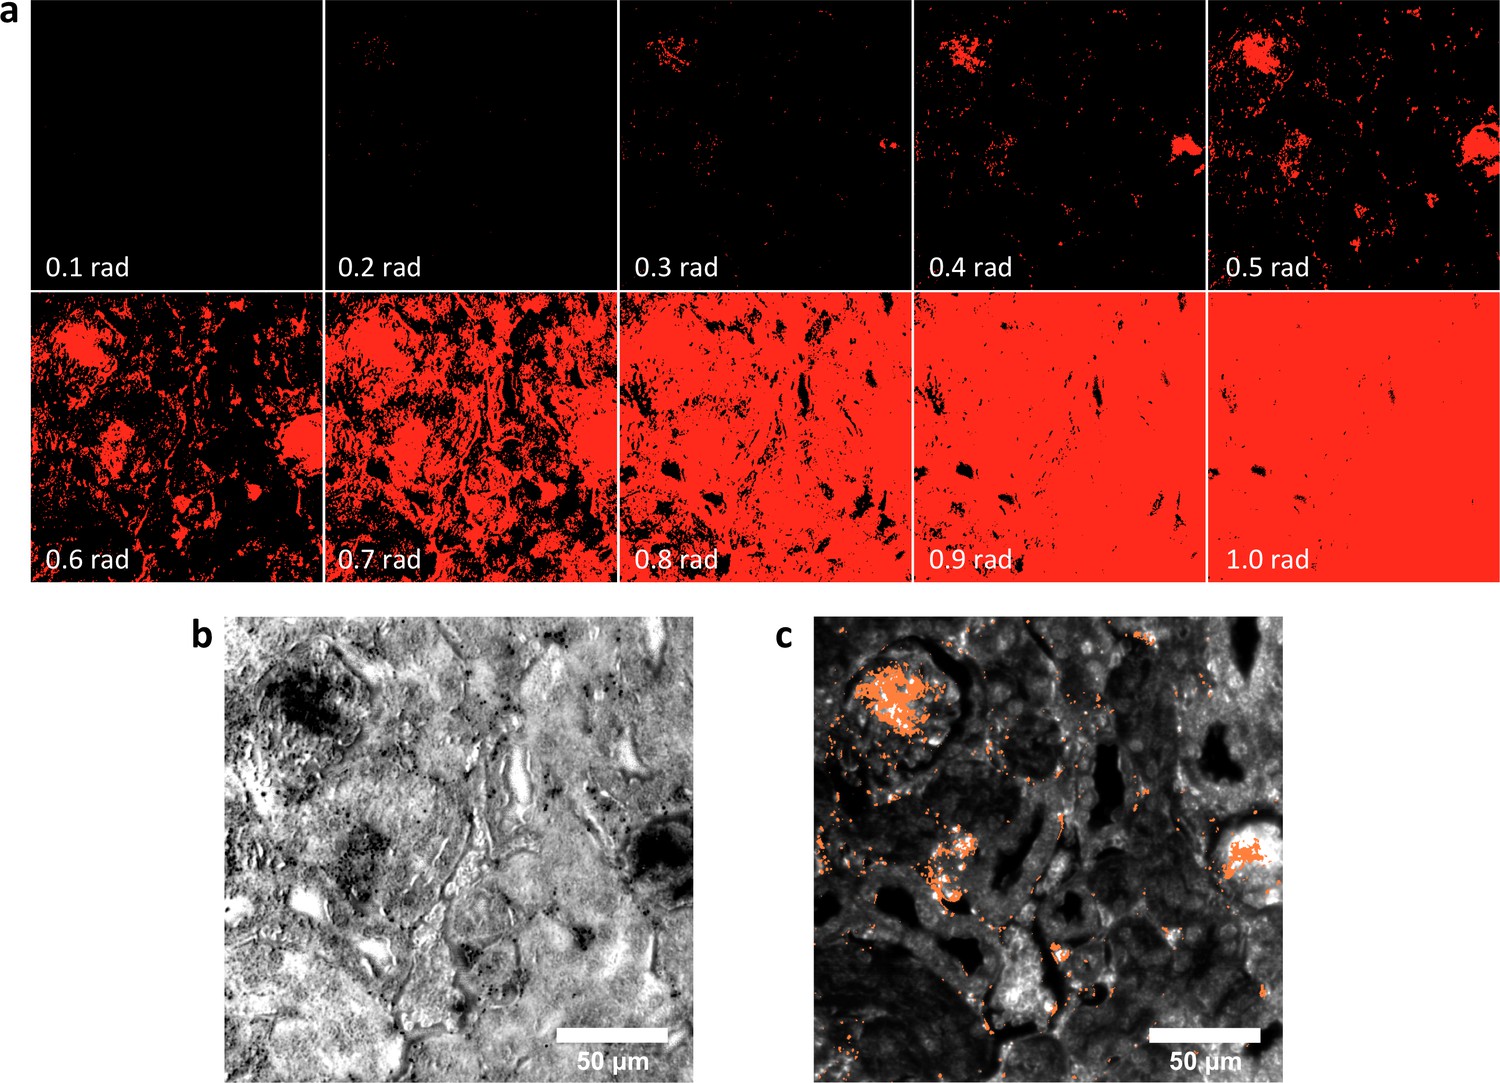
Spectral Angle Mapper (SAM) detection of LGNR+ kidney tissue.
(a) Results of SAM classification of LGNR+ pixels (red masks) with various user-defined angular tolerance values (in radians, bottom-left of each panel). Selection of low angular tolerance results in poor detection sensitivity, while high tolerance leads to poor detection specificity. Along with other parameters, angular tolerance must be user-defined for each hyperspectral image. SAM classification was performed as described in reference 30. (b) Guide image corresponding to the SAM-classified masks in (a). (c) HSM-AD analysis of the same hyperspectral image. Diagnostic evaluation of this and related images yielded the sensitivity and specificity values reported in Figure 2—figure supplement 1. As noted in reference 21, such values are not readily extracted using SAM and related methods.
Figure 3
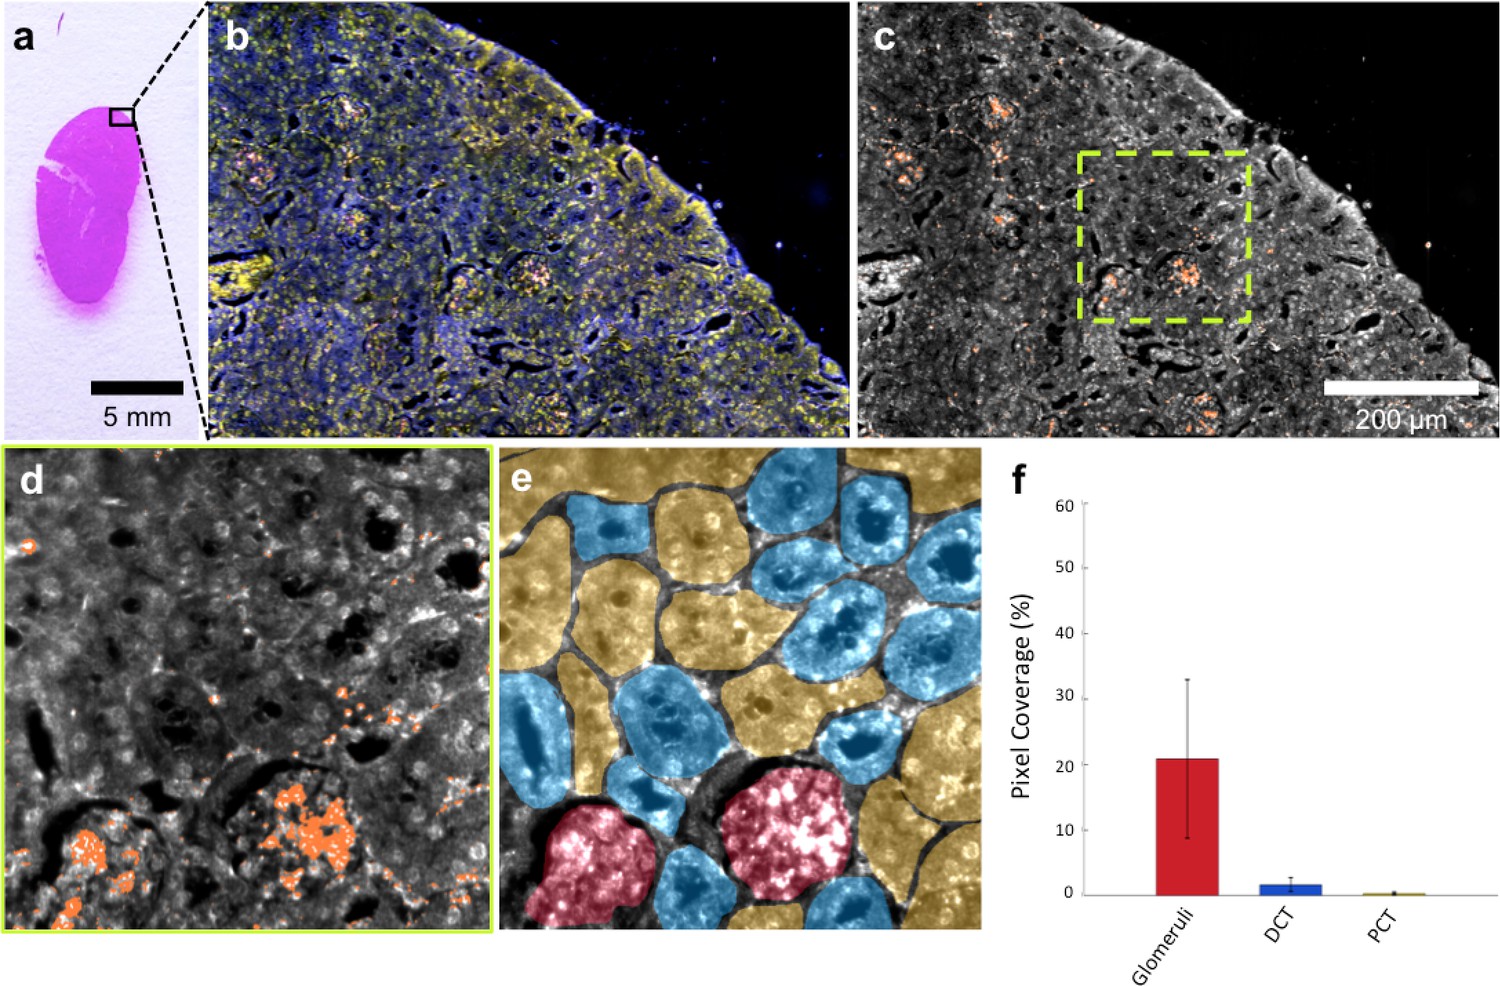
HSM-AD is capable of wide-field characterization of sub-organ distribution patterns of injected nanoparticles.
(a–c) Millimeter-scale fields of view of histological sections of kidney. Photographed (a), acquired with near diffraction-limited resolution with a hyperspectral dark-field camera (b), and analyzed by HSM-AD (c) to reveal variable nanoparticle uptake within the fine anatomical structures. (d–f) As in conventional histology, micro-anatomical features of the kidney including glomeruli, Bowman’s spaces, proximal convoluted tubule (PCT), and distal convoluted tubule (DCT) networks can be clearly identified in HSM-AD images (d). The ability to distinguish such histological details enables region of interest (ROI) analysis to quantify sub-organ accumulation of LGNRs (e,f). Quantification of the relative LGNR signal in glomeruli (red ROI), PCT (yellow ROI), and DCT (blue ROI) regions (e) revealed that the vast majority (~13-fold greater than in either tubule network) of renal LGNR uptake is localized within glomeruli (f). This is likely due to the size-dependent inability of LGNRs to traverse the ultrafiltration barrier formed by endothelial cells within glomerular capillaries. All quantitative data are represented as mean ± s.e.m. for each ROI type, as calculated from 4 unique fields of view acquired at 40x magnification.
-
Figure 3—source data 1
Data for kidney sub-organ ROIs.
- https://doi.org/10.7554/eLife.16352.027
Figure 4 with 2 supplements
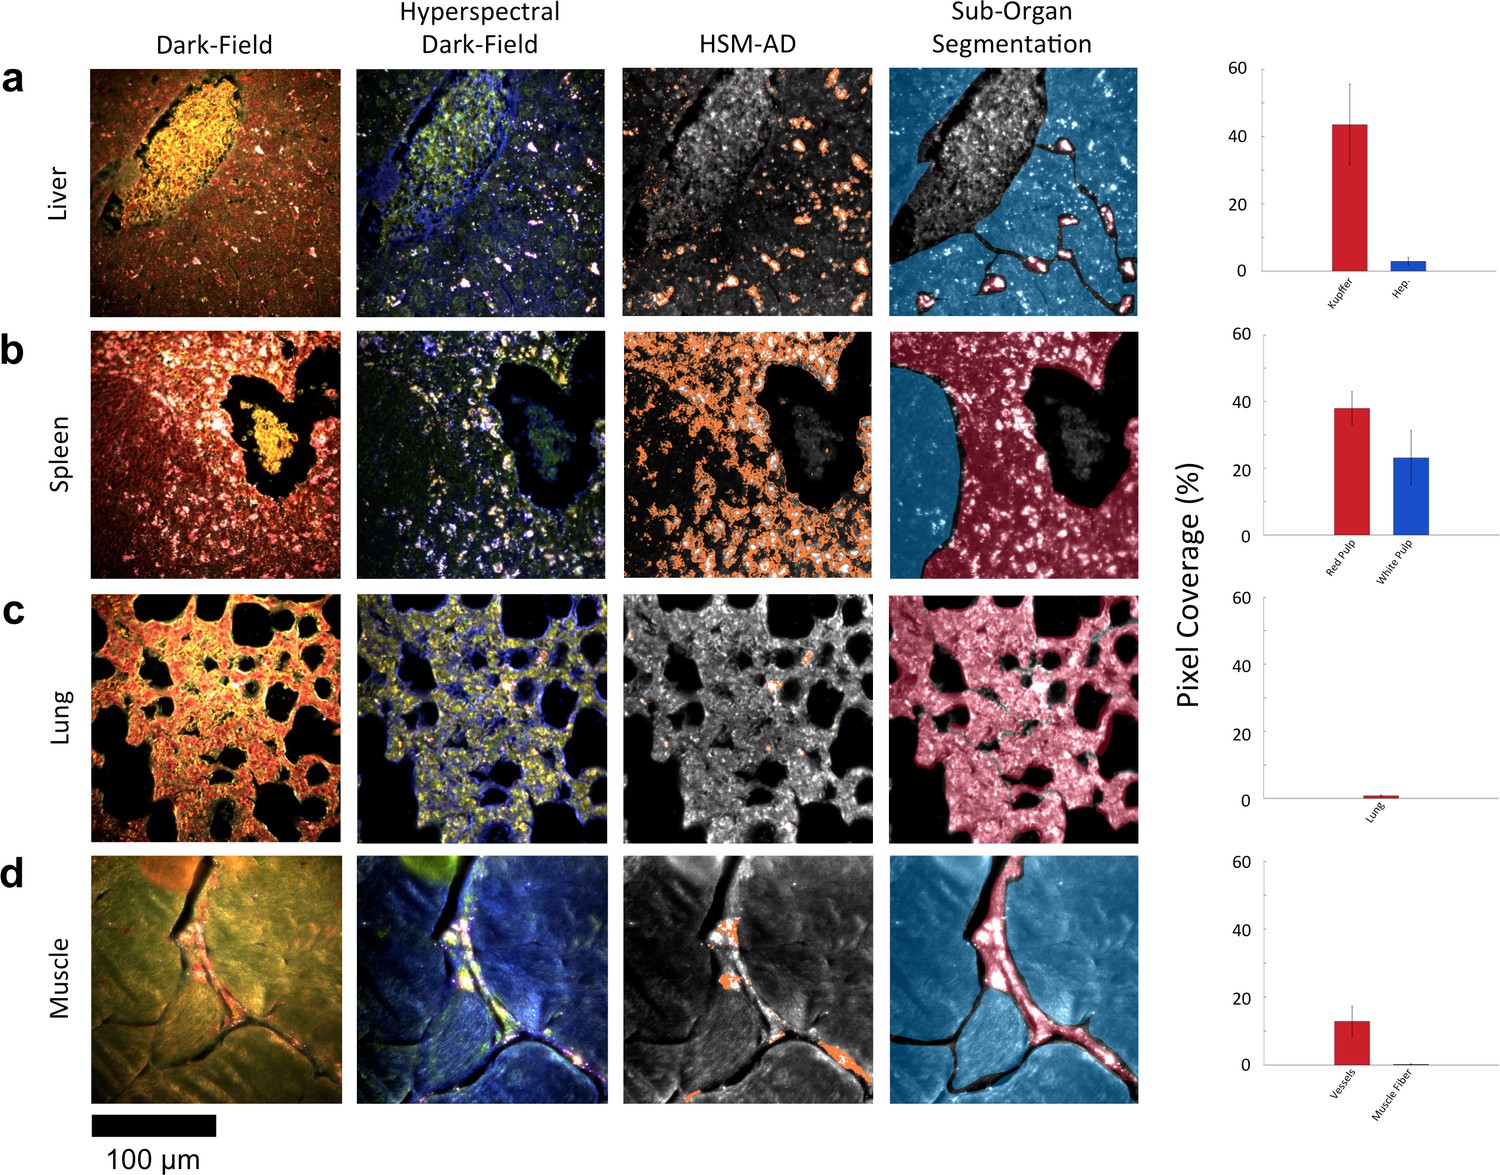
HSM-AD reveals characteristic patterns of nanoparticle microbiodistribution contingent upon tissue function.
(a) LGNR accumulation in hepatic tissue occurs mostly in concentrated foci located within liver sinusoids. Along with the size, shape, and frequency of these foci, this pattern strongly suggests that these particles have been phagocytosed by Kupffer cells, the resident macrophages of the liver (red ROI). While there is mild uptake of LGNRs within liver hepatocytes (blue ROI), HSM-AD sub-organ quantification indicates that uptake by Kupffer cells is roughly 15-fold higher than hepatocytic accumulation. (b) The pattern of LGNR uptake in the spleen is also consistent with the physiological functions of various splenic tissues. A greater relative LGNR signal was observed in regions of splenic red pulp (red ROI), which is responsible for blood filtration, than in the white pulp follicles (blue ROI) that house B and T lymphocytes. (c,d) While LGNRs were prevalent within the liver and spleen tissues, HSM-AD results indicated minimal particle accumulation within the lung (c) or muscle (d) tissue samples (each < 1% relative LGNR signal for whole-tissue quantification). Interestingly, HSM-AD analysis demonstrated that the vast majority of LGNRs in muscle tissue sections were localized in blood vessels (red ROI) rather than within the muscle fiber tissue itself (blue ROI). Quantitative data are represented as mean ± s.e.m. as described previously.
-
Figure 4—source data 1
Data for liver, spleen, lung, and muscle sub-organ ROIs.
- https://doi.org/10.7554/eLife.16352.029
Figure 4—figure supplement 1

Sub-organ region of interest (ROI) segmentation for additional tissue sections used for quantitative results presented in Figures 3 and 4 of the main text.
The ROI color schemes for each sub-organ feature are identical to those listed in the legends of the relevant figures in the main text. (a) kidney, (b) liver, (c) lung, (d) muscle, and (e) spleen.
Figure 4—figure supplement 2
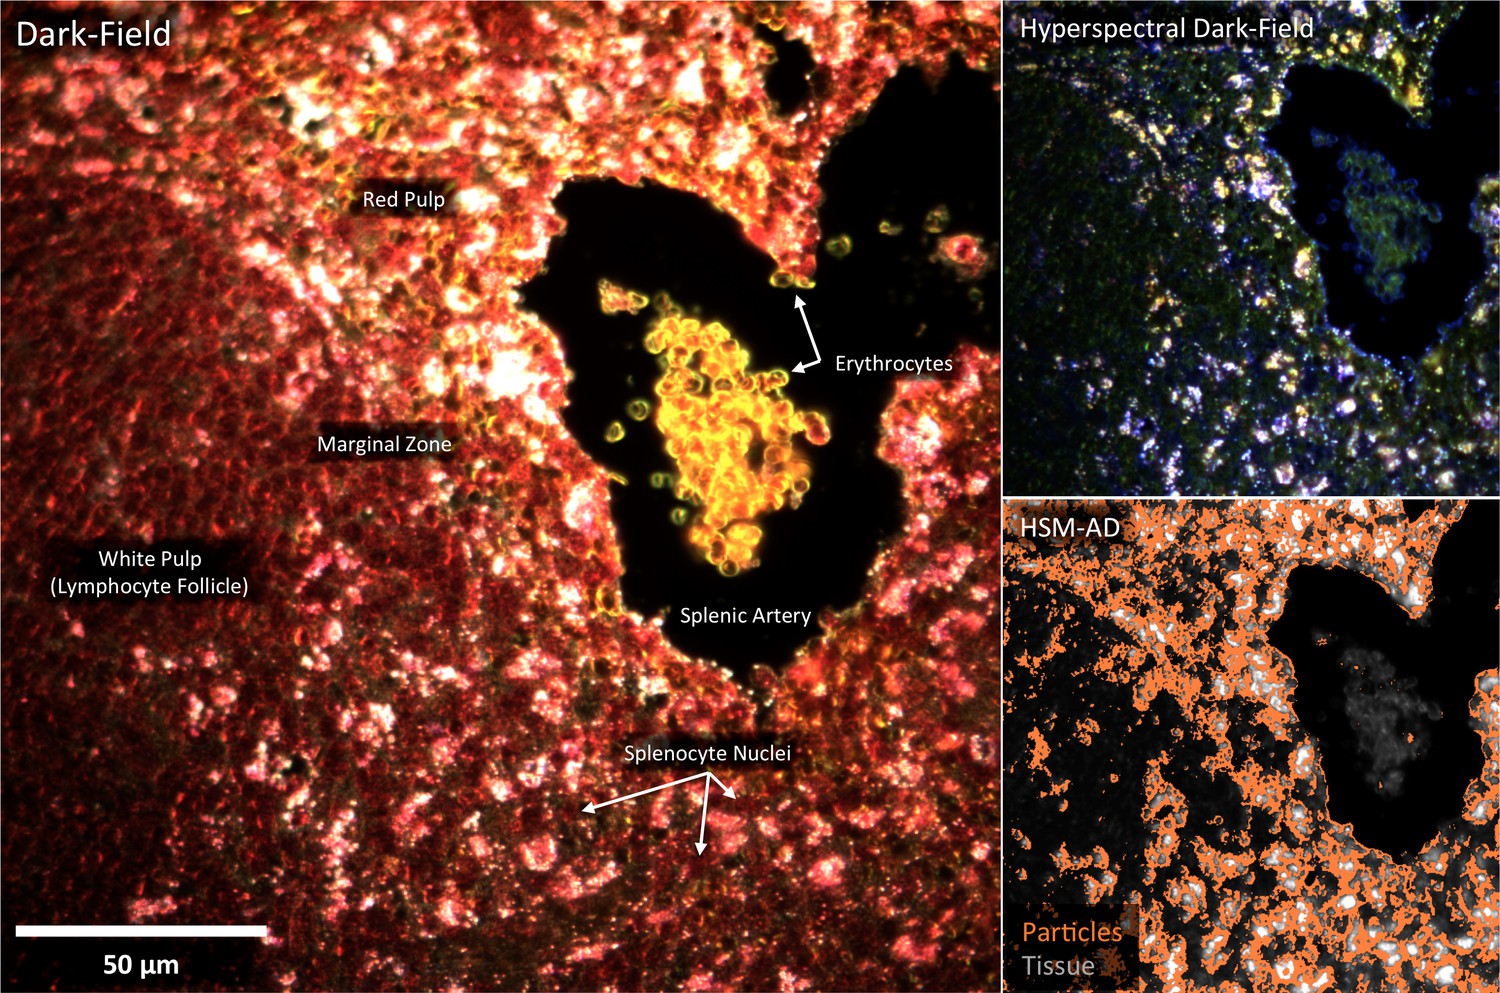
Detail of Figure 4b: spleen tissue histology correlated with LGNR uptake.
Using HSM-AD, it is possible to cross-reference nanoparticle uptake patterns and tissue microstructures with sub-cellular resolution.
Figure 5
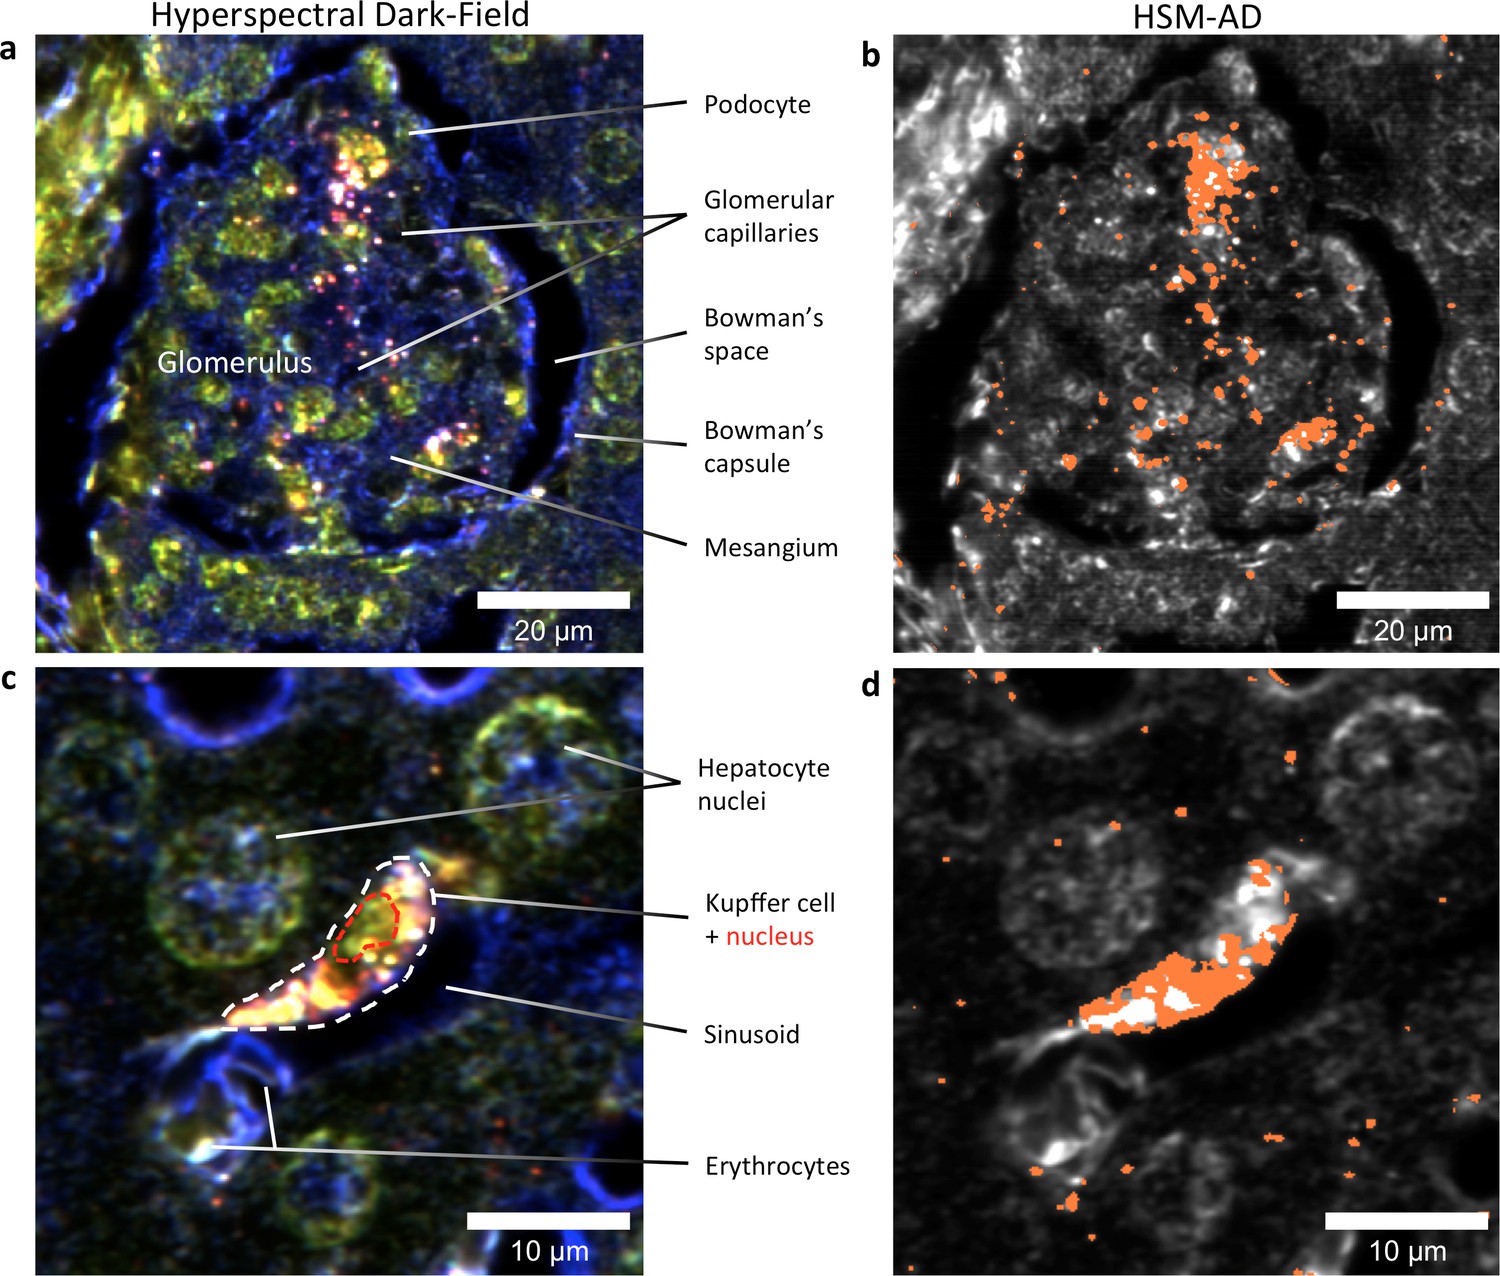
HSM-AD reveals the sub-cellular localization of intravenously administered nanoparticles with histological precision.
(a,b) Hyperspectral (a) and HSM-AD (b) images of a renal glomerulus acquired at 100x magnification. A majority of LGNRS are found within or in close proximity to glomerular capillaries. Trace levels of LGNRs are observed in the kidney tissue outside of Bowman's capsule. (c,d) Zoomed views of Hyperspectral (c) and HSM-AD (d) images of liver tissue acquired at 100x magnification. Several erythrocytes and a Kupffer cell (dashed white line) can be observed residing within a liver sinusoidal vessel. Within the Kupffer cell, the nucleus (dashed red line) can be distinguished. HSM-AD analysis indicated the prevalence of LGNRs within the Kupffer cell relative to surrounding hepatocytes. The minimal LGNR signal was detected in the region identified as the nucleus, consistent with cytoplasmic LGNR localization. Several bright regions within the cell were not identified as LGNRs; these regions likely result from particle aggregation within acidic lysosomes following uptake by the Kupffer cell.
Figure 6 with 3 supplements
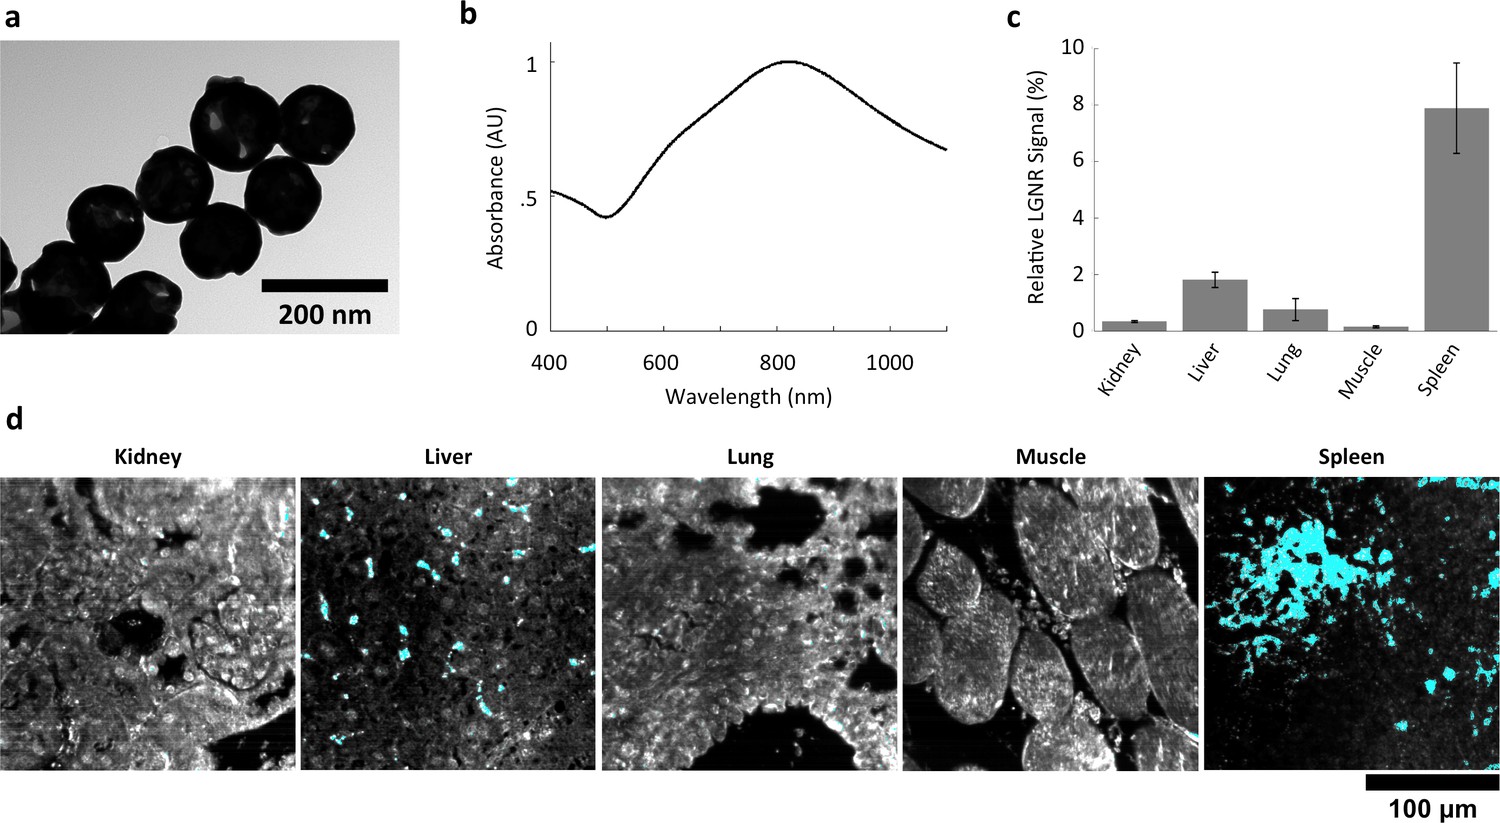
Characterization of gold nanoshell uptake after intravenous administration.
(a,b) Nanoshells (119 nm silica core with 14 nm-thick gold coating) exhibit distinct particle morphology and composition (a) that (like LGNRs) yield a near-infrared (~800 nm) spectral peak (b). However, the Nanoshell spectrum is markedly broader than the resonance observed for LGNRs. (c,d) HSM-AD revealed that Nanoshell uptake displays inter-organ distribution patterns somewhat similar to those observed for LGNRs, with maximal accumulation in the spleen (c). Values are represented as mean ± s.e.m. from four FOVs per tissue. However, there are notable distinctions including minimal Nanoshell uptake within kidney tissue and concentration of Nanoshells within splenic white pulp (d) (Nanoshell+ pixels are depicted in cyan).
-
Figure 6—source data 1
Data for Nanoshell uptake in organs.
- https://doi.org/10.7554/eLife.16352.034
Figure 6—figure supplement 1
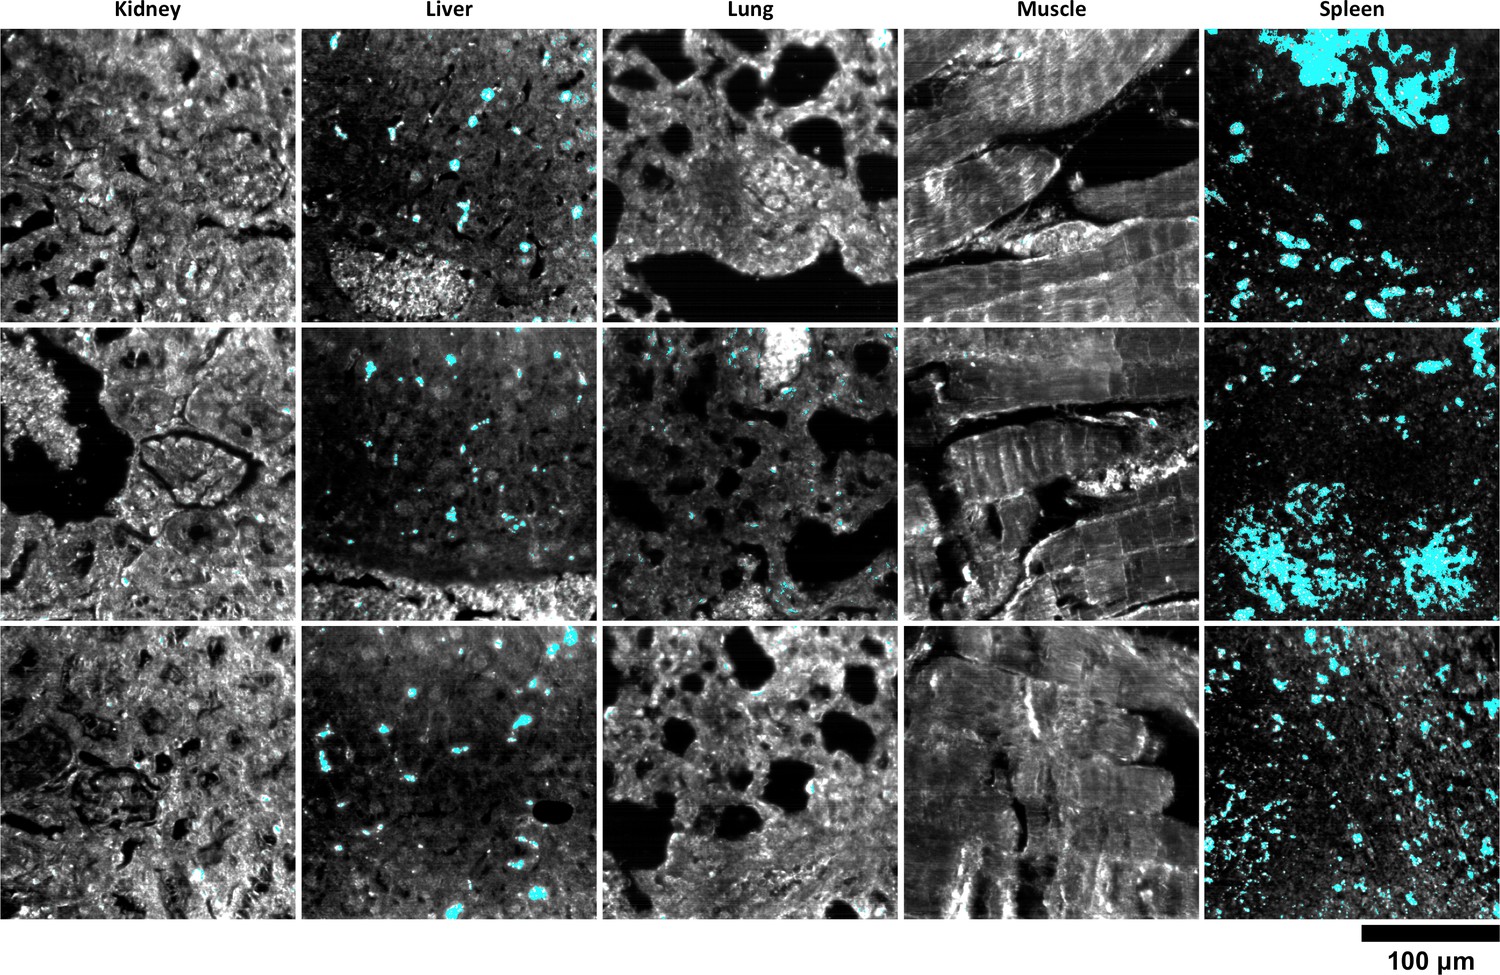
Additional HSM-AD images of Nanoshell uptake used for quantification.
Quantitative data from these FOVs were used to produce the bar graph in Figure 6c.
Figure 6—figure supplement 2

Detail of Nanoshell uptake in spleen tissue.
(a) Conventional dark-field image of H&E-stained spleen tissue. The dashed white line approximately demarcates the marginal zone separating the red and white pulp. (b) HSM-AD indicates that, unlike LGNRs, Nanoshells are localized within white pulp follicles 24 hr after intravenous injection.
Figure 6—figure supplement 3
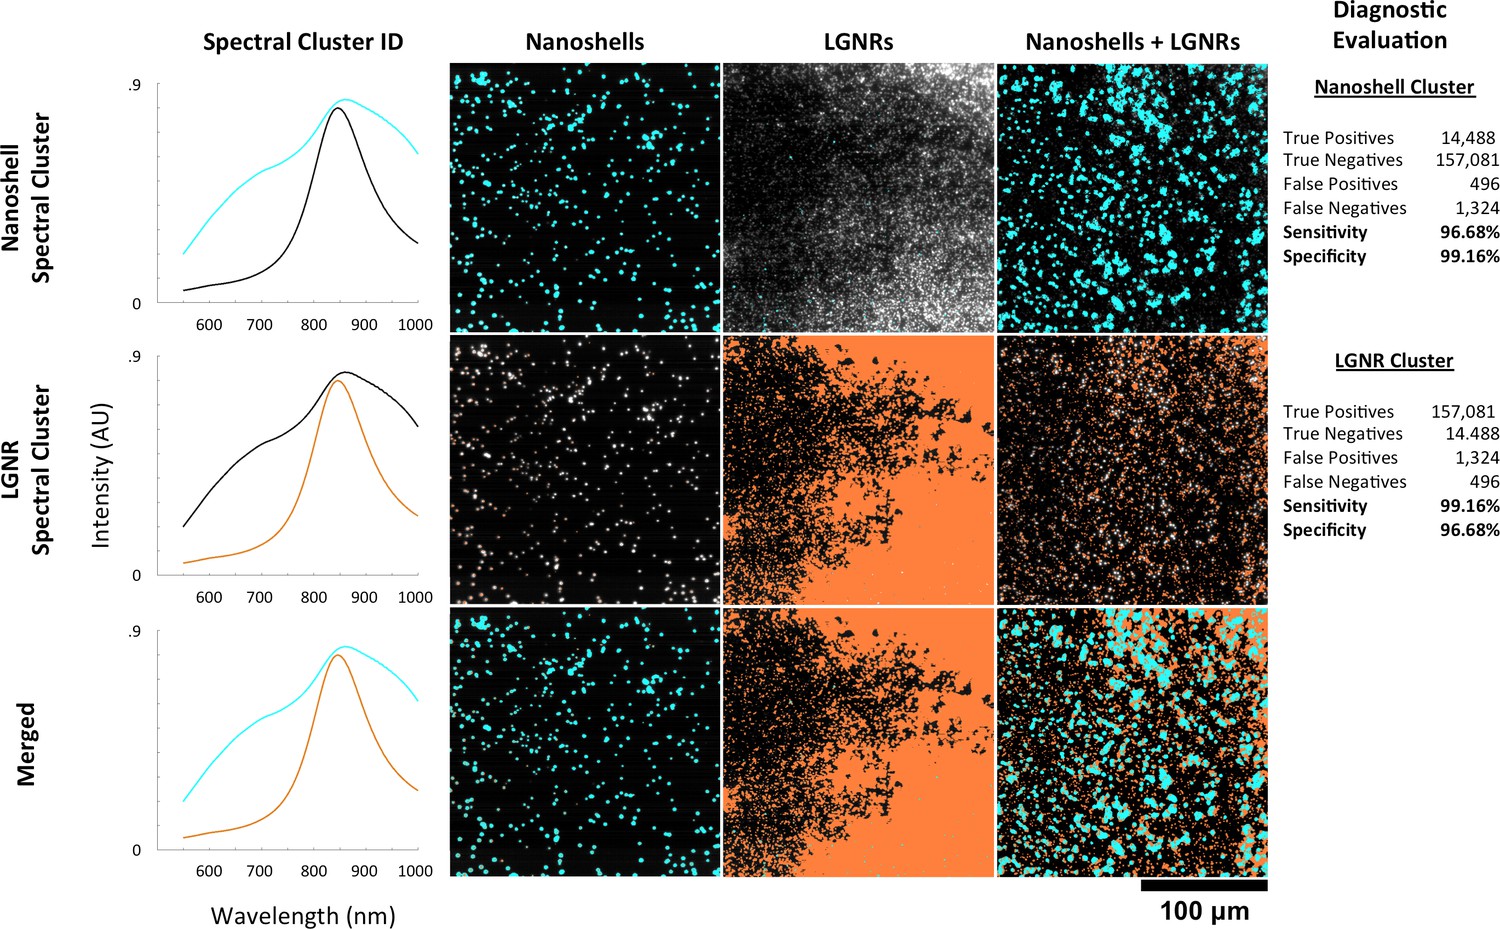
HSM-AD spectral unmixing of samples containing gold nanoshells and LGNRs.
HSM-AD was trained on a hyperspectral image of a sample containing a mixture of Nanoshells and LGNRs. Using a target of two clusters, this training yielded one spectral cluster corresponding to the spectrum of the Nanoshells and another spectral cluster corresponding to LGNRs (far-left column). These clusters were then used to map images of Nanoshells + LGNRs, Nanoshells only, and LGNRs only. The presence of Nanoshells and LGNRs are marked using cyan and orange masks, respectively. HSM-AD classification using the Nanoshell cluster (top row) for all three sample types achieved 96.68% sensitivity and 99.16% specificity. HSM-AD classification using the LGNR cluster (middle row) for the samples achieved 99.16% specificity and 96.68% specificity. The bottom row depicts the merge of these two cluster maps. As a note, the reciprocal nature of the sensitivity and specificity values for the two different particle types results from the fact that, for pure particle solutions, the false positives for one particle type are false negatives for the other particle type and vice versa. The same reciprocal nature holds for true positives and true negatives as well. This relationship can be seen in the raw pixel counts used for diagnostic evaluation (far-right column).
Figure 7 with 6 supplements

HSM-AD analysis of GNS@SiO2.
(a) Classification of unstained control tissues yields negligible false-positive detection for GNS@SiO2 (green), which exhibit a peak plasmonic resonance of ~550 nm. (b,c) Intravenously-administered GNS@SiO2 accumulate in the Kupffer cells of the liver and the marginal zone of the spleen within 2 hr (b) and persist up to 24 hr (c).
-
Figure 7—source data 1
Data for GNS@SiO2 uptake in organs.
- https://doi.org/10.7554/eLife.16352.039
Figure 7—figure supplement 1
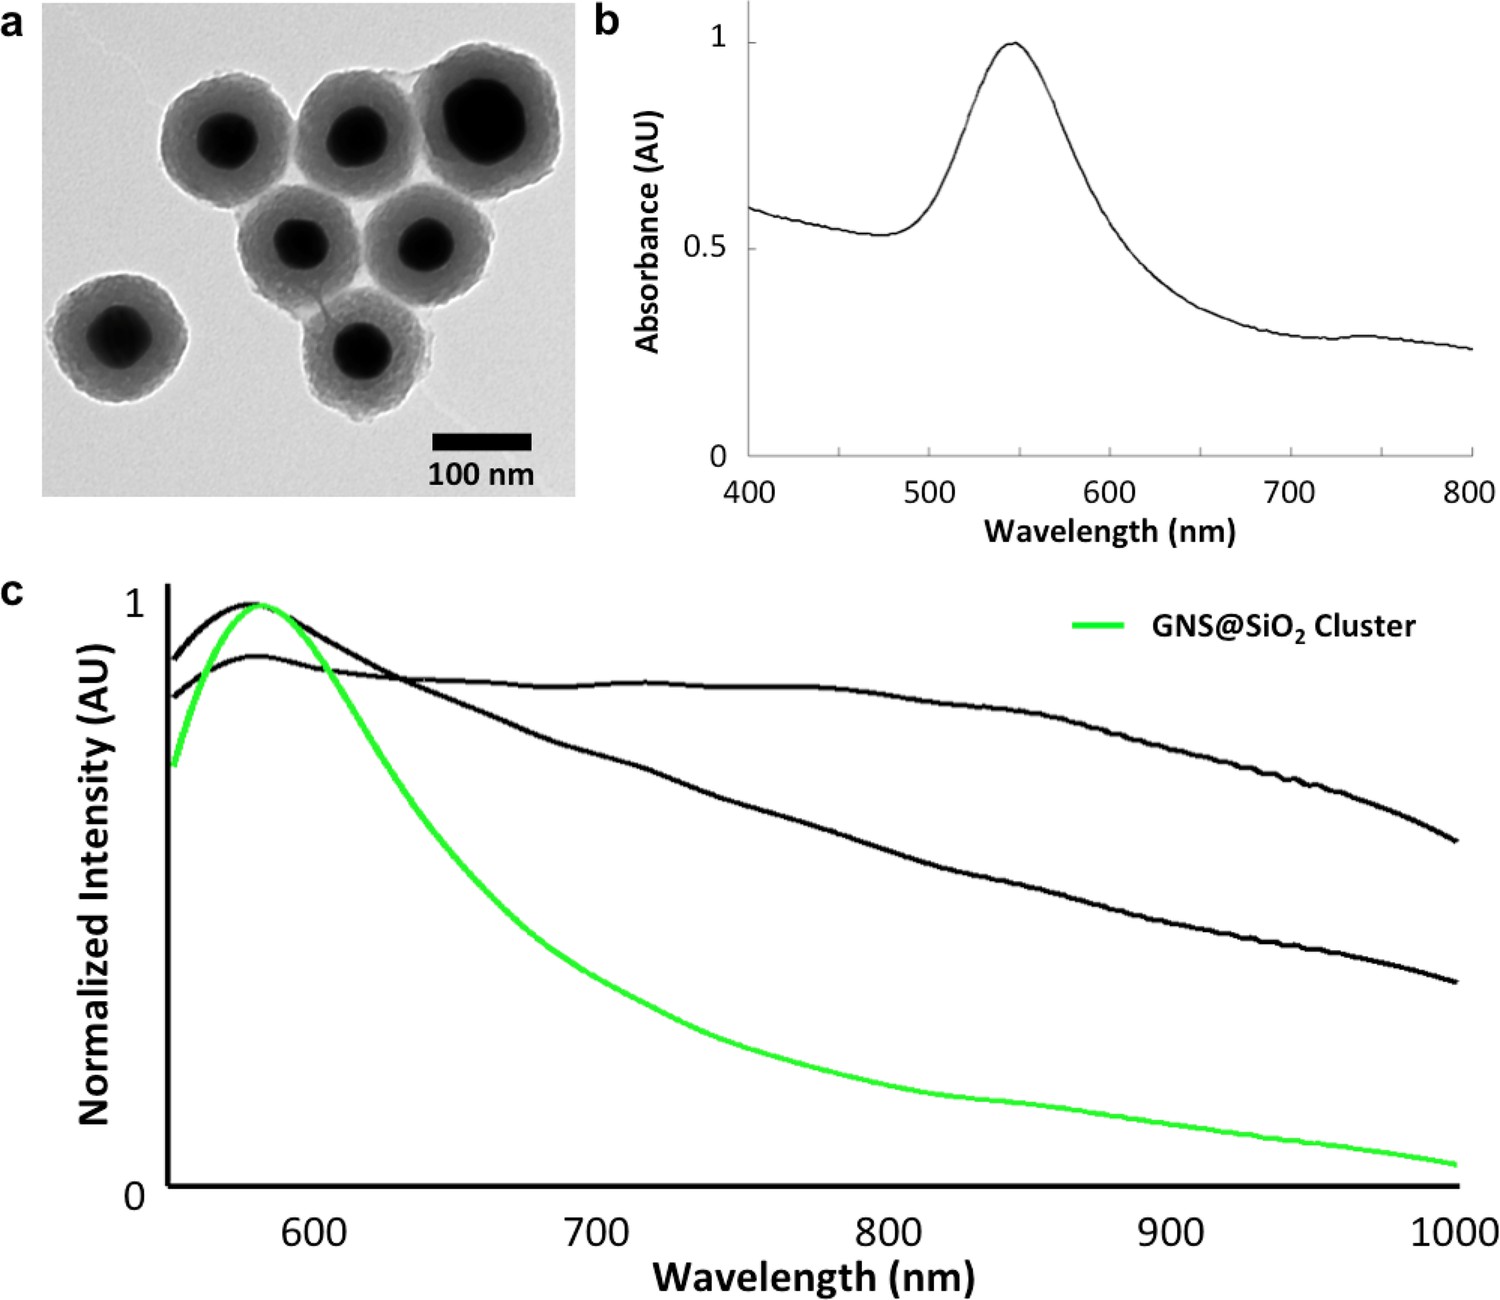
Structural and spectral characterization of GNS@SiO2.
(a) TEM of GNS@SiO2. (b) Vis-NIR absorbance spectrum of GNS@SiO2 in water (SPR ~550 nm). (c) Spectral library clusters identified from training on images of unstained tissues (in CytoSeal) resected from mice injected with GNS@SiO2. The target number of clusters was set to three rather than five (used for LGNR detection) due to the absence of H&E staining. Cluster 2 (green) corresponds to the GNS@SiO2 and exhibits a red-shifted plasmonic peak relative to particles in water, as expected due to the difference in refractive environment.
Figure 7—figure supplement 2
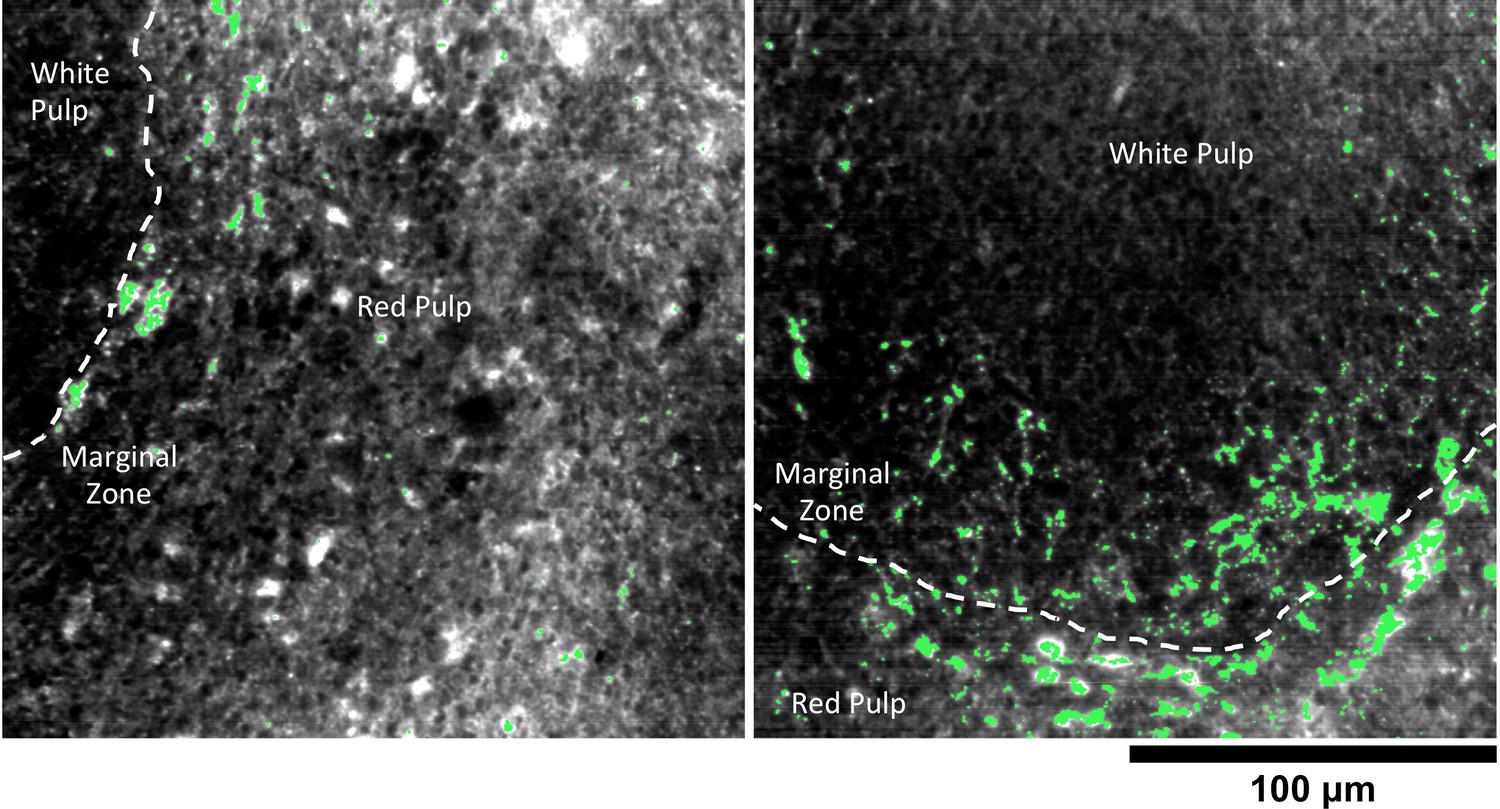
Detail of GNS@SiO2 in spleen.
HSM-AD reveals that GNS@SiO2 accumulate mostly in the marginal zone tissue between red and white pulp. The approximate boundaries between red pulp and white pulp follicles are marked by dashed white lines.
Figure 7—figure supplement 3
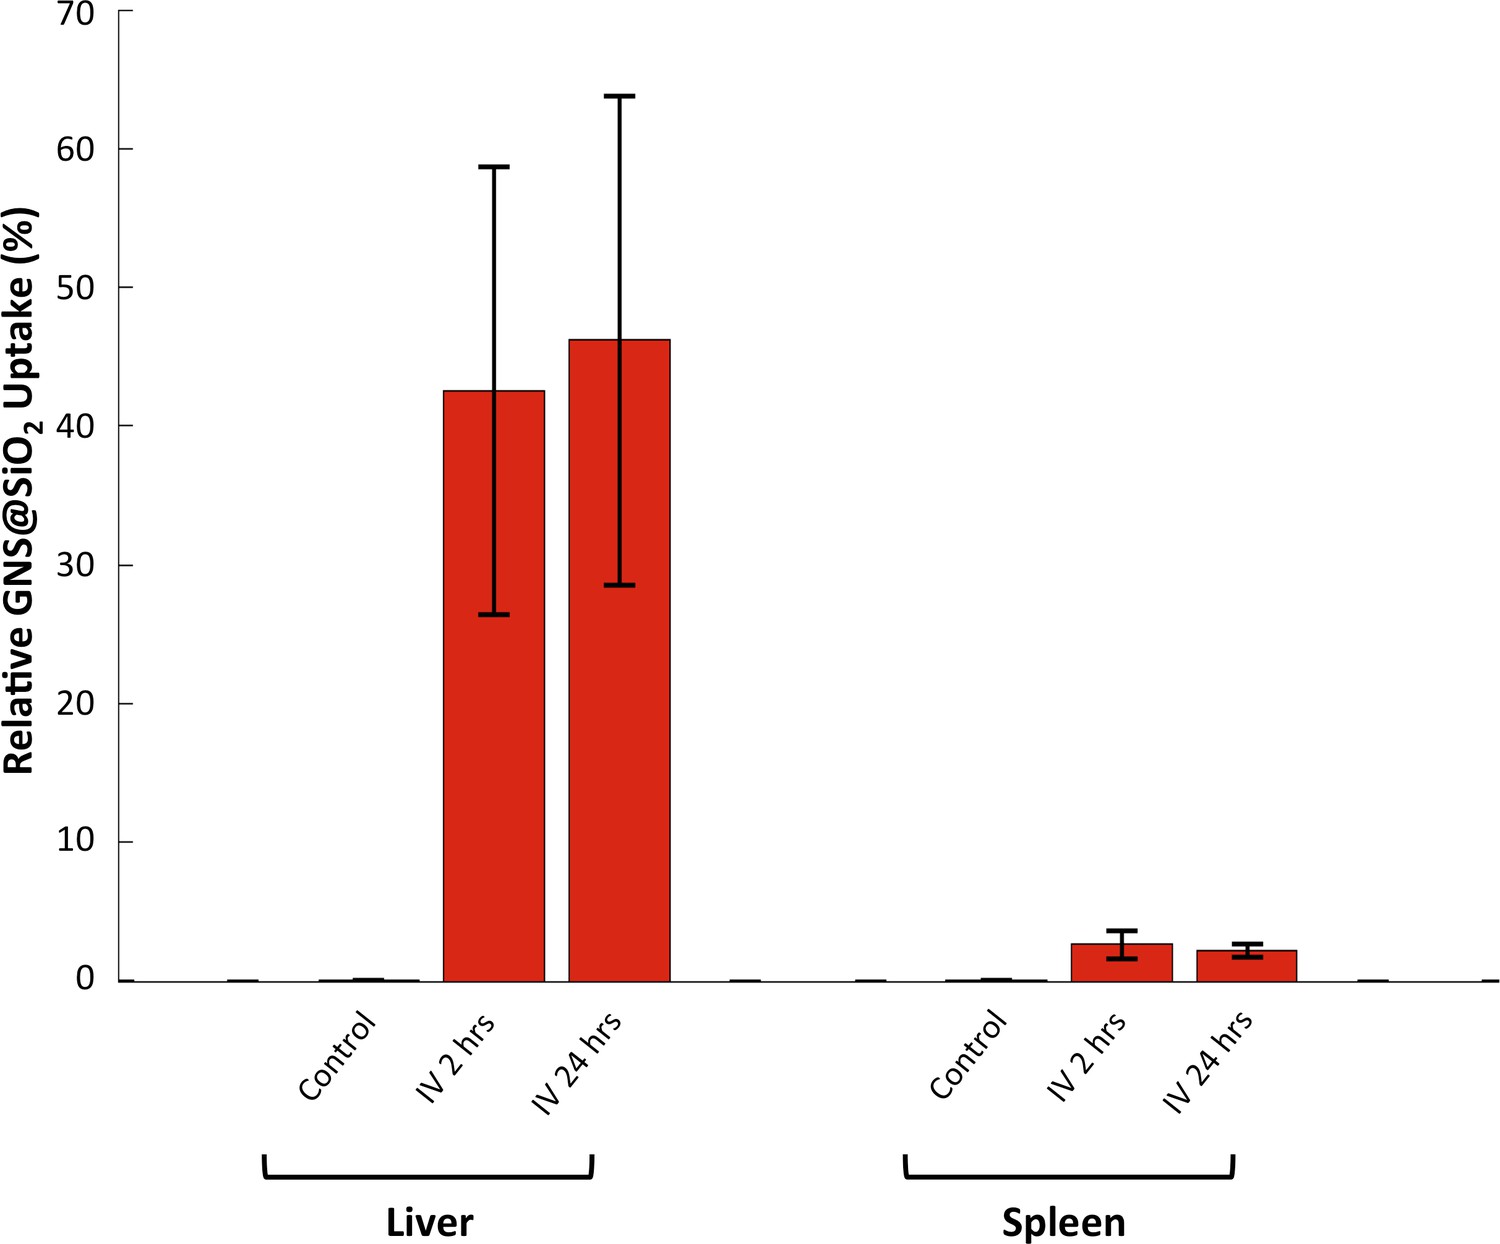
HSM-AD quantification of GNS@SiO2 uptake in liver and spleen tissue.
Relative GNS@SiO2 uptake was measured using the positive ratio approach described in the methods section. All values represent the mean GNS@SiO2 uptake from 4 FOVs for each injection/tissue combination. Error bars represent standard error of the mean (s.e.m.).
Figure 7—figure supplement 4

Inductively-Coupled Plasma Mass Spectrometry (ICP-MS) quantification of GNS@SiO2 uptake in liver and spleen tissue.
Quantitative measurements of atomic gold present in tissue samples prepared through microwave digestion. Counts are given in parts per billion (ppb) of Au.
Figure 7—figure supplement 5
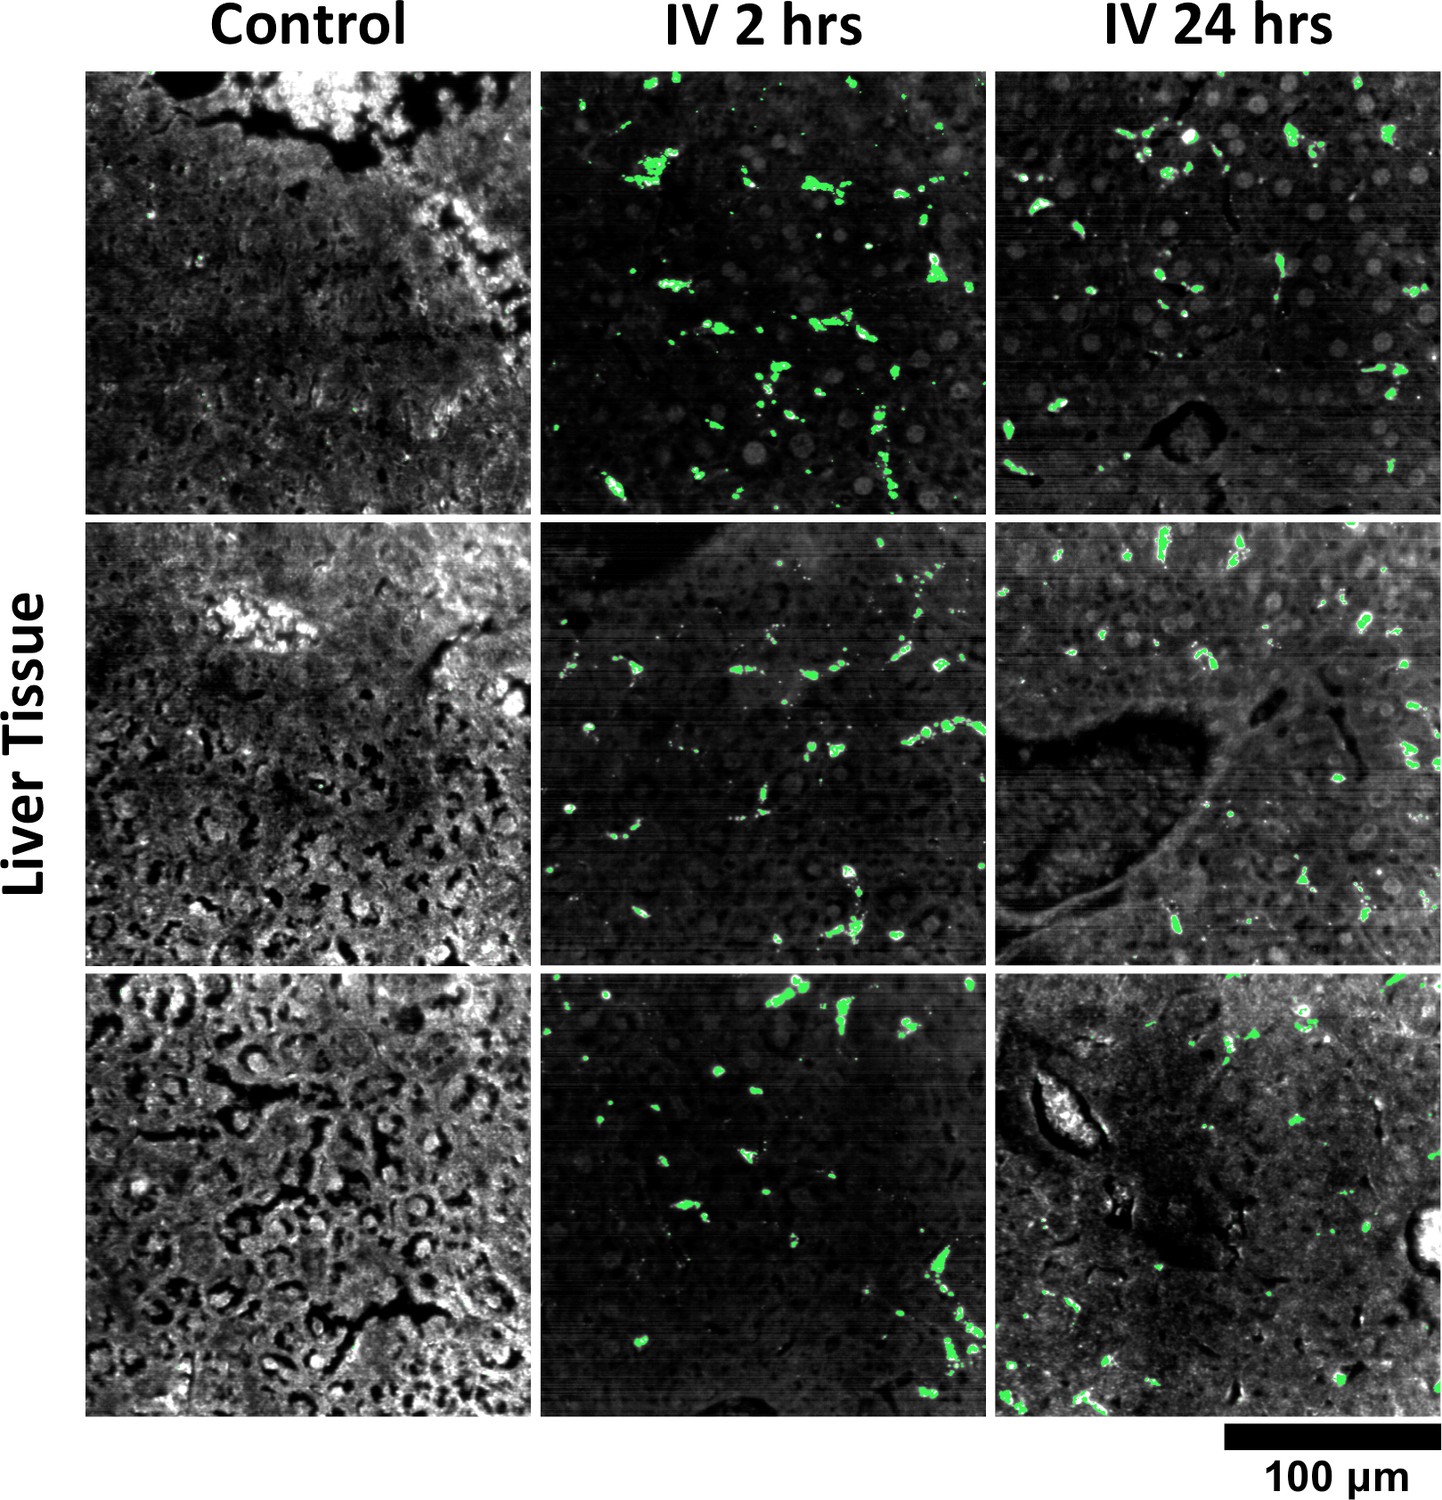
Additional HSM-AD images of GNS@SiO2 uptake in liver tissue.
Quantitative data from these FOVs were used to produce the bar graph in Figure 7—figure supplement 3.
Figure 7—figure supplement 6
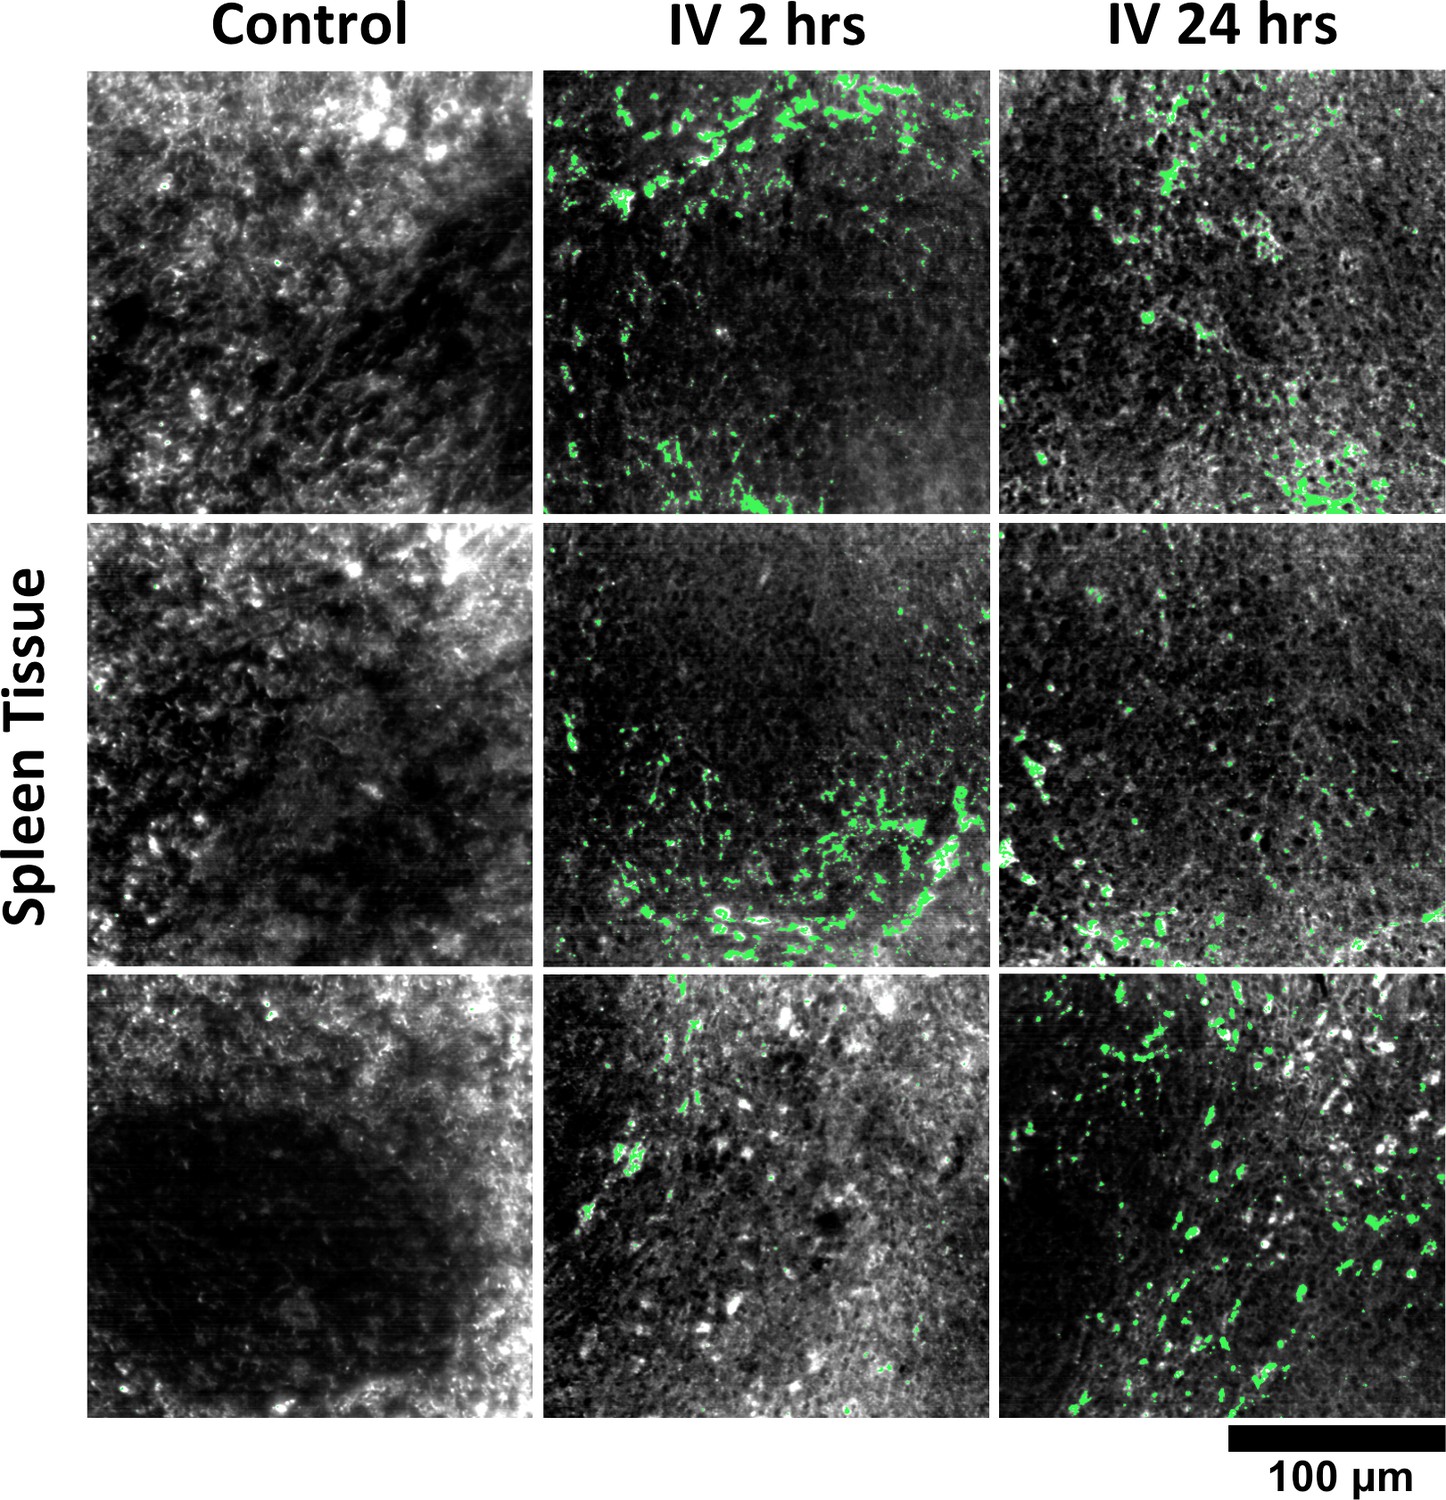
Additional HSM-AD images of GNS@SiO2 uptake in spleen tissue.
Quantitative data from these FOVs were used to produce the bar graph in Figure 7—figure supplement 3.
Figure 8 with 1 supplement
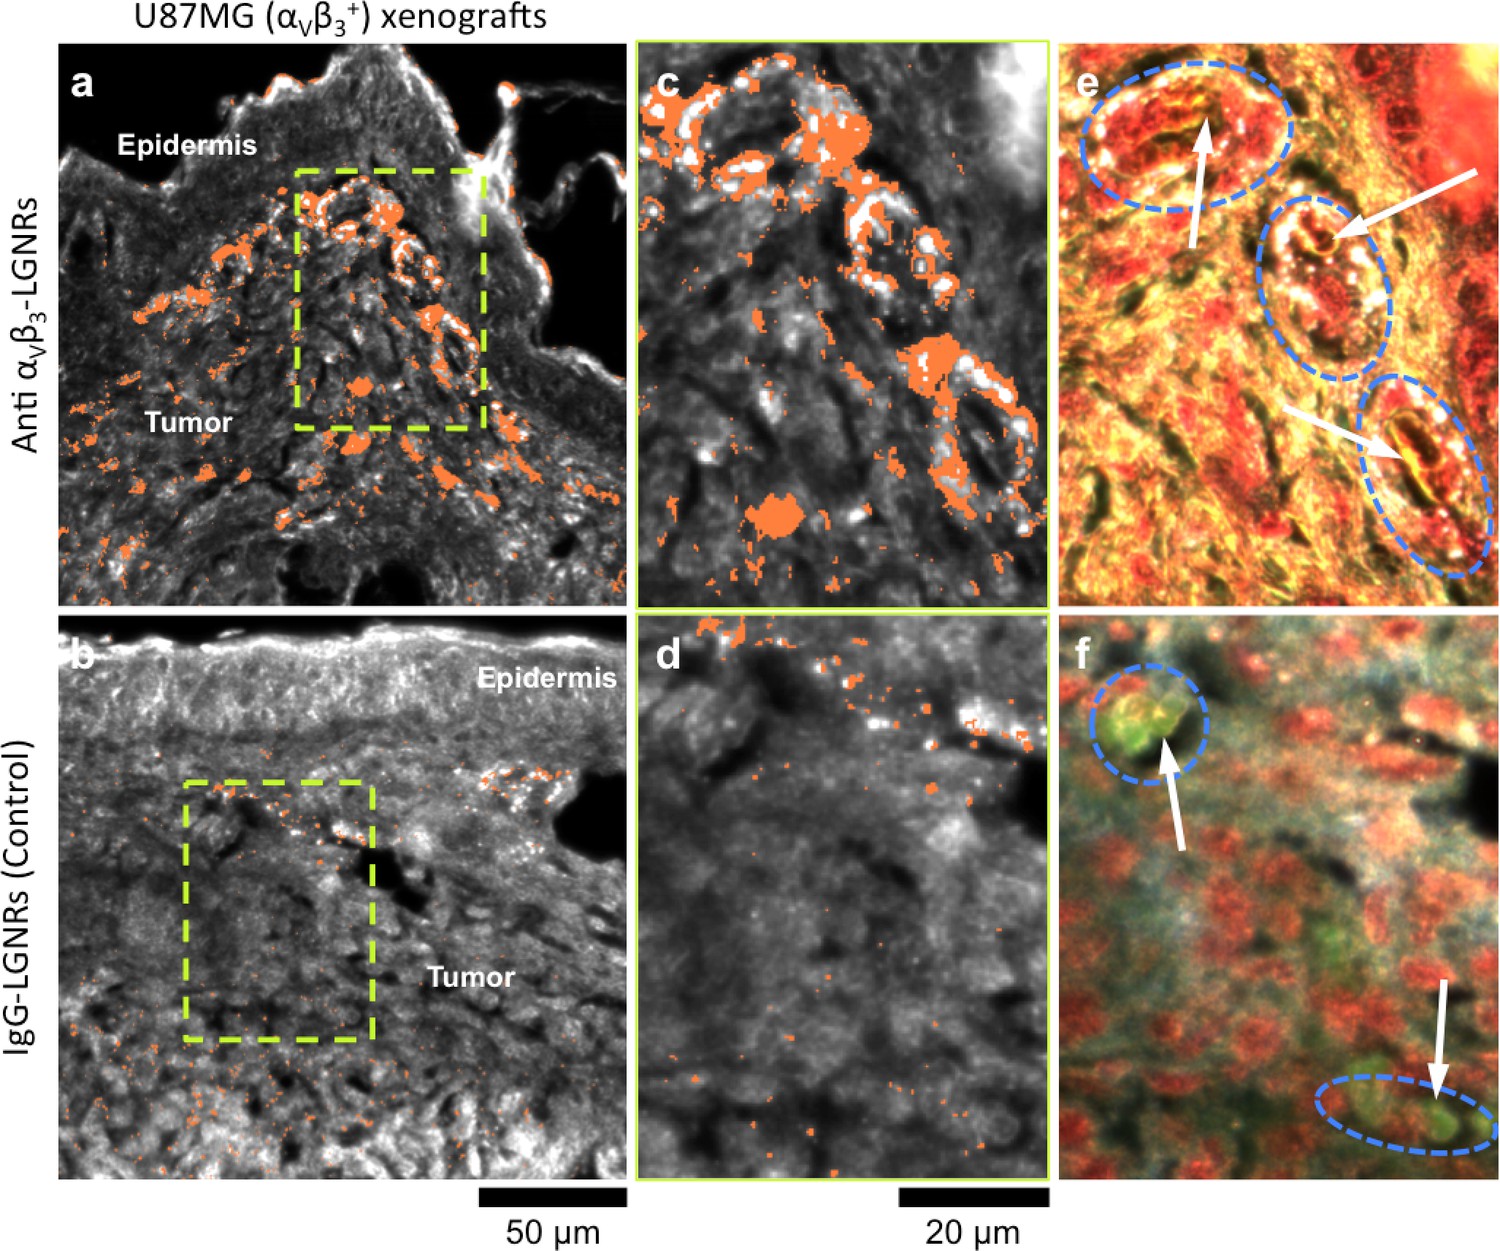
Active molecular functionalization affects nanoparticle uptake quantitatively and spatially within target tissues.
(a,b) HSM-AD images of sub-dermal U87MG tumor xenografts from mice injected with LGNRs display distinct accumulation patterns depending on the molecular specificity of the LGNR surface coating. Anti-αVβ3 LGNRs exhibit 7.5-fold greater accumulation in tumor tissue (a) than spectrally-identical LGNRs with non-specific IgG antibody coating (b) (n = 4 FOVs for Anti-αVβ3 LGNRs, n = 5 FOVs for IgG-LGNRs,two-tailed Student’s t-test, p=0.0041). The greater uptake of anti-αVβ3 LGNRs may result in part from specific LGNR binding to αVβ3 integrin, which is over-expressed by U87MG cells. (c–f) Validation of HSM-AD images with dark-field images of slightly higher spatial resolution further indicates that a substantial portion of anti-αVβ3 LGNRs are located along the edges of small capillaries within the tumor tissue (c,e) while no such association is observed for IgG-LGNRs (d,f). This observation is consistent with the nature of angiogenic tumor vasculature, which is also characterized by high expression levels of αVβ3 integrin in the vascular endothelium. Individual erythrocytes within angiogenic capillaries are denoted by white arrows, and capillary edges are approximately outlined by dashed blue ovals (e,f). Discrete regions of anti-αVβ3 LGNRs were also observed outside of the tumor vasculature, presumably due to either (1) specific binding to αVβ3integrin expressed by U87MG cells and/or (2) non-specific accumulation via the enhanced permeability and retention (EPR) effect characteristic of tumors. The absence of IgG-LGNR extravascular accumulation suggests the former of these mechanisms as the predominant source of anti-αVβ3 LGNR uptake in tumor tissue.
-
Figure 8—source data 1
Data for tumor uptake of targeted and untargeted LGNRs.
- https://doi.org/10.7554/eLife.16352.047
Figure 8—figure supplement 1
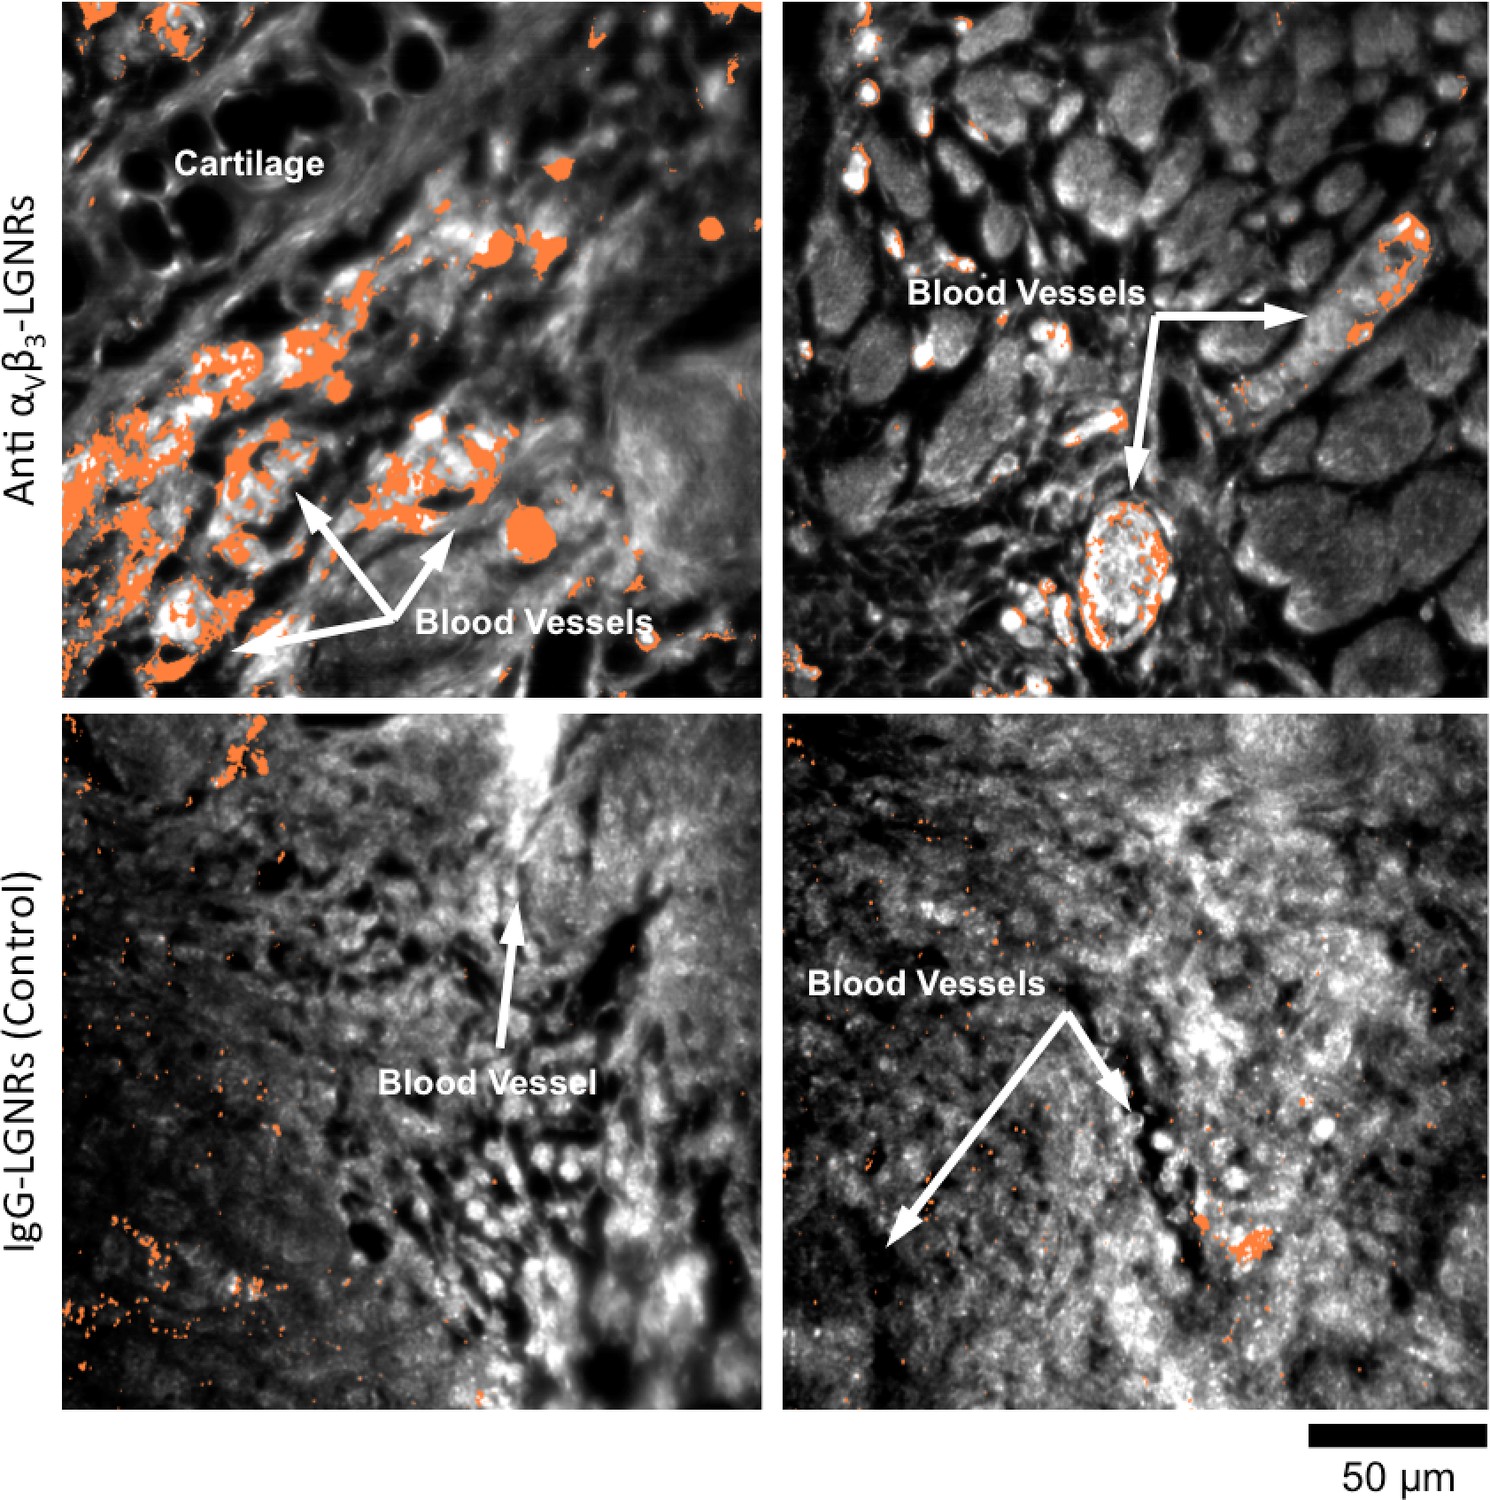
HSM-AD images of additional tumor tissue sections resected after targeted and untargeted LGNR injections.
LGNR uptake in U87MG tumors is consistently greater and more localized to blood vessel endothelial cells (αVβ3+) when particles are conjugated with anti-αVβ3 antibodies (top row) rather than nonspecific IgG antibodies (bottom row).
Additional files
-
Source code 1
Contains all MATLAB code used for HSM-AD.
- https://doi.org/10.7554/eLife.16352.049
Download links
A two-part list of links to download the article, or parts of the article, in various formats.
Downloads (link to download the article as PDF)
Open citations (links to open the citations from this article in various online reference manager services)
Cite this article (links to download the citations from this article in formats compatible with various reference manager tools)
A hyperspectral method to assay the microphysiological fates of nanomaterials in histological samples
eLife 5:e16352.
https://doi.org/10.7554/eLife.16352


