Spatiotemporal interplay between multisensory excitation and recruited inhibition in the lamprey optic tectum
- Karolinska Institute, Sweden
Figures
Figure 1 with 1 supplement
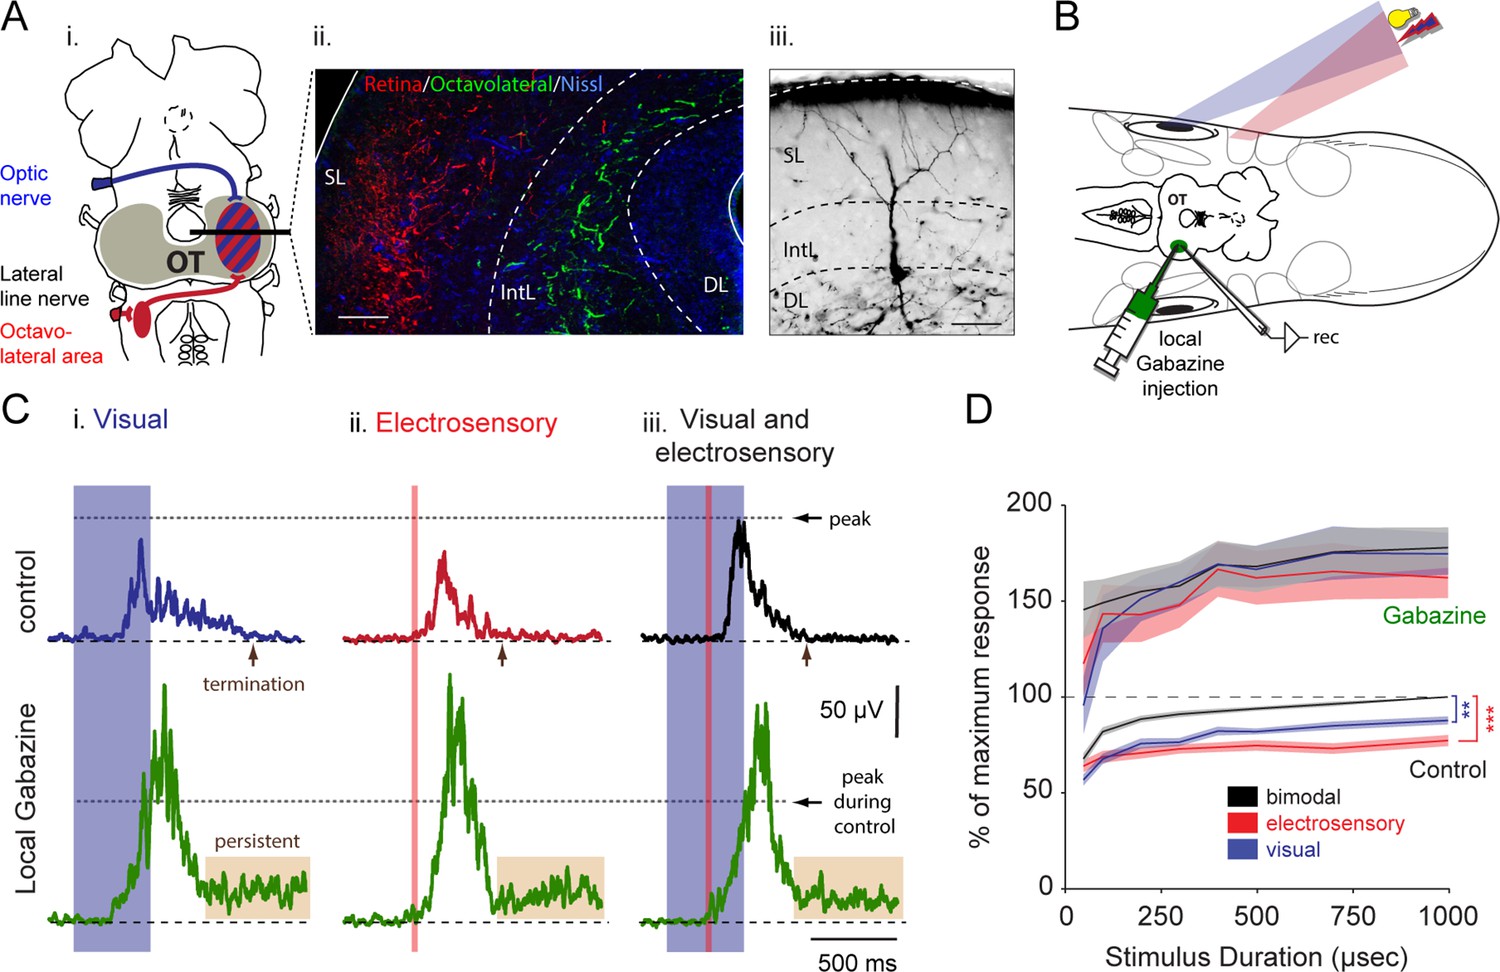
Integration of vision and electroreception in the deep layer of the lamprey optic tectum.
(A) Inset i: Schematic of the lamprey brain showing the visual (blue) and electrosensory (red) afferents targeting the optic tectum (OT). Inset ii: Photomicrograph of the optic tectum in a transversal view showing the retinal afferents reaching the most superficial layers (red), and the octavolateral fibers innervating the intermediate layers (green). Inset iii: Morphology of an output neuron in the deep layer retrogradely labeled following a tracer injection in the middle rhombencephalic reticulospinal nucleus (MRRN) and filled intracellularly with Neurobiotin while performing whole-cell recordings. Output cells extend their dendrites to the intermediate and superficial layers where the electrosensory and the visual inputs enter and terminate, respectively. Abbreviations: SL, superficial layer; IntL, intermediate layer; DL, deep layer. Scale bars: Inset ii, 100 µm; Inset iii, 50 µm. (B) Experimental settings for performing extracellular recordings during multisensory integration in the optic tectum. Dorsal view of the preparation, including the brain, the eyes and electrosensory areas (depicted by the skin patches; for more information see Bodznick and Preston [1983]), while driving output activity with light and electrical stimuli that are spatiotemporally aligned in the immediate surrounding. Abbreviations: rec: extracellular recording electrode. (C) Rectified local field potentials obtained from visual (inset i), electrosensory (inset ii) and bimodal sensory activation (inset iii). Upper traces show sensory stimulation before (black), and after local application of 10 μM gabazine (green). Horizontal dotted lines illustrate the level of peak activity during control. (D) Sensory response against stimulus duration (50–1000 μs) for visual, electroreceptive and bimodal activation, with and without local inhibition. The integral under the curve of rectified local field potentials, as those shown in C, is plotted on the y-axis and normalized to the maximum bimodal response measured during control (n = 13). Paired t-test gave statistical significance as indicated (**p<0.01, ***p<0.001).
Figure 1—figure supplement 1
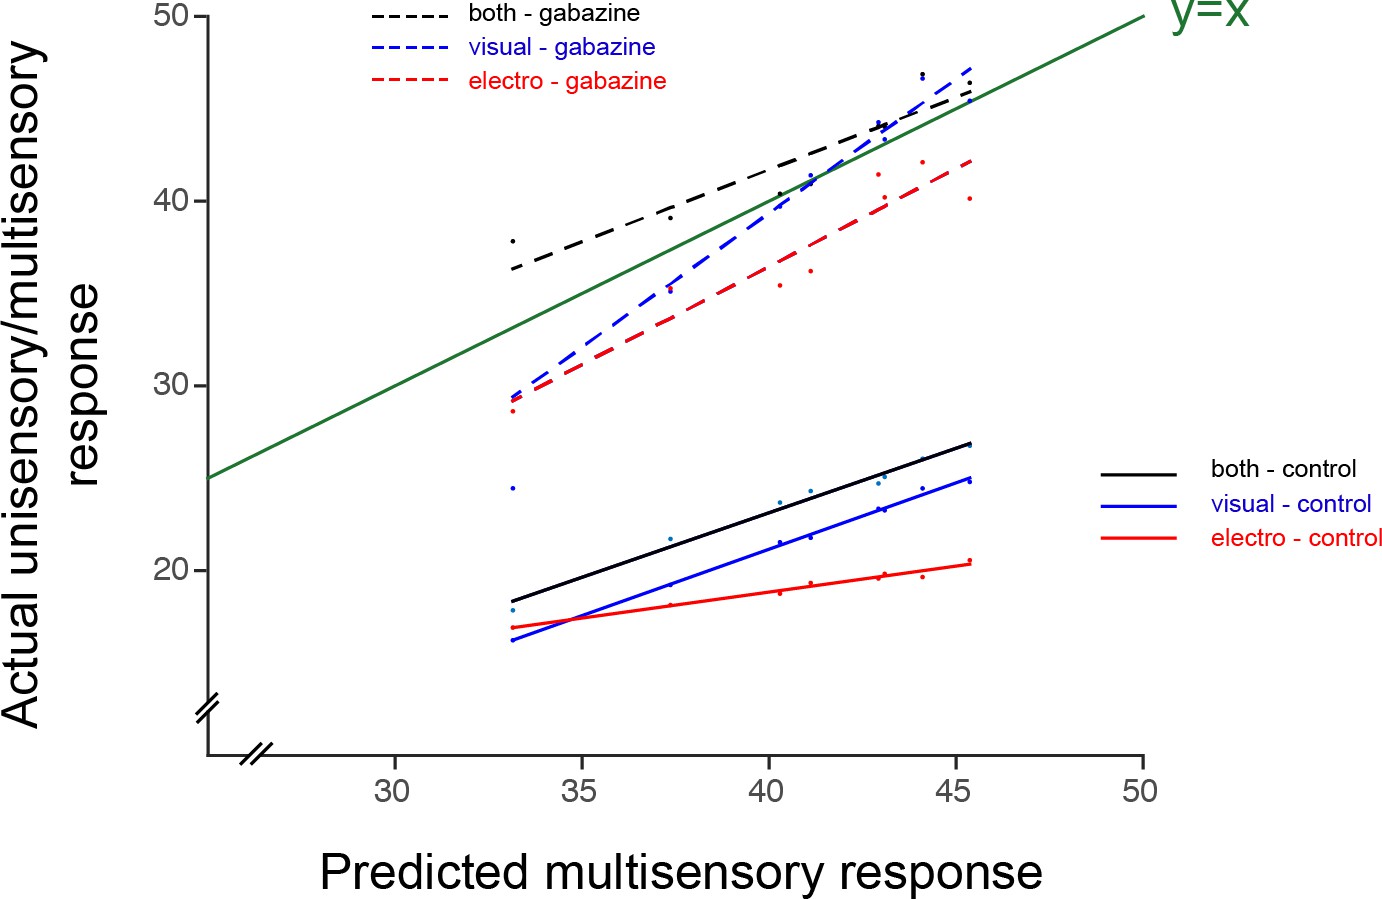
Actual responses against the predicted arithmetic sum of unisensory responses.
Responses for visual (blue), electrosensory (red) and multisensory (black), are compared to the predicted arithmetic sum of the unisensory responses in control conditions (green line). Responses after the application of Gabazine are shown as dotted lines. Data point represent the numerical values of the integral under the curve after full-wave rectification of the neural activity (see Materials and methods).
Figure 2
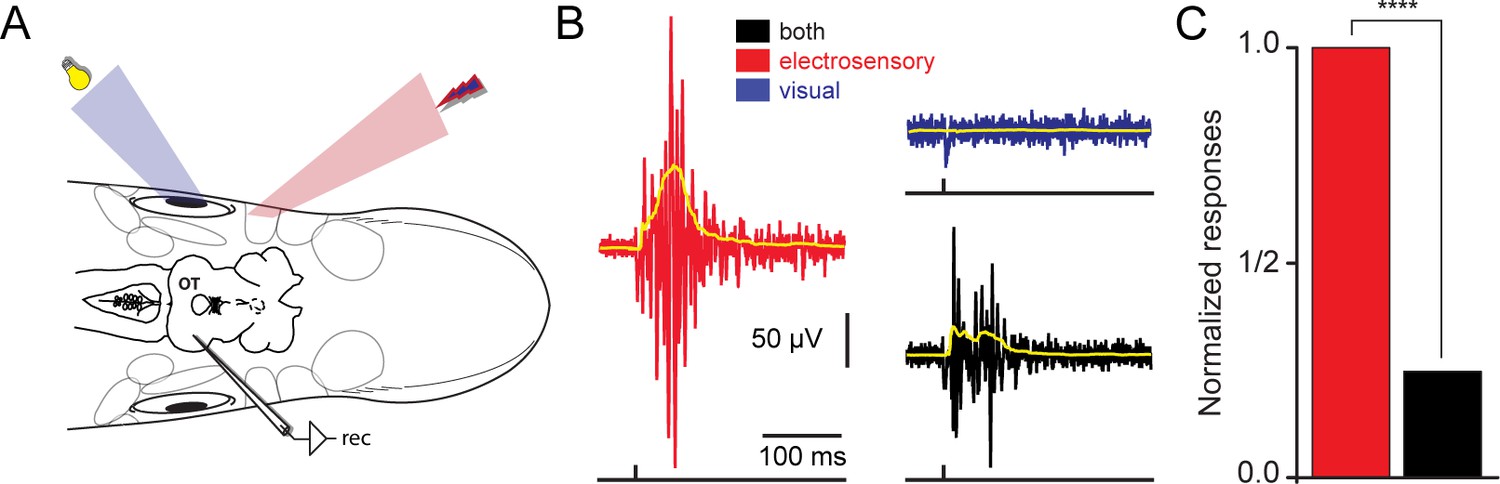
Spatially misaligned stimuli give rise to response reduction.
(A) Using the experimental strategy described in Figure 1B, we applied spatially disparate visual and electrosensory stimuli while recording responses in the contralateral optic tectum. (B) Local field potentials in response to electrosensory stimulation (red trace), were drastically reduced when a different region of the tectal map was visually stimulated (blue trace). The responses when combining both sensory modalities are shown in black. The yellow traces on top show the rectified signals. (C) Plot showing the normalized responses for electrosensory activation (red), before and after simultaneously stimulating a visual off region (black). For each animal (n = 5), stimulation was repeated throughout 10 sweeps. Responses were quantified as the area under the rectified signal and normalized to the maximum. Paired t-test gave a statistical significance of ****p<0.0001.
Figure 3 with 1 supplement
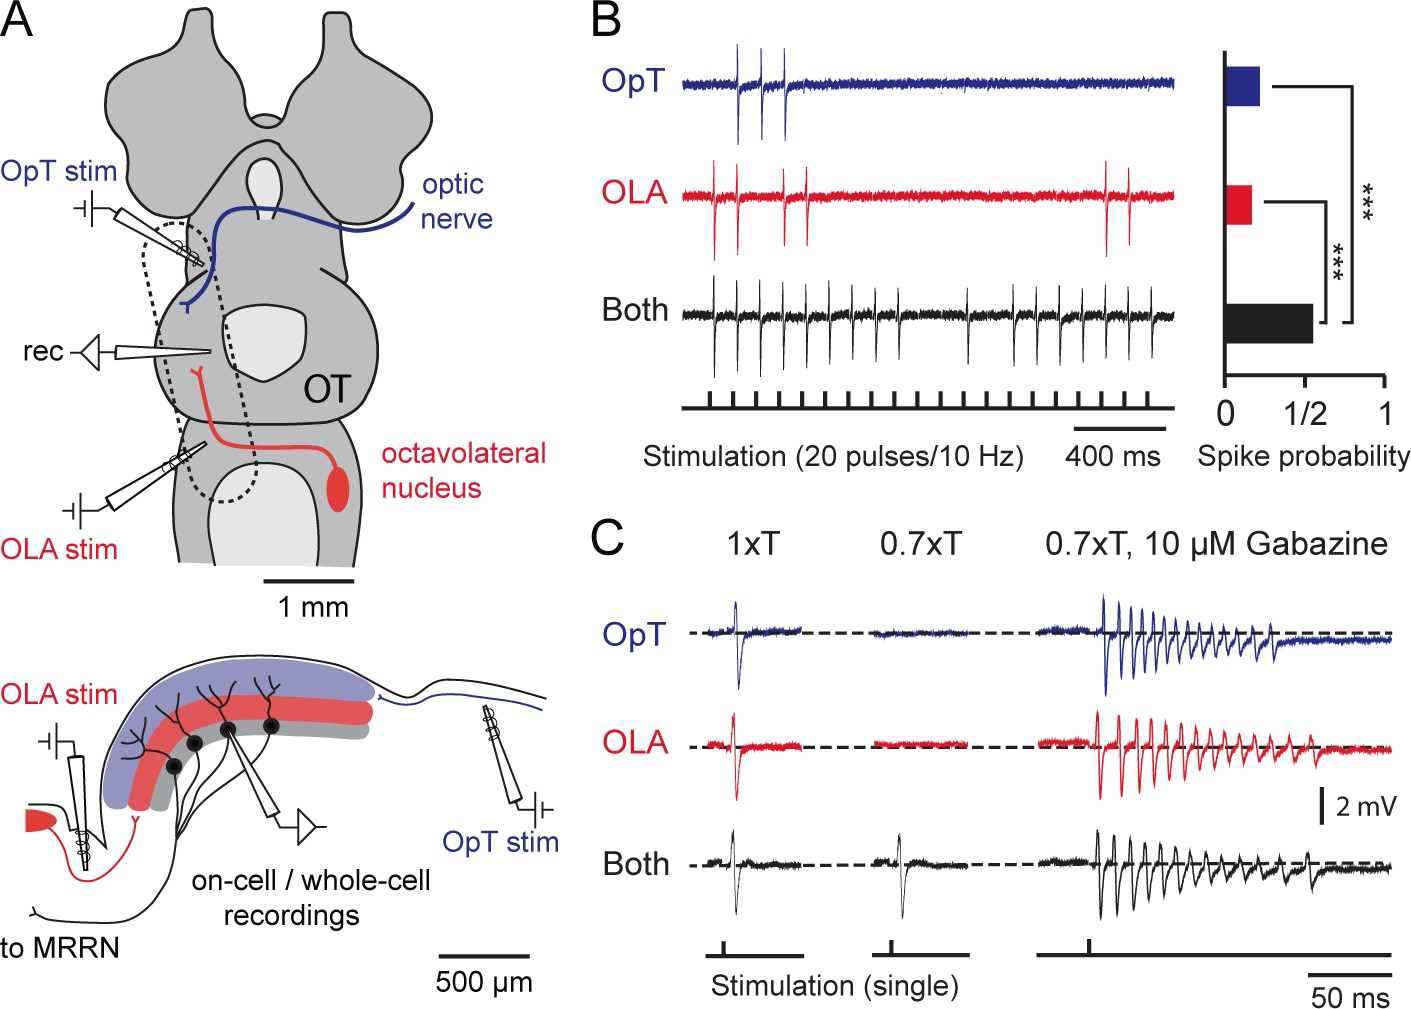
Output neurons receive visual and electrosensory inputs.
(A) (Top) Schematic of the lamprey brain in a dorsal view showing the sensory afferent input to the optic tectum. Dotted rectangle shows the brain region of interest (sectioned and shown in sagittal view; Bottom) illustrating the settings for performing cell-attached and whole-cell recordings in tectal output neurons while stimulating the visual (via the optic tract, OpT) and electrosensory (via the octavolateral area, OLA) inputs. Abbreviations: OpT, optic tract; OLA, octavolateral area; OT, optic tectum; stim: stimulation electrode; MRRN, middle rhombencephalic reticulospinal nucleus. (B) (Left) Tectal output cell recordings driven by visual (OpT), electrosensory (OLA) and bimodal (both) inputs in cell-attached configuration (stimulation train of 20 pulses at 10 Hz; low threshold 1–10 μA). Time-locked action potentials can be observed in response to an impulse from either sensory pathway with enhanced excitability occurring during bimodal activation. (Right) Quantification of spike responses to unimodal and bimodal activation. A probability of unity indicates that an output neuron responds to all given impulses throughout 10 sweeps (n = 6). Paired t-test gave a statistical significance of ***p<0.001. (C) (Left) Action potentials discharged in response to unimodal and bimodal input at stimulation intensity threshold (T). (Middle) Bimodal inputs drive suprathreshold responses in output neurons, with unimodal inputs failing to elicit spiking by adjusting T to a 70% of its initial value (n = 6). (Right) Unimodal and bimodal inputs yield equalizing effects with a rapid discharge of action potentials (at 0.7T) when blocking inhibition with bath application of 10 μM of Gabazine (n = 3).
Figure 3—figure supplement 1
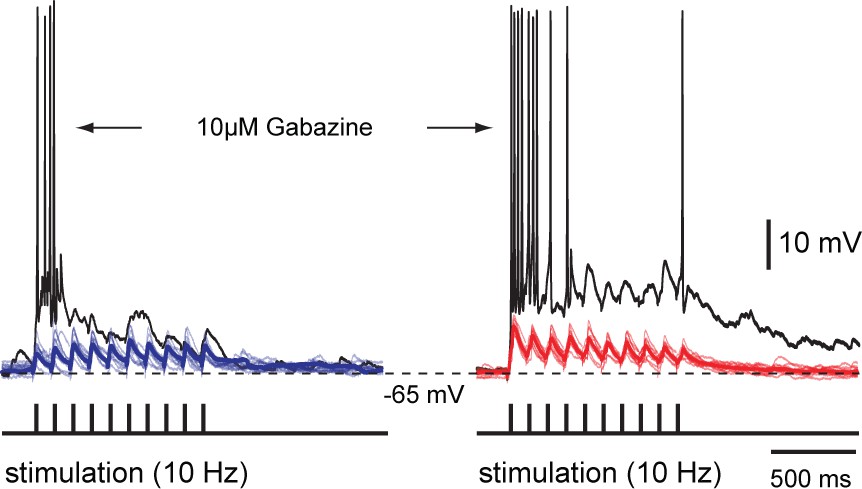
Unimodal and bimodal sensory activation with and without inhibition – whole-cell recordings.
Repetitive stimulation (10 pulses at 10 Hz) of OpT (left traces, blue) and OLA (right traces, red) yields subthreshold excitatory postsynaptic potentials in the same output neuron in the deepe layer. Pharmacological blockade of GABAergic inhibition with bath application of 10 μM gabazine results in a drastic response enhancement with neurons rapidly firing action potentials (usually between 2–7 spikes; n = 3). Thicker lines are average traces. These data also provide an intracellular account that was observed with our extracellular recordings (in the lower traces of Figure 1C) and cell-attached recordings (right panel of traces in Figure 2C).
Figure 4
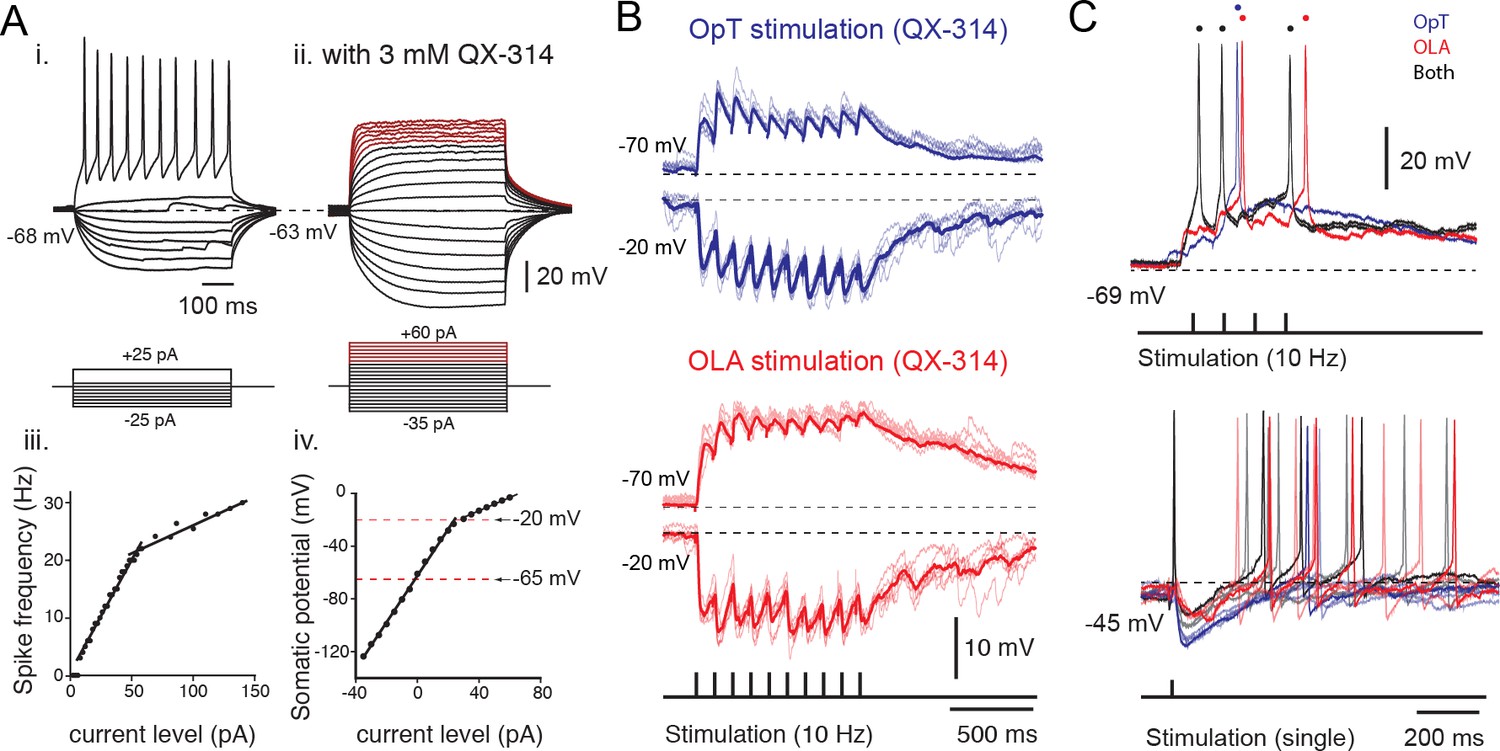
Sensory excitation and tectal inhibition are integrated by output neurons.
(A) Inset i. Voltage responses to depolarizing and hyperpolarizing 500 ms current steps of 2 pA per step, elicited from rest at −68 mV. Inset iii. Spike frequency is plotted against current level. Inset ii. Voltage responses to depolarizing and hyperpolarizing 500 ms current steps of 5 pA per step, elicited from rest at −63 mV in the presence of QX-314 intracellularly (3 mM). Voltage traces marked in red belong to the shallow slope in the I-V plot indicative of a drop in DC impedance. Inset iv: Plot of somatic potential against current level. (B) Whole-cell recordings of excitatory and inhibitory postsynaptic potentials evoked in output cells that were held at −70 mV and −20 mV, respectively, in response to repetitive stimulation of OpT (top traces; blue) and OLA (bottom traces; red) afferents at 10 Hz, in the presence of fast-sodium channel blocker QX-314 in the recording pipette. Average traces are shown as thicker lines. (C) (Top) Output neuron responses to sensory stimulation (train of 4 pulses at 10 Hz) of OpT (blue traces), OLA (red traces) and bimodal (black traces) from rest at −69 mV. (Bottom) Output responses recorded when holding near threshold (at −45 mV with positive current injection) reveals evoked inhibitory postsynaptic potentials to single impulses that also persist during bimodal integration.
Figure 5
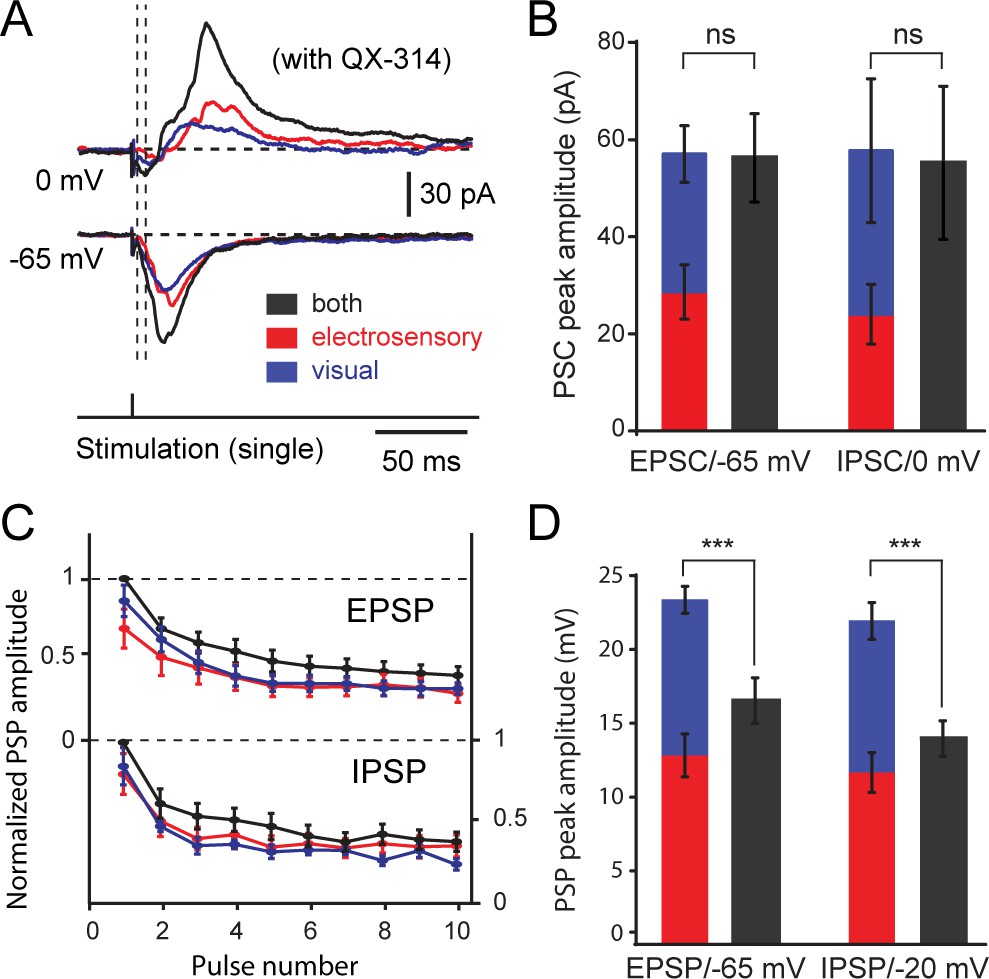
Excitatory and inhibitory postsynaptic currents and potentials evoked from visual and electrosensory inputs onto tectal output cells.
(A) Inhibitory and excitatory postsynaptic currents (EPSCs) elicited by visual, electrosensory and bimodal stimulation in an output cell recorded in voltage-clamp at 0 mV to show inhibitory currents, and at −65 mV (equilibrium for chloride-mediated GABAergic inhibition) to show excitatory currents. Drop lines show the onsets of excitatory and inhibitory currents. (B) Quantification of peak amplitudes of postsynaptic currents elicited by OpT (blue) and OLA (red) stimulation summate linearly when compared to the bimodal stimulation (grey) in output cells (n = 12). Abbreviation: PSC, postsynaptic currents. (C) Quantification of postsynaptic potential (PSP) amplitudes in output cells evoked by sustained stimulation (10 pulses at 10 Hz) of the OpT (blue), OLA (red) and bimodal input (black) and recorded in current clamp mode. Values are normalized to the first PSP. Both excitatory postsynaptic potentials (EPSPs, upper curves) and inhibitory postsynaptic potentials (IPSPs, lower curves) decay during the first two to three impulses and reach steady-state thereafter. (D) Comparison of the first evoked EPSP and IPSP amplitudes (obtained from traces as shown above). In current clamp, however, EPSP and IPSP amplitudes do not summate in unimodal and bimodal conditions. QX-314 was applied in the pipette during these recordings. Data represented as Means ± SEM. One-way ANOVA was used to determine the p-value.
Figure 6

Dynamics between excitation and inhibition during unimodal and bimodal integration.
(A) (Top) Phase plot showing the estimated change in synaptic conductance of an output neuron (shown in B) plotted against the reversal potential during OpT (blue), OLA (red) and bimodal (black) afferent stimulation. Conductances were estimated at each time point for the interval ranging from 10 ms before the impulse until 100 ms after stimulation onset. (Bottom) Line graph highlighting the paired differences between reversal potential across cells. Lines link measurements across conditions performed on the same neuron. On average, there is no statistical difference between unimodal and bimodal integration (n = 10). (B) A representative example of the synaptic responses evoked by single impulses of the OpT, OLA and both from an output neuron resting at −65 mV. (C) Time course of the estimated underlying synaptic conductances for excitation and inhibition is shown (average data from n = 10). Drop lines show the onsets of excitation and inhibition (which shows a delay with respect to excitation of ~5–10 ms).
Figure 7
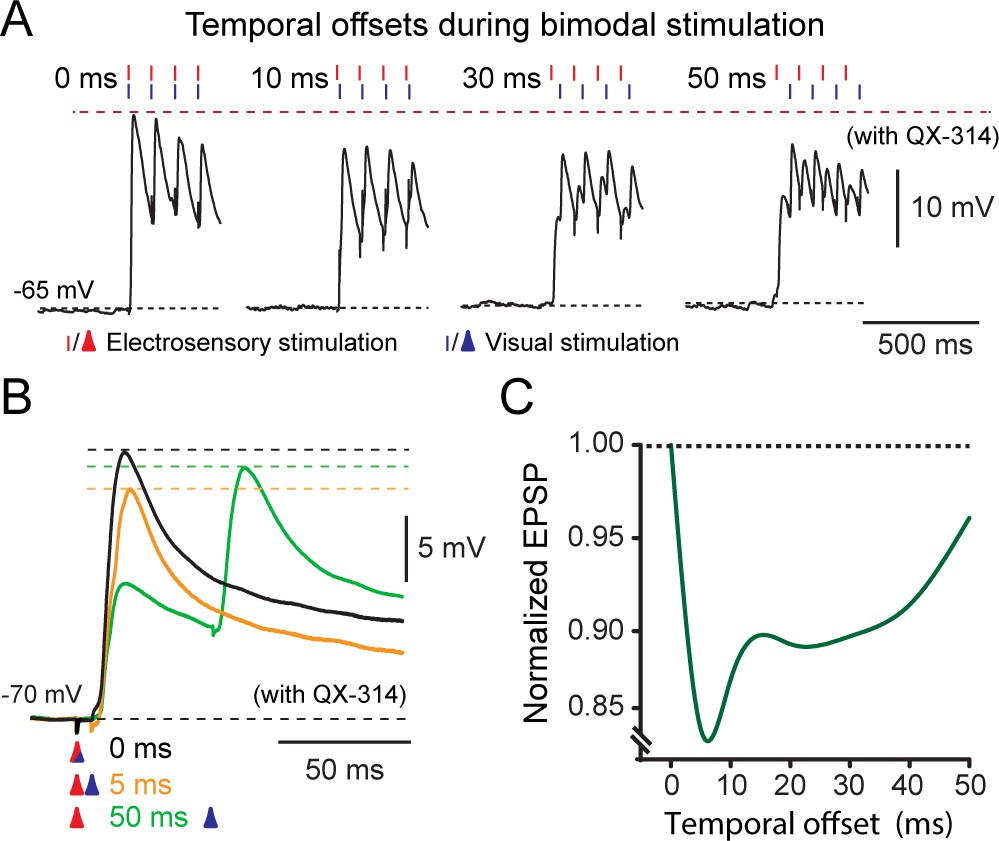
Temporal effects on bimodal integration.
(A) The response profile of a representative output neuron during repetitive bimodal stimulation (4 pulses at 10 Hz) of OpT and OLA. Traces from left to right show the excitatory postsynaptic potentials with offsets ranging from 0 (temporal alignment), 10, 30 and 50 ms. (B) Recordings of EPSPs evoked after variable activation of OpT and OLA with temporal offsets of: 0 ms (aligned; black trace), 5 ms (orange trace) and 50 ms (green trace). (C) Curve fit illustrating the variation of the combined excitatory postsynaptic potential amplitude against the temporal offset between the two sensory modalities. The graph was normalized to the maximal EPSP amplitude, which always occurred when inputs were temporally aligned (i.e., 0 ms). Average shown from n = 7.
Figure 8 with 1 supplement
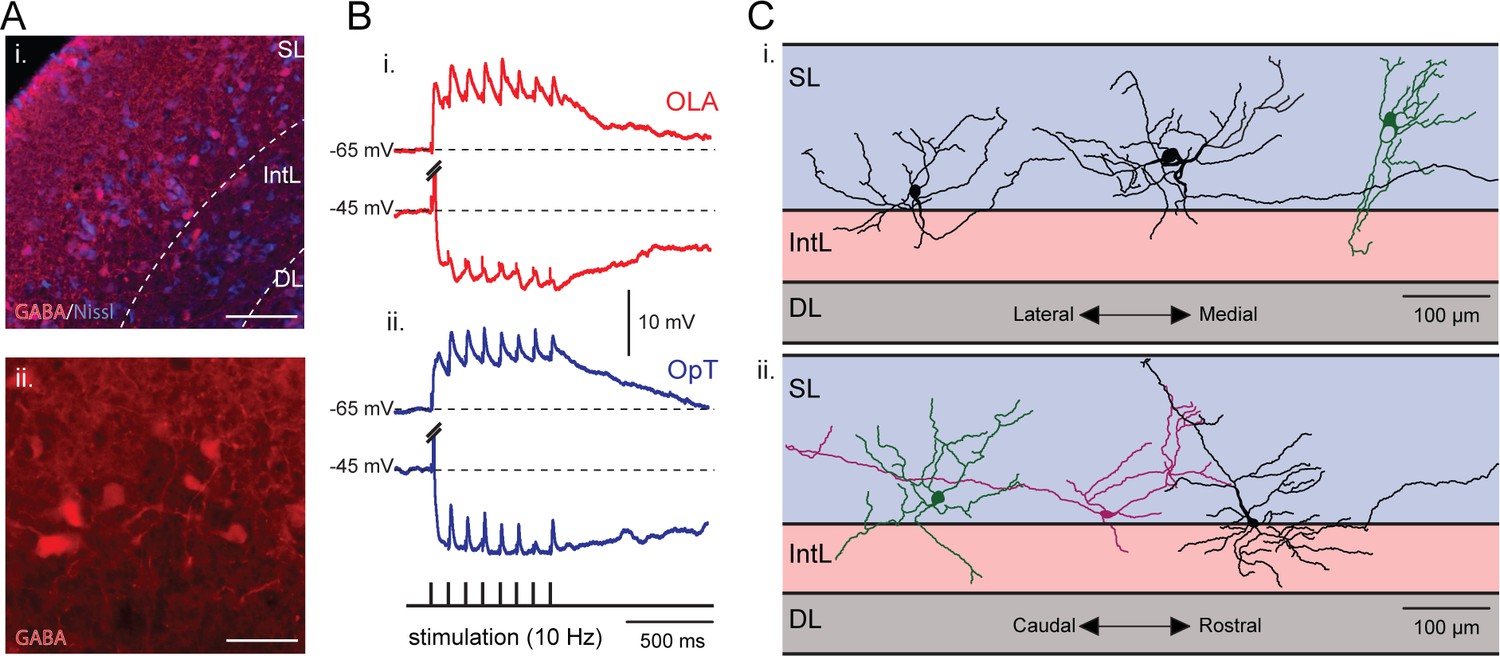
Visual and electrosensory inputs activate the same set of interneurons.
(A) Inset i: A neural population located at the interface between the superficial and intermediate layers express GABA. These cells can be seen in more detail in inset ii. Scale bars: Inset i, 150 µm; Inset ii, 50 µm. (B) An example of a tectal interneuron that receives excitatory inputs from both sensory modalities (visual and electrosensory) along with triggered tectal inhibitory inputs. Here, EPSPs (hold at −65 mV) and IPSPs (hold at −45 mV) are shown in response to repetitive stimulation of the OLA (red, bottom traces) and OpT (blue, top traces). The action potentials evoked by the initial impulse when holding at −45 mV are truncated. The morphology of this cell is shown in Figure 8—figure supplement 1. (C) Six reconstructed morphologies of interneurons that were stained with neurobiotin, in the transversal (inset i) and sagittal (inset ii) dimensions. Scale bars: 100 µm.
Figure 8—figure supplement 1

A representative example of the morphology of a tectal interneuron that was filled with neurobiotin while performing the whole-cell recordings shown in Figure 8B.
Scale bar: 100 µm.
Figure 9
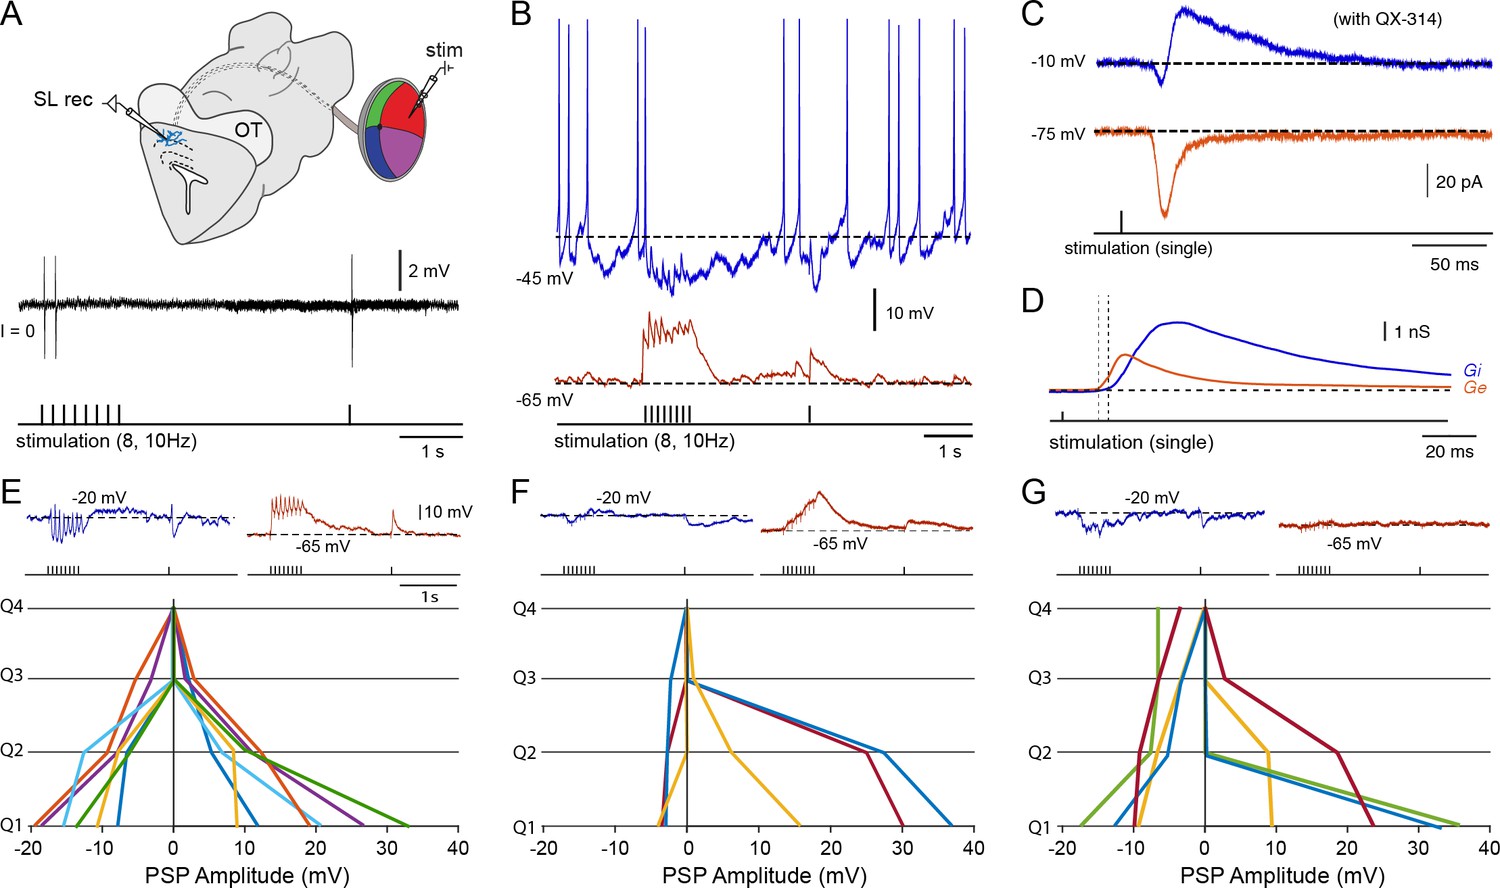
Tectal interneurons receive diverse forms of local inhibition.
(A) (Top) Schematic of the in vitro eye-brain preparation used to locally stimulate regions of the retina (divided in four quadrants) while performing whole-cell recordings in the superficial layer interneurons located in the stratum opticum. (Bottom) Cell-attached recording of a tectal interneuron in response to electrical microstimulation of the on-receptive field in the retina (stimulation train of 8 pulses at 10 Hz with a recovery pulse; threshold ~50 μA, n = 7). As with tectal output neurons (see Figure 3B), one time-locked action potential can be observed in response to an impulse delivered to the preferred retinal quadrant, with depression quickly following the first or second impulse. (B) Whole-cell current clamp recording of an interneuron held at the reversal for chloride, −65 mV, and near threshold ~45 mV using positive somatic current injection. (C) Whole-cell voltage recordings of an interneuron clamped at −65 and 0 mV using QX-314 in the pipette solution to block action potential generation (average of 10 sweeps). (D) Decomposition of the underlying excitatory (Ge; red) and inhibitory synaptic conductances (Gi; blue) arising from electrical microstimulation of the preferred quadrant. Drop lines indicate the onsets of excitation and inhibition. (E–G) Quantification of the maximal excitatory (depolarization from −65 mV) and maximal inhibitory amplitudes (hyperpolarization from −20 mV) in current clamp arising from selective activation of each of the four retinal quadrants (dorsal, ventral, anterior and posterior) using a train of 8 pulses at 10 Hz (n = 10). However, to avoid dependencies on the particular stimulated retinal area, we sorted the quadrants that give rise to the strongest excitatory component in descending order (Q1 being the largest EPSP). Lines with matching colors on each side of the y-axis represent the postsynaptic potential amplitudes obtained from individual recorded interneurons (positive values represent the total EPSP size and negative values represent the total IPSP size). We determined three subtypes of interneurons on the basis of their inhibitory response patterns. In E, neurons displayed inhibitory responses only when excitation was present, which usually was broad and spread into neighboring quadrants (top: typical traces obtained from Q1). In F, interneurons received weak synaptic inhibition (top: typical build-up excitation obtained Q1 & Q2). In G, interneurons received local excitation and widespread inhibition arising from quadrants that did not display excitation (top: typical off-receptive inhibition arising from Q3 & Q4).
Figure 10
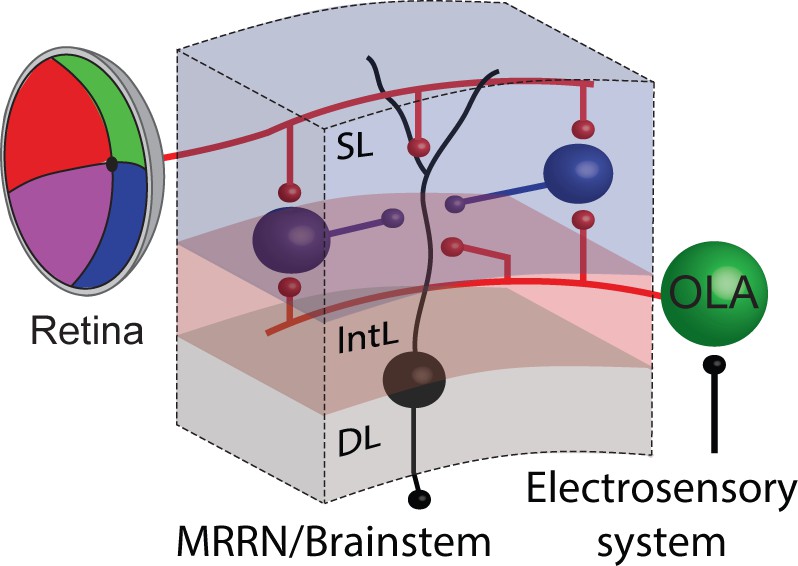
Summarizing circuit.
Tectal output cells (black) in the deep layer receive a combination of visual and electrosensory synaptic input arising from the retina and the octavolateral area, respectively. Tectal interneurons in the superficial layer (putatively inhibitory and therefore shown in blue) also receive similar sensory inputs from both the visual and electrosensory system, and once activated in turn inhibit their output neurons. Abbreviations: SL, superficial layer; IntL, intermediate layer; DL, deep layer; OLA, octavolateral area; MRRN, middle rhombencephalic reticular nucleus.
Videos
Video 1
Sensory inputs and motor output in the lamprey optic tectum in the intact brain using COLM.
The visual input through the optic tract (OpT) to the optic tectum (OT), and the electrosensory afferents from the octavolateral area (OLA) are shown after a neurobiotin injection in the OT, in a cleared brain using the method CLARITY. The motor output can be also followed from the deep layer to the reticulospinal cells in the brainstem. The brain is shown from a dorsal view and in the bottom-left corner a schematic in a sagittal view can be seen. A moving bar indicates the approximate region shown at each moment. Areas of interest are annotated through the duration of the movie.
Additional files
-
Source code 1
Scripts.
- https://doi.org/10.7554/eLife.16472.017
Download links
A two-part list of links to download the article, or parts of the article, in various formats.
Downloads (link to download the article as PDF)
Open citations (links to open the citations from this article in various online reference manager services)
Cite this article (links to download the citations from this article in formats compatible with various reference manager tools)
Spatiotemporal interplay between multisensory excitation and recruited inhibition in the lamprey optic tectum
eLife 5:e16472.
https://doi.org/10.7554/eLife.16472


