An event map of memory space in the hippocampus
- Radboud University Nijmegen, The Netherlands
- Institute of Cognitive Neuroscience, Ruhr-University Bochum, Germany
- NTNU - Norwegian University of Science and Technology, St. Olavs University Hospital, Norway
Figures
Figure 1 with 3 supplements
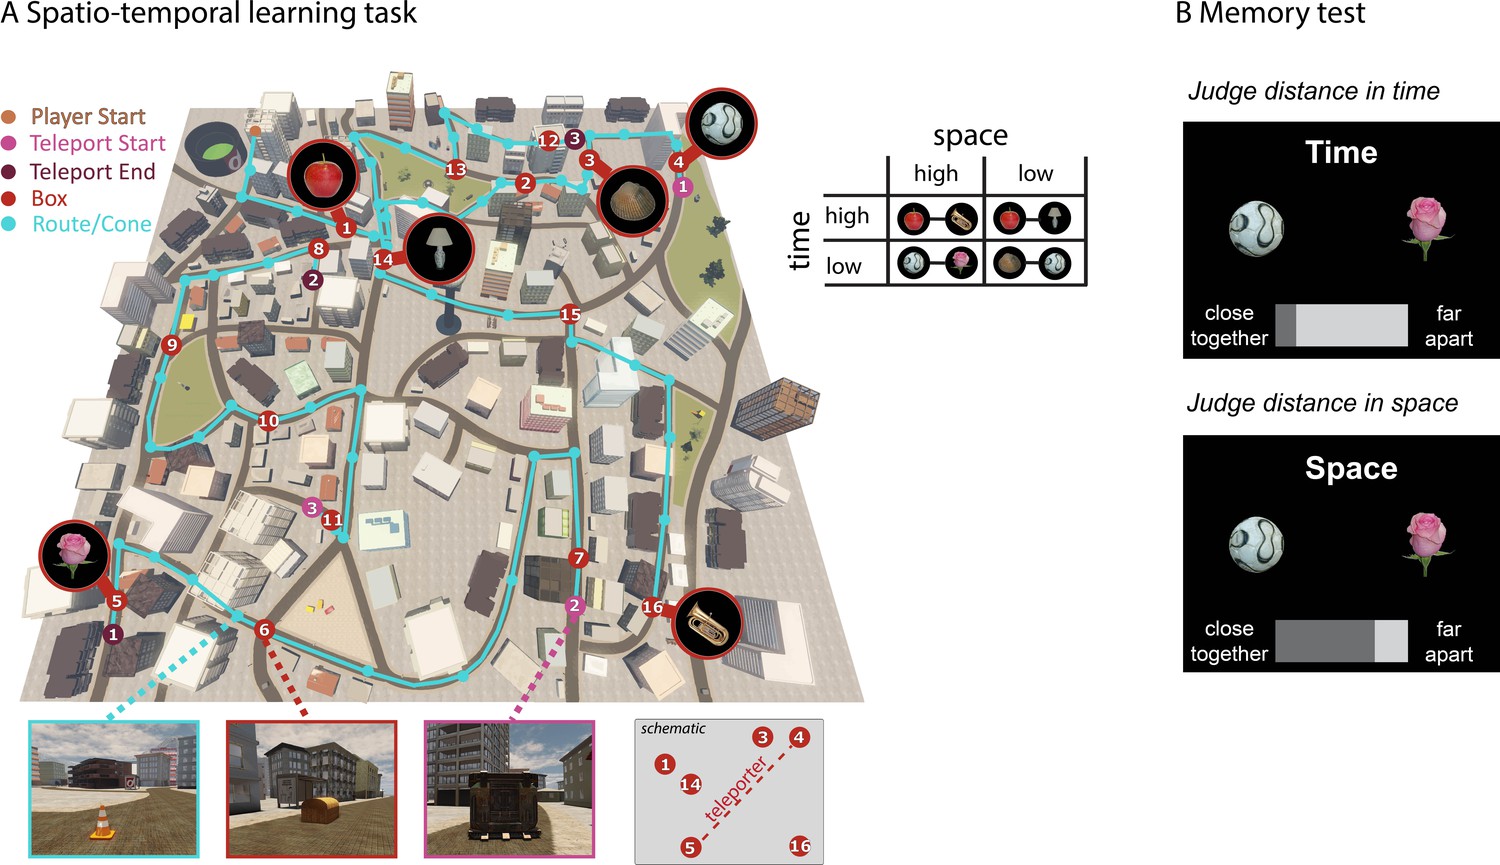
Learning spatio-temporal trajectories in virtual reality.
(A) Overview of the route participants had to take through the virtual reality city Donderstown. 16 objects were presented along the route (see Figure 1—figure supplement 1 for details on the objects). Participants were first guided by the presentation of traffic cones (marked here with turquoise circles) that led them from one wooden box (red numbered circles) to the next. The cones disappeared after 6 repetitions of the route (see Figure 1—figure supplement 2 for behavioral performance in the navigation task). Crucially, the spatial and temporal distance between objects was systematically manipulated (see Materials and methods for details). As exemplified in the table, pairs of objects have either high or low spatial distance to one another as well as high or low temporal distance. At three points along the route, participants had to use a teleporter (pink and purple numbered circles), which transported them immediately from one part of the city to a completely different part of the city. Introducing the teleporters allowed us to have pairs of objects with a high spatial distance and low temporal distance, as can also be seen in Figure 1—figure supplement 3. (B) In a subsequent memory test outside the scanner, participants were asked to judge for every possible pair of objects how close together or far apart the objects had been in space (Euclidean distance) or time (how long it took them to get from one object to the next).
Figure 1—figure supplement 1

Overview of the 16 objects used in the picture viewing tasks and the learning task.
The 17th object (the key, see bottom row) was only shown in the picture viewing task and served as the target stimulus: participants had to press a button whenever they saw this picture.
Figure 1—figure supplement 2
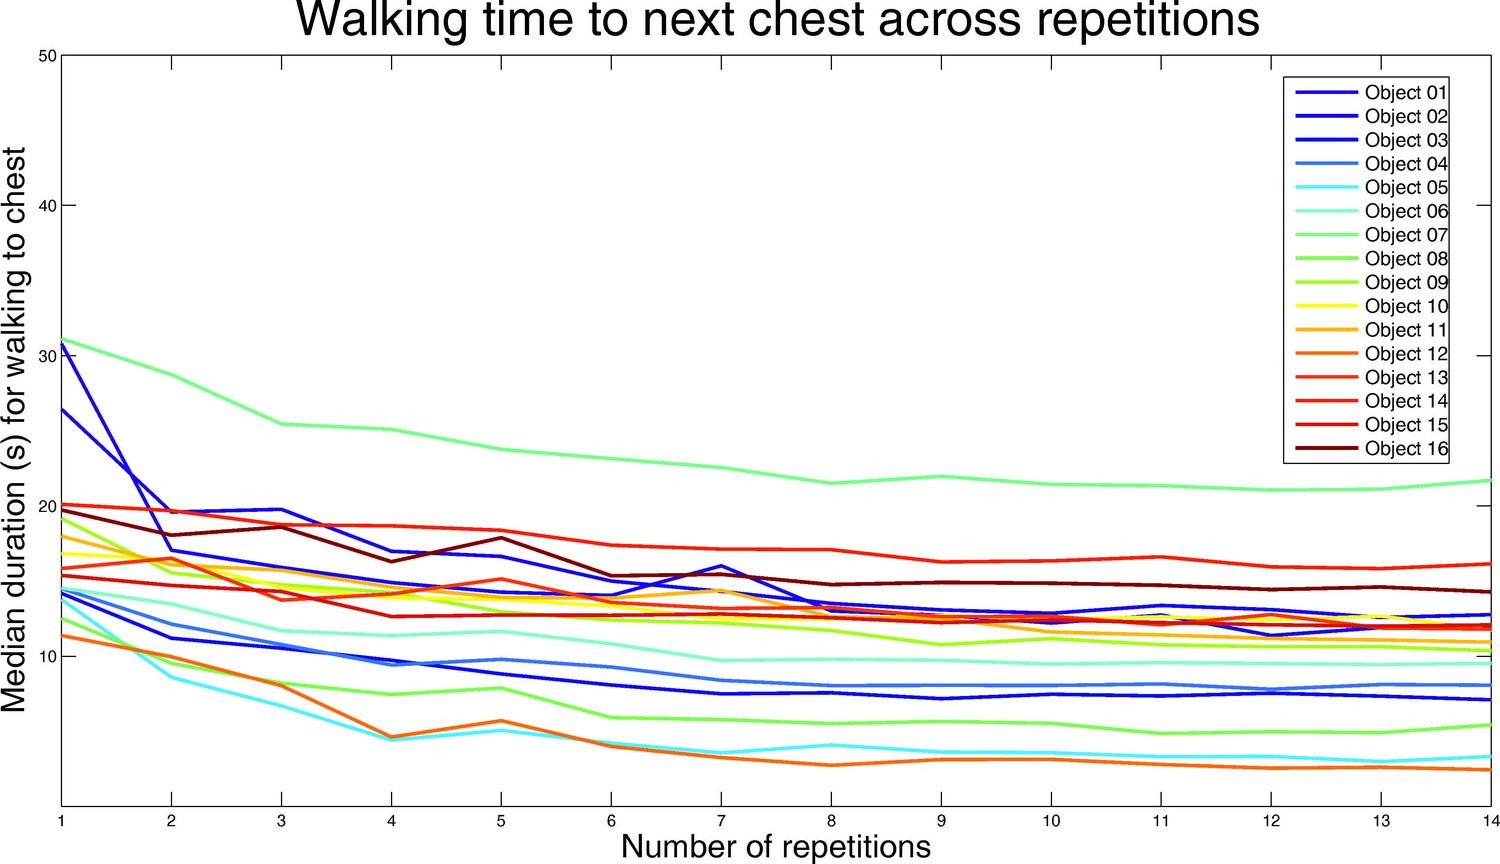
Performance during the VR learning task.
In the route learning task, participants had to walk from one box to the next and learned object identities associated with the boxes. They walked along a specific route (14 route repetitions) and became more efficient with increasing number of repetitions, as apparent from the figure. Median navigation time in seconds (y-axis) across participants is plotted separately for each box location (colored lines) as a function of time (x-axis). In the initial 6 route repetitions, traffic cones were used to guide participants. Successful route learning is reflected in fast navigation performance when the traffic cones were removed in the 7th round (see Materials and methods for details). Participants were not significantly slower in the 7th round than the 6th round (6th: 13.73 vs 7th: 14.28 min, T25 = −1.04, p=0.3101), suggesting that the participants were already comfortable navigating the route without guidance by that stage. Nevertheless, the participants continued to improve and in the last round they were faster than in the 6th, indicating better performance despite the lack of the guiding cones (6th: 13.73 vs 14th: 11.60 min, T25 = 2.82, p=0.0093). Note that the route length between different boxes varies, which is why walking time is consistently higher or lower for some boxes.
Figure 1—figure supplement 3

Pairwise spatial and temporal distances are independent from each other.
Scatter plot of the actual distance between object pairs with regard to space and time in the learning task. Distances were z-scored. There was no significant correlation between spatial and temporal distances across all possible pairs of objects (R = −0.0642, P = 0.4859), suggesting that the two factors space and time did not consistently co-vary with one another.
Figure 2 with 2 supplements

Results from the distance judgment task.
(A) Accuracy in the distance judgment task was assessed by correlating the actual distance between pairs of items with the distance ratings given by participants during the memory task (illustrated for one participant as an example in the left panel; scatter plots for all participants can be found in Figure 2—figure supplement 1). The higher the correlation coefficient, the better the memory performance. Correlation coefficients for all participants are shown in a boxplot on the right side, both for the spatial and the temporal domain. Correlation coefficients are significantly different from zero across participants. Memory judgment for time was slightly better than for space. Individual participants’ values are shown between the two boxplots, with lines connecting the corresponding values of the same participant. See Figure 2—figure supplement 2 for exemplary results from a map test on spatial memory. (B) Result of two GLMs, modeling the impact of actual space and actual time on spatial distance ratings and temporal distance ratings, respectively. The boxplots show the beta estimates for the two factors across participants. Spatial judgments are related to actual distance in both space and time, and the same is true for temporal judgments. However, spatial distance has a higher impact than temporal distance on spatial judgments and temporal distance has a higher impact than spatial distance on temporal judgments. (C) Left: Investigating whether one domain biased the errors committed in the other domain, we correlated the errors in distance ratings with the actual or remembered distance in the other domain. Both time and space were correlated with errors committed in the other domain, but neither more strongly than the other. (C) Right: The same analysis as on the left side, but with trials split up depending on whether memory for space or time was tested first. The order in which memory was tested had no impact on the bias one domain had on errors committed in the other domain.
Figure 2—figure supplement 1
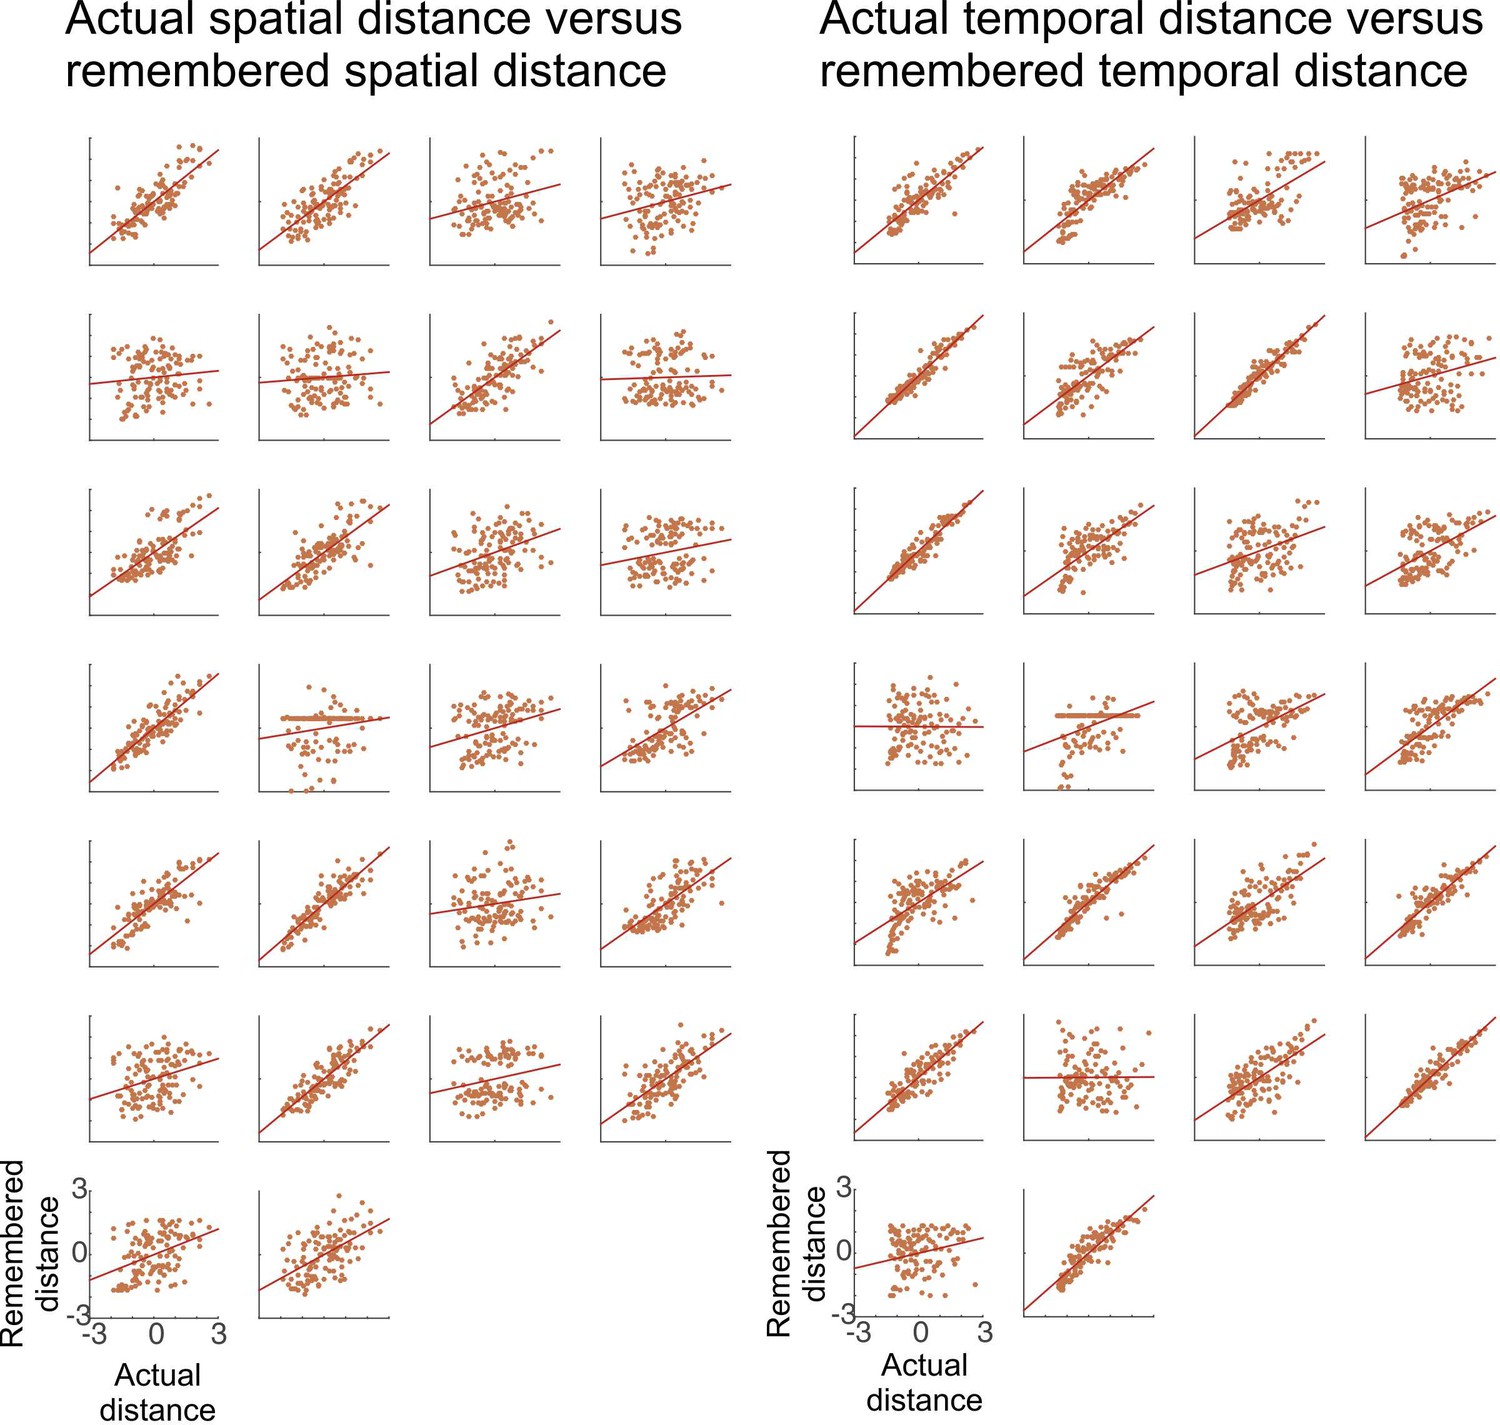
Participants acquire knowledge about the temporal and spatial structure of events.
Participants’ remembered spatial (left) and temporal (right) distance between objects is plotted relative to the actual spatial and temporal distance of objects in the learning task, respectively. In the distance judgment task, participants were asked to rate for every pair of objects how far apart they had been in either space or time (see Figure 1B). Left: Participant-specific remembered spatial distances between objects are plotted against the actual spatial distances in the task (both measures z-normalized). Another test for spatial memory was a map test, performed after the distance judgment task (see Materials and methods and Figure 2—figure supplement 2 for more details). Right: Participant-specific memorized temporal distances between objects are plotted against the actual temporal distances in the task (both measures z-normalized). Overall, the vast majority of participants successfully acquired knowledge about the spatio-temporal structure of the task (significant correlations for temporal and spatial distances in 24 and 21 of all participants (n = 26), respectively).
Figure 2—figure supplement 2
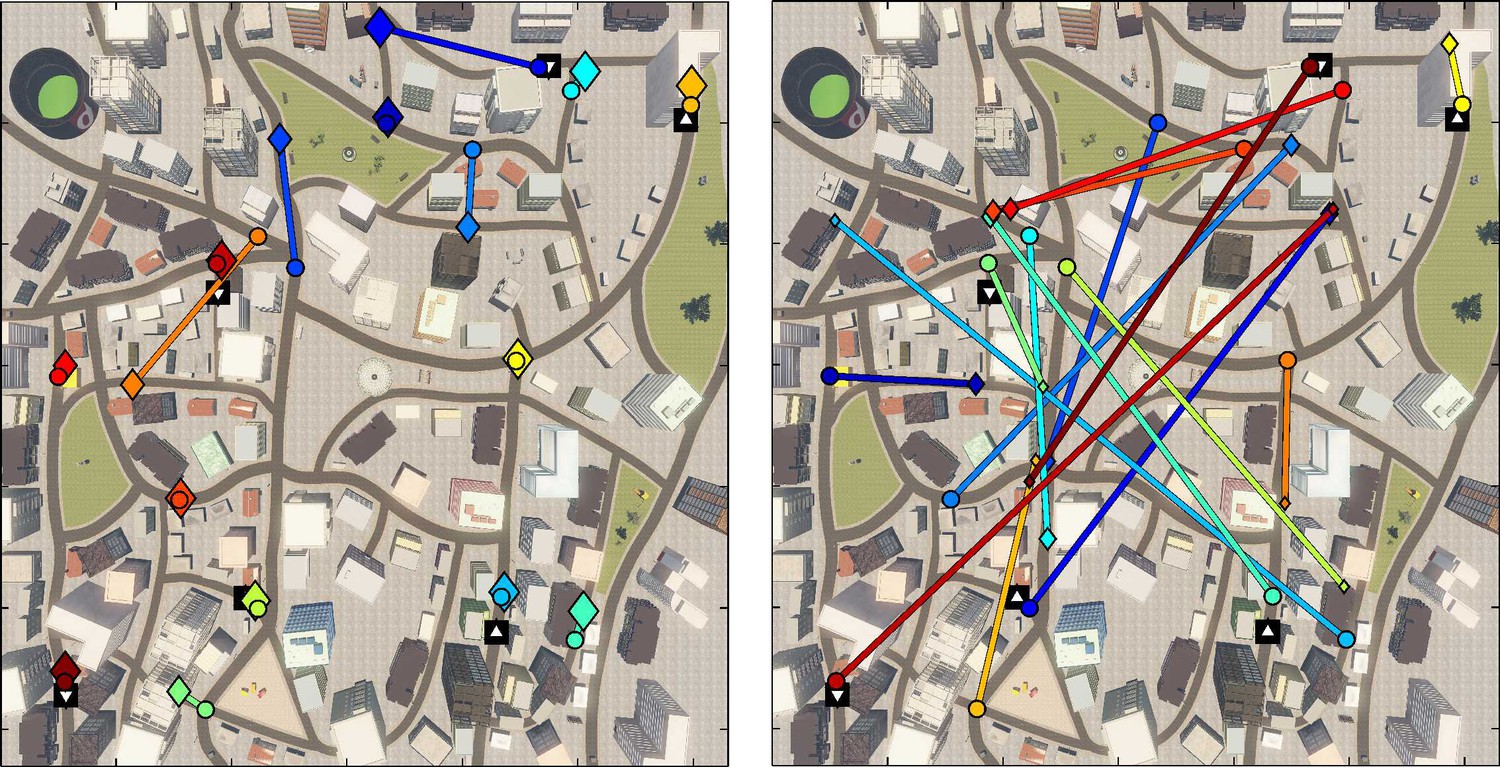
Results from the subsequent map test.
This test was used to probe participants’ memory of the location of the items. During the map test, participants were shown the picture of an item which they had encountered in the city and were asked to indicate on a schematic showing the city’s street layout and a few landmarks as symbols where they thought the box containing the item had been located. The two plots display correct locations for the boxes (circles) and the response location from two selected participants (diamonds) in matching colors and connected with a line. Size of the diamond indicates the confidence rating given by participants (larger diamonds indicating higher confidence). The black squares indicate the teleporter start (upward facing triangle) and end (downward facing triangle) positions. Left: Example of a participant with good performance (low distance between correct and indicated locations). Right: Example of participant with low performance (high distance between correct and indicated locations).
Figure 3
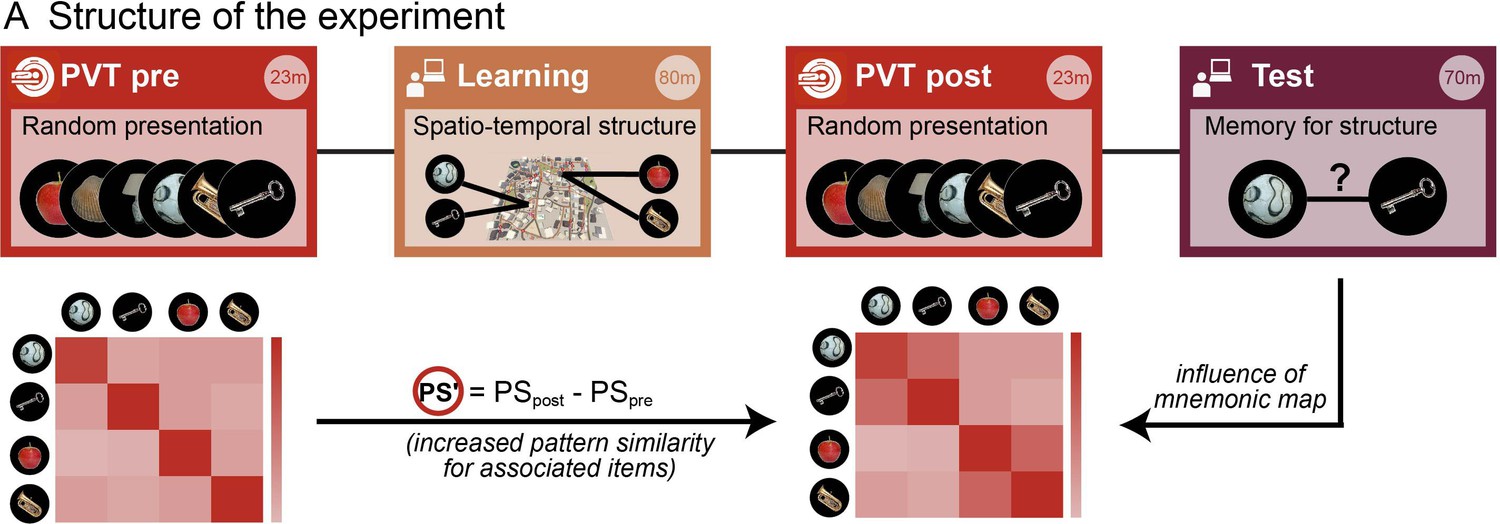
Assessing memory-related changes in neural similarity as a result of learning the spatio-temporal event structure.
FMRI data were acquired during two blocks of an identical picture viewing task (‘PVT’, in red) before and after the virtual navigation learning task (gold). This allowed us to measure the fine-grained neural similarity structure between event representations. Event memories were subsequently assessed in separate memory tests for space and time (purple). The crucial index for assessing the spatial and temporal event structure as a result of the learning task was the change in neural similarity from before the learning task to after (expressed as PS’) and how it covaried with the remembered spatial and temporal distances in the subsequent memory task.
Figure 4 with 1 supplement
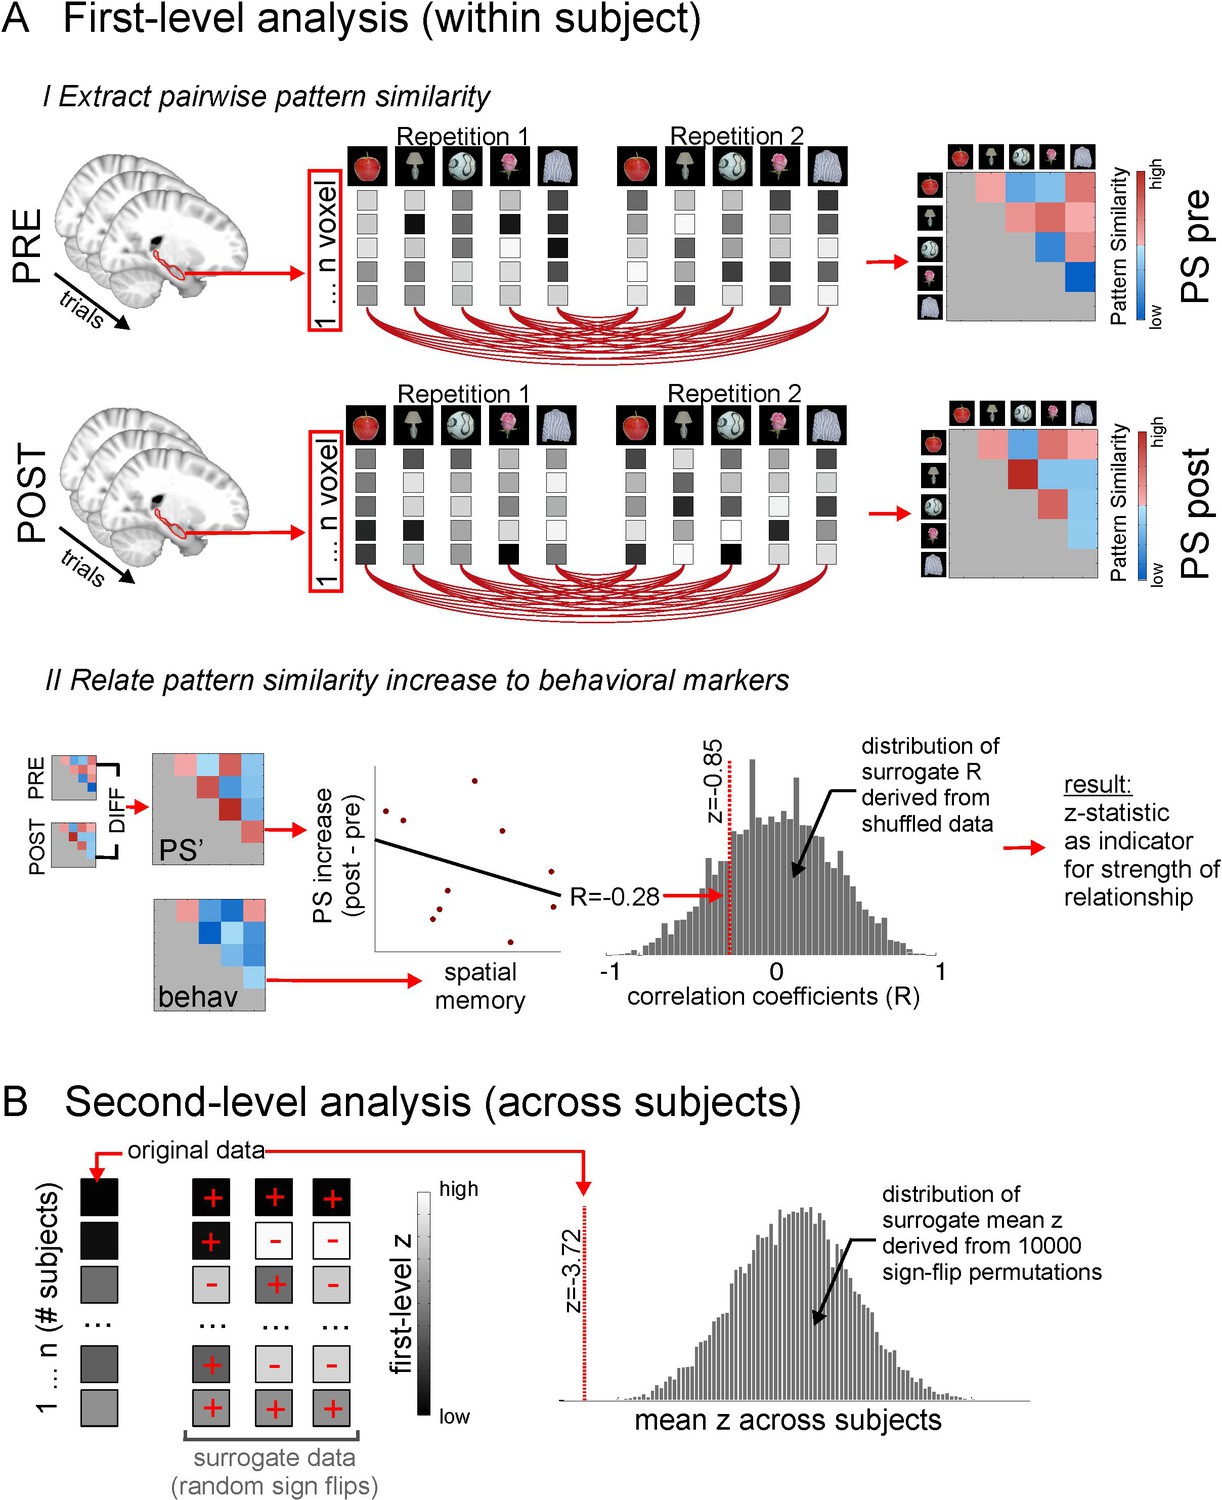
Methodological procedure for ROI pattern similarity analysis.
(A) Illustration of first level analysis. Both for the picture viewing task pre and picture viewing task post, activity of all voxels within a ROI (e.g. bilateral hippocampus) is extracted across all trials, in which 16 different items are presented 12 times (for illustrative purposes, procedures here are depicted for 5 items only). Voxel patterns for every item in every repetition are correlated with voxel patterns for every other item in every other repetition, yielding one average cross-correlation matrix for all items, respectively for the PVT pre and the PVT post task. In the next step, the difference between the PVT post cross-correlation matrix and the PVT pre cross-correlation matrix is formed to get a difference matrix with pattern similarity increases/decreases for every item pair. This difference matrix (PS’) is then put in relation to an external variable, for example the remembered spatial distance between every item pair, which is based on the behavioral distance judgment task at the end of the experiment. The relationship between PS’ and the external variable is expressed with a correlation coefficient. For example, higher pattern similarity increases for item pairs with lower remembered distance between them (i.e. which were remembered as being closer together) will result in a negative correlation coefficient. To estimate the strength of this relationship, the correlation coefficient is compared to a distribution of surrogate correlation coefficients derived from correlating shuffled pattern similarity increases and distance judgments. The position of the real correlation coefficient in this distribution is a marker for the strength of the effect and is expressed with a z-value, whose absolute value will be higher for more extreme values with regard to the surrogate distribution. However, the z-value can be both positive and negative, depending on which tail of the distribution the real correlation coefficient is located at. (B) Second level analysis. The z-statistics from the first level analysis, which were calculated for every participant, are then tested for significance across participants by comparing the mean z across participants to surrogate mean z-values derived from averaging randomly sign-flipped first-level z-values, with 10,000 repetitions of the random sign-flips. Again, if the mean of the first-level z-values is at an extreme end of the surrogate distribution, this is reflected in a high absolute z-value and a low probability (p) that the effect is not significantly different from zero. See Figure 4—figure supplement 1 for a corresponding illustration of methodological procedure for the searchlight analysis.
Figure 4—figure supplement 1
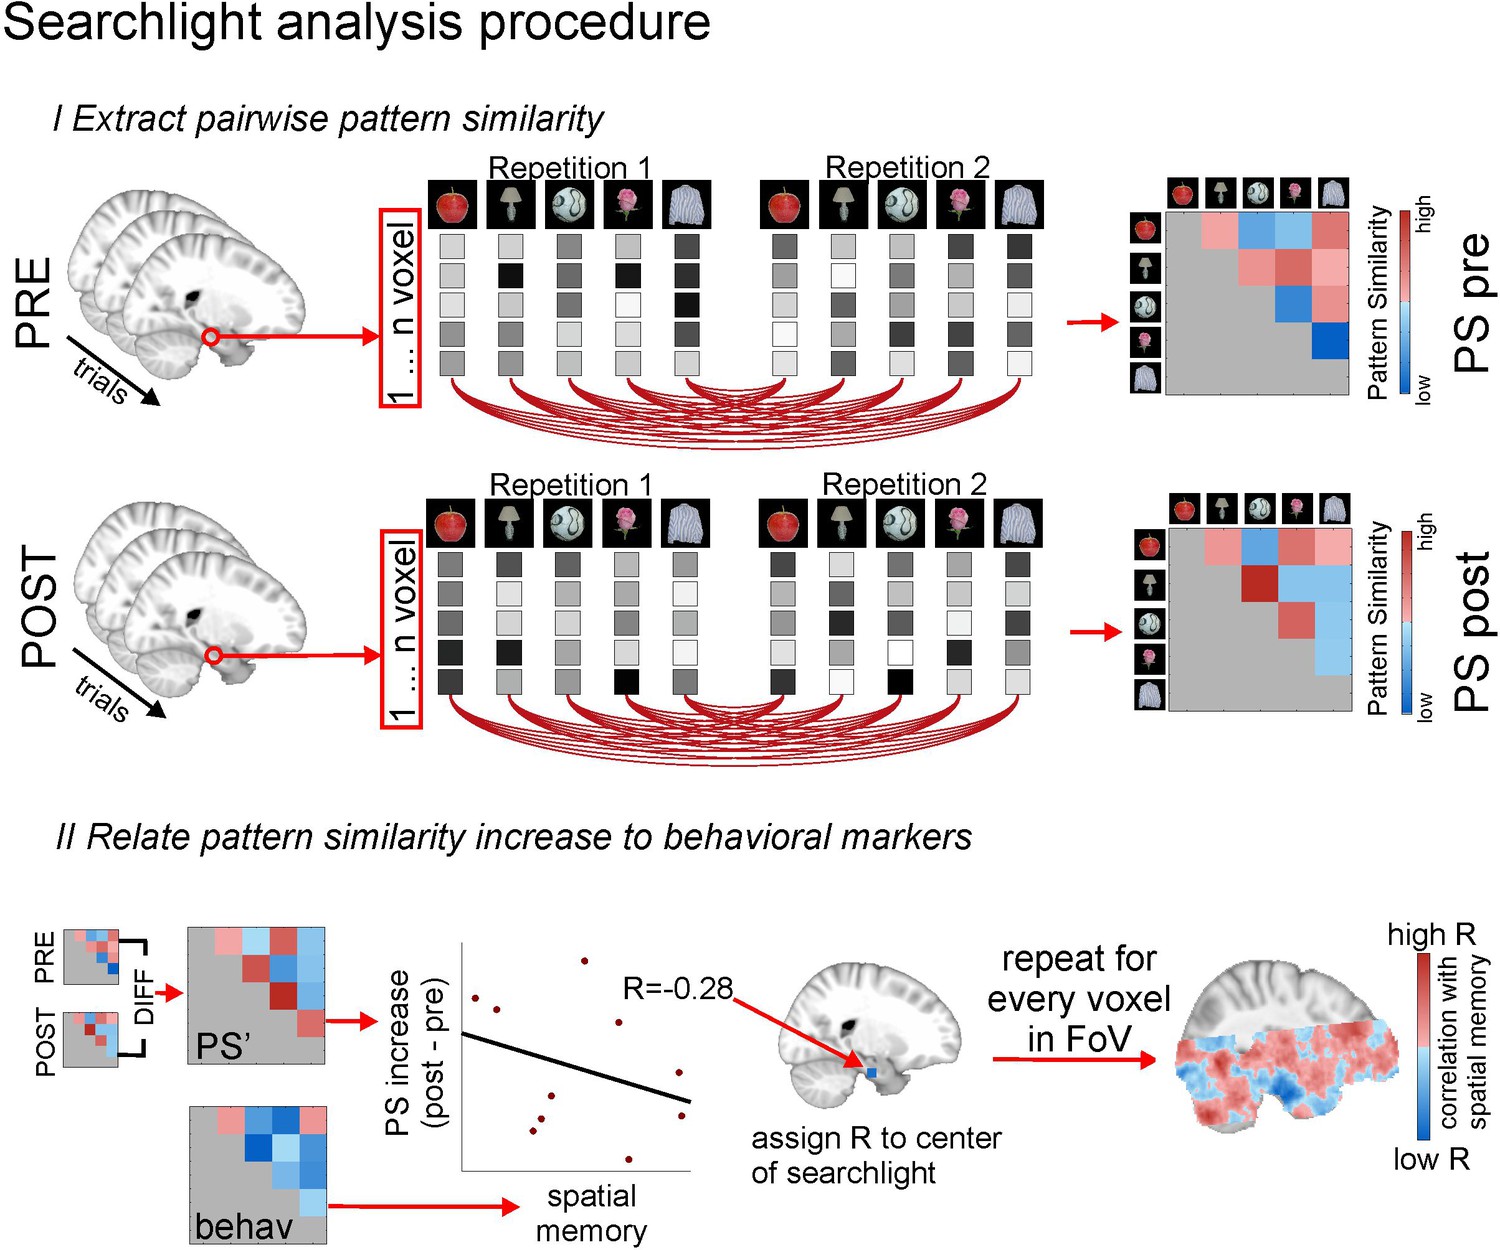
Methodological procedure for searchlight pattern similarity analysis.
Both for the picture viewing task pre and picture viewing task post, activity of all voxels within a searchlight (all voxels which are included in a radius of 9mm around a given center voxel) is extracted across all trials, in which 16 different items are presented 12 times (for display purposes, procedures here are depicted for 5 items only). Voxels patterns for every item in every repetition are correlated with voxel patterns for every other item in every other repetition, yielding one cross-correlation matrix for all items, respectively for the PVT pre and the PVT post task. In the next step, the difference between the PVT post cross-correlation matrix and the PVT pre cross-correlation matrix is formed to get a difference matrix with pattern similarity increases/decreases for every item pair. This difference matrix (PS’) is then put in relation to an external variable, for example the remembered spatial distance between every item pair, which is based on the behavioral distance judgment task at the end of the experiment. The relationship is expressed with a correlation coefficient. For example, higher pattern similarity increases for item pairs with lower remembered distance between them (i.e. which were remembered as being closer together) will result in a negative correlation coefficient. This correlation coefficient is assigned to the center voxel of the searchlight. Then, the center of the searchlight is moved to the next voxel, and the whole procedure starts anew, until it has been done for all voxels in the field of view. This yields a within-participants brain image of correlation coefficients. To identify regions in which these correlation coefficients are signficiantly smaller than zero across participants, the statistical images of all participants are moved to MNI space and submitted to non-parametric second level testing with the randomise module of the FSL toolbox (http://fsl.fmrib.ox.ac.uk/fsl/fslwiki/Randomise) and cluster free thresholding (see Materials and methods for more details on the analysis).
Figure 5 with 1 supplement
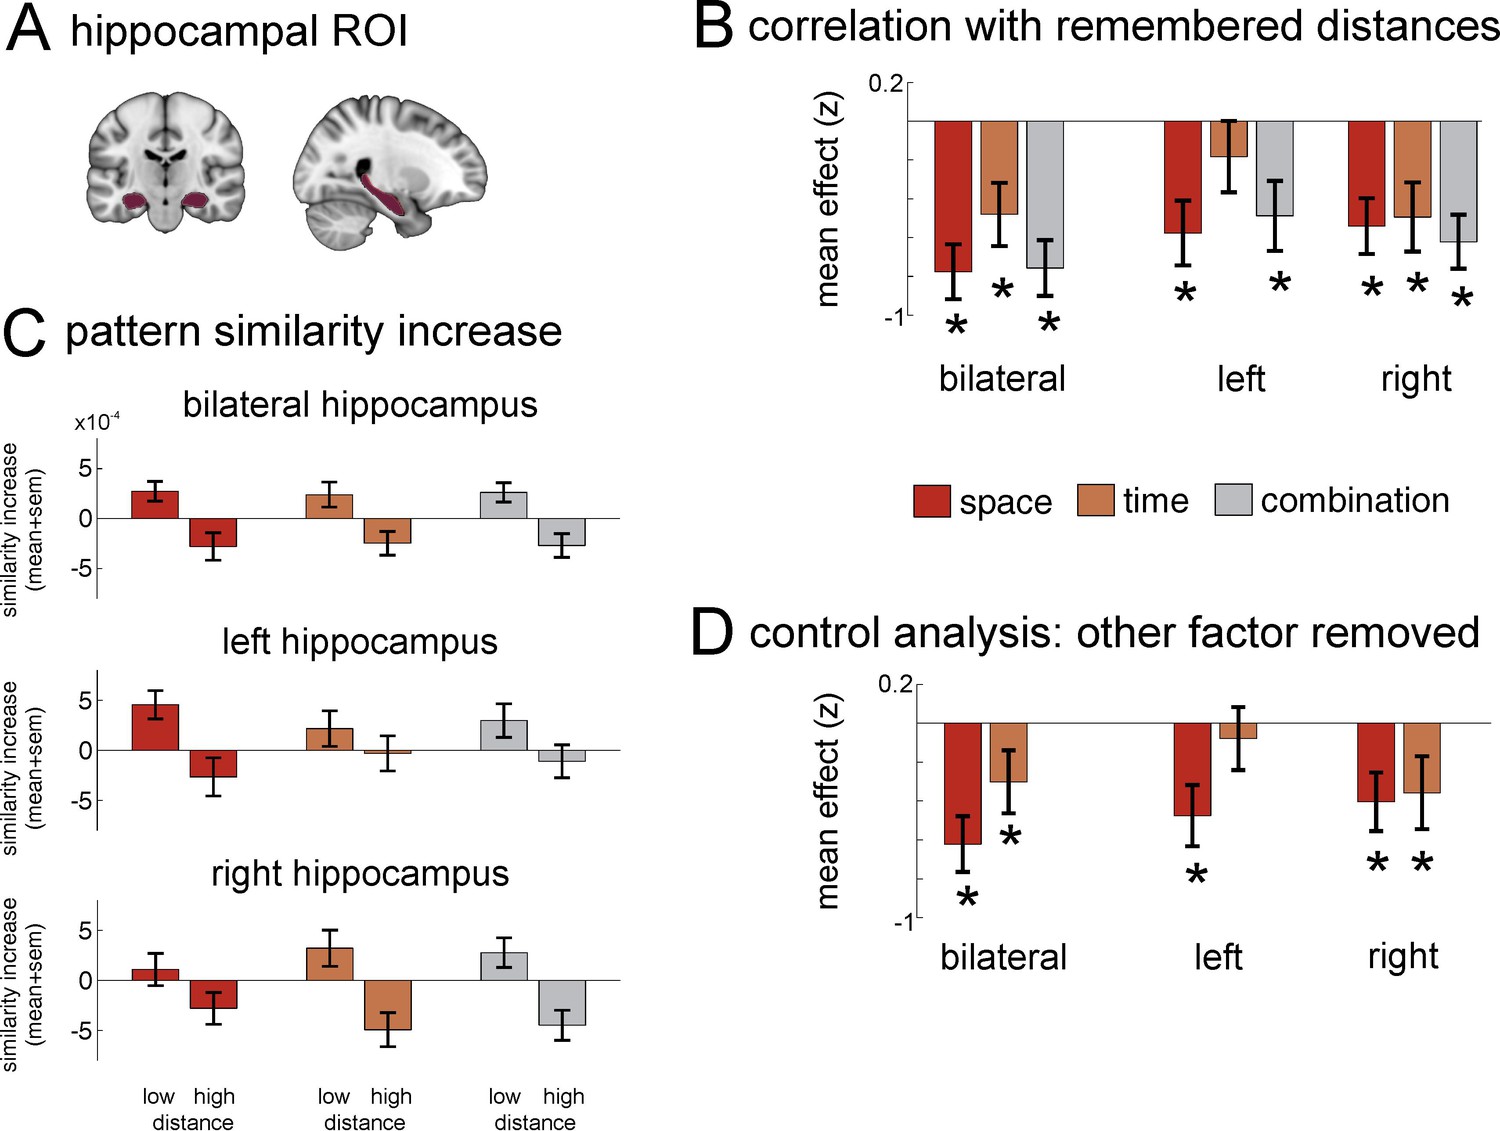
Neural similarity of hippocampal multi-voxel pattern scale with spatial and temporal memory and the combination of the two domains.
(A) Top: Hippocampus mask used for the ROI analysis. (B) Increases in pattern similarity (PS’) across all grey-matter voxels were negatively correlated with the spatial and temporal distance judgments from the post-scan memory test: The closer together two items were remembered (low distance), the higher was the pattern similarity increase observed in the hippocampus. Results from a bootstrapping procedure are depicted (mean ± sem) for spatial distance judgments and temporal judgments, as well as the combination of both (see Materials and methods for details on analysis). (C) Barplots show the averaged pattern similarity increases for item-pairs depending on whether they had low versus high distance to one another in the three conditions remembered spatial distance, remembered temporal distance and the combination of both. (D) Because spatial and temporal distance judgments were correlated in the memory judgments, an additional analysis was carried out to calculate the effects after the influence of the additional factor had been statistically removed. Analyses were performed for bilateral hippocampus, as well as for left and right hippocampus separately. Stars in B and D denote that effects were significantly smaller than zero across participants (statistically corrected for 15 comparisons, see Materials and methods for details on analysis). See Figure 5—figure supplement 1 for a more detailed ROI analysis of effects on posterior, medial and anterior hippocampus.
Figure 5—figure supplement 1

ROI analysis of anterior, middle and posterior hippocampus.
Pattern similarity increases in anterior hippocampus correlate with remembered spatial and temporal distances and the combination of both. To investigate which part of the hippocampus is most strongly related to remembered spatial and temporal distances, we split the hippocampus into thirds along the long axis of the hippocampus (cf. Collin et al., 2015; posterior portion of the hippocampus: from Y = −40 to −30; mid-portion of the hippocampus: from Y = −29 to −19; anterior portion of the hippocampus: from Y = −18 to −4). We investigated the same 5 effects as in the main Figure 5: Relationship with remembered spatial and temporal distances, as well as the combination of both, and the relationship with spatial and temporal distances after the influence of the other domain has been removed. Bars show the mean and SEM of the z-statistic across participants, which is a marker for within-subject effect strength and is derived from comparing the correlation coefficient between remembered distances and pattern similarity increases to a distribution of correlation coefficients that is based on shuffled, i.e. random, data (see Figure 4 and Methods and materials for more details on the analysis). Stars denote where, across participants, the z-statistic is significantly smaller than zero (indicating higher similarity increases with lower distances, as we expected) after correcting for 15 multiple comparisons (3 parts of hippocampus, 5 effects of interest) with FDR-correction based on Benjamini and Yukuteli (2001).
Figure 6
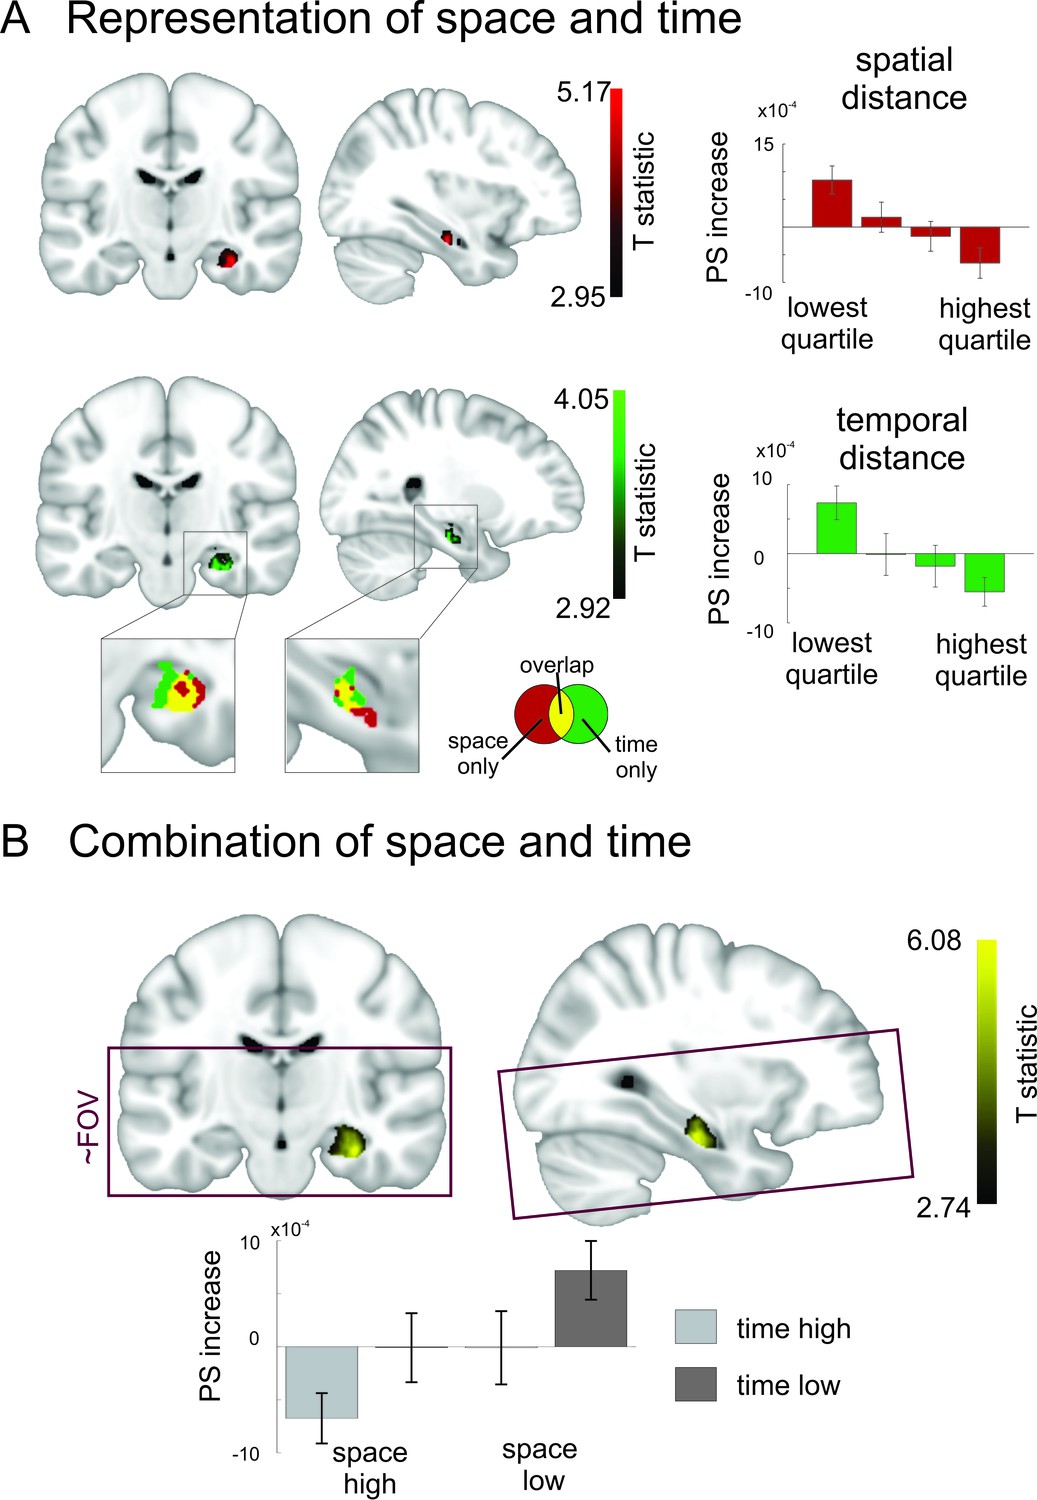
Overlapping and distinct codes for spatial and temporal event structures in the hippocampus.
Results from the searchlight analysis in which pattern similarity changes in searchlights across the whole MRI acquisition volume were correlated with distance judgments from the post-scanning spatial and temporal memory tests. (A) Partly overlapping clusters in right medial to anterior hippocampus show significant correlations between pattern similarity increases and spatial distance judgments, as well as temporal distance judgments; enlarged section of hippocampus shows overlapping and separate voxels for the two conditions (binary masks including voxels surviving correction for multiple comparisons of the respective second-level analysis). Bar plots show pattern similarity increases (mean ± sem) for the hippocampal peak separately for different levels of remembered spatial and temporal distance judgments, respectively (memory data binned into quartiles). (B) The effect was strongest when the two factors of space and time were combined and spans the border between medial and anterior hippocampus. Effects are overlaid on a structural template; the color bar indicates T-statistic derived from nonparametric second level analyses (see Materials and methods). Bar plots on the right show parameter estimates (mean pattern similarity increase for the peak voxel). Box indicates approximate field of view (FoV) of the acquisition volume (40 slices at 1.5 mm) for all MR scans. Images are thresholded at pcorr <0.05 (small volume corrected, see Materials and methods).
-
Figure 6—source data 1
Statistical maps of the searchlight results.
Maps contain t-statistics and have been thresholded to correct for multiple comparisons as detailed in the Materials and methods.
- https://doi.org/10.7554/eLife.16534.015
Author response image 1
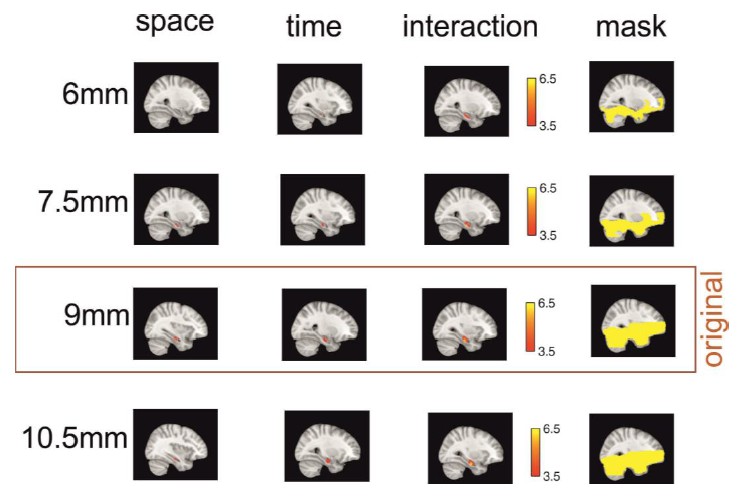
Effects are preserved across different searchlight sizes.
The effects of the three main analyses are similar when the radius of the searchlight sphere is smaller (6mm and 7.5mm) or bigger (10.5mm) than the original radius (9mm) – with the exception of the remembered spatial distance effect at the smallest sphere size, which does not survive small volume correction for bilateral hippocampus. All clusters shown here survive small volume correction for bilateral hippocampus and are located in the right hemisphere. Note that in order to get a good estimate of pattern similarity across voxels, a minimum number of graymatter voxels should be included in the searchlight (set to 30 in this study). At the smallest sphere size, this restriction is not met for aconsiderable number of voxels, and therefore, no values are calculated forthese searchlights. This is illustrated by showing the masks in the right column, which are the masks of all voxels for which all participants have values for the respective sphere size.
Download links
A two-part list of links to download the article, or parts of the article, in various formats.
Downloads (link to download the article as PDF)
Open citations (links to open the citations from this article in various online reference manager services)
Cite this article (links to download the citations from this article in formats compatible with various reference manager tools)
An event map of memory space in the hippocampus
eLife 5:e16534.
https://doi.org/10.7554/eLife.16534


