BubR1 alterations that reinforce mitotic surveillance act against aneuploidy and cancer
- Mayo Clinic, United States
Figures
Figure 1 with 1 supplement
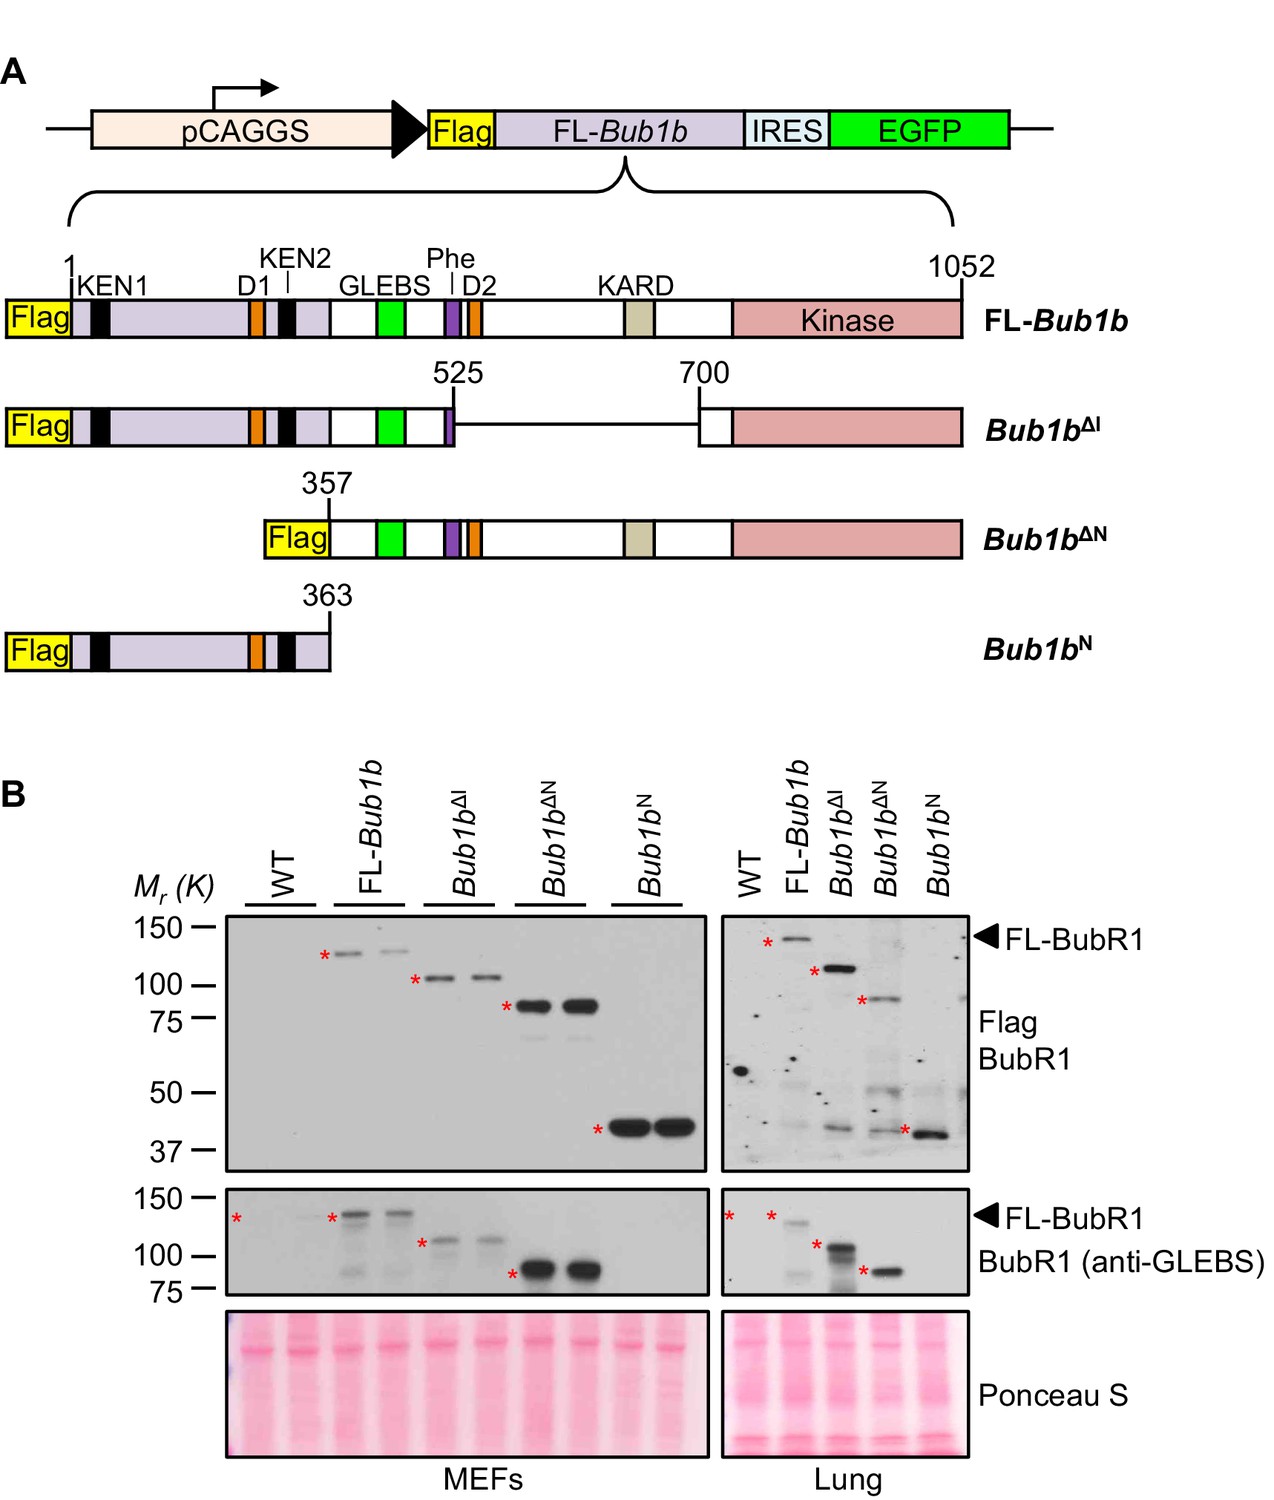
BubR1 transgenic mutant proteins are highly overexpressed in vitro and in vivo.
(A) (top) Bub1b transgenic vector design. pCAGGS, promoter consisting of the CMV immediate enhancer and the chicken-actin promoter. FL, full-length. IRES, internal ribosome entry site. (bottom) Schematics of the Flag-Bub1b transgenic mouse constructs. KEN, KEN-box. D, destruction-(D-)box. GLEBs, GLEBs-binding motif. Phe, Phe box. KARD, kinetochore attachment regulatory domain. (B) Western blots of MEF (left) and lung tissue extracts (right) from wild-type (WT) and Flag-Bub1b transgenic mice. Blots were probed with the indicated antibodies. Ponceau S was used to normalize loading.
Figure 1—figure supplement 1

Analysis of BubR1 overexpression in transgenic MEFs.
Full scan and multiple exposures of Western blots of MEF lysates from Figure 1B. WT, wild-type. FL, full-length.
Figure 2
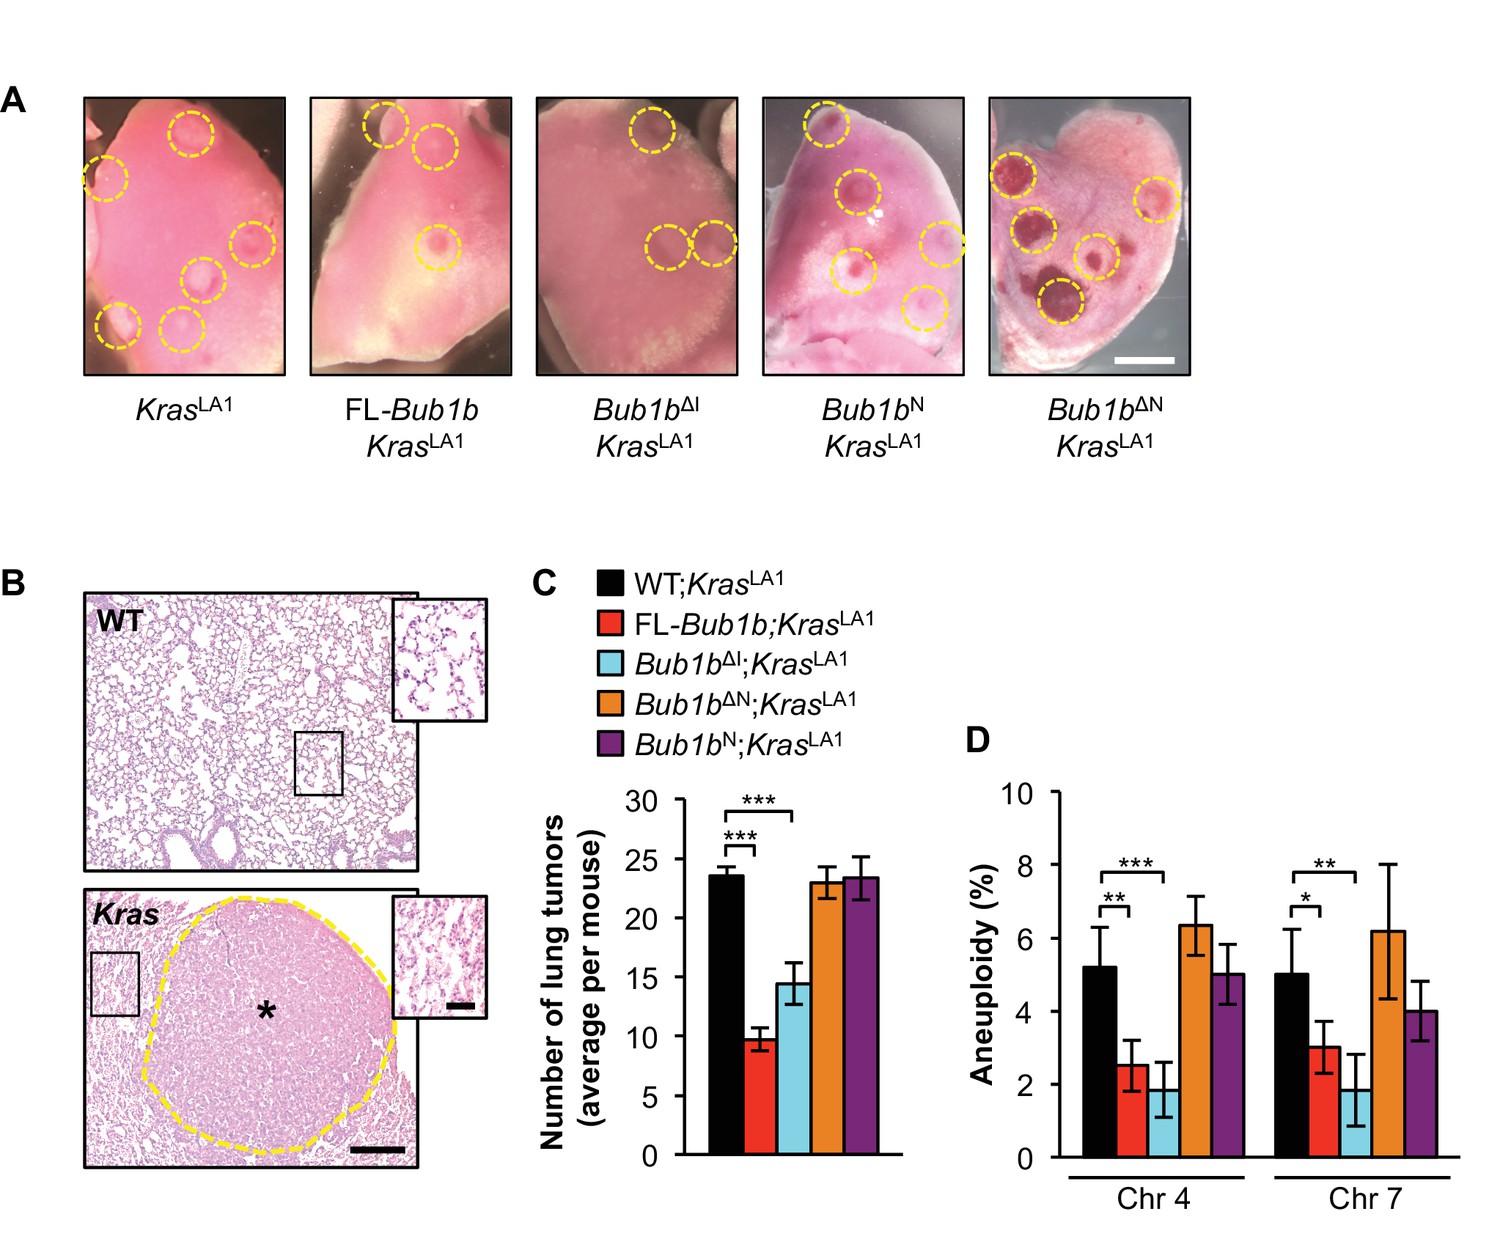
Select BubR1 domain overexpression protects against aneuploidy and cancer.
(A) Lung lobes of KrasLA1 mice and KrasLA1 mice expressing various BubR1 transgenic proteins sacrificed at 6 weeks of age. Entire lungs were inspected using a dissection microscope to quantitate the number of lung tumors (adenomas) per mouse. (B) Hematoxylin-eosin stained lung sections of representative normal (WT) lung and a KrasLA1 (Kras) hyperplastic tumor-bearing lung (the dashed line marks the adenoma boundary). Insets highlight normal and hyperplastic lung architecture. (C) Quantification of the number of lung tumors from mice shown in A. n = 20, except for full-length (FL)-Bub1b where n = 7. Data are mean ± s.e.m. ***p<0.001. (D) Interphase FISH on the lungs of wild-type and KrasLA1 with and without FL-BubR1 and mutant overexpression. n = 5, ≥ 100 cells per animal. Data are mean ± s.d. *p<0.05, **p<0.01. ***p<0.001. Scale bars: A, 2 mm; B, 200 µm (main image) and 50 µm (insets). (See associated Figure 2—source data 1).
-
Figure 2—source data 1
Source file for tumor incidence and tissue aneuploidy rate data.
- https://doi.org/10.7554/eLife.16620.012
Figure 3
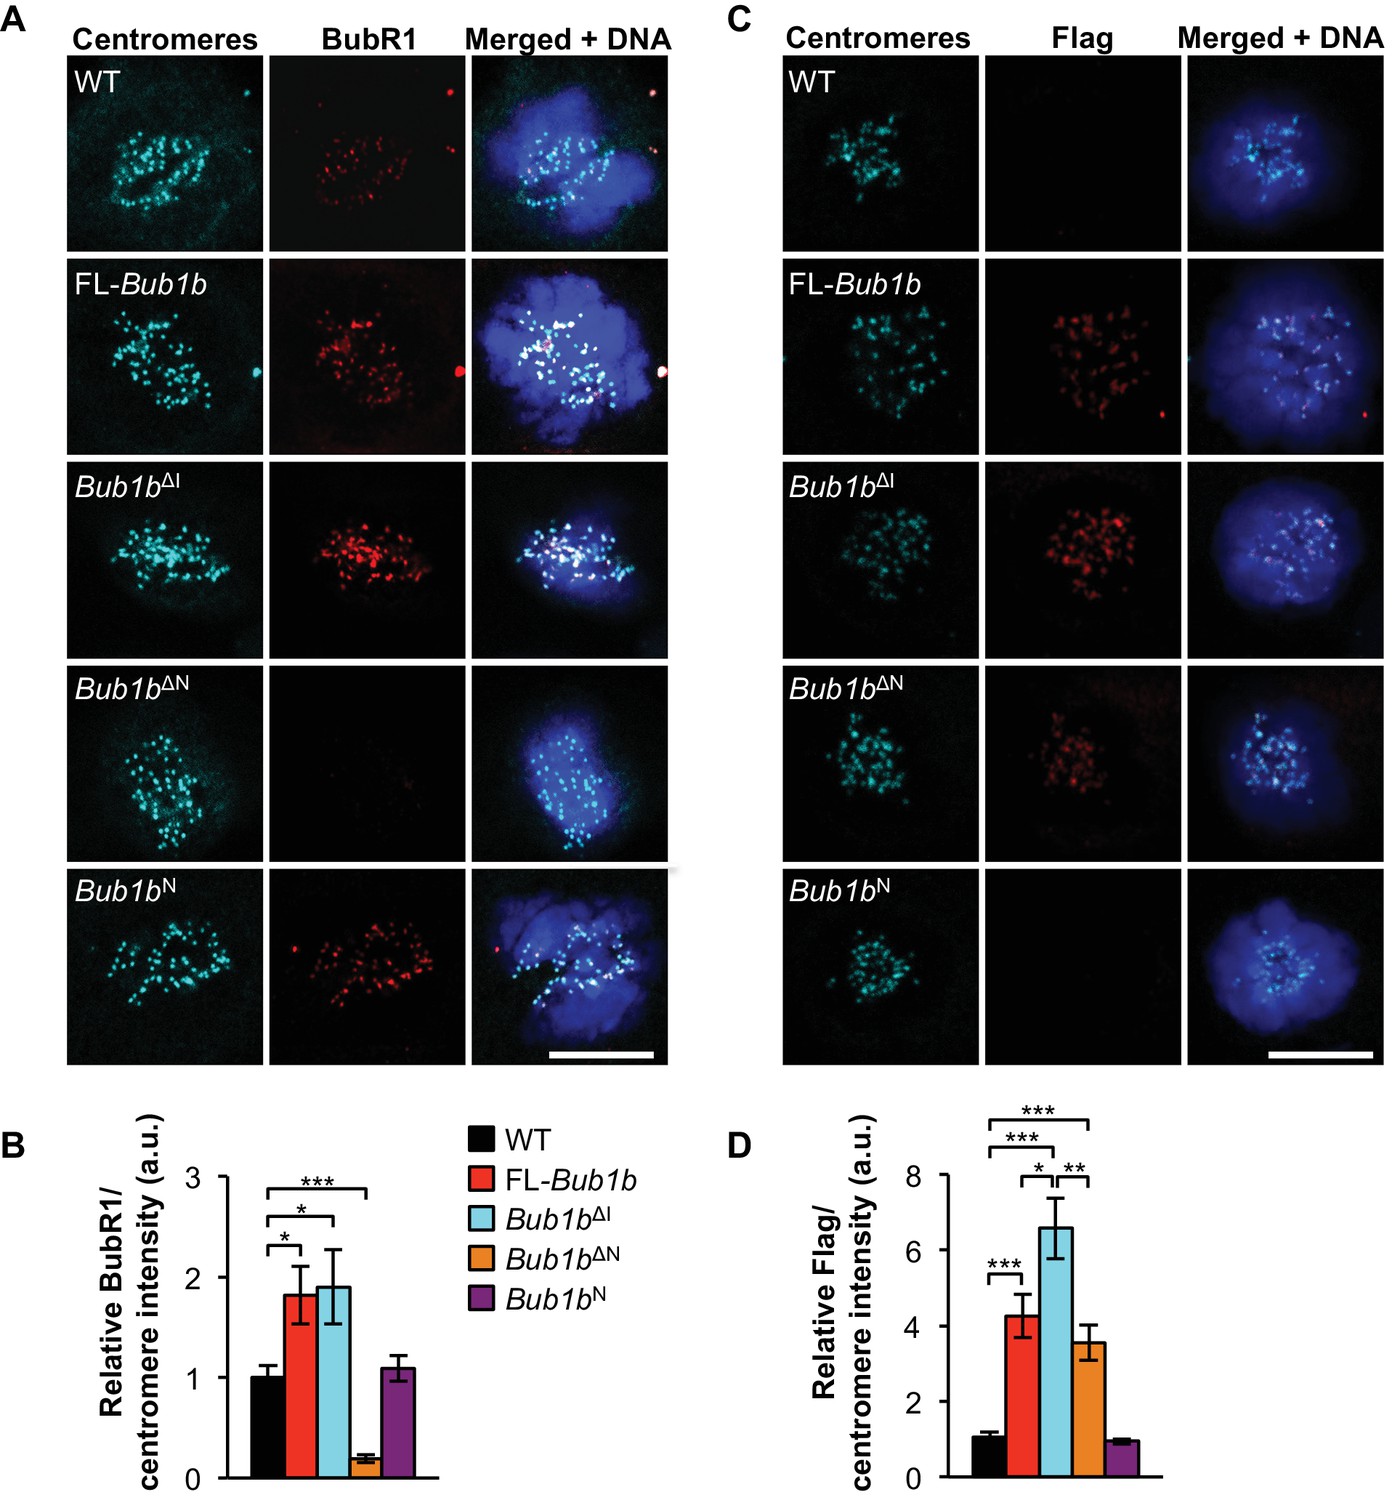
Increased BubR1 localization to kinetochore corresponds to phenotypic benefits.
(A) MEFs of indicated genotypes were stained for BubR1 (red), centromeres (cyan), and DNA (blue). WT, wild-type. FL, full-length. (B) Quantification of immunostaining of BubR1 shown in A. Values were normalized to centromere stain and are relative to wild-type. n = 3 lines, ≥ 10 cells per line. Data are mean ± s.d. *p<0.05, ***p<0.001. (C) Same as in A except with anti-Flag antibody to detect transgenic BubR1. (D) Quantification of immunostaining of Flag shown in C. Values were normalized to centromere stain and are relative to wild-type. Wild-type and Bub1bN represent background. n = 3 lines, ≥ 10 cells per line. Data are mean ± s.d. *p<0.05, **p<0.01, ***p<0.001. Scale bar 10 µm. (See associated Figure 3—source data 1).
-
Figure 3—source data 1
Source file for intensity of kinetochore-localized BubR1 and FLAG protein data.
- https://doi.org/10.7554/eLife.16620.014
Figure 4 with 1 supplement
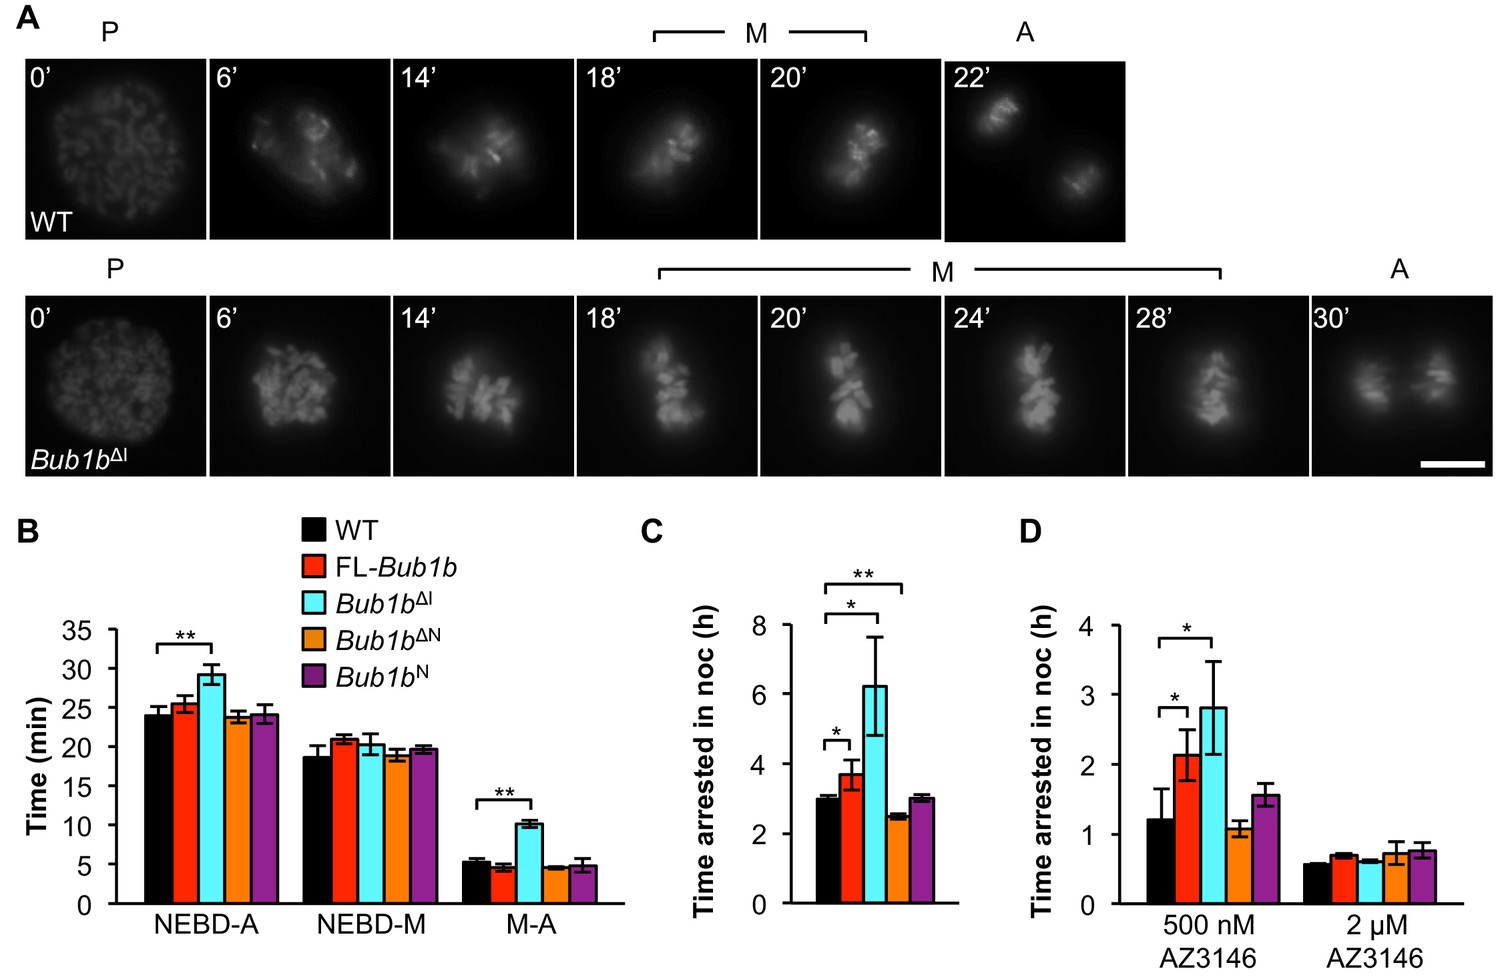
Bub1bΔI MEFs have an increased time in mitosis and duration of mitotic arrest.
(A) Representative time-lapse images of live MEF cells of indicated genotypes progressing from prophase (t = 0) to anaphase (A). Time is indicated in min. WT, wild-type. P, prophase. M, metaphase. (B) Analysis of the time from nuclear envelope breakdown (NEBD) to anaphase onset in H2B-RFP MEFs of the indicated genotypes by live cell time-lapse imaging. n = 3 lines, ≥ 20 cells per line. Data are mean ± s.d. **p<0.01. FL, full-length. (C) In a nocodazole challenge, H2B-RFP MEFs of indicated genotypes were treated with 100 ng/ml of nocodazole (noc) and monitored by live cell time-lapse imaging. The point of time in which 50% of cells are arrested in mitosis is plotted. n ≥ 3 lines, ≥ 20 cells per line. Data are mean ± s.d. *p<0.05, **p<0.01. (D) H2B-RFP wild-type and mutant transgenic MEFs were treated concurrently with 100 ng/ml nocodazole and indicated concentrations of the Mps1 kinase inhibitor, AZ3146. The point of time in which 50% of cells are arrested in mitosis is plotted. n = 3 lines, ≥ 20 cells per line. Data are mean ± s.d. *p<0.05. Scale bar, 10 µm (See associated Figure 4—source data 1).
-
Figure 4—source data 1
Source file for mitotic timing and nocodazole arrest data.
- https://doi.org/10.7554/eLife.16620.016
Figure 4—figure supplement 1

Bub1bΔI MEFs do not have persistent Mad2 signaling.
(A) MEFs of indicated genotypes and cell stage were stained for Mad2 (red), centromeres (cyan), and DNA (blue). White arrowhead depicts misaligned chromosome. WT, wild-type. FL, full-length (B) Table depicting the number of metaphases with at least one Mad2-positive kinetochore. n = 3 lines, 15 cells per line. (C) MEFs of indicated genotypes and cell stage were stained for Mad2 (red), centromeres (cyan), and DNA (blue). Scale bar 10 µm.
Figure 5 with 1 supplement
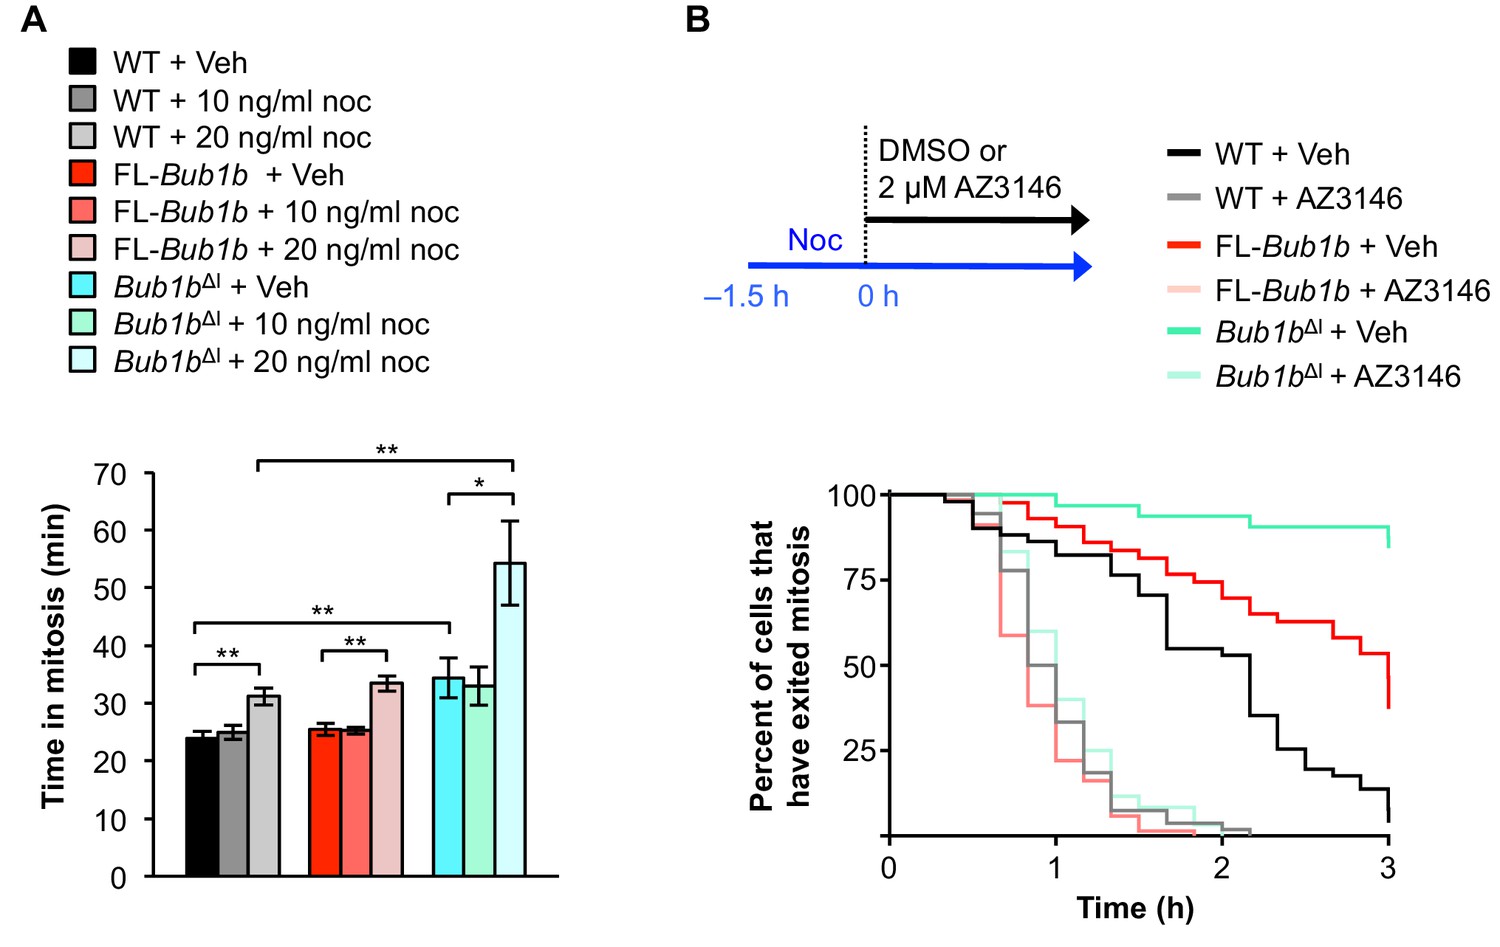
Bub1bΔI MEFs have a lower threshold to checkpoint activation.
(A) Analysis of the time from NEBD to anaphase onset in H2B-RFP MEFs of the indicated genotypes treated with either DMSO vehicle (Veh) or indicated concentration of nocodoazole (Noc). n = 3 lines, ≥ 20 cells per line. Data are mean ± s.d. *p<0.05, **p<0.01. WT, wild-type. FL, full-length. (B) (top) Strategy for analyzing the checkpoint silencing efficiency. MEFs of indicated genotypes were treated with 100 ng/ml nocodazole for 1.5 hr before addition of either DMSO vehicle (Veh) or 2 µM AZ3146, at which point cells were marked and monitored for time of escape (time point zero). (bottom) Analysis of duration of mitotic arrest from time point zero as outlined in (top). n = 3 lines, ≥ 20 cells per line. (See associated Figure 5—source data 1).
-
Figure 5—source data 1
Source file for low-dose nocodazole challenge and SAC silencing data.
- https://doi.org/10.7554/eLife.16620.019
Figure 5—figure supplement 1
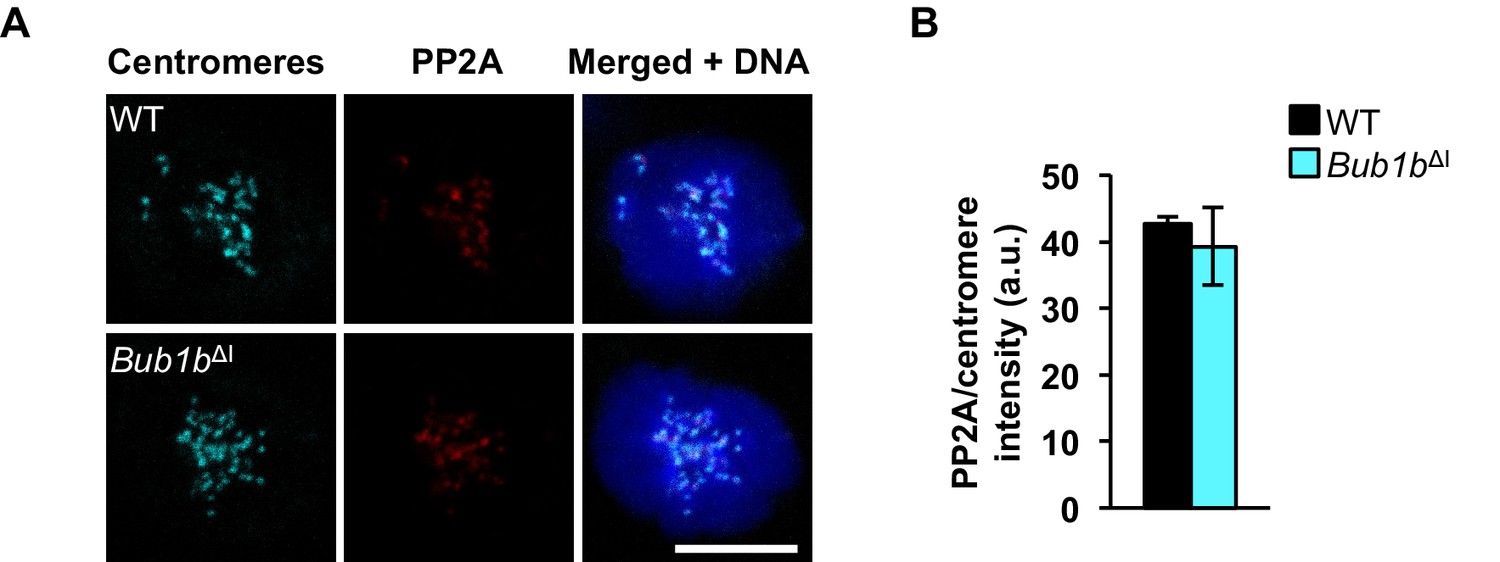
PP2A localization is normal in Bub1bΔI MEFs.
(A) Wild-type (WT) and Bub1bΔI MEFs were arrested in 100 ng/ml nocodazole and stained for PP2A (red), centromeres (cyan), and DNA (blue). (B) Quantification of immunostaining of PP2A in A. Values were normalized to centromere stain. n = 3 lines, ≥ 10 cells per line. Data are mean ± s.d. Scale bar 10 µm. (See associated Figure 5—figure supplement 1—source data 1).
-
Figure 5—figure supplement 1—source data 1
Source file for intensity of kinetochore-localized PP2A protein data.
- https://doi.org/10.7554/eLife.16620.021
Figure 6 with 1 supplement
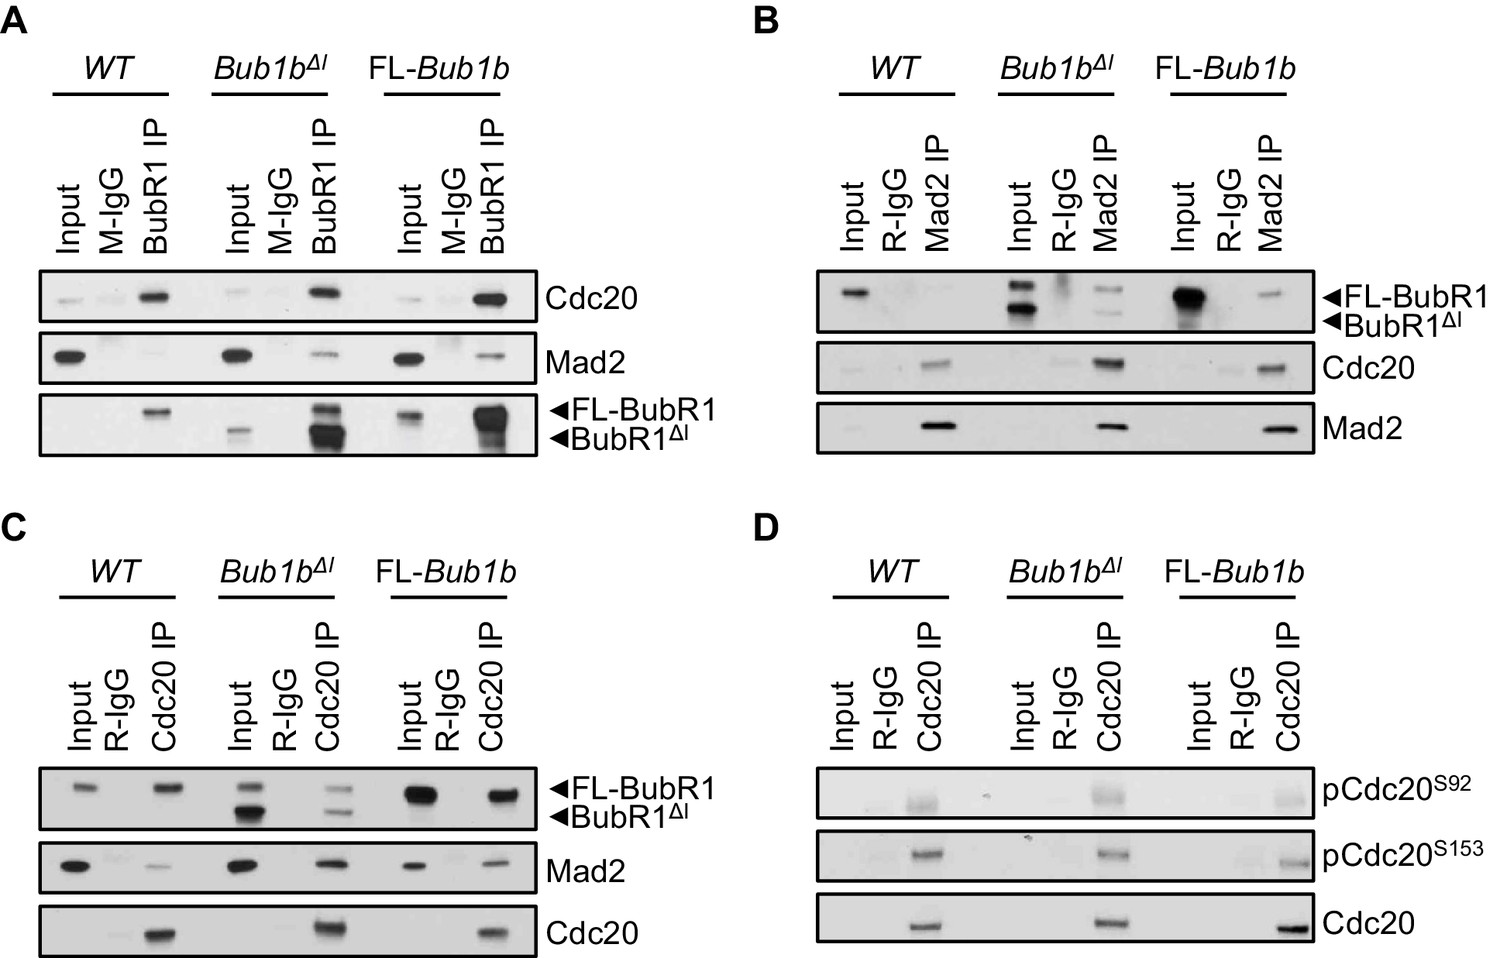
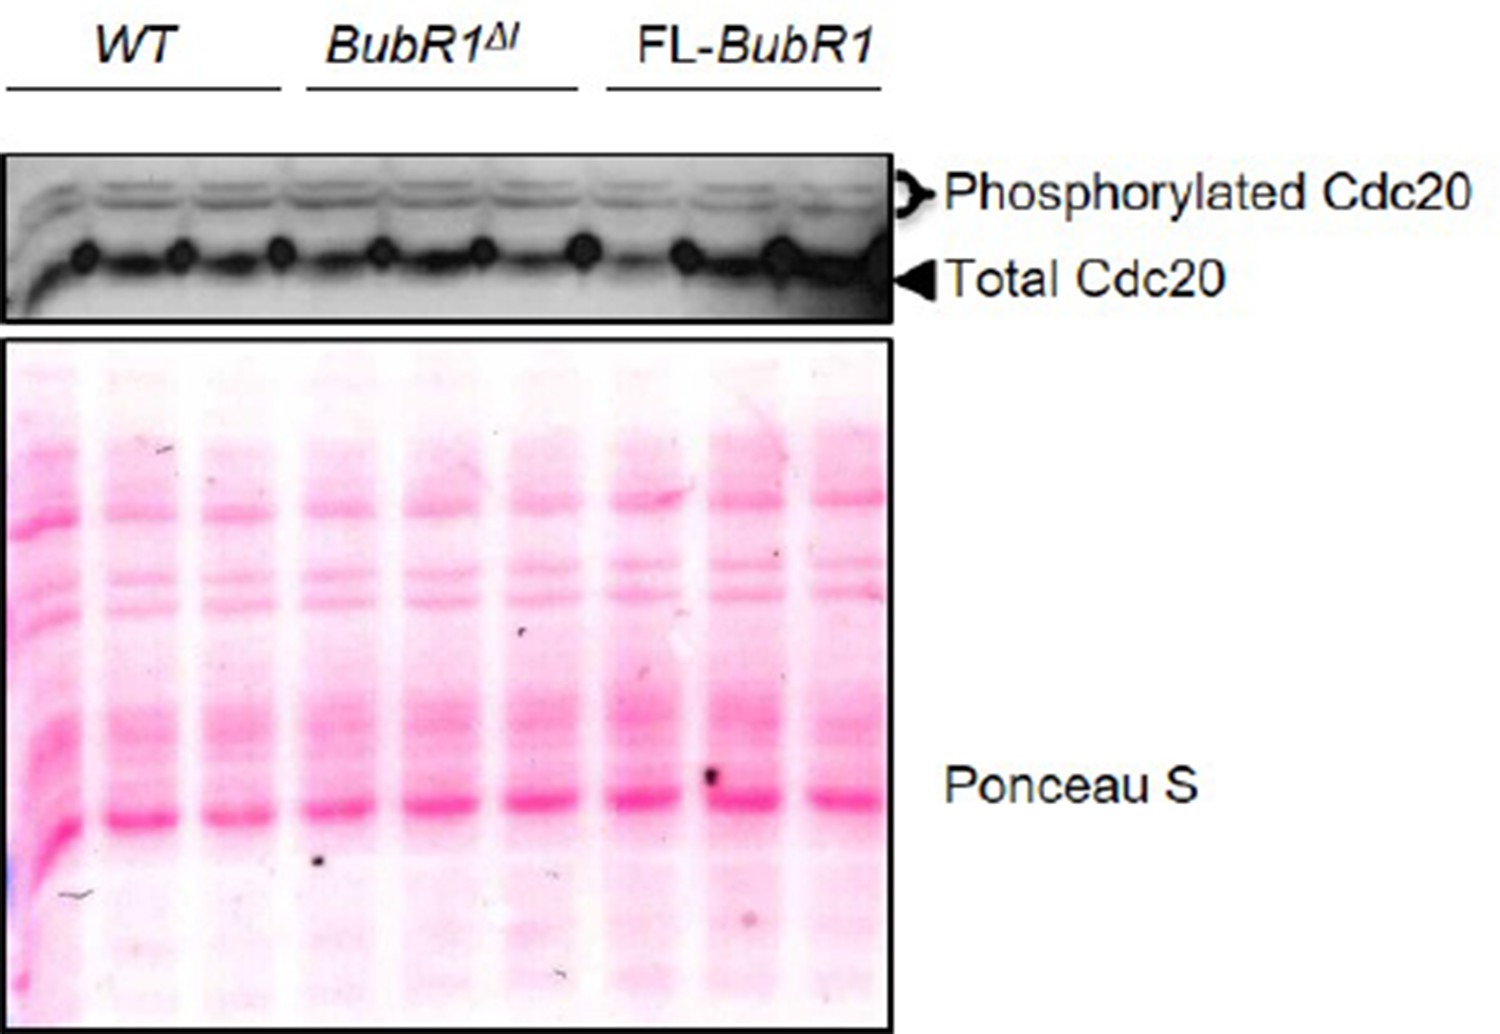
Composition of mitotic checkpoint complexes is unique in Bub1bΔI MEFs.
(A–D) Immunoblots of mitotic wild-type (WT) and indicated mutant MEF extracts subjected to co-immunoprecipitation with the indicated antibodies. Each blot is a representative of at least 3 experiments. FL, full-length.
Figure 6—figure supplement 1
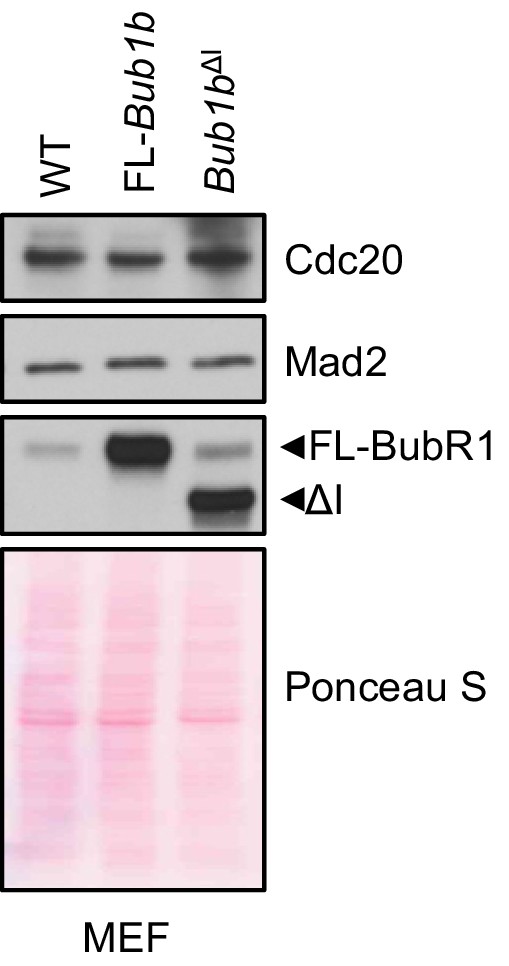
Mitotic checkpoint components have a normal expression in Bub1b transgenic MEFs.
Western blot analysis of mitotic MEF lysates of indicated genotypes. Blots were probed with indicated antibodies. Ponceau S was used to normalize loading. Blot is a representative of at least three experiments. WT, wild-type. FL, full-length.
Figure 7
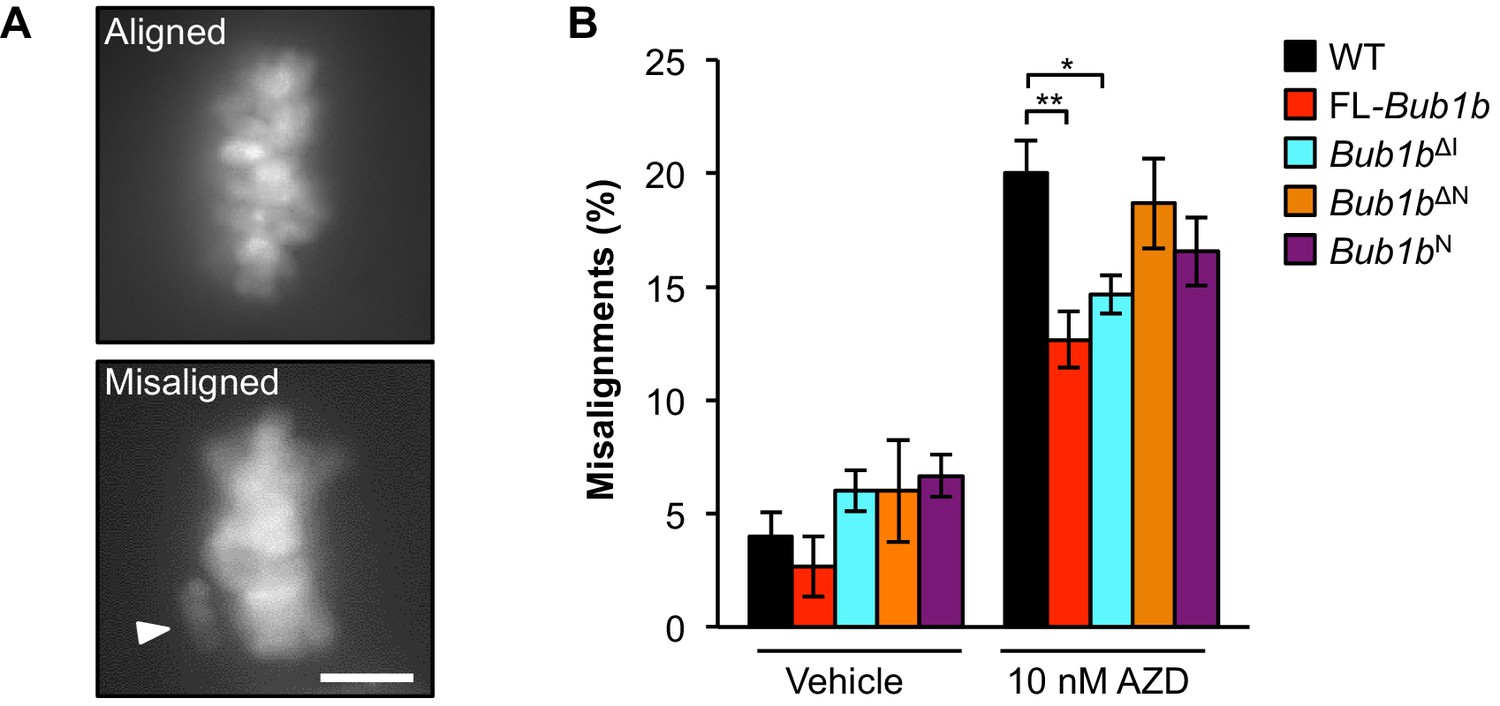
Overexpression of FL-BubR1 and BubR1ΔIimproves error correction rates.
(A) Representative images of MEFs with aligned or misaligned chromosomes after monastrol washout. White arrowhead depicts misaligned chromosome. (B) Analysis of chromosome misalignment in MEFs expressing the indicated Bub1b transgenes. MEFs were treated with 100 µM monastrol for 1 hr and then with monastrol and 10 µM MG132 for 1 hr and released for 90 min into MG132. Cells were treated with DMSO (Vehicle) or 10 nM AZD1152-HQPA (AZD) throughout the duration of the experiment. n = 6 lines (≥25 cells per line were analyzed). Data are mean ± s.d. *p<0.05, **p<0.01. Scale bar, 10 µm. WT, wild-type. (See associated Figure 7—source data 1).
-
Figure 7—source data 1
Source file for monastrol washout data.
- https://doi.org/10.7554/eLife.16620.025
Figure 8 with 1 supplement
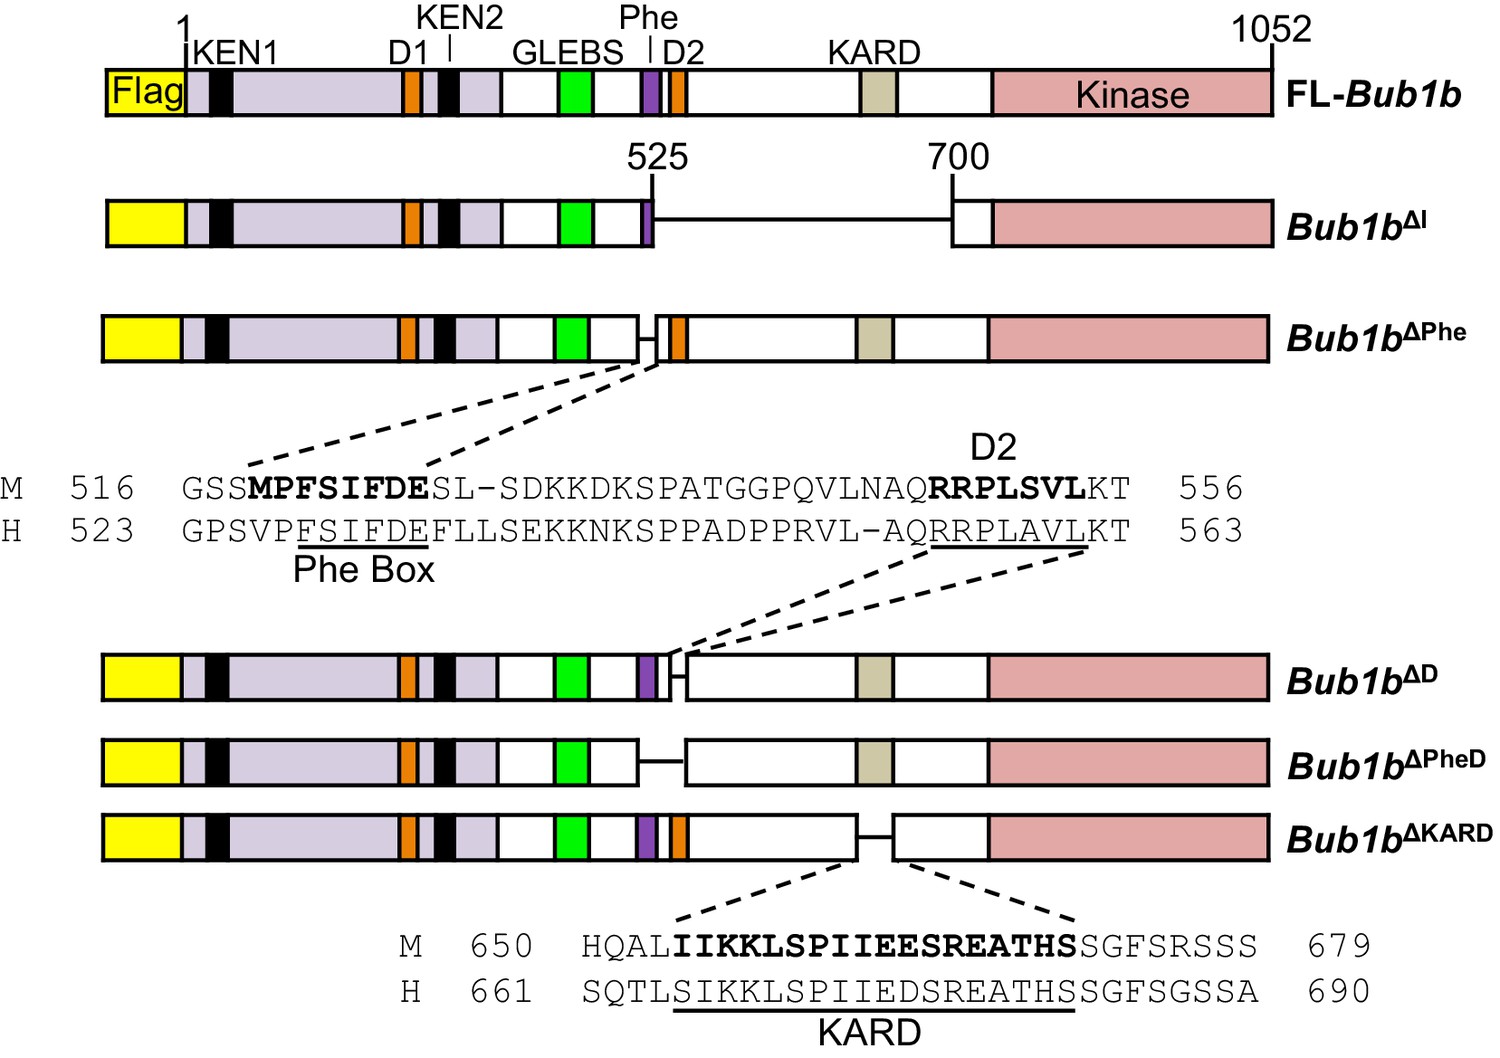
Schematics of pTripZ-Flag-Bub1b mutants.
Schematics of the pTripZ-Flag-Bub1b constructs. D, destruction-(D-)box. GLEBs, GLEBs-binding motif. Phe, Phe box. KARD, kinetochore attachment regulatory domain. FL, full-length. Sequence alignment of the Phe box, D-box2, and KARD region of human and mouse BubR1. Residues characterized in human BubR1 are underlined, and homologous residues deleted in mouse Bub1b constructs are bold.
Figure 8—figure supplement 1

Protein levels of Bub1b deletion constructs in wild-type MEFs.
Western blots of wild-type (WT) MEFs infected with the indicated constructs with or without doxycycline (Dox). Blots were probed with the indicated antibodies. Ponceau S was used to normalize loading. Asterisk indicates specific band for BubR1ΔI.
Figure 9 with 1 supplement
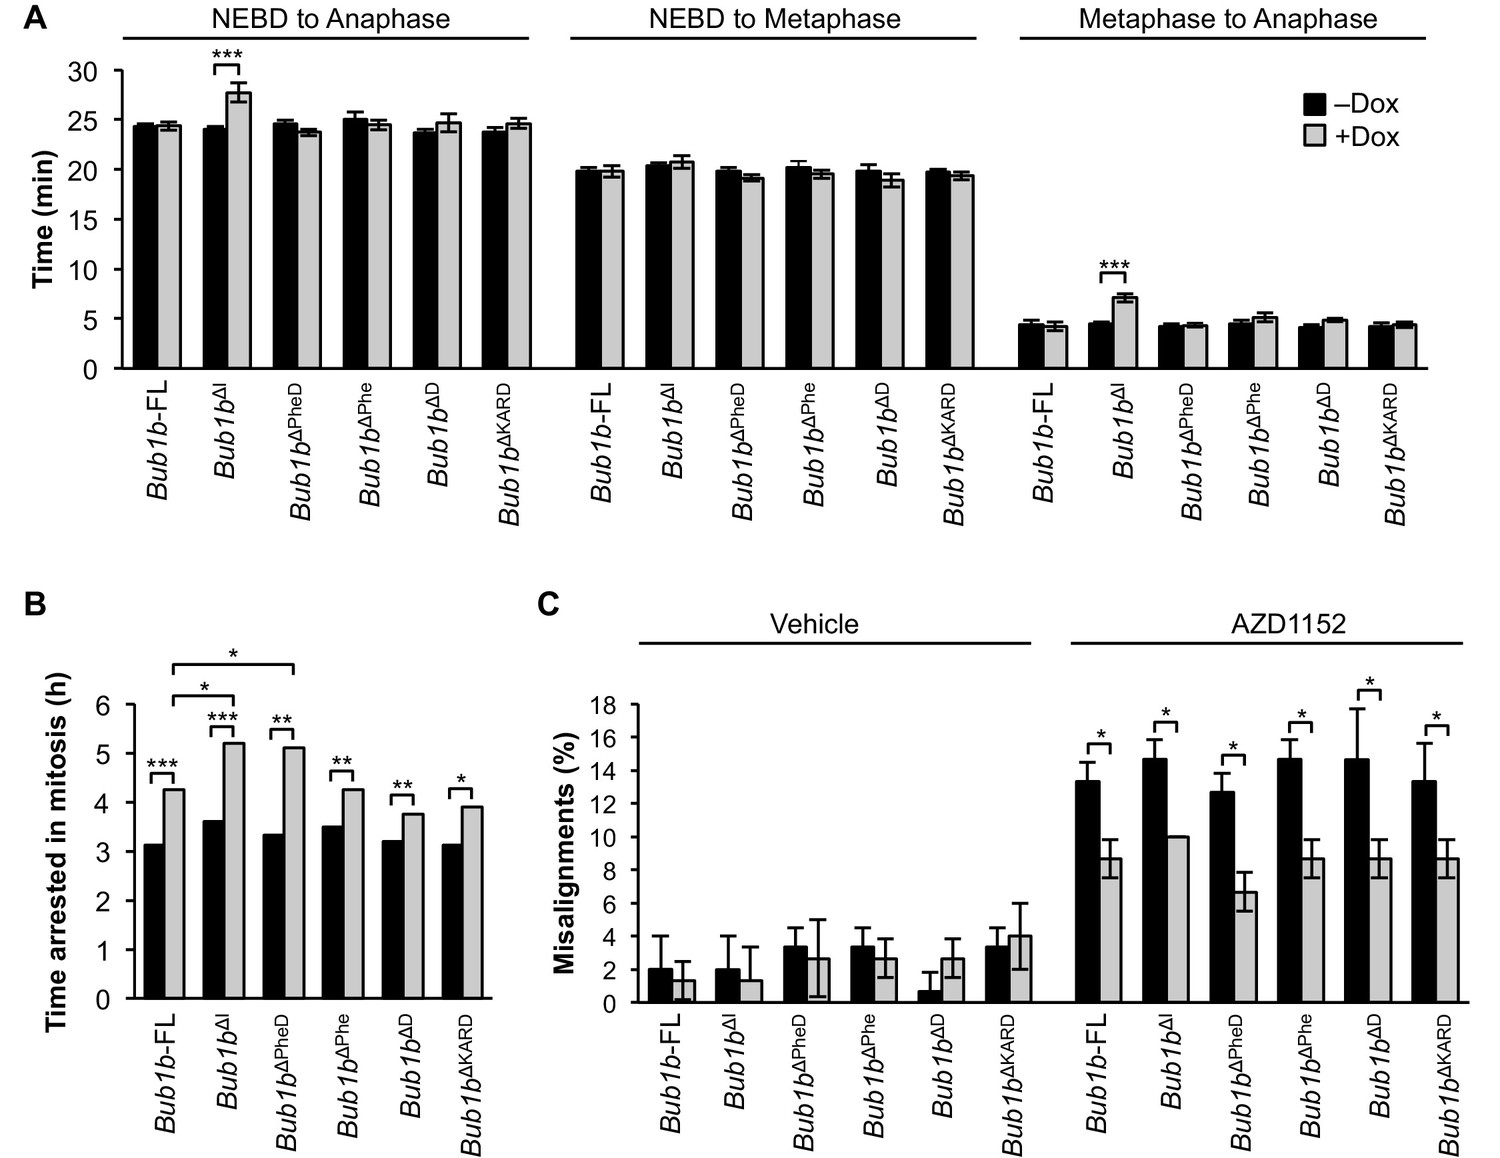
BubR1 deletion constructs extend nocodazole arrest and positively impact error attachment machinery.
(A) Analysis of the time from nuclear envelope breakdown (NEBD) to anaphase onset in H2B-RFP wild-type MEFs infected with the indicated constructs with and without the addition of doxycycline (Dox) by live cell time-lapse imaging. n = 1 line, ≥ 20 cells per treatment. Data are mean ± s.e.m. ***p<0.001. FL, full-length. (B) In a nocodazole challenge, H2B-RFP wild-type MEFs infected with the indicated constructs with and without the addition of Dox were treated with 100 ng/ml of nocodazole and monitored by live cell time-lapse imaging. The point of time in which 50% of cells are arrested in mitosis is plotted. n = 1 line, ≥ 15 cells per treatment. *p<0.05, **p<0.01, ***p<0.001. (C) Analysis of chromosome misalignment in wild-type MEFs infected with the indicated constructs with and without addition of Dox. MEFs were treated with 100 µM monastrol for 1 hr and then with monastrol and 10 µM MG132 for 1 hr and released for 90 min into MG132. Cells were treated with DMSO (Vehicle) or 50 nM AZD1152-HQPA (AZD1152) throughout the duration of the experiment. n = 3 lines, 50 cells per line per treatment. Data are mean ± s.d. *p<0.05. (See associated Figure 9—source data 1).
-
Figure 9—source data 1
Source file for mitotic timing, nocodazole challenge and monastrol washout data.
- https://doi.org/10.7554/eLife.16620.029
Figure 9—figure supplement 1

Combined loss of Phe, D-box2 and KARD does not impact mitotic timing.
(A) Schematic of the pTripZ-Flag-Bub1b∆PheD∆KARD construct. D, destruction-(D-)box. GLEBs, GLEBs-binding motif. Phe, Phe box. KARD, kinetochore attachment regulatory domain. FL, full length. (B) Western blot of wild-type (WT) MEFs infected with Bub1b∆PheD∆KARD with or without doxycycline (Dox). Blot was probed with the indicated antibodies. Ponceau S was used to normalize loading. (C) Analysis of the time from nuclear envelope breakdown (NEBD) to anaphase onset in H2B-RFP WT MEFs infected with Bub1b∆PheD∆KARD with and without the addition of Dox by live cell time-lapse imaging. n = 1 line, ≥ 20 cells. Data are mean ± s.e.m. M, metaphase. (See associated Figure 9—figure supplement 1—source data 1).
-
Figure 9—figure supplement 1—source data 1
Source file for mitotic timing data.
- https://doi.org/10.7554/eLife.16620.031
Figure 10
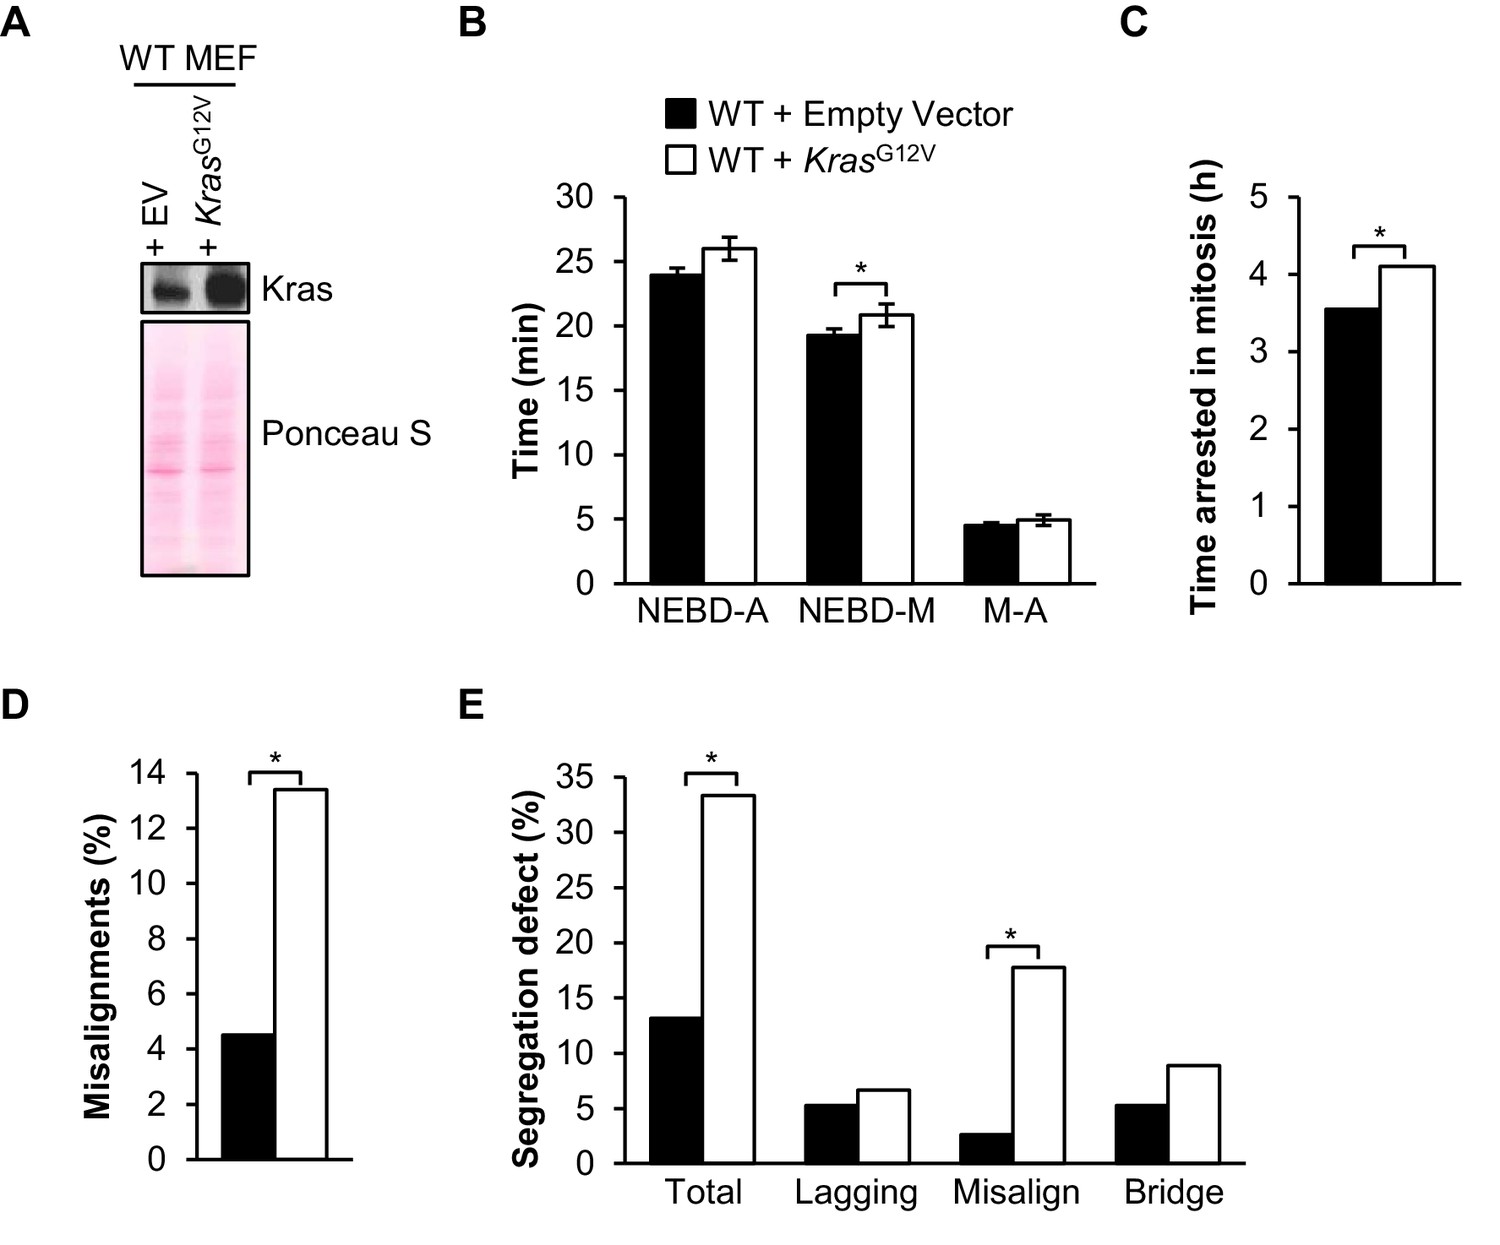
Oncogenic Kras increases microtubule-kinetochore malattachment.
(A) Western blot of wild-type (WT) MEFs infected with pBABE-Puro-KRas(G12V) or empty vector (EV). Blot was probed with the indicated antibody. Ponceau S was used to normalize loading. (B) Analysis of the time from nuclear envelope breakdown (NEBD) to anaphase (A) onset in H2B-RFP wild-type MEFs infected with KrasG12V or EV by live cell time-lapse imaging. n = 1 line, ≥ 19 cells. Data are mean ± s.d. *p<0.05. M, metaphase (C) In a nocodazole challenge, H2B-RFP wild-type MEFs infected with KrasG12V or EV were treated with 100 ng/ml of nocodazole and monitored by live cell time-lapse imaging. The point of time in which 50% of cells are arrested in mitosis is plotted. n = 1 line, ≥ 20 cells. *p<0.05. (D) Analysis of chromosome misalignments in wild-type MEFs infected with KrasG12V or EV. MEFs were treated with 100 µM monastrol for 1 hr and then with monastrol and 10 µM MG132 for 1 hr and released for 90 min into MG132. n = 1 line, ≈200 cells. *p<0.05. (E) Live-cell imaging of chromosome segregation defects in primary H2B-RFP wild-type MEFs infected with Kras or EV. n = 1 line, ≈40 cells. *p<0.05. (See associated Figure 10—source data 1).
-
Figure 10—source data 1
Source file for mitotic timing, nocodazole challenge, missegregation assay and monastrol washout data.
- https://doi.org/10.7554/eLife.16620.033
Author response image 1
Tables
Table 1
Karyotypes are stable in select BubR1 mutant overexpressing MEFs. Karyotype analysis of passage 5 MEFs of indicated genotype. n ≥ 3 lines, 50 cells per line. Data are mean ± s.d. WT, wild-type. FL, full-length. (See associated Table 1— source data 1).
| Mitotic MEF genotype (n) | Mitotic figures | Aneuploid figures % (s.d) | Karyotype with indicated chromosome number | ||||||||
|---|---|---|---|---|---|---|---|---|---|---|---|
| 36 | 37 | 38 | 39 | 40 | 41 | 42 | 43 | 44 | |||
| WT (5) | 250 | 9 (6) | 1 | 1 | 0 | 5 | 227 | 9 | 7 | 0 | 0 |
| FL-Bub1b (3) | 150 | 10 (3) | 0 | 0 | 1 | 2 | 135 | 7 | 5 | 0 | 0 |
| Bub1bΔI (3) | 150 | 8 (3) | 0 | 0 | 1 | 2 | 138 | 9 | 0 | 0 | 0 |
| Bub1bΔN (5) | 250 | 18 (6)* | 0 | 0 | 2 | 15 | 204 | 23 | 6 | 0 | 0 |
| Bub1bN (3) | 150 | 6 (2) | 0 | 0 | 1 | 3 | 141 | 4 | 1 | 0 | 0 |
-
*p<0.05.
-
Table 1—source data 1
Source file for MEF aneuploidy rate data.
- https://doi.org/10.7554/eLife.16620.006
Table 2
Bub1b transgenic MEFs have normal missegregation rates. Live-cell imaging of chromosome segregation defects in primary H2B-RFP MEFs of indicated genotypes. n ≥ 3 lines, ≥ 20 cells per line. Data are mean ± s.e.m. WT, wild-type. FL, full-length. (See associated Table 2—source data 1).
| MEF genotype (n) | Mitotic cells inspected | Cells with segregation defects | Metaphases with misaligned chromosomes | Anaphases with lagging chromosomes | Anaphases with bridges chromosome |
|---|---|---|---|---|---|
| % (s.e.m) | % (s.e.m) | % (s.e.m) | % (s.e.m) | ||
| WT (3) | 94 | 16 (1) | 0 (0) | 6 (3) | 13 (1) |
| FL-Bub1b (3) | 105 | 17 (2) | 3 (3) | 3 (2) | 11 (2) |
| Bub1bΔI (3) | 105 | 12 (1) | 1 (1) | 1 (1) | 10 (1) |
| Bub1bΔN (3) | 101 | 19 (1) | 1 (1) | 7 (1) | 11 (2) |
| Bub1bN (3) | 95 | 17 (6) | 3 (2) | 2 (2) | 12 (6) |
-
Table 2—source data 1
Source file for missegregation assay data.
- https://doi.org/10.7554/eLife.16620.008
Table 3
Bub1b transgenic mice have normal rates of aneuploidy in vivo. Interphase FISH on specified tissues from mice of indicated genotypes. n = 3 animals, 100 cells per tissue per animal. Data are mean ± s.d. WT, wild-type. FL, full-length. (See associated Table 3—source data 1).
| Percentage of aneuploidy (s.d) | |||
|---|---|---|---|
| Tissue Type | Genotype | Chrom 4 | Chrom 7 |
| Lung | WT | 1.3 (0.6) | 3.0 (0) |
| FL-Bub1b | 2.3 (0.6) | 2.0 (1) | |
| Bub1bΔI | 2.0 (0) | 2.3 (0.6) | |
| Bub1bΔN | 3.0 (1) | 2.3 (0.6) | |
| Bub1bN | 2.3 (0.6) | 2.3 (0.6) | |
| Heart | WT | 2.0 (1) | 1.7 (0.6) |
| FL-Bub1b | 1.3 (0.6) | 2.0 (1) | |
| Bub1bΔI | 1.3 (0.6) | 2.0 (0) | |
| Bub1bΔN | 1.7 (1.2) | 2.0 (1) | |
| Bub1bN | 1.3 (0.6) | 1.7 (0.6) | |
| Eye | WT | 2.0 (0) | 2.0 (1) |
| FL-Bub1b | 2.0 (0) | 2.3 (0.6) | |
| Bub1bΔI | 1.7 (0.6) | 1.3 (0.6) | |
| Bub1bΔN | 2.0 (1) | 2.3 (0.6) | |
| Bub1bN | 1.7 (0.6) | 2.0 (0) | |
| Kidney | WT | 2.0 (1) | 2.0 (1) |
| FL-Bub1b | 2.3 (0.6) | 2.0 (0) | |
| Bub1bΔI | 2.0 (1) | 1.3 (0.6) | |
| Bub1bΔN | 2.7 (0.6) | 2.0 (0) | |
| Bub1bN | 2.0 (1) | 1.3 (0.6) | |
| Spleen | WT | 3.3 (0.6) | 2.3 (1.2) |
| FL-Bub1b | 3.0 (1) | 2.0 (1) | |
| Bub1bΔI | 2.0 (1) | 1.7 (0.6) | |
| Bub1bΔN | 3.0 (1) | 2.7 (0.6) | |
| Bub1bN | 2.7 (0.6) | 3.0 (0) | |
| Skeletal muscle | WT | 2.3 (0.6) | 2.6 (0.6) |
| FL-Bub1b | 2.7 (0.6) | 2.0 (0) | |
| Bub1bΔI | 2.0 (0) | 2.0 (1) | |
| Bub1bΔN | 2.3 (1.2) | 2.7 (0.6) | |
| Bub1bN | 2.0 (0) | 2.3 (0.6) | |
-
Table 3—source data 1
Source file for tissue aneuploidy rate data.
- https://doi.org/10.7554/eLife.16620.010
Download links
A two-part list of links to download the article, or parts of the article, in various formats.
Downloads (link to download the article as PDF)
Open citations (links to open the citations from this article in various online reference manager services)
Cite this article (links to download the citations from this article in formats compatible with various reference manager tools)
BubR1 alterations that reinforce mitotic surveillance act against aneuploidy and cancer
eLife 5:e16620.
https://doi.org/10.7554/eLife.16620


