The right hippocampus leads the bilateral integration of gamma-parsed lateralized information
- Cajal Institute – CSIC, Spain
- N.I. Lobachevsky State University of Nizhny Novgorod, Russia
- Universidad Complutense de Madrid, Spain
Figures
Figure 1 with 1 supplement
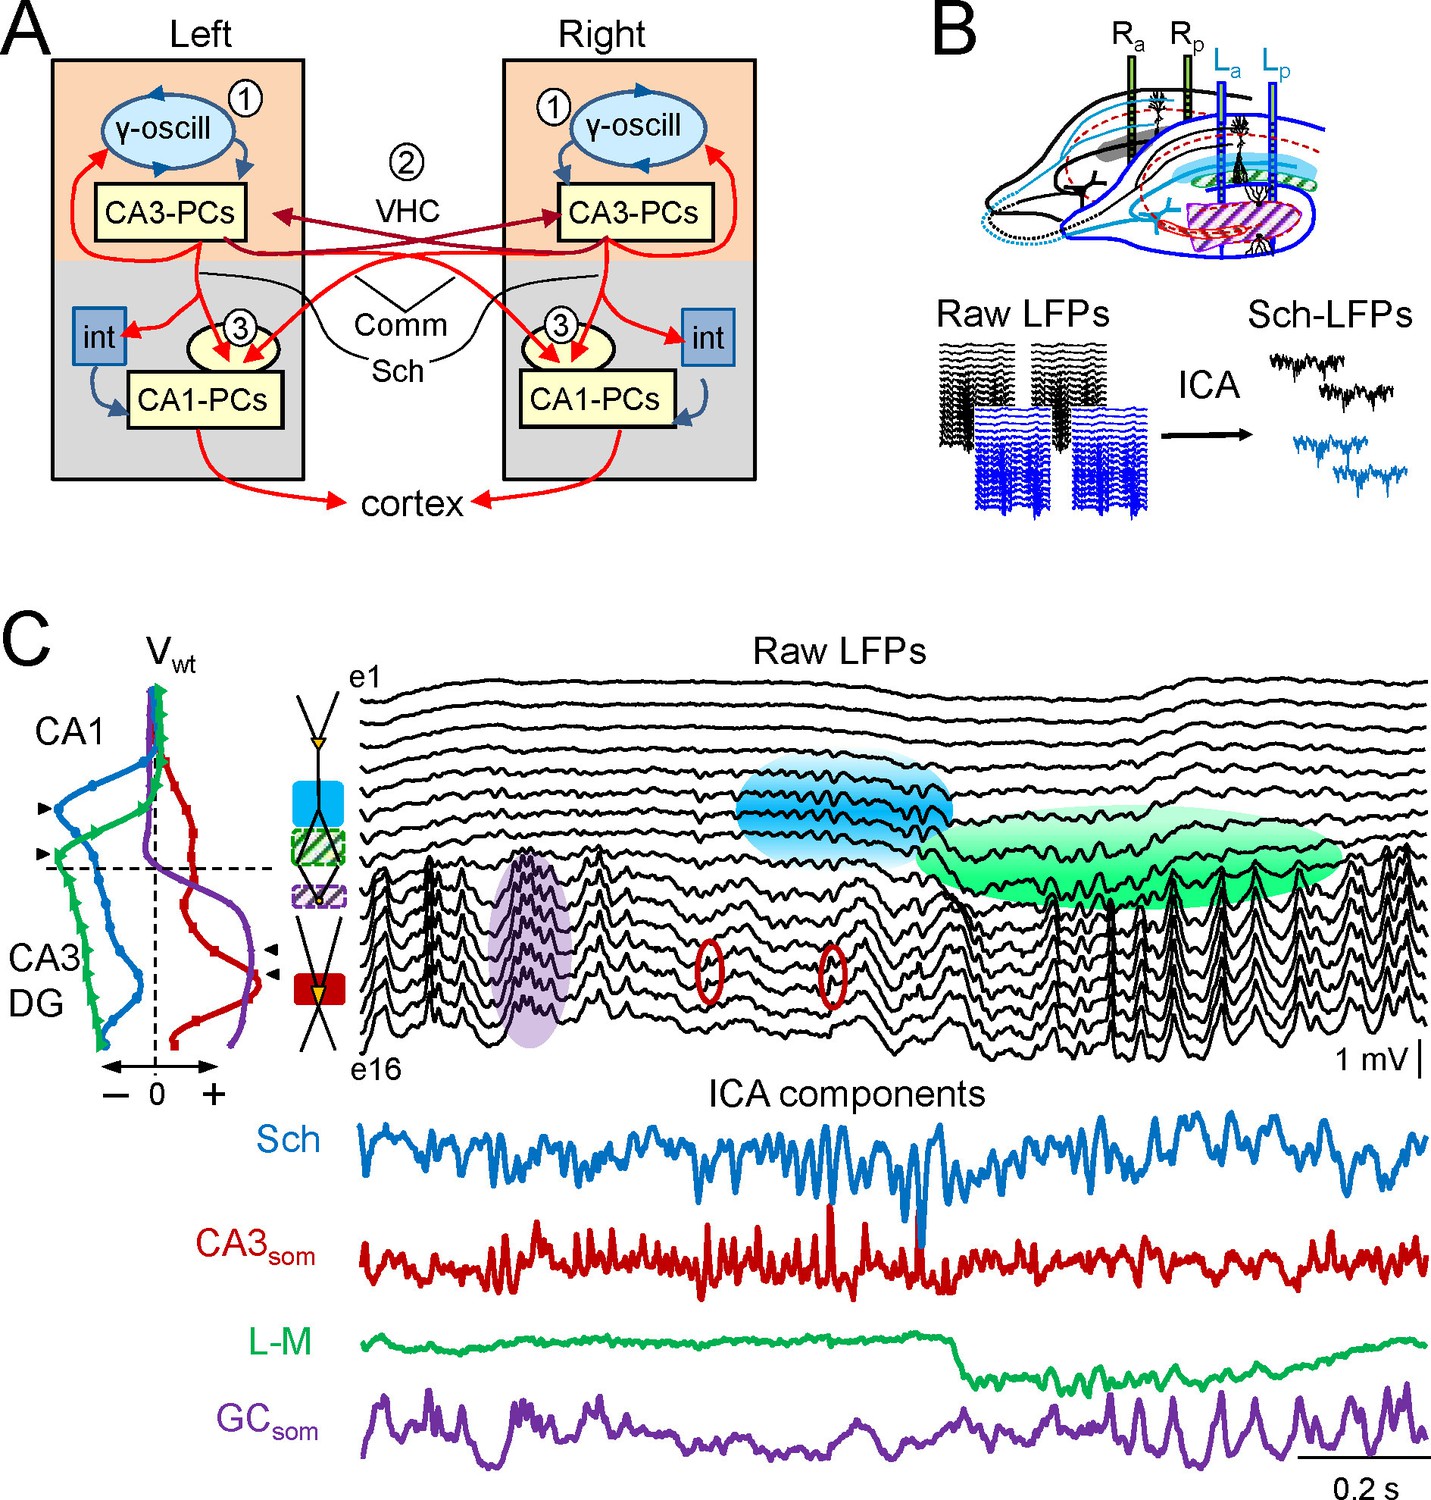
Experimental paradigm and clean out of the Schaffer and CA3som activities.
(A) Functional characteristics of the bilateral CA3→CA1 segment: (1) an intrinsic gamma oscillator fueled by inhibition in each CA3 region produces gamma output from PCs; (2) The left and right CA3-PCs are interconnected through the ventral hippocampal commissure (VHC, maroon arrows), enabling the coupling of CA3 gamma oscillators; (3) The excitatory outputs of CA3-PCs from both sides converge in each CA1 (Schaffer and Commissural pathways). (B) Experimental setup. Two-shank linear arrays were located at homotopic sites of the dorsal left and right hippocampi. Recordings were acquired simultaneously and each group was analyzed separately by an Independent Component Analysis (ICA). (C) ICA of a sample epoch across the CA1 and CA3/DG layers. In raw LFPs (black traces), several bands of coherent voltage fluctuations are observed that indicate multiple activation in different synaptic territories (three are outlined by filled ovals spanning the CA1 and the Dentate subfields, while small maroon ovals mark activity in the st. pyramidale of the CA3). The ICA returns the spatially-coherent components and provides readout of the temporal dynamics free of a contribution by the others. A set of components or LFP-generators was obtained per shank, each with a characteristic spatial distribution or voltage weight (Vwt) that enabled matching between shanks. Details of the extraction are in Figure 1—figure supplement 1. Colored traces from top to bottom: Schaffer (cyan), CA3som (maroon), lacunosum-moleculare (green), and GCsom (purple). The amplitudes are normalized (0.37:0.25:0.84:1). In other figures voltage units are employed that were estimated for the sites with maximum power (triangles in Vwt plots).
Figure 1—figure supplement 1

Details of the extraction and ICA performance.
To illustrate the performance of the ICA, we chose sample epochs in which two nearby sources produce rhythmic LFP waves of similar duration that makes the respective time courses hardly recognizable by the naked eye: Black, LFPs; color, ICA components. (A) Mixed contributions by the Schaffer (cyan) and lacunosum-moleculare (l-m) components (green). A phase mismatch of LFP waves recorded in contiguous sites (vertical lines) indicates pathway co-activation (recall that a single pathway produces proportional LFPs in all sites). The differences between time courses of LFP and ICA waves denote the net volume-conducted contribution that each pathway entered on the other’s site: this is removed by the ICA (bicolor arrows). (B) Example of LFPs in the CA3/Dentate Hilus containing CA3som waves and DG-contributed potentials. Only the first CA3som wave, a, is visible as it does not coincide with any other, but the waves b and c overlap in space and time with Hilar waves. The respective spatial distributions are however different. Hilar waves are nearly identical in all recording sites and hence, deviations from the time course in some sites indicate the presence of additional sources. CA3som wave b occurs at a negative hilar deflection (arrowheads: the difference of LFP and the dashed time courses mark the site-specific contribution of the CA3som wave), while wave c does so on a positive-going hilar wave, modifying the slope of LFPs at CA3som specific sites.
Figure 2 with 3 supplements
Functional asymmetry in the bilateral CA3-CA1 system.
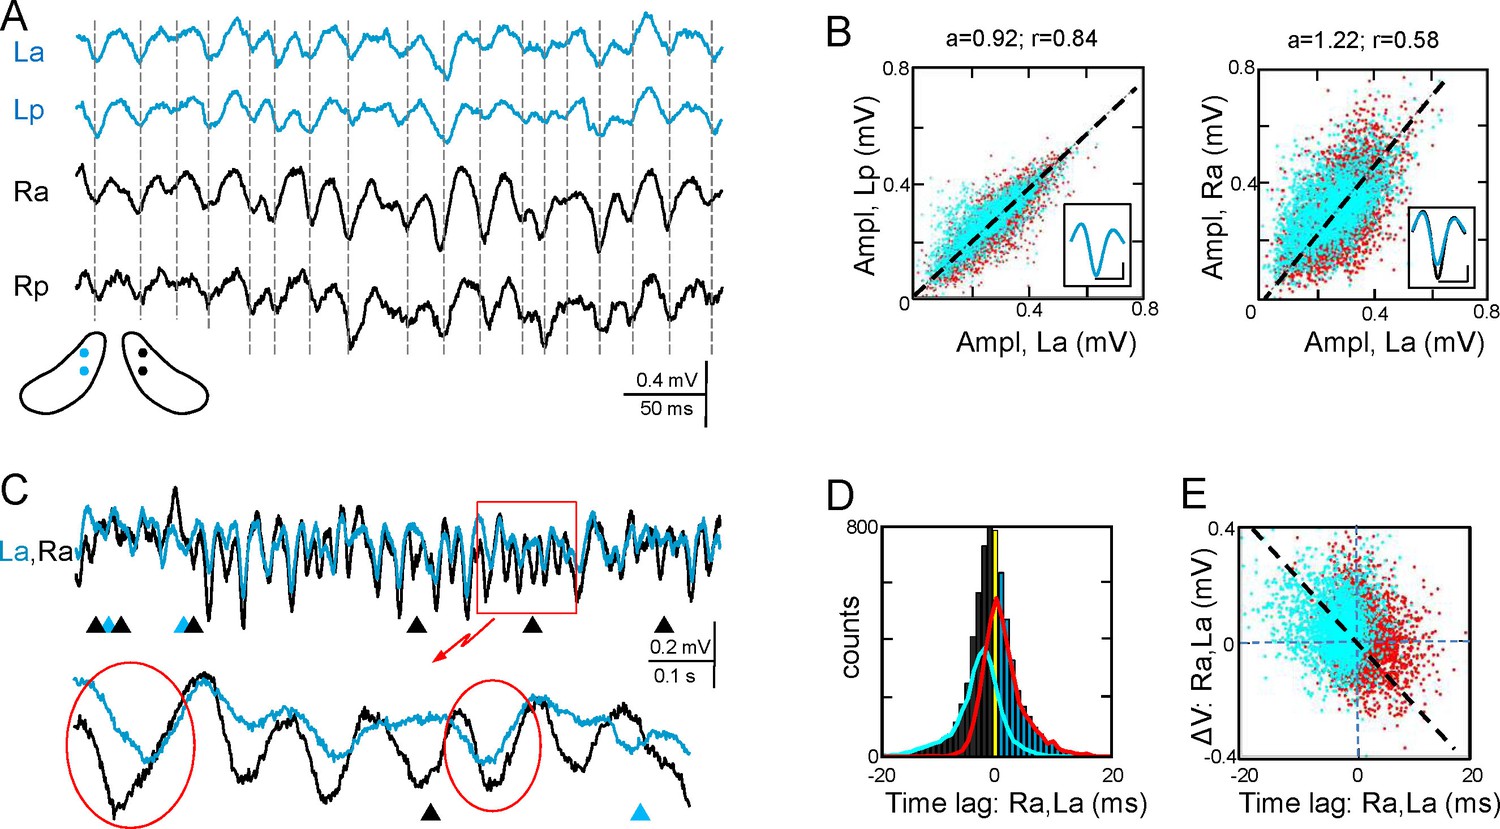
(A) Sample string of Schaffer-gamma obtained from four sites. Individual waves coincide regardless of their amplitude. Globally, Schaffer-gamma is larger on the right side. The scheme shows the location of recordings from a coronal view (Figure 2—figure supplement 1). (B–E) Representative experiment showing the features of individual waves compared pairwise within (La,Lp) and between hippocampi (La,Ra) (n = 6623 pairs of waves in 167 s). The blue and red dots belong to the pairs when L or R waves were longer, respectively. The population statistics and additional examples are in Figure 2—figure supplements 2–3. (B) Waves co-vary closely in the same side (left) and much less so between sides (right): a, best fit tangent; r, correlation coefficient. The insets show superimposed averaged waves (cal: 20 ms and 100 μV). (C) A string of Schaffer gamma shows unilateral waves in both sides (triangles). In paired bilateral waves, either side may lead (ovals). (D) Bilateral synchronization was measured from the start of the waves (time lag). The positive and negative values indicate that L or R waves led, respectively. R waves preceded more often (black bars), the bilateral lag being larger when R-waves were longer (line subplot in blue). (E) The amplitude difference between paired waves in the right and left sides is plotted against their time lag. Larger waves on any side had a tendency to lead.
-
Figure 2—source data 1
Spreadsheet containing measurements of the LFP generators and extracted waves for each experiment.
Data are presented as the mean and s.e.m. for: cross- correlation index and τmax, amplitude and duration of extracted Schaffer and CA3som gamma waves, total number of paired waves (ipsilateral and bilateral), percentage of unilateral waves, covariation of amplitude and duration of bilateral waves, lag between start time of bilateral waves or ipsilateral paired waves, lags between paired waves in subgroups of longer waves in L, R, anterior or posterior sites, cross-correlation between Schaffer and CA3som waves, and the covariation index of amplitude and duration.
The data pertain to Figures 2, Figure 2—figure supplement 2, Figure 4, and Figure 4—figure supplement 1.
- https://doi.org/10.7554/eLife.16658.006
-
Figure 2—source data 2
Schaffer LFP generators and extracted waves for the experiments used in Figures 2 and 4.
- https://doi.org/10.7554/eLife.16658.007
Figure 2—figure supplement 1
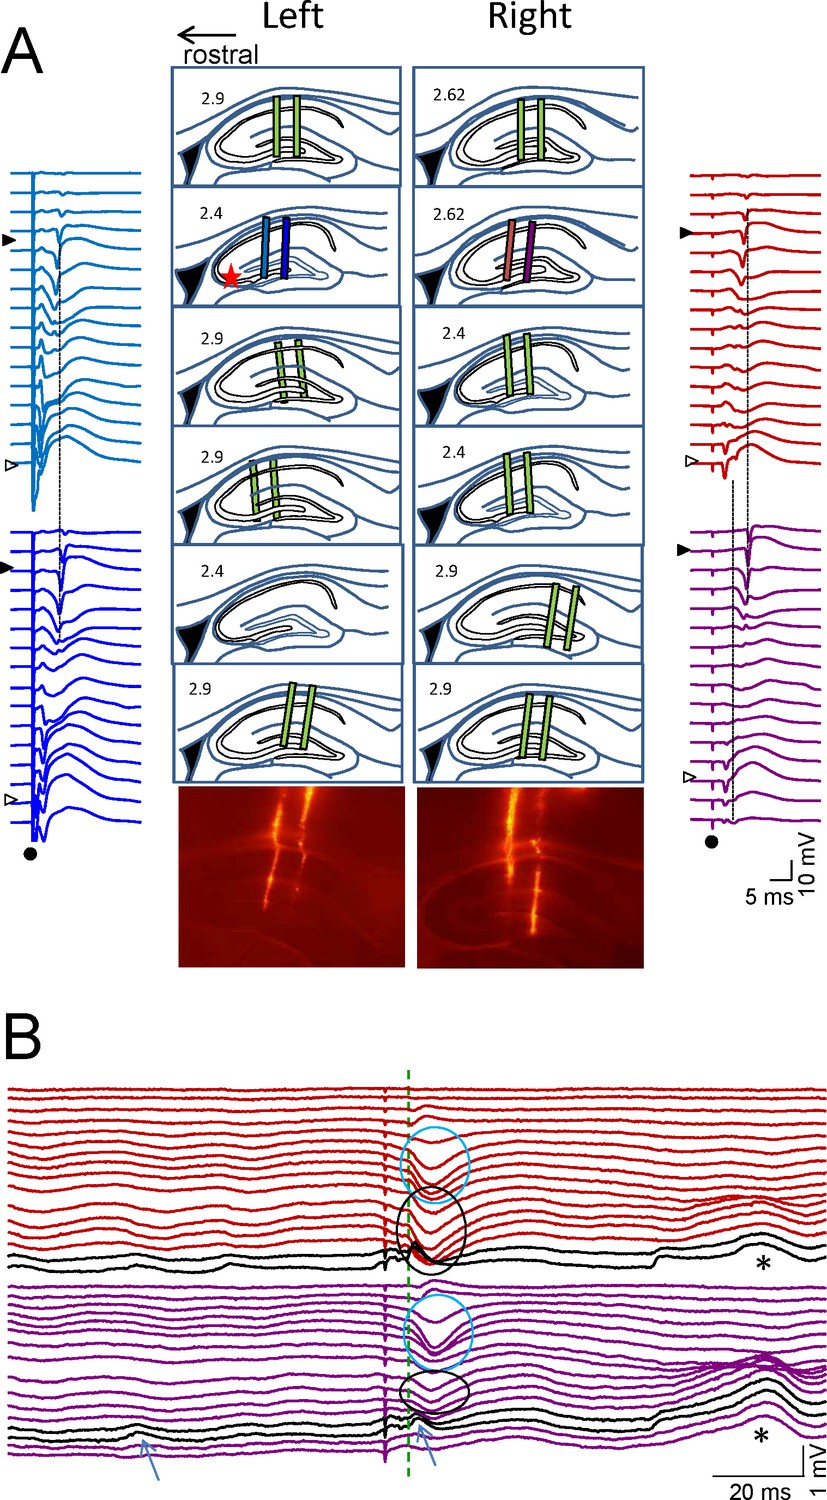
Histological and electrophysiological localization of recording sites.
(A) The location of recording sites was reconstructed from histological sections in six animals. The tracks left by the twin-shank linear probes were recognized by DiI marks in the tissue (pictures of one illustrative experiment are shown below), and drawn on sagittal representations of the rat hippocampus taken from the atlas of Paxinos and Watson. The indicated lateral coordinate is only an approximation to actual site. The extent of recordings across the CA1 and CA3/Dentate subfields (colored bars) has been scaled and adjusted by the location of cell body layers in the CA1 and CA3 using the characteristic evoked potentials recorded simultaneously from all four shanks (star: stimulus in the left CA3b soma layer). The st. pyramidal of the CA1 and CA3 are marked by filled and open triangles, respectively. Dots mark the stimulus artefact. (B) An epoch containing spontaneous LFPs and an evoked potential (color code indicates the recording sites in A). The black traces belong to the CA3 soma layer where CA3som waves appear (arrows). Cyan ovals mark the Schaffer potentials in the CA1 st. radiatum (note that stimulation in the left CA3 also activates Schaffer fibers in the right-hand side through antidromic firing of the CA3). Black ovals mark recurrent excitatory waves in the st. radiatum of the CA3. Note also the correspondence of amplitude differences of equivalent waves originated in different subfields to recording sites: closer to the CA3 (CA3som and st. radiatum CA3 waves) or to the DG (asterisks).
Figure 2—figure supplement 2

Additional data and population statistics for the comparison of intra and interhippocampal CA3→CA1 Schaffer activity.
(A) Intra (upper row) and interhippocampal (lower row) wide band spectral coherences between Schaffer-LFPs. Δt is the length of the epoch analyzed. SPWs were excluded manually to avoid adding an excessive weight of slow frequencies to the analysis. Blue areas correspond to statistically significant coherences (gray areas mark the level of statistical significance; surrogate test, n=1000). Interhippocampal Schaffer coherence was lower in all animals and centered in 40–45 Hz gamma frequency (arrows). (B,C) Population statistics for the comparisons as in the representative experiment shown in Figure 1B and D of the main text. (B) Cross-correlation coefficient (CC) for the co-variance of amplitude between the paired waves in all seven experiments. The diagonal red line marks equal CC for intra than interhippocampal comparisons. All values lie below the diagonal, indicating a lower CC between L and R homotopic sites compared to the intrahippocampal sites. In a t-test of the data all values were significant (p<0.001) except one (blue square, p<0.05). (C) Population statistics for the lag between the paired waves in the two hippocampal hemispheres (La,Ra). Negative values indicate that waves in the R led to L. Black symbols stand for all pairs, while the blue and red symbols belong to the pair subclasses when R or L led, respectively. The mean confidence intervals at α = 0.01 are shown.
Figure 2—figure supplement 3
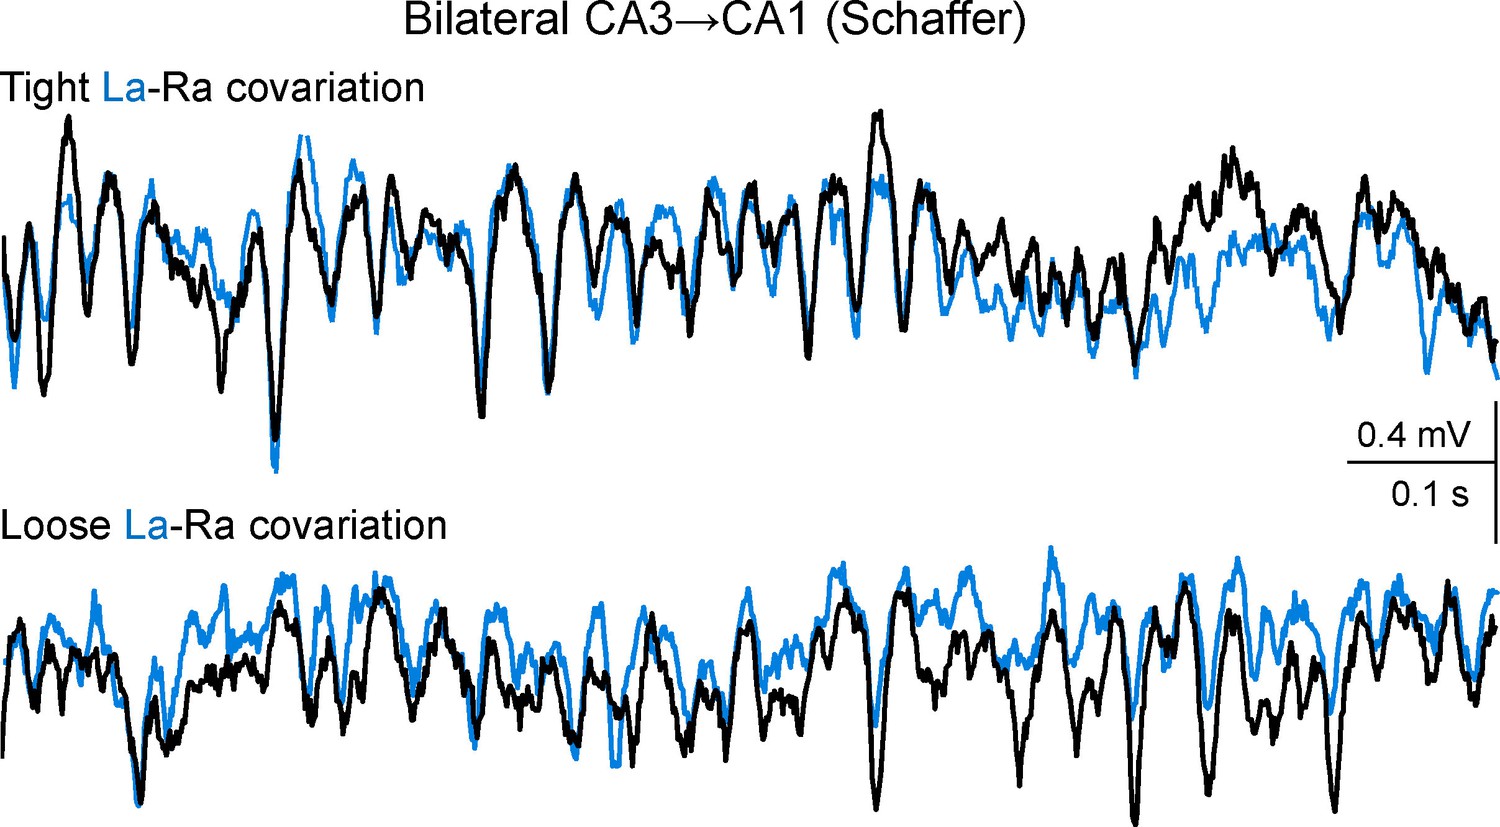
Additional sample traces of Schaffer activity simultaneously obtained from CA1 homotopic sites.
R and L traces are depicted in black and cyan, respectively. The upper and lower fragments correspond to 1 s epochs (taken 2 s apart) of tight and loose bilateral co-variation, respectively. Note the coarse (slow waves/groups of gamma waves) and the fine (individual gamma waves) bilateral amplitude co-variation of the gamma oscillations in the upper traces, and the frequent mismatch of amplitude in paired (bilateral) waves in the lower traces, which however maintained tight L-R synchrony. Such epochs of tight and loose co-variation were intermingled and occurred unpredictably. Since individual Schaffer gamma waves reflect the size and firing synchronization of CA3 pyramidal cells forming a functional assembly, tight bilateral covariation indicates a sequence of CA3 assemblies that are parallel in both hemispheres of the hippocampus, while loose bilateral co-variation indicates lateralized strings of CA3 assemblies that notwithstanding, beat at a similar pace.
Figure 3
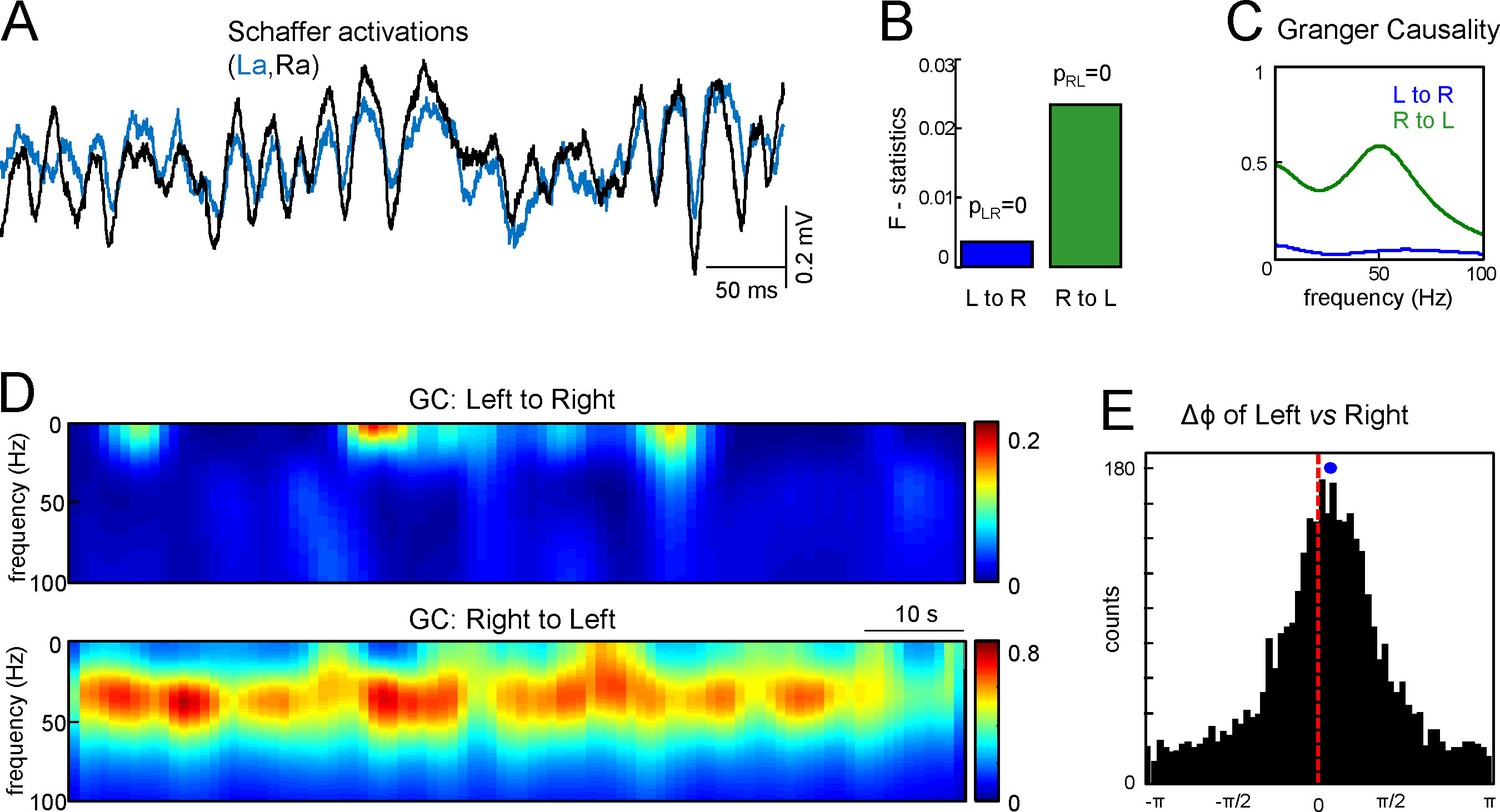
Assessment of functional asymmetry with Granger causality and phase relations.
(A) A short epoch of activations of the right and left Schaffer pathways. (B) F-statistics for Granger Causality (GC) test revealing significant reciprocal influence from R to L and from L to R sides. (C) Frequency dependence of GC. R to L relation exhibits a peak at gamma frequency. (D) Time-frequency display of the GC index. R to L relationship is stronger and more persistent. (E) Distribution of phases in the L side with onsets related to zero phases in the R side, i.e., when field events begin. The mean phase lag of 0.22 rad (corresponding to 0.95 ms time lag) is highly significant. The population data is indicated in the text.
Figure 4 with 1 supplement
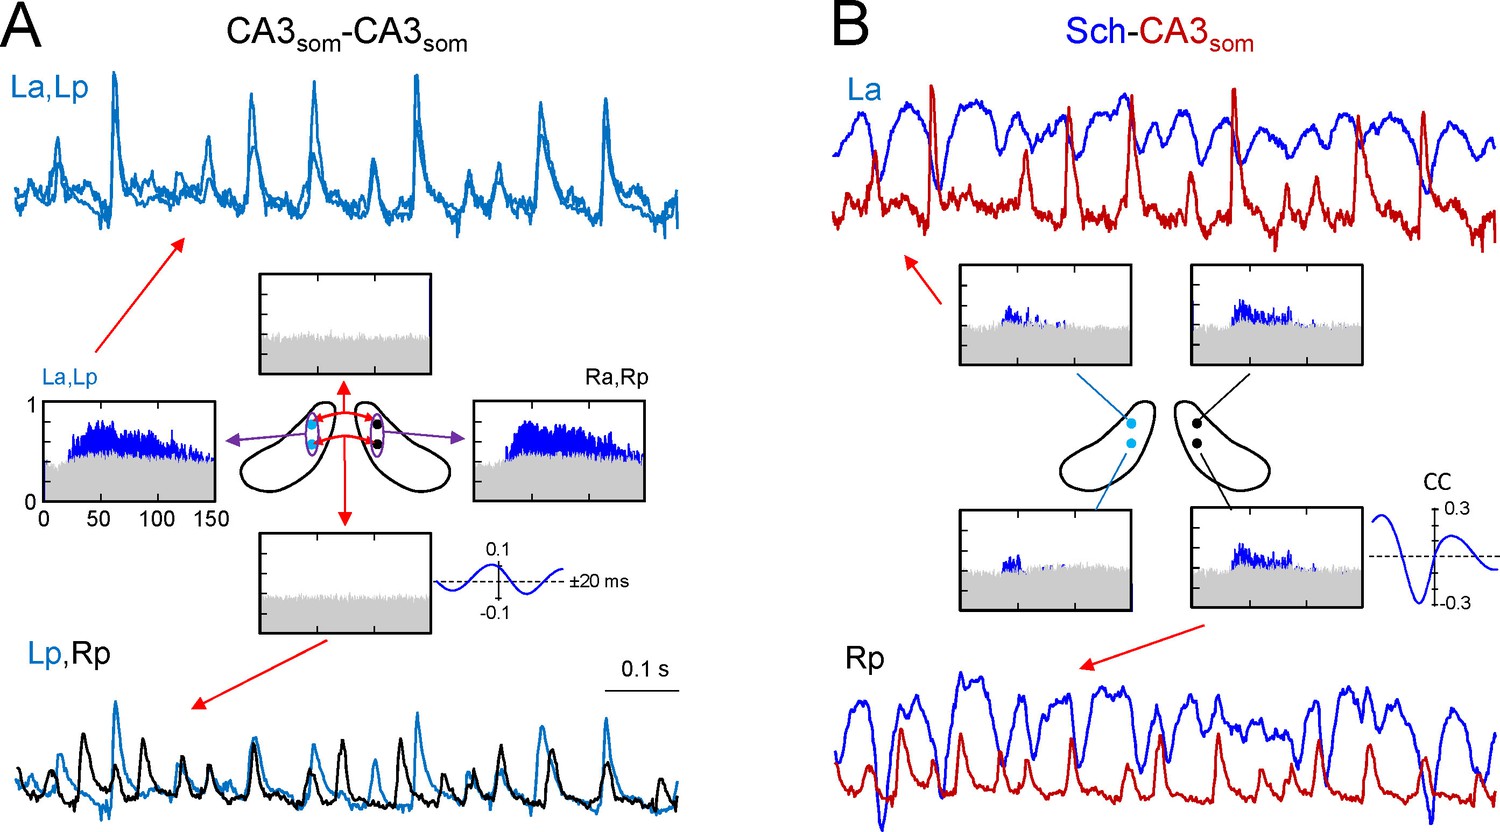
CA3som gamma activity has weak bilateral coherence but is coupled to ipsilateral Schaffer.
(A) Comparison of CA3som activities between pairs of sites. The histograms of spectral coherence only show significant values (blue) for ipsilateral comparisons. The sample traces show tight matching in superimposed activities at a-p sites (upper traces) and frequent mismatch in bilateral comparisons in the same epoch (lower traces). Cyan and black traces correspond to the left and right sides. (B) Comparisons between Schaffer and CA3som activities (blue and maroon traces, respectively). The spectral coherence showed significant values only at gamma frequency at all four sites. Sample traces show strong wave-to-wave coupling despite the poor amplitude covariation. The CC was strong and showed a marked left-shift that mostly originates from the different waveform of individual waves. All data were taken from the same animal (see population statistics in the text, and additional analyses in Figure 4—figure supplement 1).
Figure 4—figure supplement 1
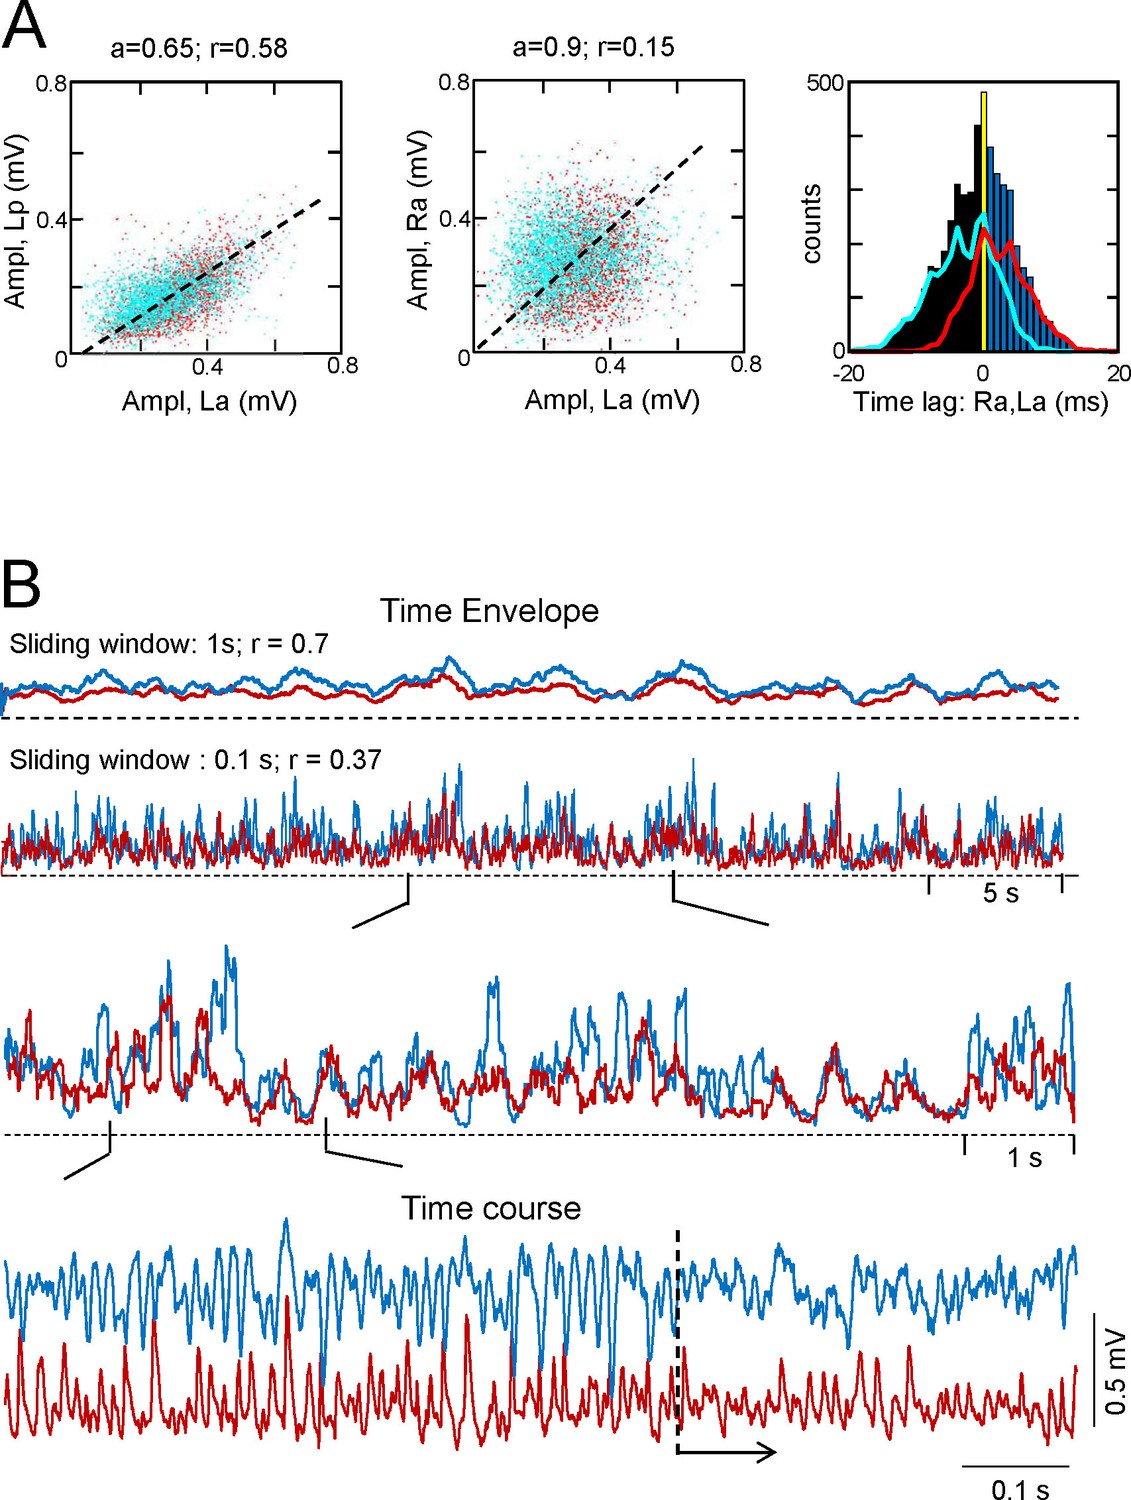
Additional features of the CA3som activity and waves.
(A) Statistics of extracted bilateral CA3som waves from a representative experiment. Waves co-vary closely in the same side (left panel) and much less so between sides (middle panel): a, best fit tangent; r, correlation coefficient. The panel on the right shows the quantification of time lags between bilateral paired waves. Same color coding as in Figure 2. See population statistics in the text. (B) Correlation between Schaffer and CA3som activities at the same site shows distinct dynamics over different time scales. The upper pairs of superimposed plots represents the time envelope of Schaffer (cyan) and CA3som activities (maroon) calculated with a different sliding windows (1 or 0.1 s). A notable reduction in the CC for the smaller time scale denotes mismatch of the convolved waves, as noted in the successive enlargements shown below. The lower sample traces show a more regular succession of the CA3som (maroon) activity: although smaller, the CA3som waves continue to appear when Schaffer waves (cyan) disorganize (from dashed line).
Figure 5 with 2 supplements
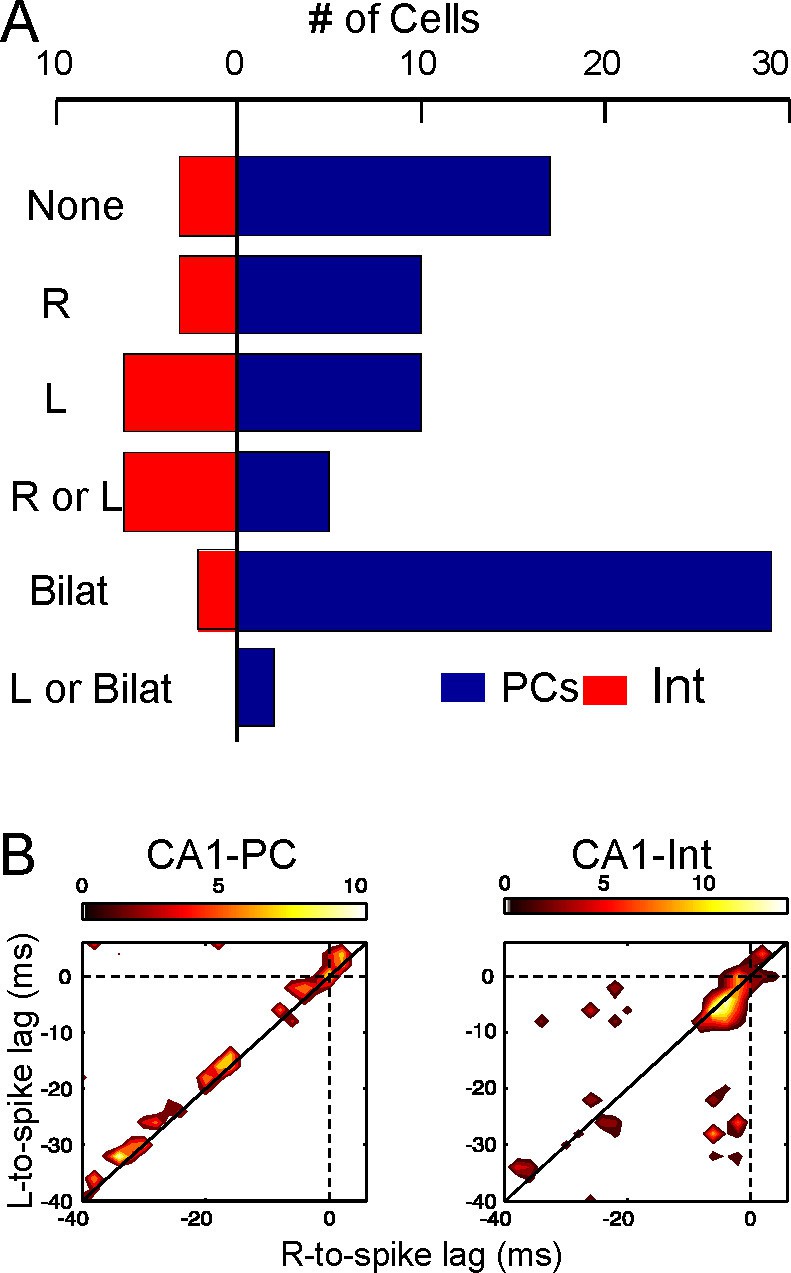
Left-Right synchrony of Schaffer gamma waves drives firing of CA1 PCs and putative interneurons distinctly.
(A) Spike trains were correlated to the activity of the Schaffer generators in both sides, and the spikes were associated to unilateral (only R, only L, R or L groups) or bilateral (i.e. synchronous) gamma waves, or to none. Only statistically significant cells are represented. PCs fired preferentially upon convergence of bilateral gamma waves, while putative interneurons showed a marked unilateral drive. (B) Firing of representative cells in function of when the gamma waves started in the L and R sites (additional data in Figure 5—figure supplement 1). Spikes were sorted that occurred within 40 ms of the beginning of a gamma wave in both sides (paired waves). The spike occurs at (0,0), while the X and Y axes represent the start time of the R and L gamma waves, respectively. The calibration bar indicates the firing density upon removal of chance firing. Most firings approach the diagonal as a result of tight bilateral gamma coupling. However, PCs fired at varying cell-specific intervals, while firing of putative interneurons was phase-locked with a short lag from the start of the excitatory gamma waves. The relation of spike firing to LFP power is shown in Figure 5—figure supplement 2.
-
Figure 5—source data 1
Spreadsheet containing the unitary results for the bilateral/unilateral test performed on CA1 units in Figure 5A.
- https://doi.org/10.7554/eLife.16658.015
-
Figure 5—source data 2
Analysis of CA1 units in relation to the occurrence of gamma waves (co-modulograms).
The data pertain to Figure 5B and Figure 5—figure supplement 2.
- https://doi.org/10.7554/eLife.16658.016
Figure 5—figure supplement 1
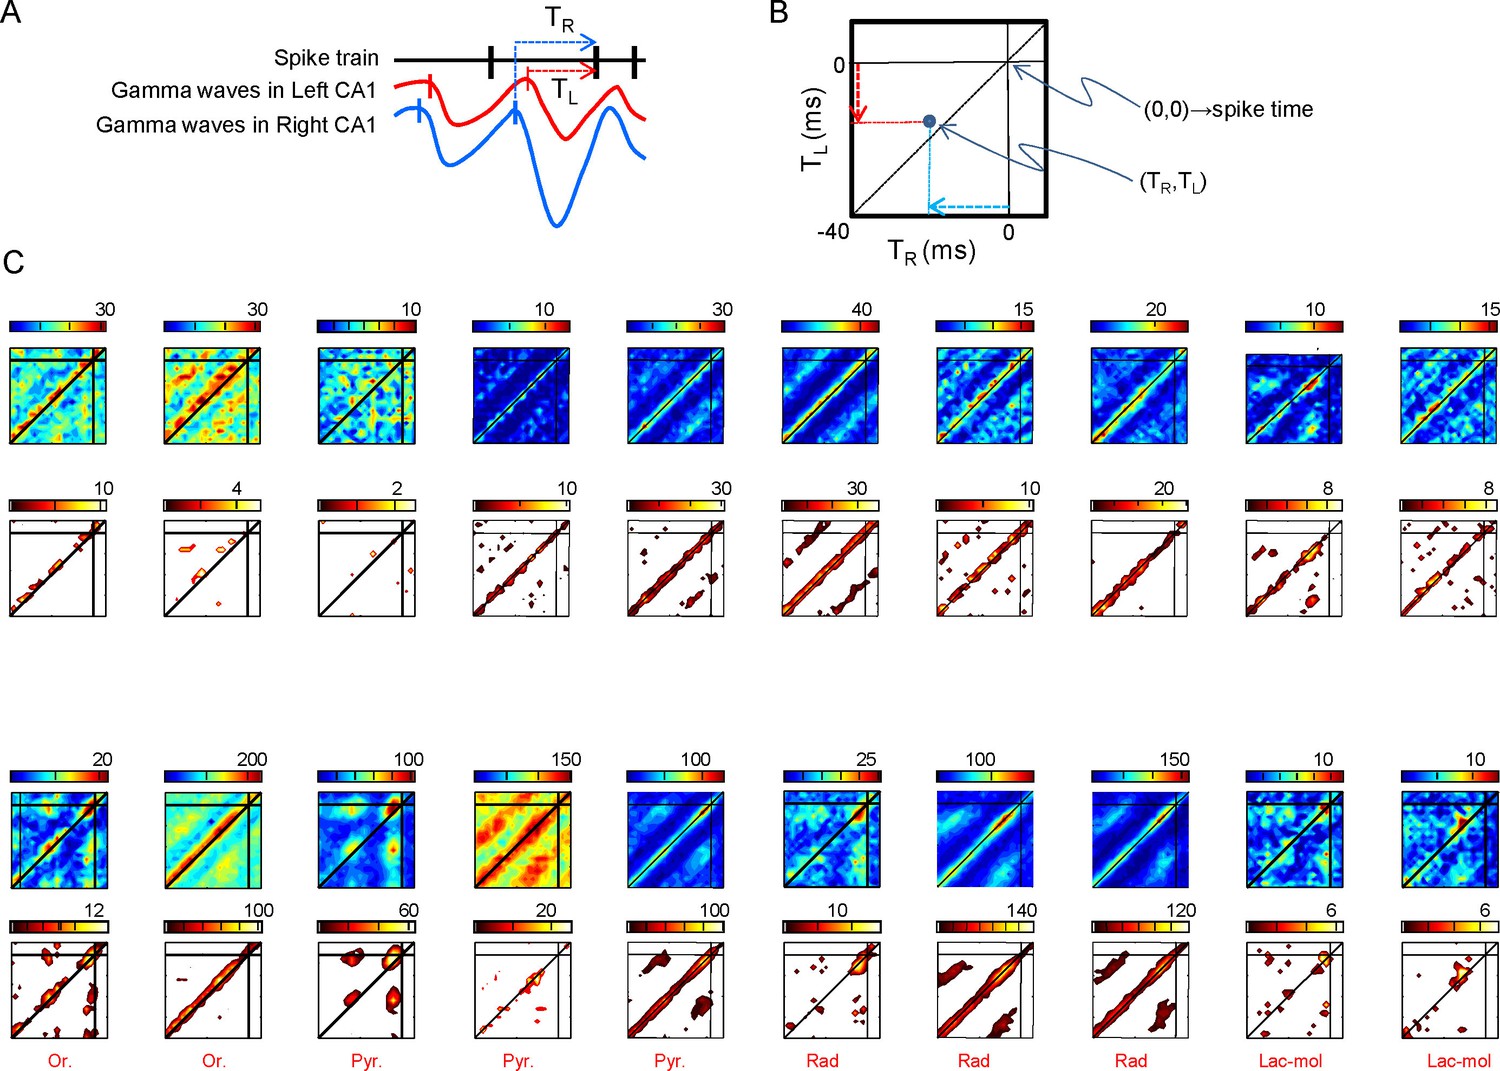
Relation of spike firing to bilateral gamma waves (additional data).
(A) Measurement of the temporal relation between the spike firing and start of excitatory gamma waves. (B) The time lag from the start of the waves in both sides is plotted as X-Y counts in time-to-time-density histograms (firing comodulograms). The spike time occurs at (0,0), and the X and Y axes mark the start time of the R and L gamma waves, respectively. The plotted time interval is (−40,+5) ms in both axes. (C) Additional examples of firing comodulograms as in Figure 2B of the main text. The two upper rows correspond to 10 different PCs and the two lower rows to 10 interneurons recorded in the CA1 strata indicated below. In the upper row of plots, from blue to red color indicate the raw spike density, whereas in the lower plots the color from black to yellow corresponds to statistically significant spike density. For PCs, a total of 1500 s were analyzed. Only for graphing purposes, the epoch was shortened discretionarily for some interneurons in order to avoid excessive filling and maintain visual discrimination.
Figure 5—figure supplement 2
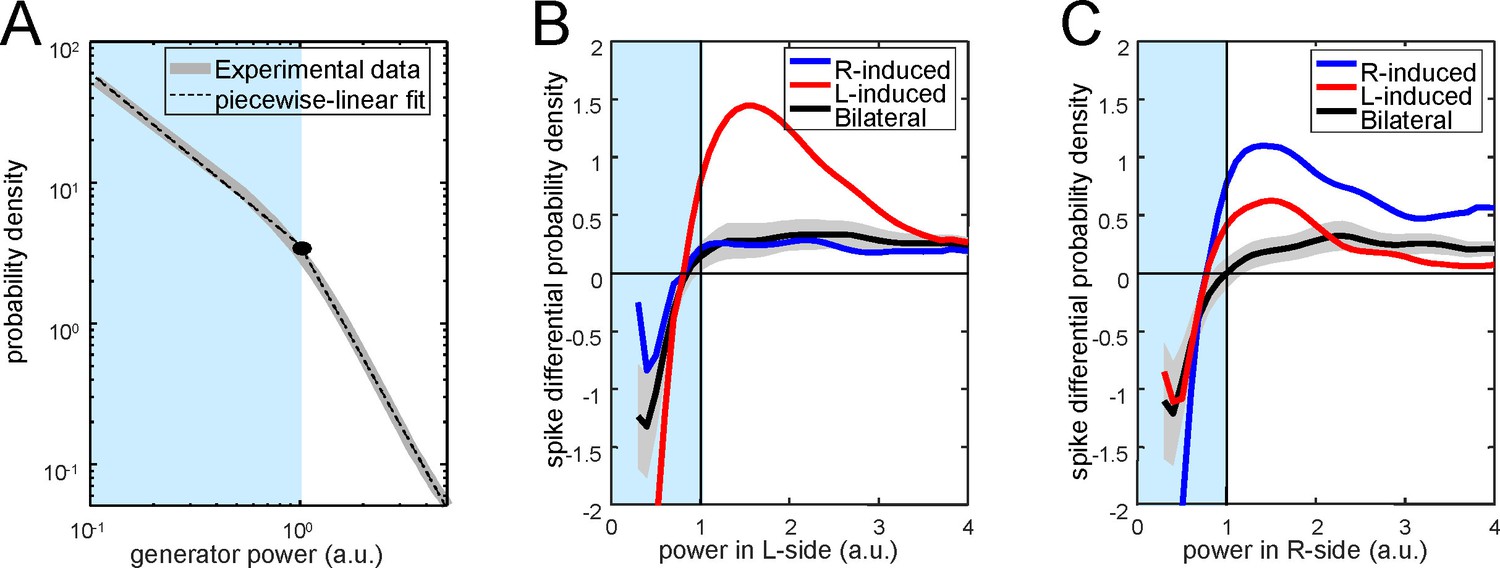
Distribution of PC firing induced by bi- or unilateral gamma waves over the power of the Schaffer activity.
(A) Distribution of the Schaffer power (gray curve) and its piecewise-linear fit (dashed curve). The distribution can be separated into two regions with different power laws. (B) Differential probability of PC spikes of different origin versus the instantaneous power in the left (left subplot) and right (right subplot) Schaffer generators. Red, blue and black curves correspond to spikes induced by R, L and bilateral waves, respectively. Gray areas mark the confidence intervals for bilateral spikes (α = 0.05).
Figure 6 with 2 supplements
Disruption of the VHC uncouples CA3 gamma oscillators.
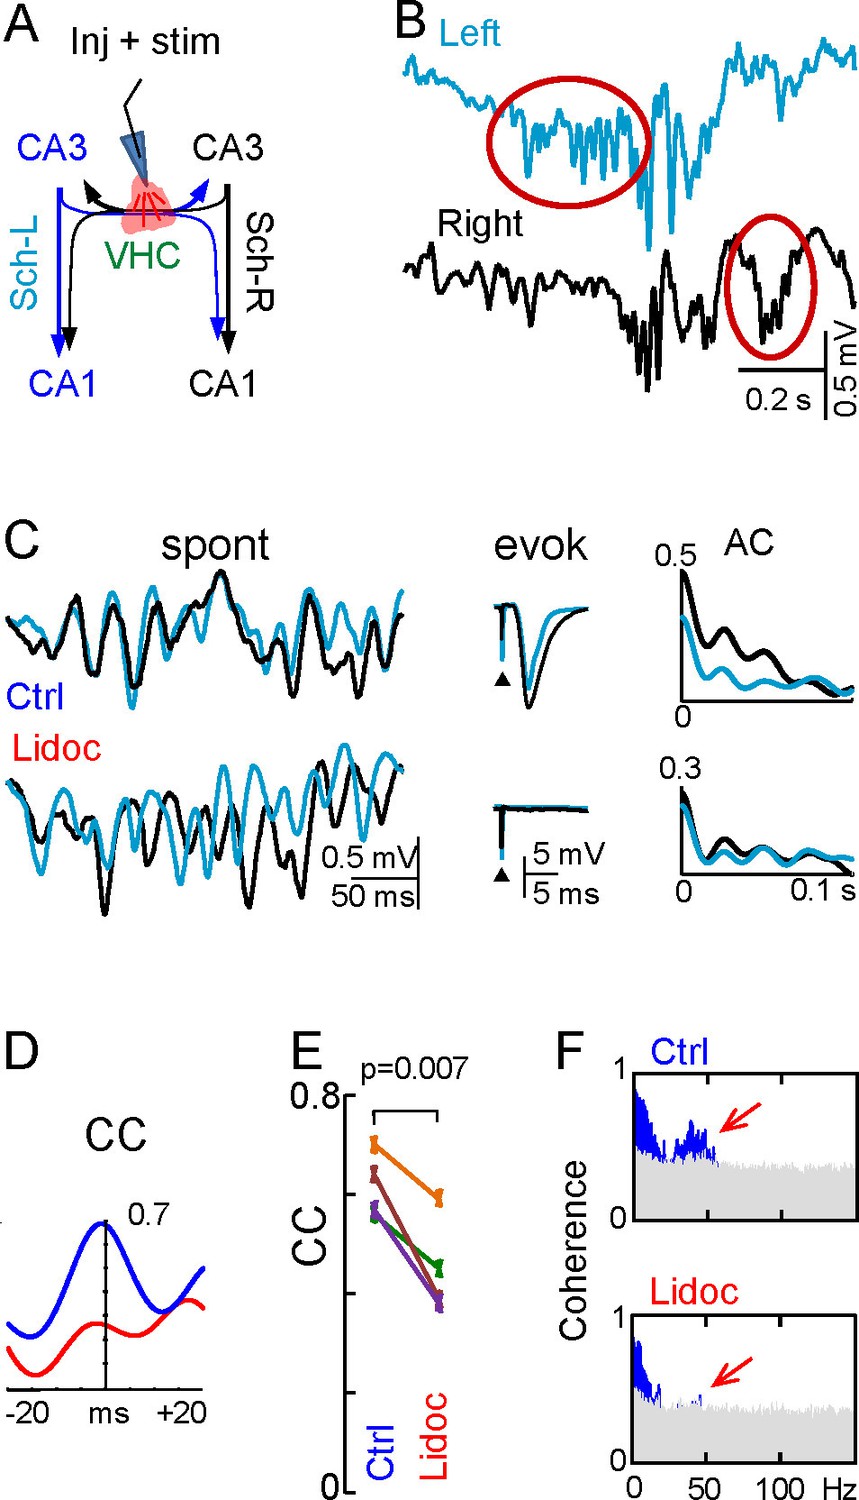
(A) Experimental setup: lidocaine was injected through a pipette into the VHC, which also served to deliver electric pulses; (B) Gamma strings may appear on only one side after lidocaine injection (ovals) (additional examples in Figure 6—figure supplement 1). (C) Lidocaine in the VHC modifies L-R gamma synchronization without altering the gamma power on each side (see Figure 6—figure supplement 1). Note the tight co-variation and L-R phase synchronization of individual gamma waves in the controls, and their outphasing after lidocaine (left tracings). Evoked fEPSPs on both sides were fully blocked after lidocaine microinjection. The autocorrelation (AC) of the Schaffer activity showed oscillatory gamma waves on both sides, with a similar power before and after lidocaine administration, whilst the cross-correlogram (CC) was drastically reduced (D). (E) The CC between L and R Schaffer activities reduces significantly (n = 4 experiments; t test). (F) L-R spectral coherence before and after lidocaine injection. Note the disappearance of significant bars (in blue) in the gamma band (40 Hz) after lidocaine (arrows). The effects of unilateral CA3 blockade on unit firing are in Figure 6—figure supplement 2.
-
Figure 6—source data 1
Effect of disruption of the VHC by lidocaine on the features of gamma waes.
The zip file contains the quantification of gamma power and the amplitude and duration of gamma waves before and after lidocaine in the VHC (VHC lidocaine.xlsx), and the spectral coherences between left and right sides (coherences.ppt).
Data pertain to Figure 6.
- https://doi.org/10.7554/eLife.16658.020
Figure 6—figure supplement 1
Uncoupling of CA3 gamma oscillators (additional data).
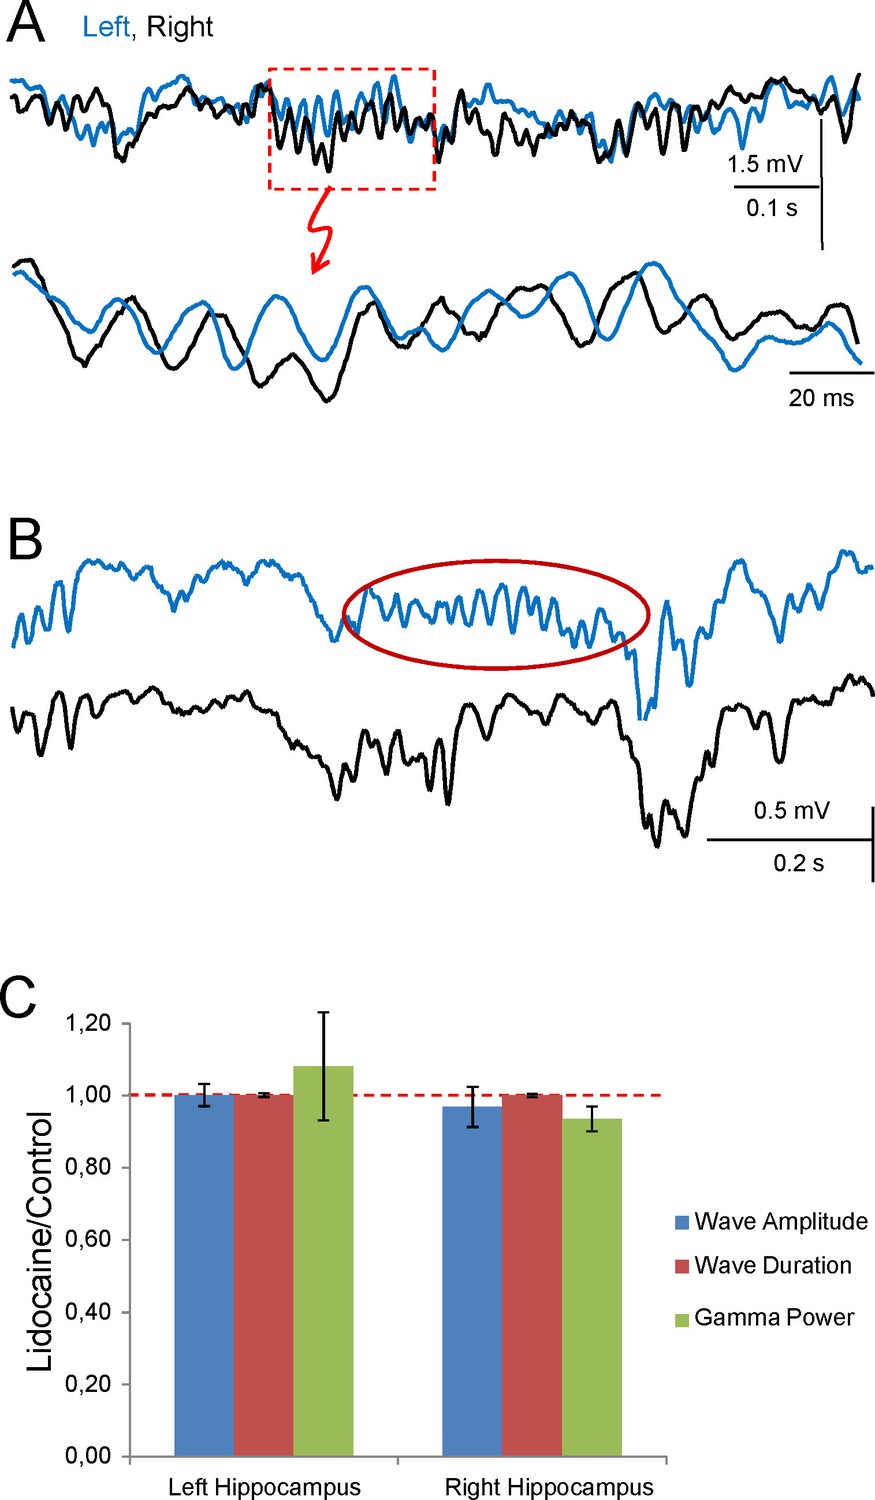
Sample traces of Schaffer activity simultaneously obtained in L (cyan) and R (black) CA1 homotopic sites following lidocaine injection in the ventral hippocampal commissure. (A) Successive enlargement to give increasing temporal detail of gamma strings and waves. Despite the bilateral co-occurrence of gamma strings, the internal pace of gamma waves loses bilateral co-variation. As a result, paired waves could not be established and wave-wave comparisons are no longer possible. (B) Only following lidocaine injection could gamma strings (red oval) be observed unilaterally (sample taken 10 s later than in A). (C) Normalized amplitude and band power of Schaffer gamma waves before and after lidocaine was micro-injected into the VHC. Values are normalized to the control in each experiment. Lidocaine does not modify the mean amplitude or duration of individual gamma waves nor the power of gamma (n = 4; epochs lasted 50–100 s). None of the values were significant (Student t-test).
Figure 6—figure supplement 2
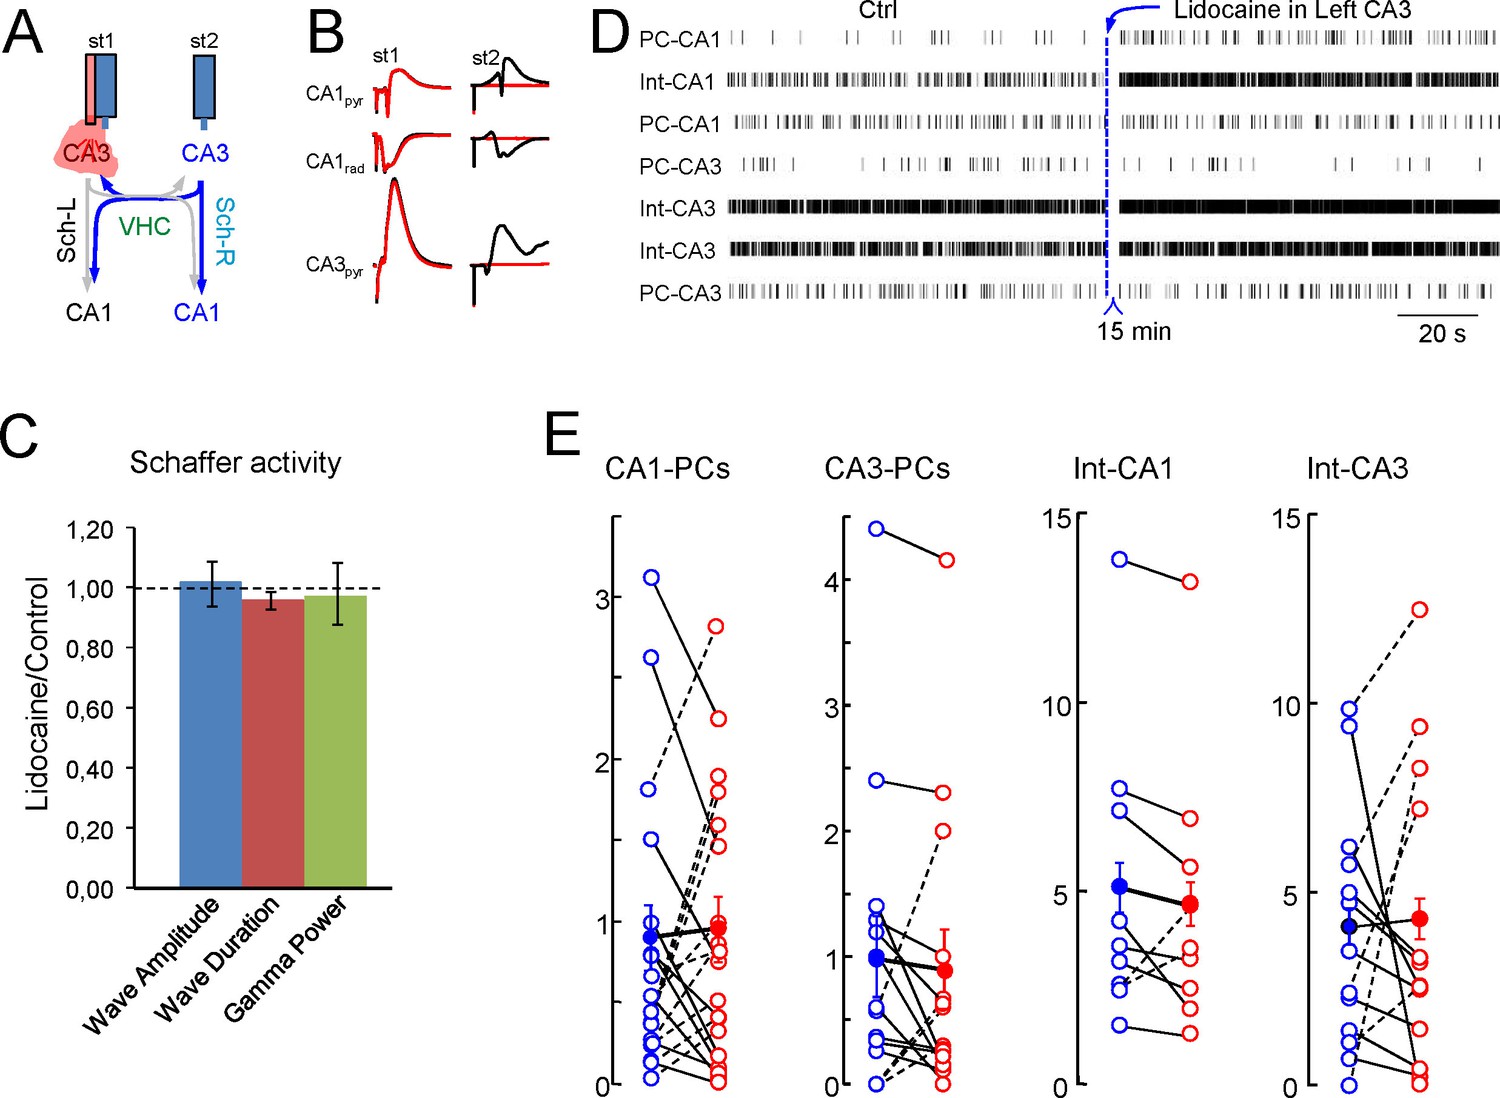
Inactivation of the CA3 in one side alters individual but not population firing rates in the other.
(A) Scheme of the experimental design. (B) Evoked potentials recorded on the left side upon stimulation on the left (st1) and the right CA3 (st2) before (black traces) and after lidocaine inactivation of the left CA3 (red). (C) Features of the Schaffer activity and Schaffer waves in the right-hand side after contralateral CA3 inactivation. None of the parameters underwent significant changes (n = 4; p>0.1 in all cases). (D) Raster plots of firing in representative units of a single experiment and population results (E). Units were classified according to their subfield and subtype (PC or putative interneuron). None of the groups showed significant changes.
Figure 7
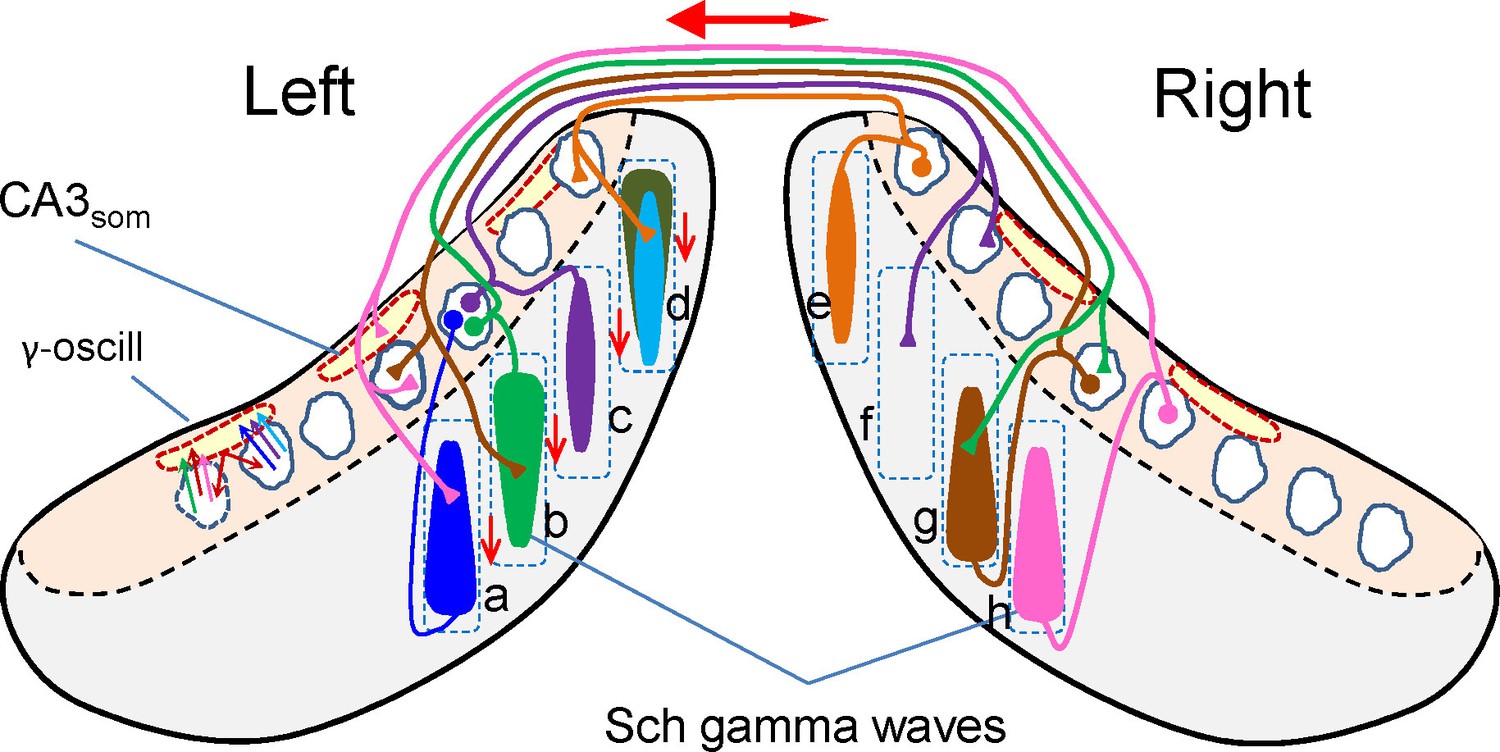
Scheme of ipsi and bilateral CA3 and CA1 relationships associated to the occurrence of Schaffer gamma waves.
Cells, domains and pathways activated during an imaginary gamma cycle in a coronal representation of the two hippocampal lobes (CA1 and CA3 subfields are in grey and beige, respectively). Only anatomical and functional relationships that are relevant to the present findings are included. Dashed squares depict lamellar-like CA1 domains. Spindle-like forms represent the CA1 dendritic domains activated by a CA3 assembly, i.e.: a Schaffer gamma wave. Dashed outlines in red represent spatial domains in the CA3 soma layer inhibited by CA3som waves. The CA3 assemblies elicit ipsilateral Schaffer waves that are matched by near synchronous waves on the other side at roughly homotopic sites (i.e.: bilateral waves a-h, b-g). Excitation in the contralateral side does not produce field potentials (Martín-Vázquez et al., 2015), as noted by the presence of unilateral waves (e.g., c-f). Schaffer waves may initiate in anterior or posterior sites of the CA1 indistinctly (indicated by the wider end of the spindles), probably originated by assemblies in different CA3 zones. Very few assemblies projecting to a given CA1 domain overlap in the same cycle. For example, domain d receives two ipsilateral Schaffer waves (in cyan and dark green) and a contralateral (unseen) wave (in orange). As part of the intrinsic gamma oscillator, different CA3 assemblies activate the same basket cells, which inhibit many more PCs, independently of whether they belong to the firing assembly or not (amplitude mismatch between CA3som and Schaffer waves). The double-headed red arrow represents the overall R-to-L precedence, and the vertical arrows represent the overall anticipation of waves at anterior sites of the lamellar CA1 domains.
Figure 8 with 1 supplement
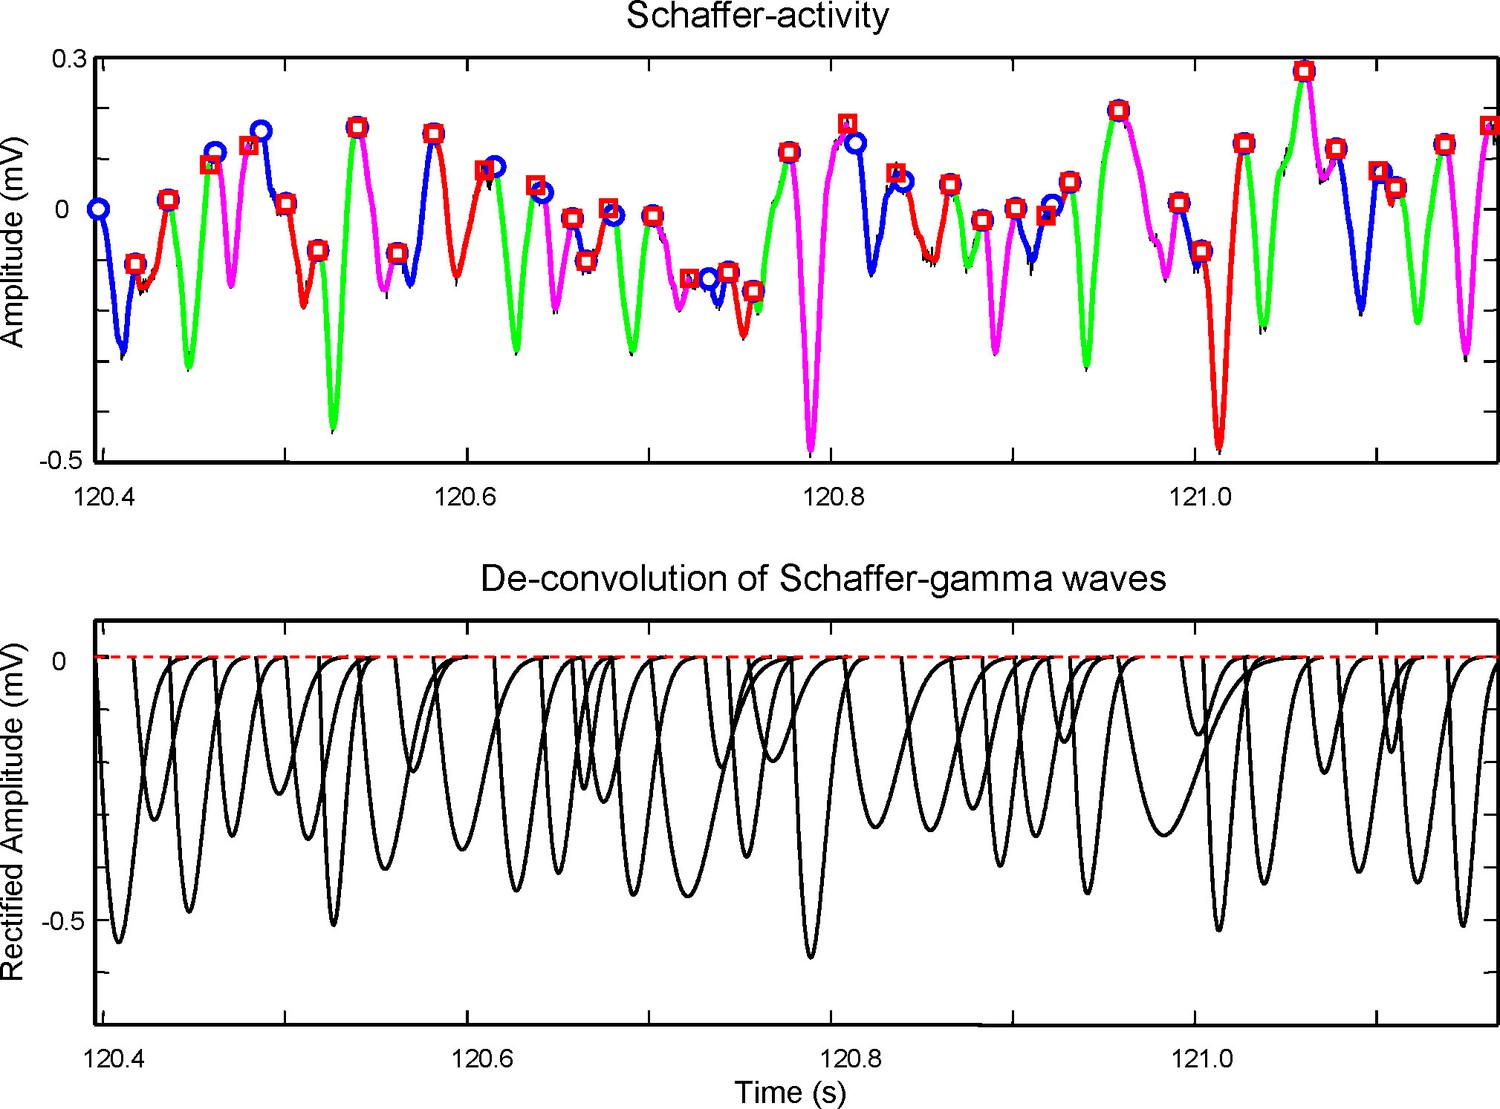
Method for the extraction of wave features from the time course of the Schaffer generator.
Top panel: An epoch of the time course of the Schaffer LFP-generator (black curve) with superimposed gamma waves detected by means of wavelet decomposition (colored curves). Each colored curve has its start and end points marked by a circle and square, respectively. The curves are used to evaluate the initial conditions for the maximization of likelihood method. Due to uncertainty in the baseline the initial weights (amplitudes) of gamma waves are taken as equal. The start (ts, circle) and end time (te, square) of a curve provide initial values for tk = ts and δk = te – ts. The optimization process then corrects these values by maximizing the loglikelihood. Bottom: Deconvoluted gamma waves found by the method. By adding them together we obtain the time course of the Schaffer generator shown in the top panel. The amplitude, A, is measured as the peak value from a baseline obtained by weighted interpolation of the start times. The method to associate gamma waves and spike firing is shown in Figure 8—figure supplement 1.
Figure 8—figure supplement 1

Analysis and statistics of left and right gamma waves and their relation to spike production in CA1 units.
(A) Schaffer activity in the right and left hippocampi (n = number of gamma waves found on each side). (B) Quantification of gamma wave features (start time, duration) using model LFP. (C) Spike trains of different neurons found in the same epoch. (D) Classification of spikes (example for train #1) according to their coincidence with unilateral or bilateral gamma waves or none. (E) Statistics (see description in the text). Only values out of the confidence interval (blue and green dashed lines) were considered significant.
Download links
A two-part list of links to download the article, or parts of the article, in various formats.
Downloads (link to download the article as PDF)
Open citations (links to open the citations from this article in various online reference manager services)
Cite this article (links to download the citations from this article in formats compatible with various reference manager tools)
The right hippocampus leads the bilateral integration of gamma-parsed lateralized information
eLife 5:e16658.
https://doi.org/10.7554/eLife.16658


