Individual differences in selective attention predict speech identification at a cocktail party
- Johannes Gutenberg-Universität, Germany
Figures
Figure 1
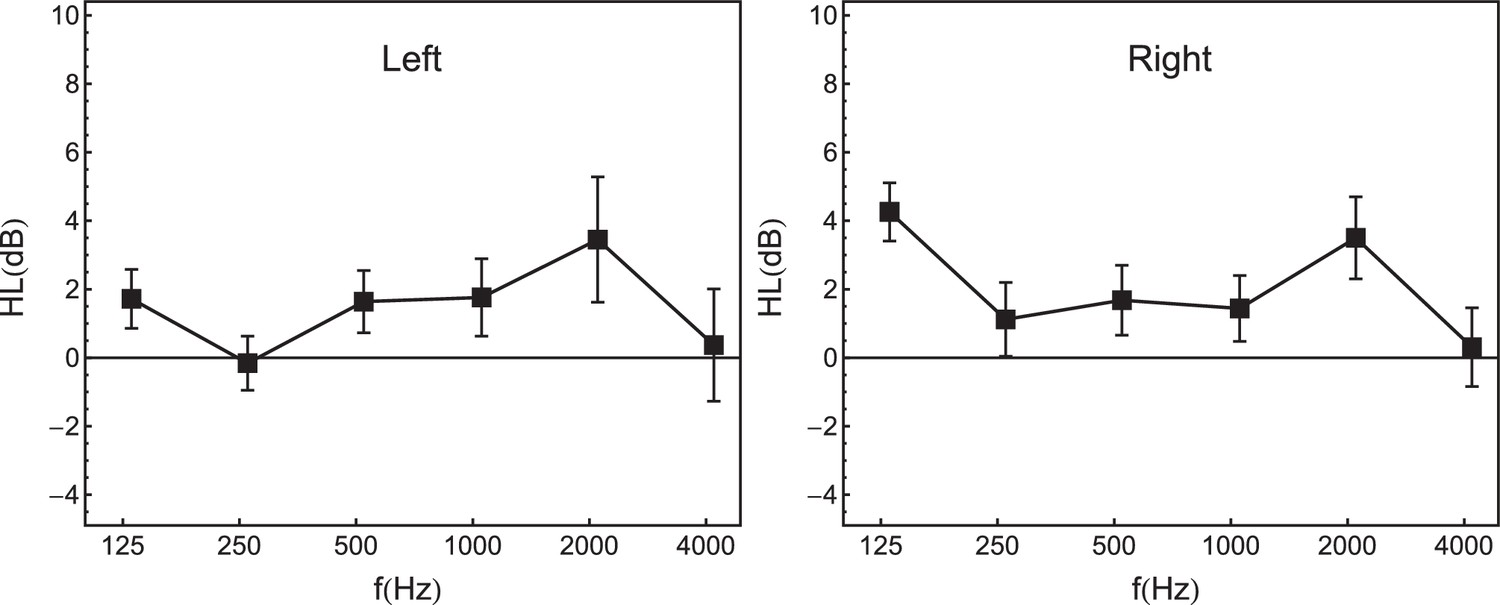
Average audiometric hearing thresholds (in dB HL), at octave frequencies between 125 Hz and 4 kHz (N = 50).
Left panel: left ear. Right panel: right ear. Error bars represent 95% confidence intervals.
Figure 2
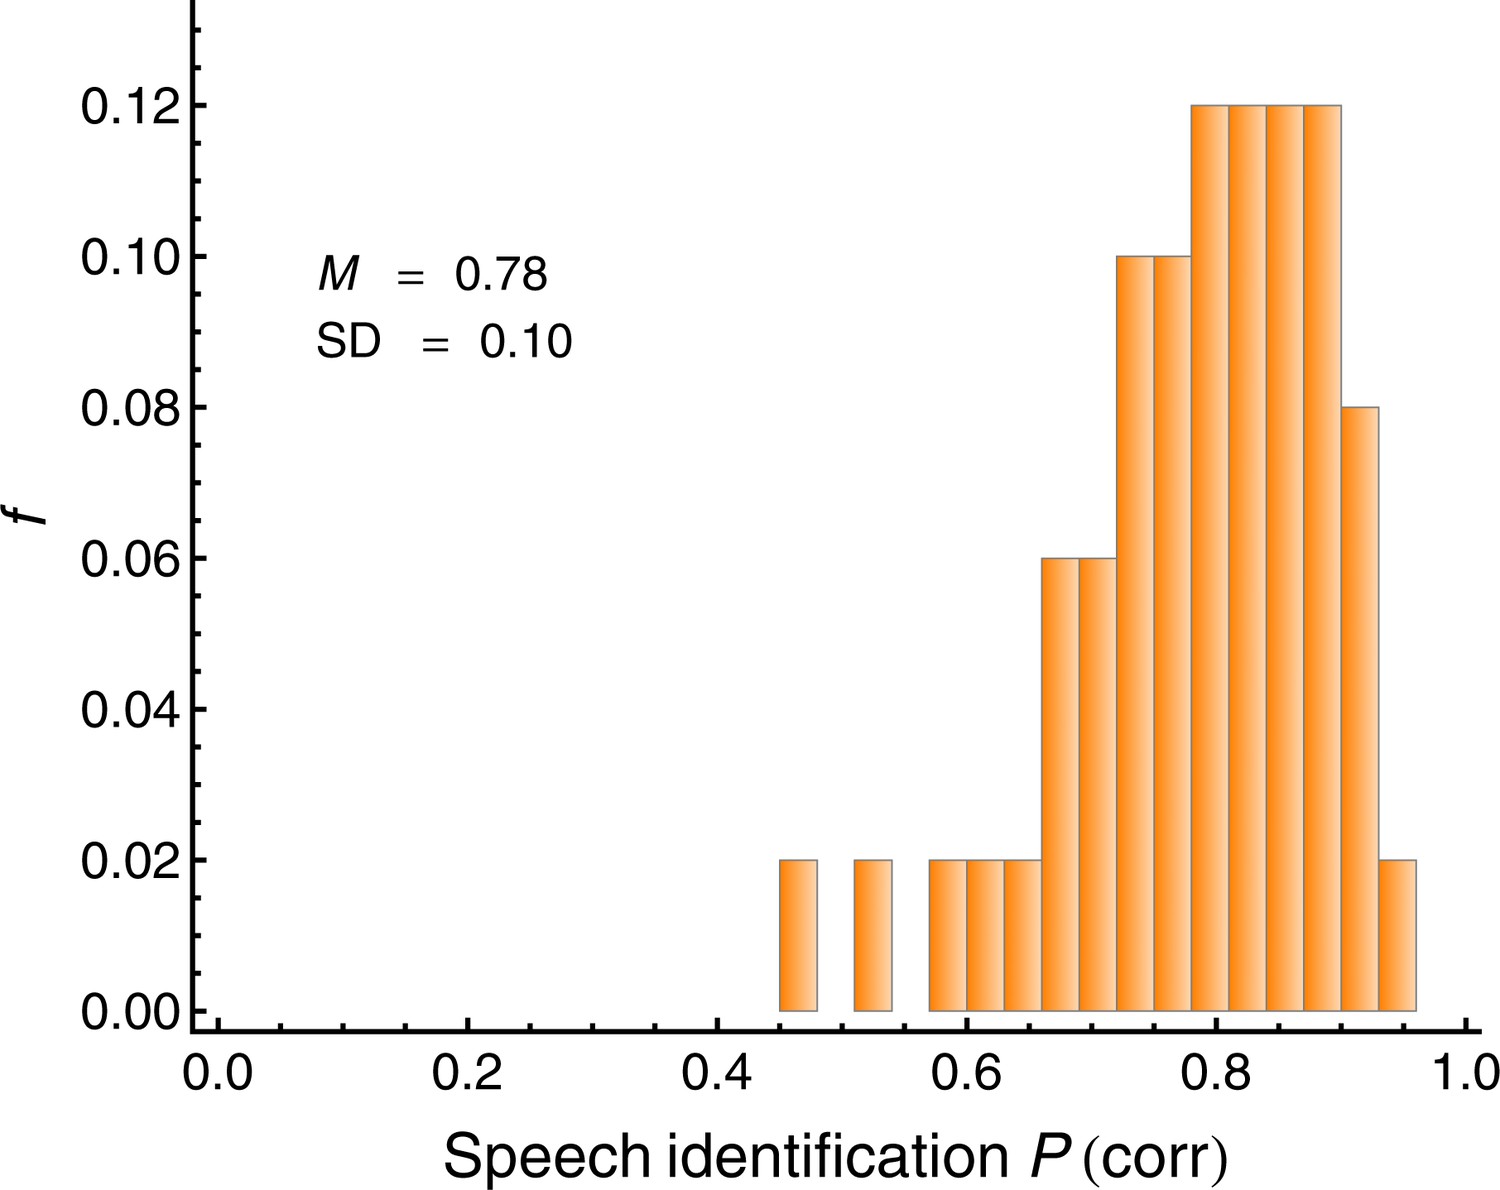
Average individual proportion correct (speech recognition score; SRS) in the simulated cocktail-party listening task with two spatially separated interfering speakers (N = 50).
This measure served as the criterion variable in the regression analyses. The mean (M) and the standard deviation (SD) are displayed.
Figure 3

Schematic depiction of the two-interval intensity discrimination task used to measure auditory selective attention.
Green: target tones. Red: backward maskers ('distractors'). The standard (S) was a 1 kHz tone presented at 60 dB SPL. An intensity increment (I) was presented in either the first or the second interval, with equal a-priori probability. The task was to select the interval containing the louder target (that is, standard-plus-increment). The maskers were 1 kHz tones presented at 90 dB SPL. The same temporal configuration was used in the in-quiet condition, except that the maskers were not presented.
Figure 4
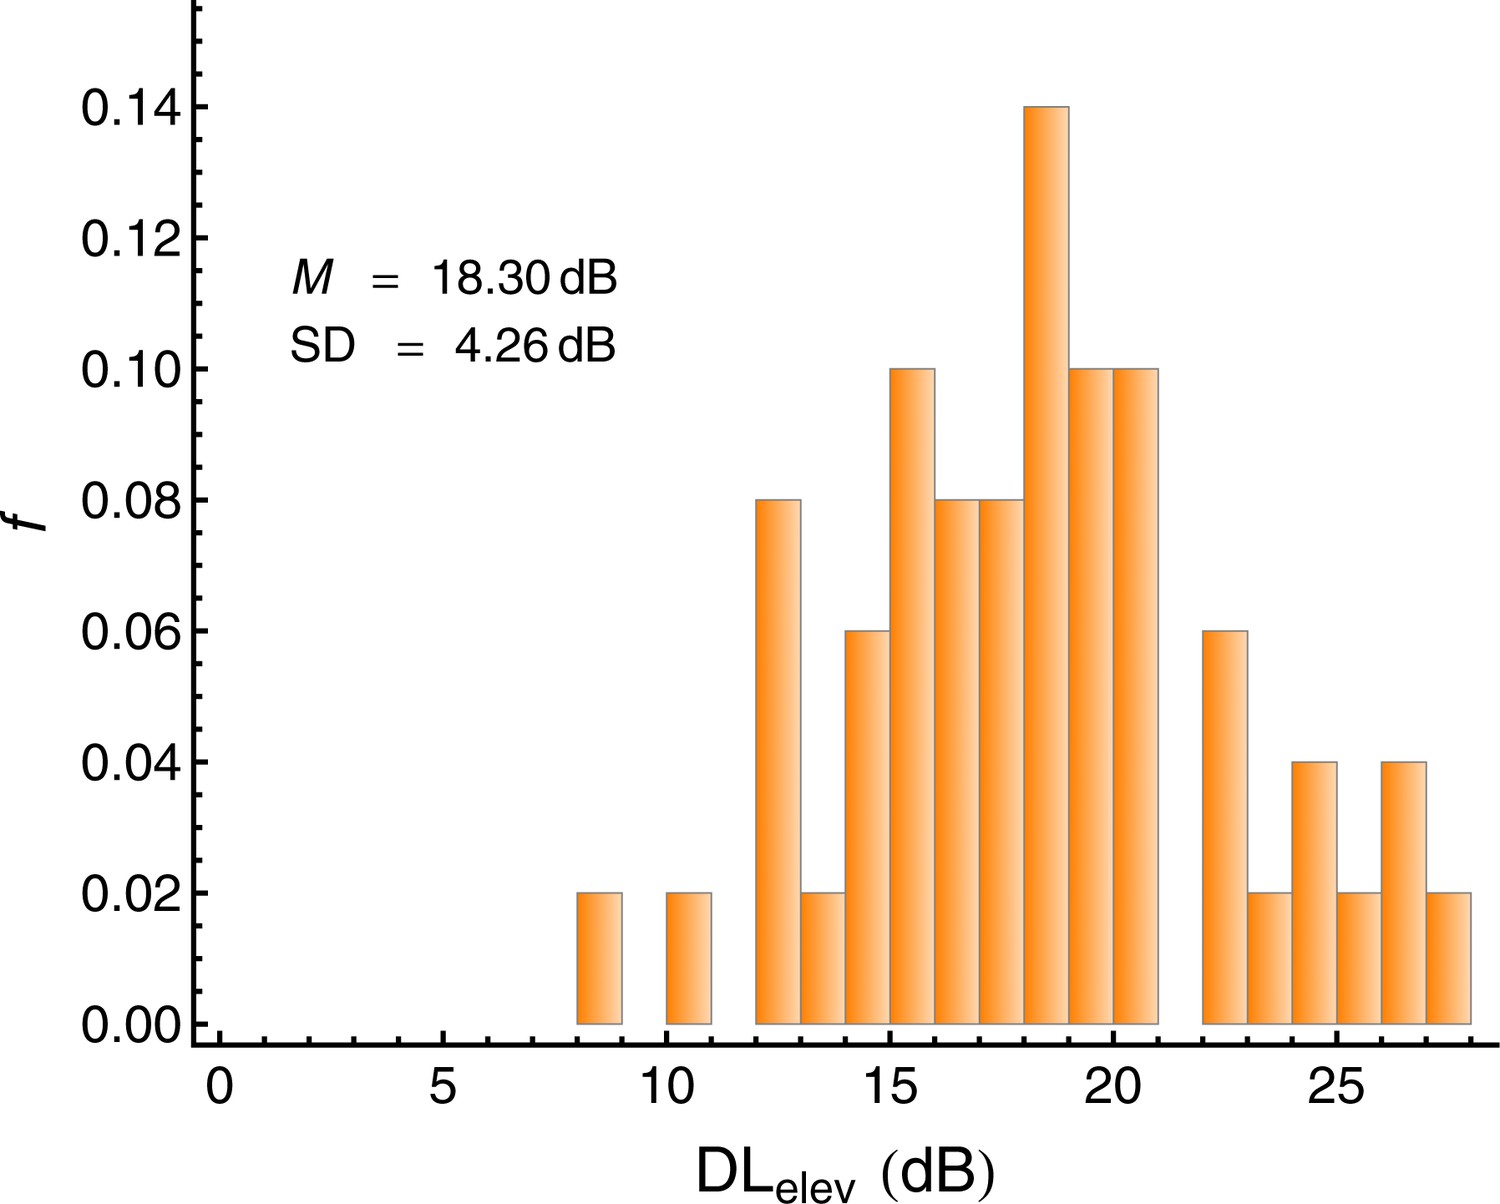
Individual elevation of the intensity difference limen caused by the backward maskers (DLelev), defined as the difference between the DL under masking and the DL in quiet.
Lower values represent a better capability of directing auditory selective attention to the target tones. N = 50.
Figure 5
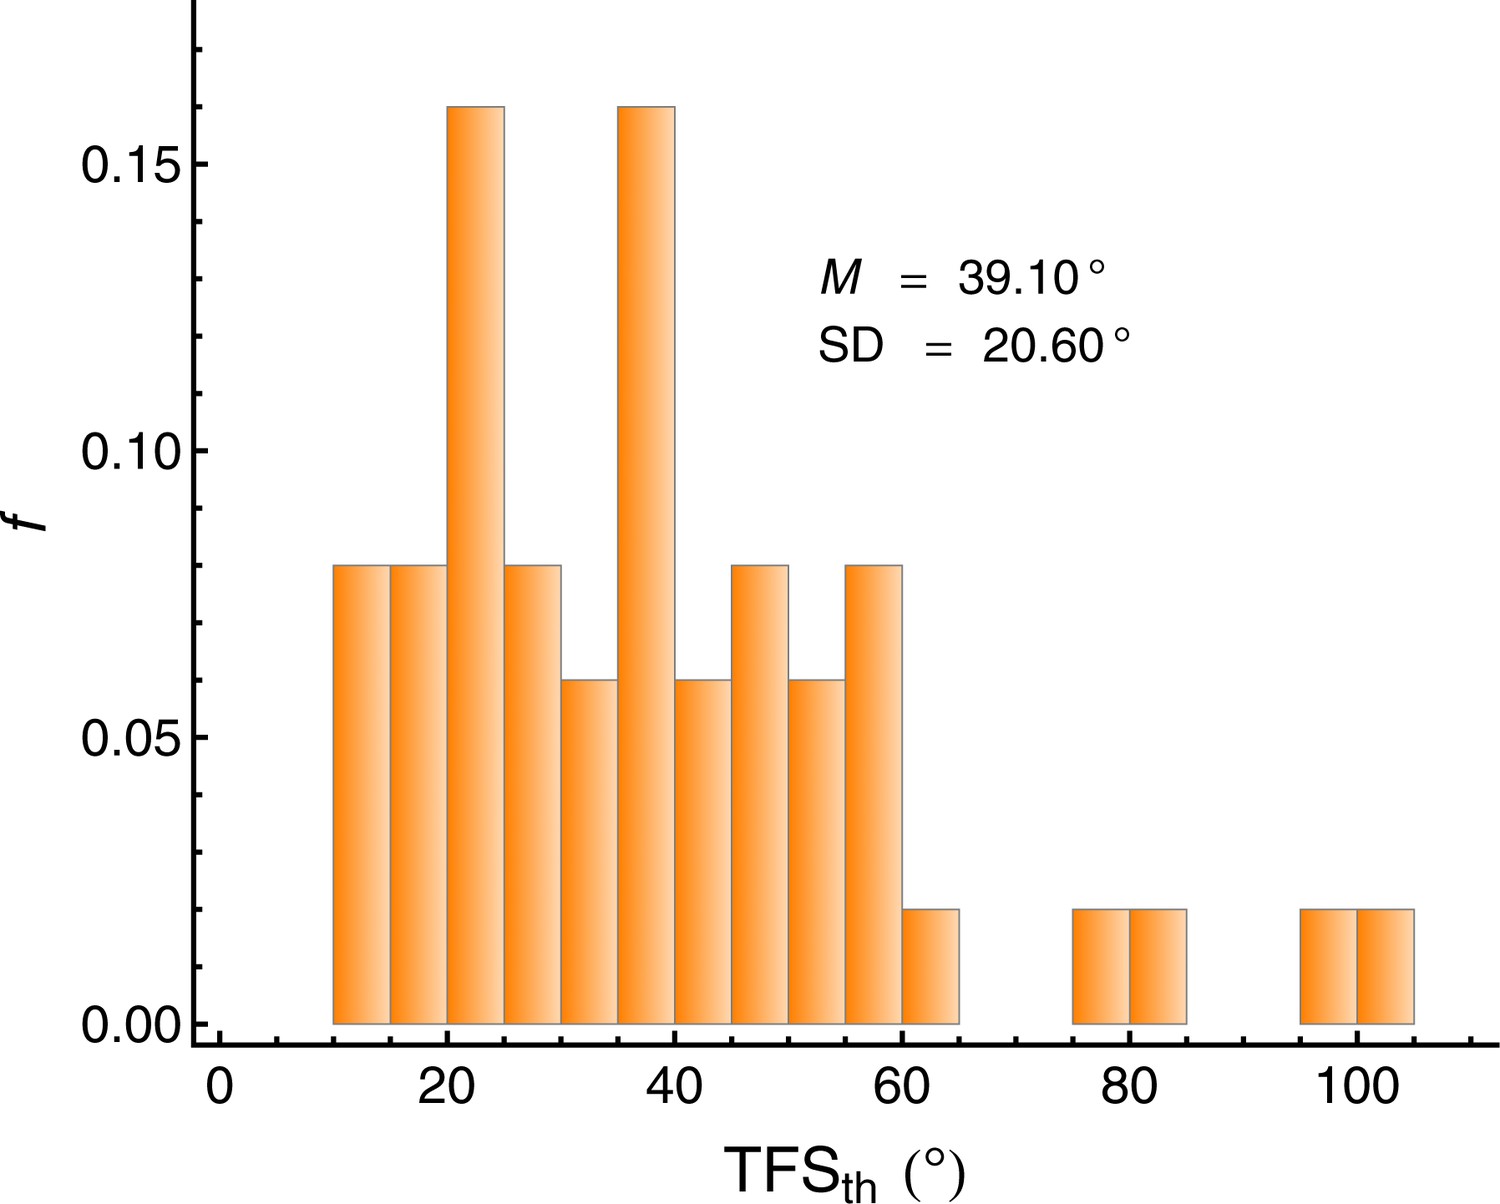
Individual IPD thresholds in the TFS-LF test (TFSth).
Lower values represent better binaural sensitivity for the temporal fine structure. N = 50.
Figure 6
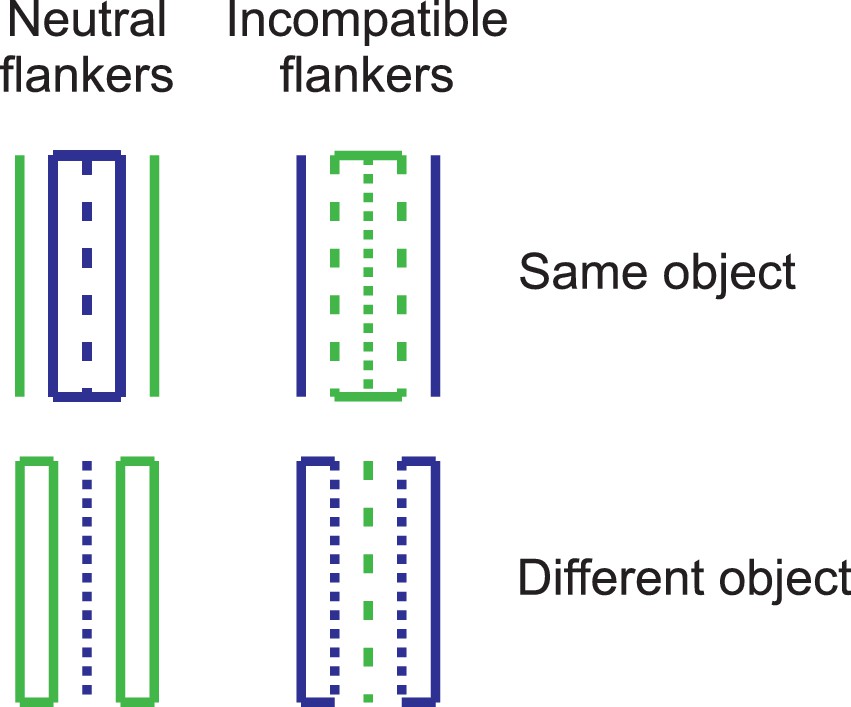
Example stimuli from the flanker task (Kramer and Jacobson, 1991) used to measure spatial visual selective attention.
The participants' task was to decide whether the central target line was dotted or dashed. In the neutral condition (left column), the neighboring flanker lines were solid and therefore not associated with a response. In the incompatible condition (right column), the flanker lines were associated with the incompatible response. The horizontal lines and the colors promoted the perceptual grouping of the target line and the flankers as either belonging to the same object (upper row), or into different objects (lower row).
Figure 7
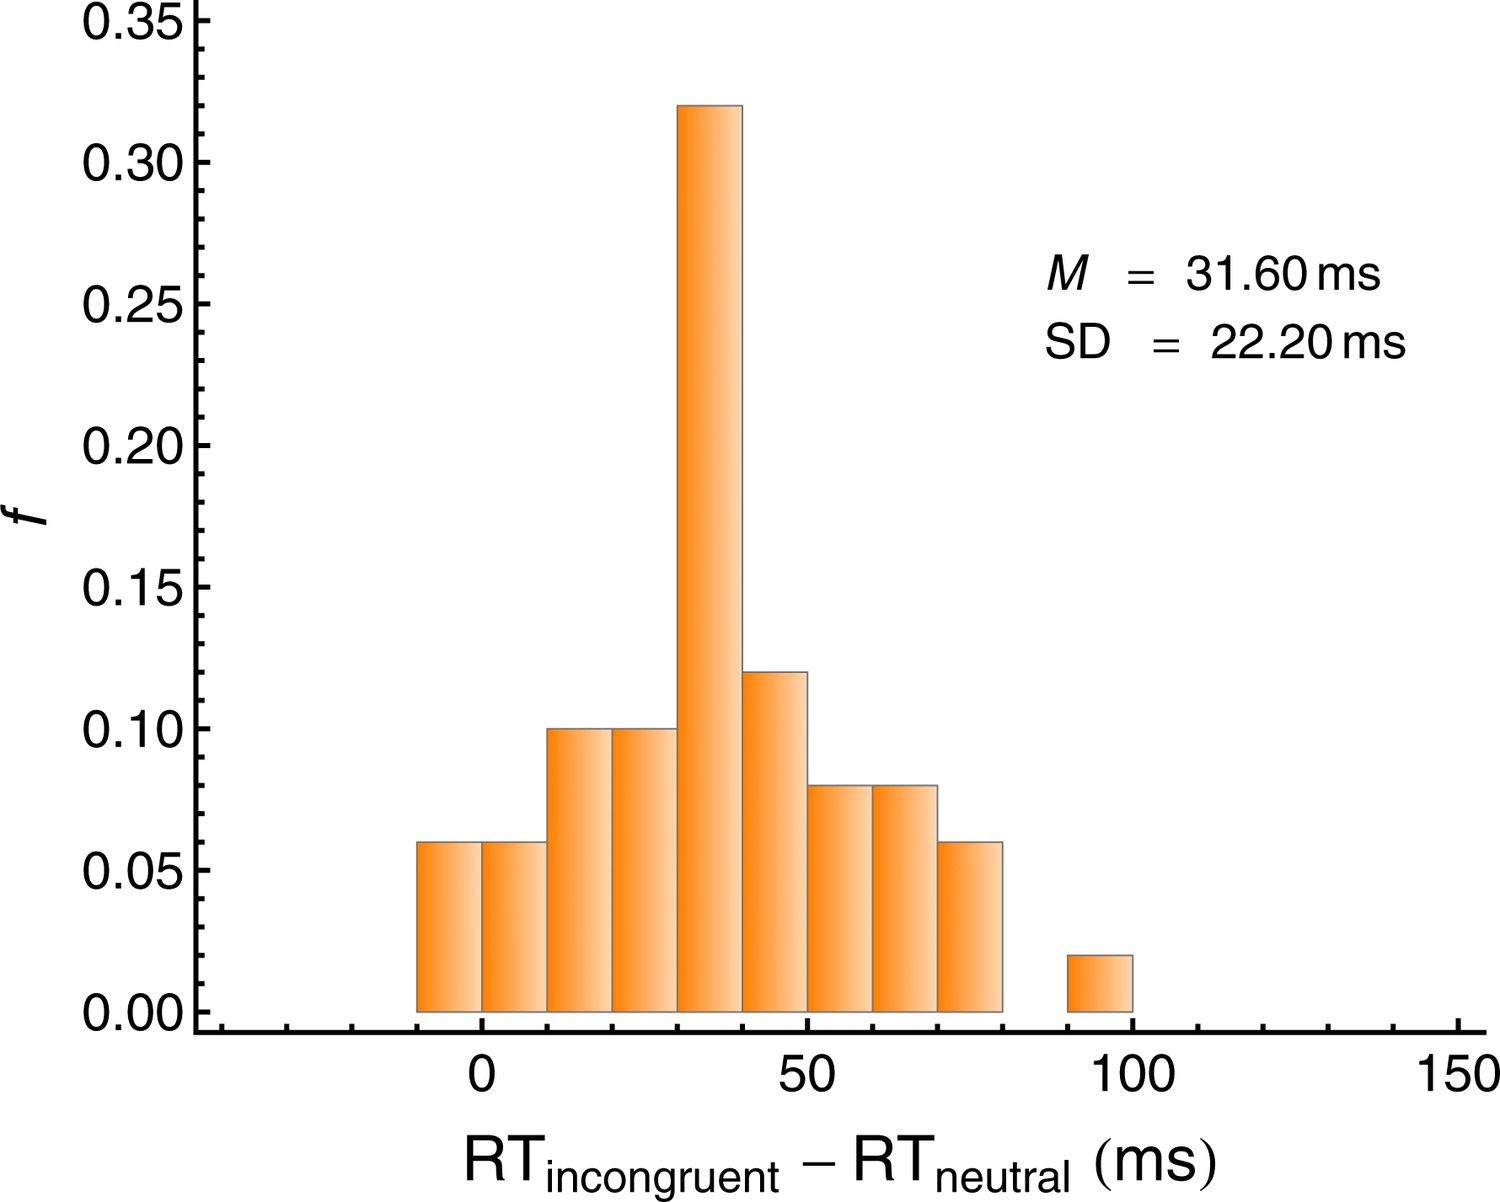
Individual flanker interference (IntFlanker) in the visual attention task.
Lower values represent a better capability of directing visual selective attention to the target line. N = 50.
Tables
Table 1
Results of the multiple regression analysis. Criterion variable: speech recognition score (SRS; proportion correct) in the simulated cocktail-party listening task. Predictors: age, masker-induced elevation of the intensity difference limen (DLelev), the amount of flanker interference in the flanker task (IntFlanker), IPD threshold in the TFS-LF task (TFSth), pure-tone average thresholds on the better ear (PTABE), average asymmetry in the hearing thresholds between left and right ear (HLdiff), intensity-DL in quiet (DLquiet), response time in the neutral condition of the flanker task (RTneutral), and proportion of correctly recalled consonants in the working memory task (SSPcorr). All variables were z-standardized.
| Predictor | β | SE | t | p | GDW | βLasso |
|---|---|---|---|---|---|---|
| Intercept | 0.068 | 0.096 | 0.710 | 0.480 | 0.081 | |
| Age | 0.194 | 0.110 | 1.760 | 0.086 | 0.020 | − |
| DLelev | −0.347 | 0.107 | 3.240 | 0.003 | 0.152 | −0.220 |
| IntFlanker | −0.233 | 0.103 | 2.270 | 0.029 | 0.052 | −0.081 |
| TFSth | −0.383 | 0.103 | 3.730 | 0.001 | 0.204 | −0.286 |
| PTABE | 0.137 | 0.102 | 1.350 | 0.186 | 0.016 | − |
| HLdiff | −0.088 | 0.106 | 0.830 | 0.413 | 0.007 | − |
| DLquiet | −0.007 | 0.114 | 0.070 | 0.948 | 0.021 | |
| RTneutral | −0.037 | 0.129 | 0.280 | 0.778 | 0.015 | − |
| SSPcorr | 0.193 | 0.111 | 1.740 | 0.091 | 0.085 | 0.089 |
| R2 =0.57 p<0.001 | R2 =0.44 |
-
Note: N = 45. β: estimated ordinary least-squares (OLS) regression coefficient. SE: standard error of the estimate. t: t-statistic. Bold font indicates a β significantly different from 0 (p<0.05). GDW: general dominance weight. βLasso: regression coefficients for predictors selected by the Lasso procedure (model selection via four-fold cross-validation).
Table 2
Pairwise Pearson partial correlation coefficients, controlling for age. N = 50. In each row, the upper numbers are the partial correlation coefficients (ρpartial), and the lower numbers are the p-values for the test of |ρpartial| > 0. The rightmost column shows Pearson correlation coefficients with age. Bold font: p<0.05. Italics: p<0.10.
| DLelev | IntFlanker | TFSth | PTABE | HLdiff | DLquiet | RTneutral | SSPcorr | SSQspeech | SSQspatial | SSQqualities | Age | |
|---|---|---|---|---|---|---|---|---|---|---|---|---|
| OLSAPcorr | −0.374 | −0.149 | −0.353 | 0.060 | −0.163 | −0.244 | −0.232 | 0.338 | 0.121 | 0.083 | 0.230 | 0.033 |
| 0.008 | 0.307 | 0.013 | 0.683 | 0.263 | 0.091 | 0.109 | 0.018 | 0.407 | 0.570 | 0.112 | 0.819 | |
| DLelev | −0.047 | 0.038 | 0.030 | −0.083 | −0.045 | 0.092 | −0.255 | −0.302 | −0.049 | −0.178 | −0.045 | |
| 0.748 | 0.793 | 0.838 | 0.570 | 0.759 | 0.529 | 0.077 | 0.035 | 0.740 | 0.220 | 0.754 | ||
| IntFlanker | −0.081 | −0.018 | −0.234 | −0.032 | −0.094 | −0.112 | −0.141 | −0.098 | −0.112 | 0.045 | ||
| 0.578 | 0.903 | 0.105 | 0.826 | 0.522 | 0.444 | 0.335 | 0.501 | 0.444 | 0.758 | |||
| TFSth | 0.034 | −0.023 | 0.399 | 0.312 | −0.177 | −0.149 | −0.314 | −0.352 | 0.027 | |||
| 0.818 | 0.873 | 0.005 | 0.029 | 0.224 | 0.306 | 0.028 | 0.013 | 0.852 | ||||
| PTABE | −0.292 | −0.083 | −0.010 | −0.092 | 0.136 | 0.082 | 0.097 | −0.248 | ||||
| 0.042 | 0.572 | 0.944 | 0.531 | 0.353 | 0.577 | 0.508 | 0.082 | |||||
| HLdiff | 0.195 | 0.038 | 0.087 | 0.274 | 0.198 | 0.119 | 0.227 | |||||
| 0.180 | 0.795 | 0.551 | 0.057 | 0.174 | 0.416 | 0.113 | ||||||
| DLquiet | 0.383 | −0.115 | −0.008 | −0.118 | −0.130 | 0.082 | ||||||
| 0.007 | 0.431 | 0.959 | 0.420 | 0.375 | 0.573 | |||||||
| RTneutral | −0.198 | −0.087 | −0.135 | −0.011 | 0.217 | |||||||
| 0.172 | 0.552 | 0.355 | 0.940 | 0.129 | ||||||||
| SSPcorr | −0.011 | 0.081 | 0.053 | −0.380 | ||||||||
| 0.940 | 0.580 | 0.720 | 0.006 | |||||||||
| SSQspeech | 0.707 | 0.728 | 0.040 | |||||||||
| <0.0001 | <0.0001 | 0.784 | ||||||||||
| SSQspatial | 0.701 | 0.123 | ||||||||||
| <0.0001 | 0.393 | |||||||||||
| SSQqualities | 0.058 | |||||||||||
| 0.692 |
Table 3
Multiple regression analysis of the relation between the SSQ scores (Gatehouse and Noble, 2004) representing self-reported hearing abilities (predictors) and the speech recognition score in the simulated cocktail-party listening task (criterion). N = 47.
| Predictor | β | SE | t | p |
|---|---|---|---|---|
| Intercept | −1.150 | 0.988 | 1.160 | 0.251 |
| Age | −0.006 | 0.034 | 0.170 | 0.864 |
| SSQspeech | 0.006 | 0.116 | 0.050 | 0.958 |
| SSQspatial | −0.160 | 0.117 | 1.360 | 0.181 |
| SSQqualities | 0.321 | 0.142 | 2.250 | 0.030 |
Download links
A two-part list of links to download the article, or parts of the article, in various formats.
Downloads (link to download the article as PDF)
Open citations (links to open the citations from this article in various online reference manager services)
Cite this article (links to download the citations from this article in formats compatible with various reference manager tools)
Individual differences in selective attention predict speech identification at a cocktail party
eLife 5:e16747.
https://doi.org/10.7554/eLife.16747


