Conserved functional antagonism of CELF and MBNL proteins controls stem cell-specific alternative splicing in planarians
- Berlin Institute for Medical Systems Biology, Max-Delbrück Center for Molecular Medicine, Germany
- Barcelona Institute of Science and Technology (BIST), Spain
- Universitat Pompeu Fabra, Spain
- University of Toronto, Canada
Figures
Figure 1 with 4 supplements
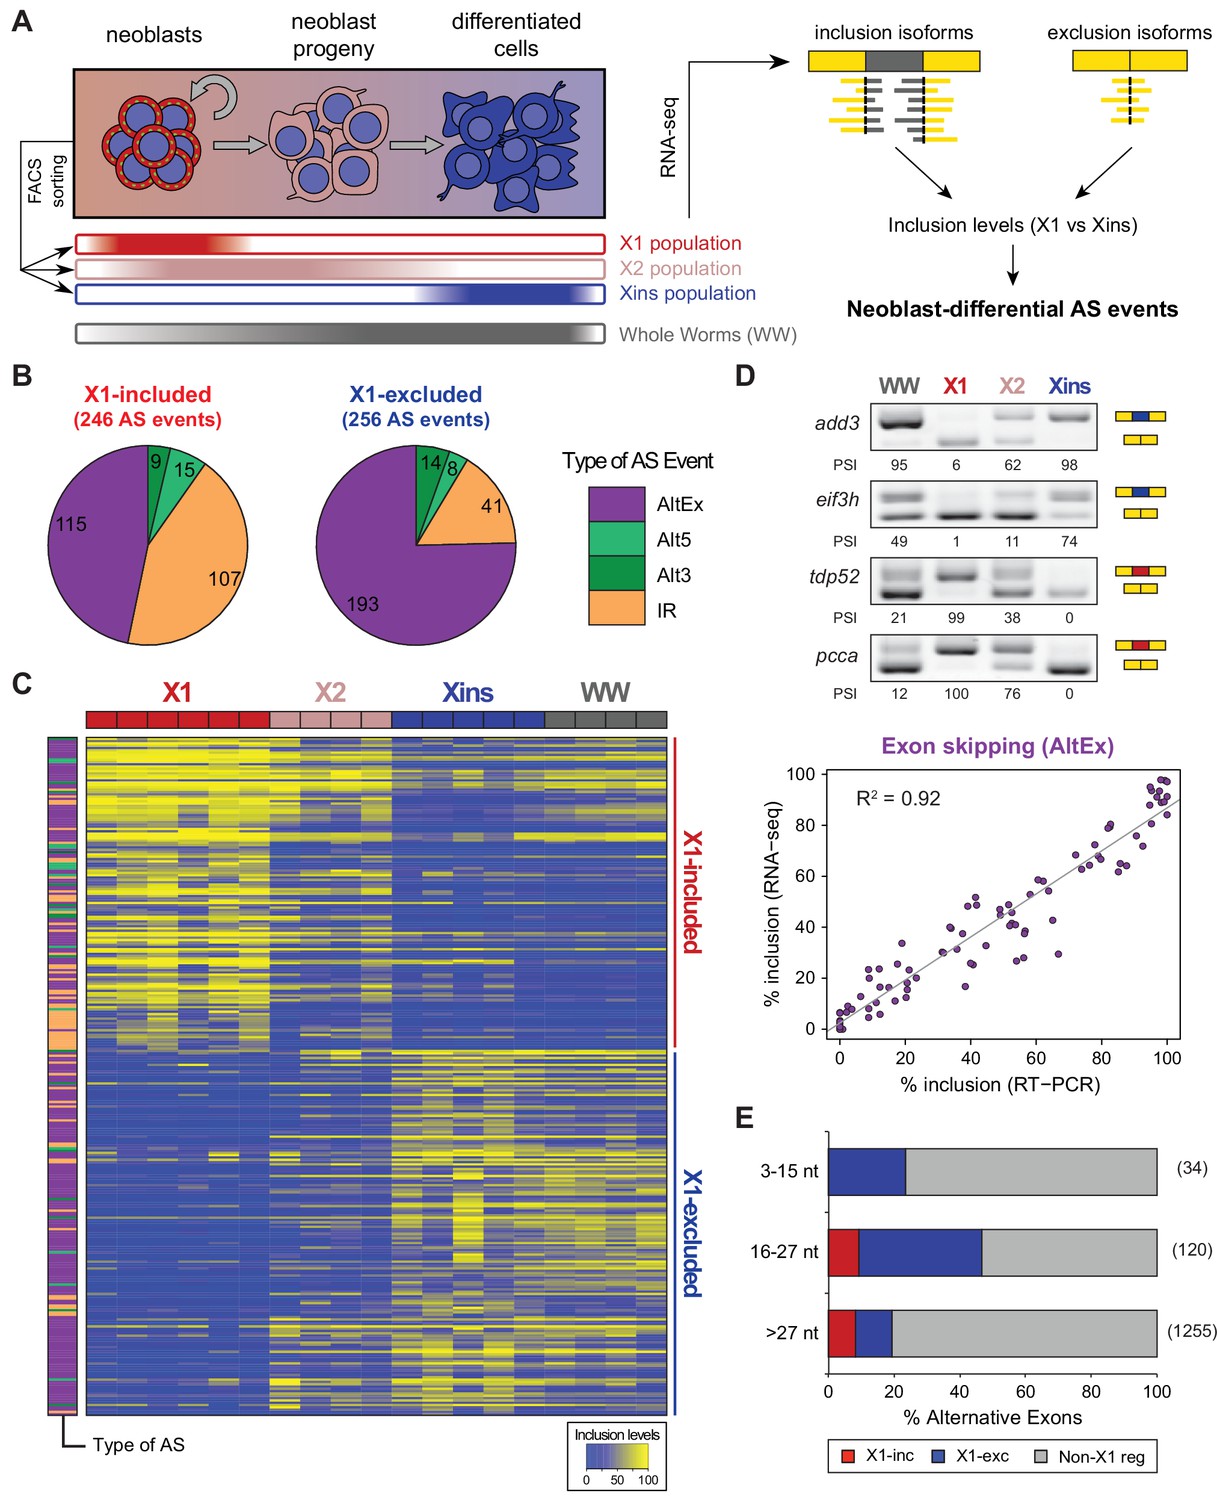
Alternative splicing is differentially regulated between planarian stem cells and differentiated cells.
(A) Planarian Stem cells ('Neoblasts'), their differentiating progeny, and differentiated cells are purified with FACS ('X1', 'X2', 'Xins', respectively). RNA-seq and computational analyses were subsequently used to identify X1-differential AS at a genome-wide scale. (B) Distribution of AS events with increased/decreased inclusion of the alternative sequence in X1. Alt3/5, alternative splice site acceptor/donor selection; IR, intron retention; AltEx, cassette exons. (C) Heatmap of inclusion level values for 293 representative X1-differential AS events. Bars in the dendrogram correspond to AS types in B. (D) Representative RT-PCR assays monitoring AS patterns in FACS isolated cell fractions. Red and blue exons indicate those exons with higher and lower inclusion in X1 compared to Xins fractions, respectively. Scatter plot shows correspondence between PSI estimates by RNA-Seq and RT-PCR in whole worms and X1, X2 and Xins fractions for 22 events (R2 = 0.92, n = 88). (E) Proportion of alternatively spliced exons by length class with increased inclusion in X1 ('X1-inc') or Xins ('X1-exc') fractions, or not differentially regulated between X1 and Xins fractions ('Non-X1 reg')
-
Figure 1—source data 1
Schmidtea mediterranea RNA-seq samples used in this study.
- https://doi.org/10.7554/eLife.16797.004
-
Figure 1—source data 2
List of neoblast-differential AS events.
- https://doi.org/10.7554/eLife.16797.005
Figure 1—figure supplement 1
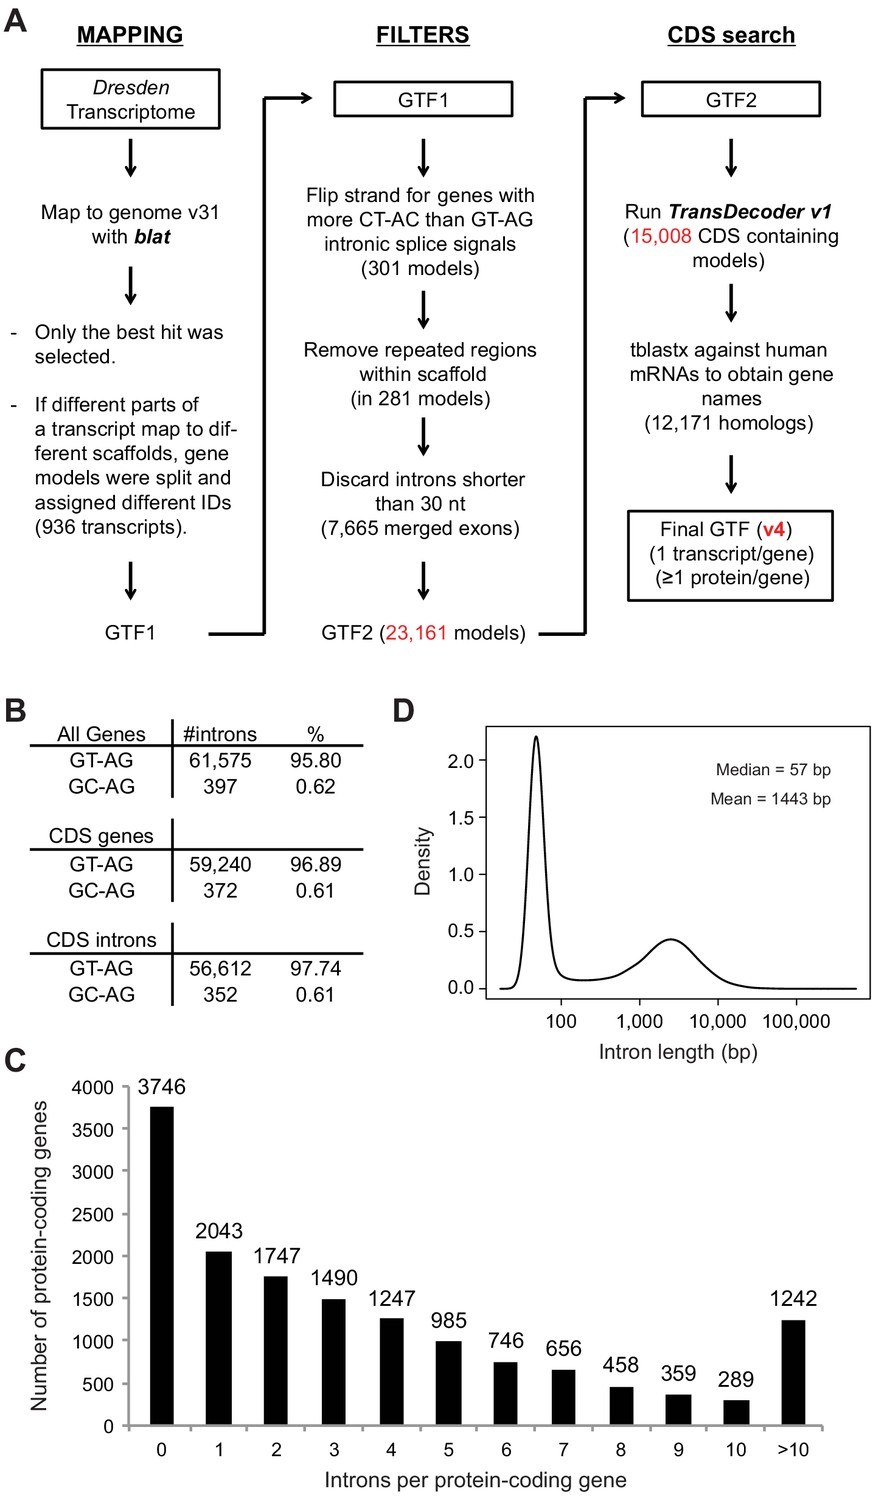
Genome annotation pipeline and summary statistics.
(A) Genome annotation pipeline used in this study. (B) Number and percentage of canonical introns (with GY-AG splice sites) in all genes, coding genes, and introns within coding regions. (C) Whole genome intron length distribution shows a marked bimodal distribution. (D) Number of protein-coding genes according to their intron density.
Figure 1—figure supplement 2
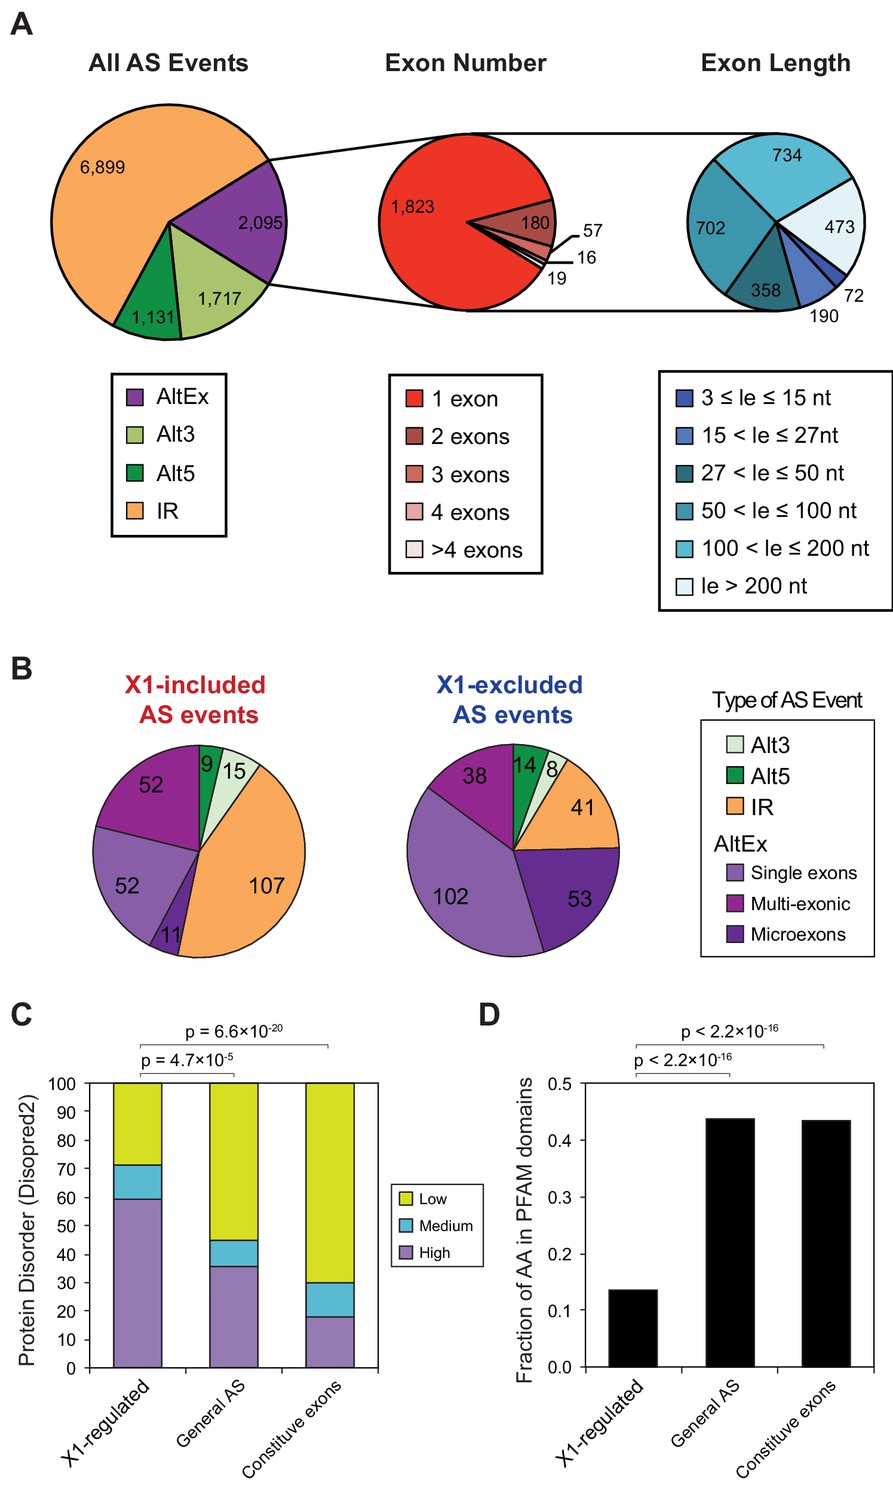
Identification and analysis of neoblast differential AS in planarians.
(A) Number of alternative splicing events identified by type. Left: number of AS events based on RNA-seq data by type. Alt3/5, Alternative acceptor /donor splice site choice; IR, intron retention; AltEx, alternative exon skipping events (cassette exons). Middle: number of exon skipping events according to the number of neighboring alternative exons that form the event. Right: number of alternative exons according to their length. Microexons are defined as those exons with lengths between 3 and 27 nucleotides. (B) Distribution by type of planarian AS events with increased/decreased neoblast inclusion of the alternative sequence. 'Alt3/5', alternative splice site acceptor/donor selection; 'IR', intron retention; 'MIC', microexons (length between 3 and 27 nucleotides); 'Single', single cassette long (>27 nucleotides) exon; 'Multi', long exon that is part of an array of multiple neighbouring cassette exons. (C) Percent of neoblast-differential, alternative or constitutive exons with high (average disorder rate >0.67), mid (between 0.33 and 0.67) and low (<0.33) disorder calculated using Disopred2. p-values correspond to 3-way Fisher tests. (D) Percent of residues that overlap a PFAM protein domain. p-values correspond to proportion tests.
Figure 1—figure supplement 3
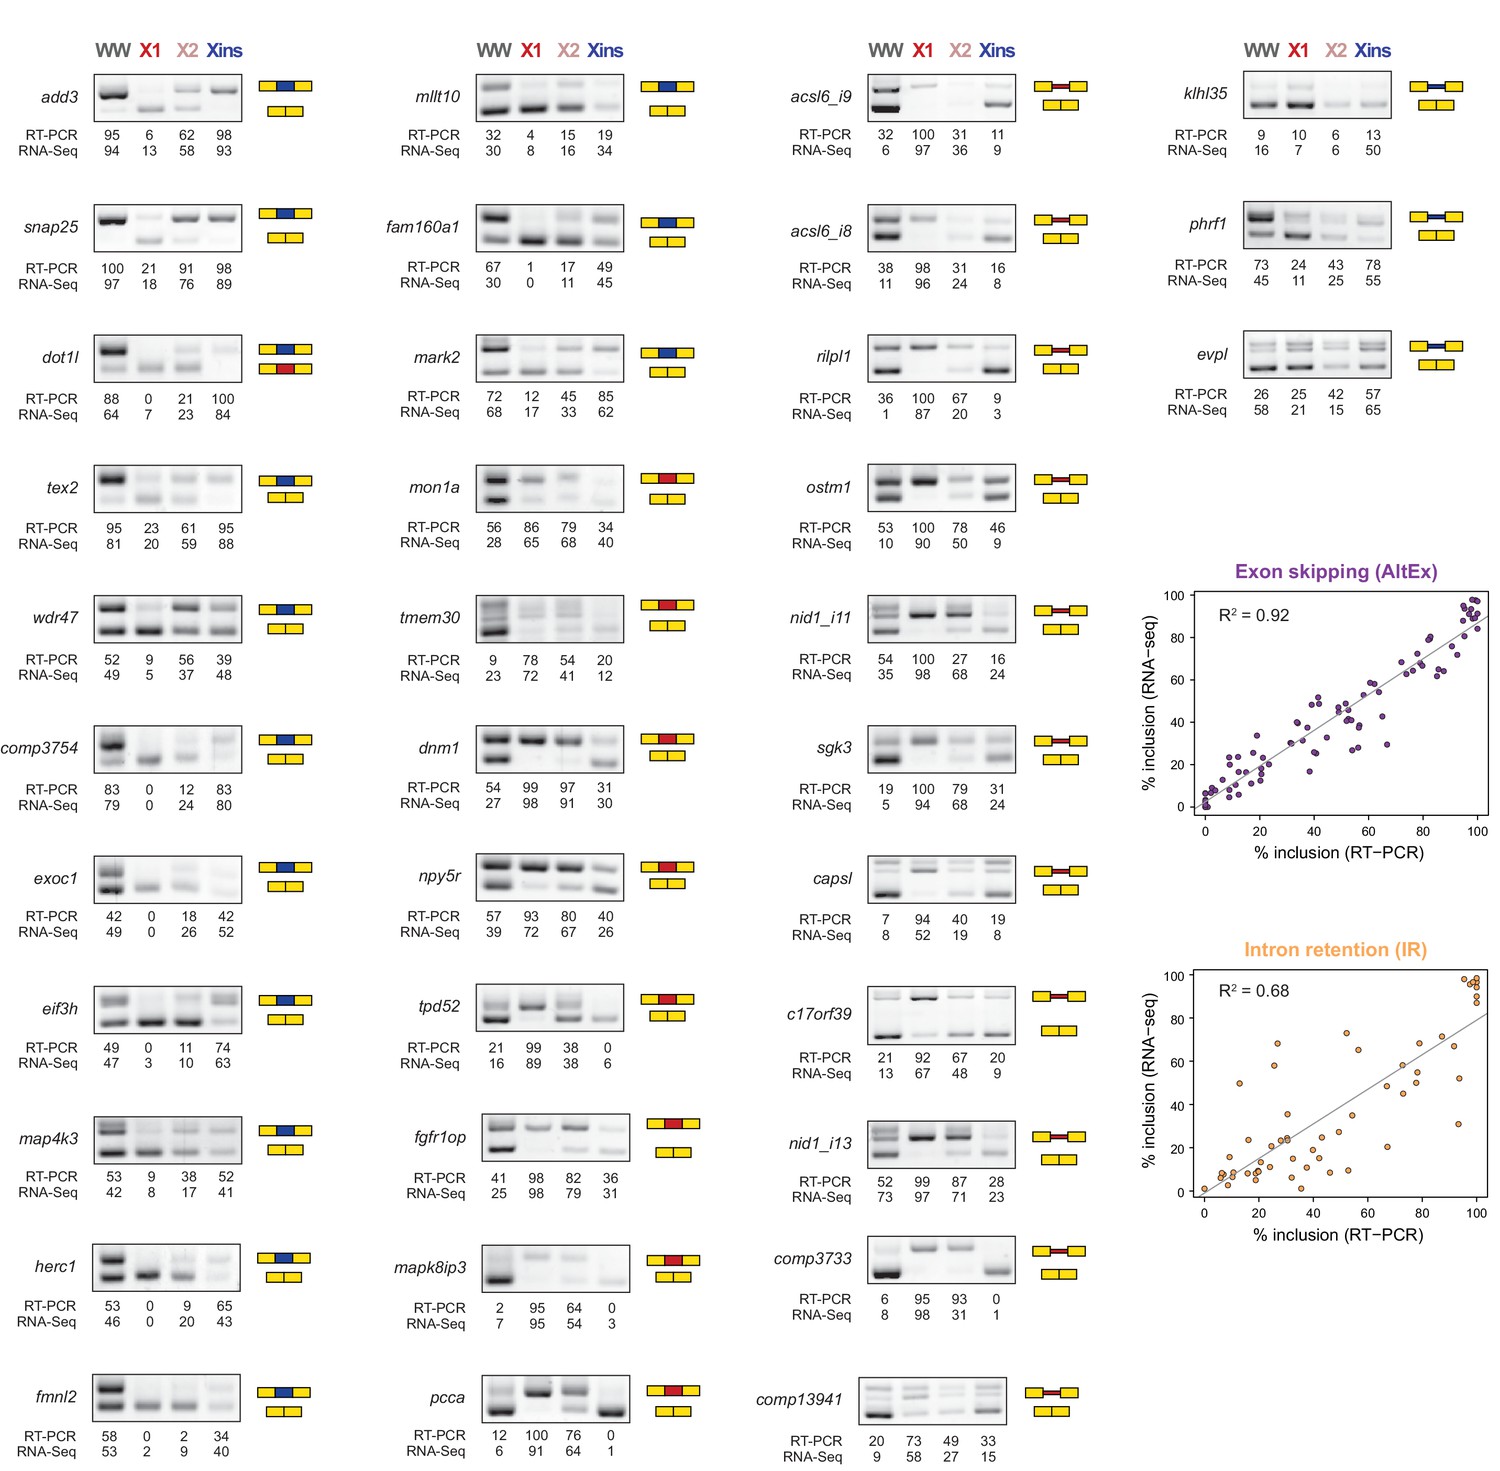
RT-PCR validation of neoblast-differential AS events.
RT-PCR validation assays for 22 and 14 representative AltEx and IR events that are predicted to be differentially regulated between neoblasts and differentiated cells by RNA-Seq analyses. Red and blue exons/introns indicate those exons/introns with higher and lower inclusion in X1 compared to Xins fractions, respectively. Scatter plots show correspondence between inclusion level estimates by RNA-Seq and RT-PCR in whole worms and X1, X2 and Xins fractions (AltEx, R2 = 0.92, n = 88; IR, R2 = 0.68, n = 56).
Figure 1—figure supplement 4

Gene Ontology analysis of X1-differential AS events.
(A-C) Gene Ontology analysis of neoblast-differential AS events: Gene ontology enrichment analysis for 'Biological Process', 'Molecular Function' and 'Cellular Component' terms was performed for neoblast-differential events that are predicted to (I) generate distinct protein isoforms in X1 and Xins (black), (J) disrupt ORF in X1 (dark grey), and (K) disrupt ORF in Xins (light grey).
Figure 2
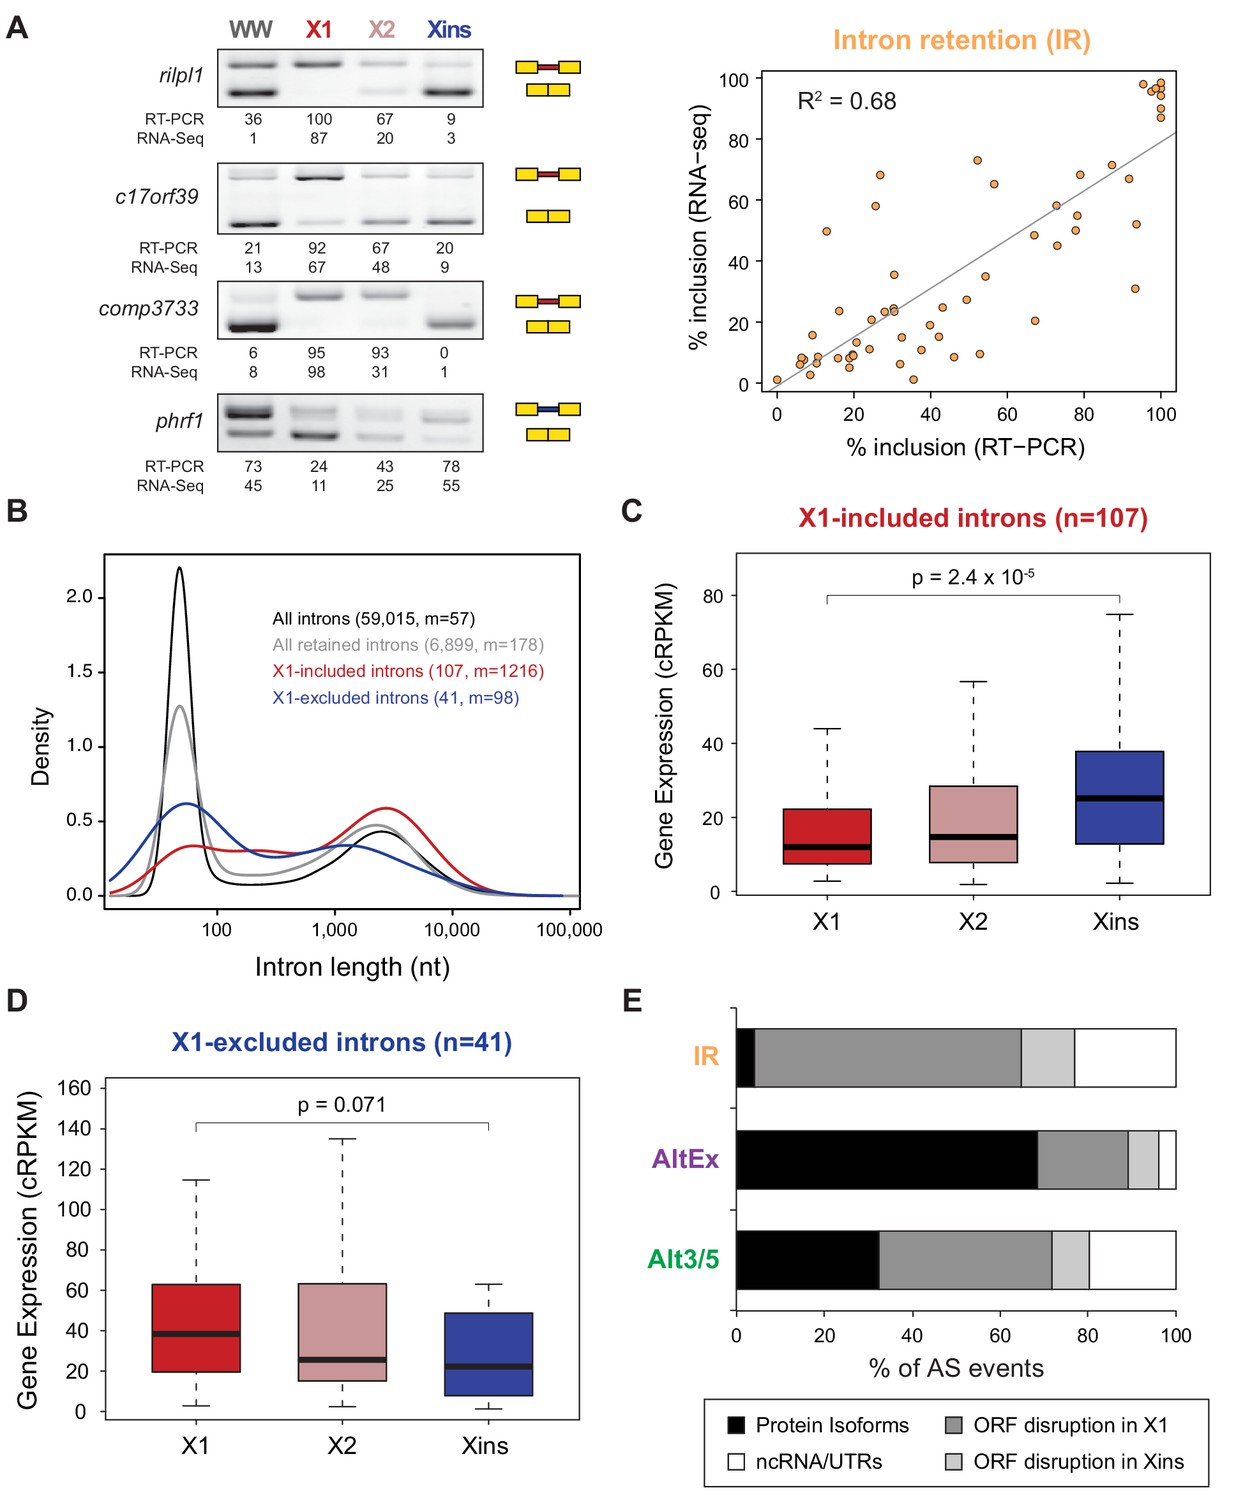
Abundant IR in planarian neoblasts.
(A) Representative RT-PCR assays monitoring IR patterns in FACS isolated cell fractions. Red and blue introns indicate those introns with higher and lower inclusion in X1 compared to Xins fractions, respectively. Scatter plot shows correspondence between PSI estimates by RNA-Seq and RT-PCR in whole worms and X1, X2 and Xins fractions for 14 events (R2 = 0.68, n = 56). (B) Intron length distributions for all introns (black), all retained introns (grey), X1-included introns (red) and X1-excluded introns (blue). Median length (m) is indicated for each set. (C–D) Gene expression measured using the cRPKM metric for genes containing X1-included (C) or excluded (D) introns in X1, X2 and Xins cell fractions. P-value corresponds to a Wilcoxon Sum Rank test between X1 and Xins expression values. (E) Percent of X1-differential AS events by type that are predicted to generate alternative ORF-preserving isoforms (black), disrupt the ORF in neoblasts or differentiated cells (dark/light grey), or overlap non-coding sequences (white).
Figure 3
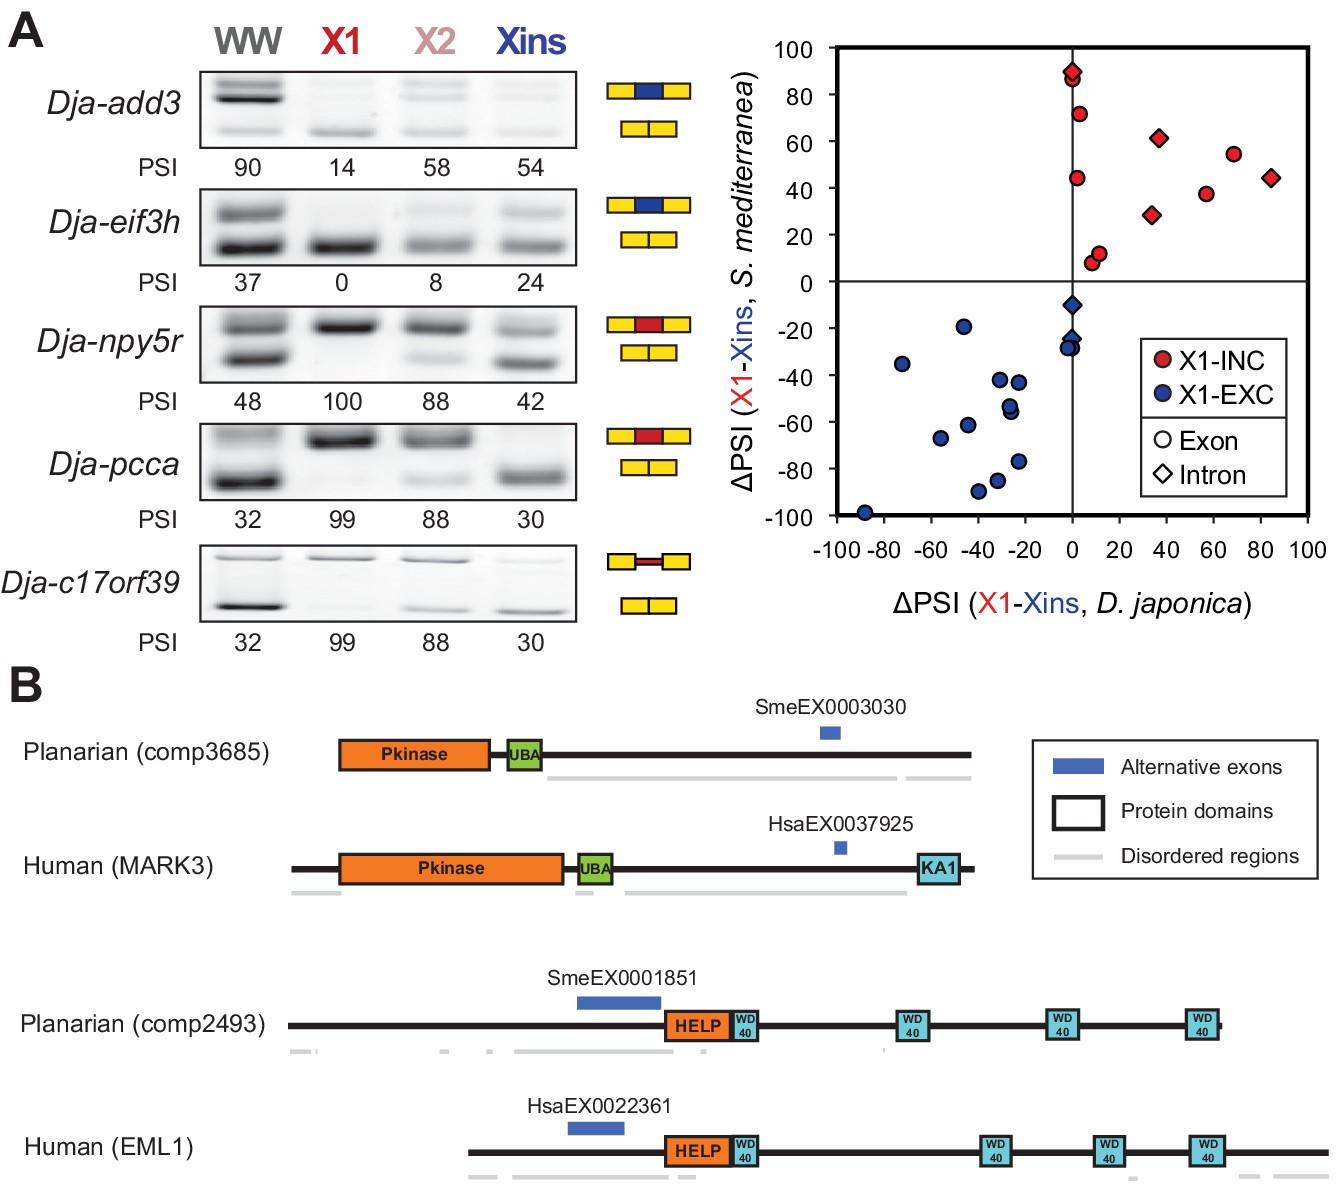
The neoblast-specific AS program is extensively conserved in D. japonica.
(A) Left: representative RT-PCR assays monitoring AS patterns for five representative neoblast-differential AS events in FACS isolated cell fractions from D. japonica. Scatter plot shows correspondence between ΔPSI (X1-Xins) estimates by RT-PCR in S. mediterranea and D. japonica for 21 cassette exons (circles) and 6 retained introns (diamonds). Conservation of regulation is observed for both alternative sequences with higher ('X1-inc', red) and lower ('X1-exc', blue) inclusion in neoblasts. (B) Schematic examples of the occurrence of neoblast-differential AS (blue bars) with respect to protein domain organization in two pairs of gene homologues in human and planarian. The examples show that AS events fall in similar protein regions in both human and planarian orthologs.
-
Figure 3—source data 1
Orthologous gene groups with neoblast/ESC-differential exons in both planarian and humans.
- https://doi.org/10.7554/eLife.16797.012
-
Figure 3—source data 2
Conservation of stem cell-differential AS events.
(A) Comparison between S. mediterranea and D. japonica AS. (B) Comparison between planarian and human stem cell regulated AS (Refers to Figure 3—source data 1)
- https://doi.org/10.7554/eLife.16797.013
Figure 4 with 2 supplements
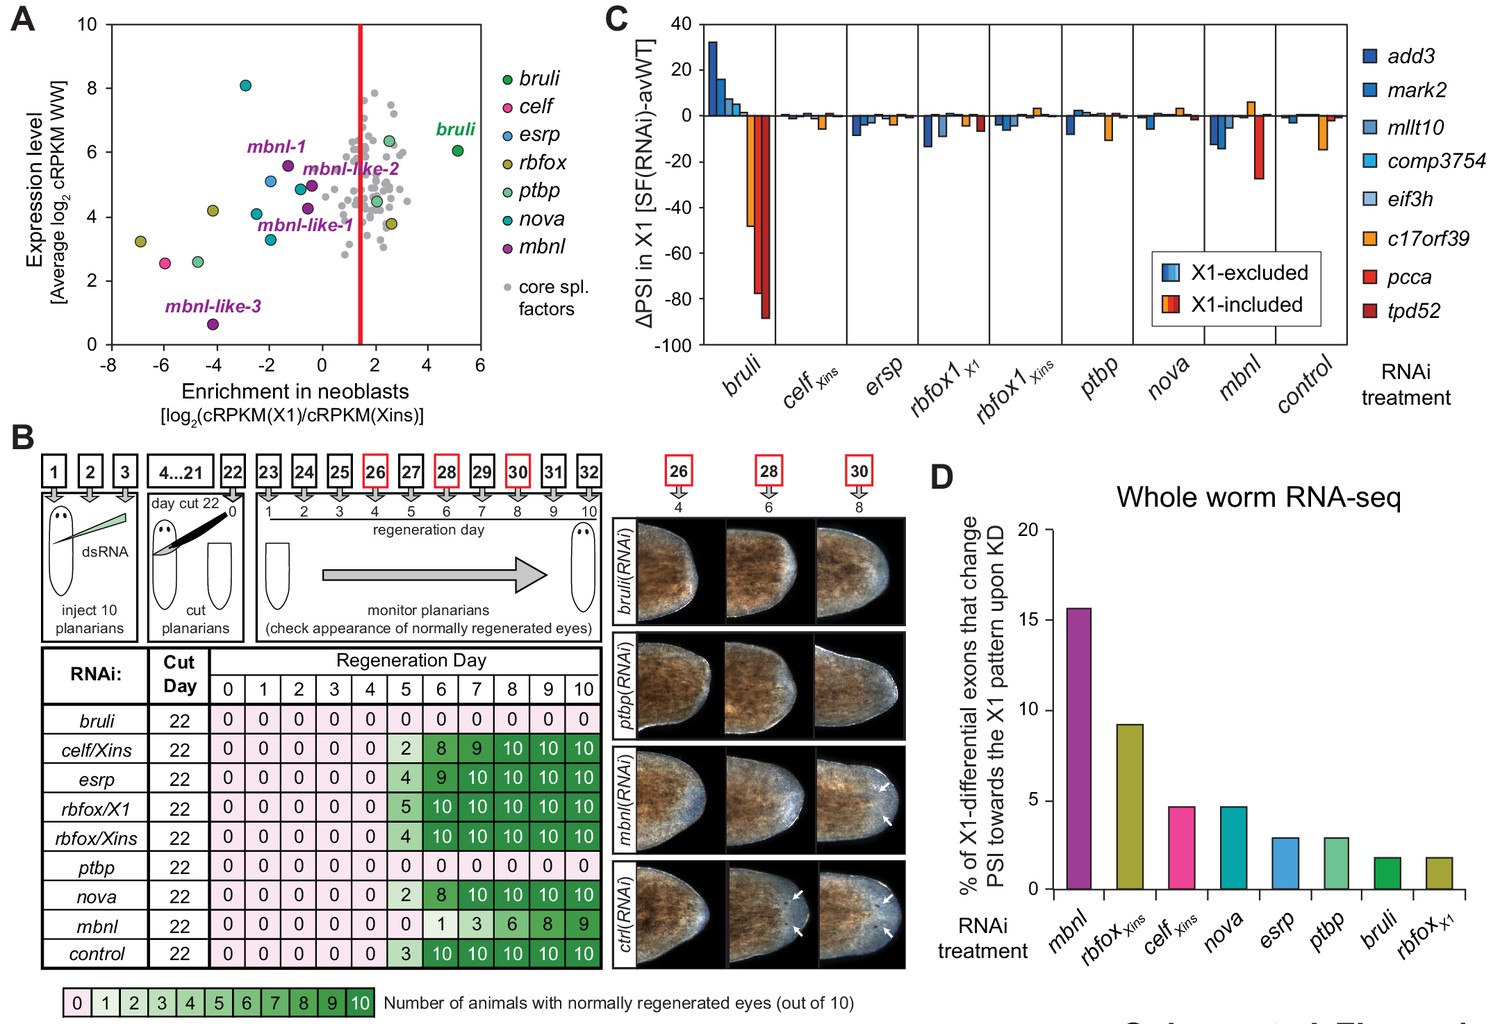
Identification of bruli and mbnl as major regulators of neoblast-specific AS.
(A) Scattered plot highlighting differential gene expression for selected tissue-specific AS factors in planarians. X-axis: differential gene expression in X1 vs Xins cell fractions for selected AS factors (color dots) and core spliceosomal components (grey dots). The red line is the median enrichment value for the core spliceosomal components. An AS factor is thus considered to be enriched in X1 or Xins fractions if it is located to the right or to the left of this line, respectively. Y-axis: gene expression levels in whole worms (WW), using the cRPKM metric. (B) Test of regeneration speed after head ablation upon AS factor knockdown. Identification of normally looking eyespots was used as proxy for complete regeneration for 10 individuals per experimental condition. (C) ΔPSI estimates in X1 cell fractions by RT-PCR for two X1-included exons (red), one X1-included retained intron (c17orf39, orange) and five X1-excluded exons (blue) 10 days after RNAi treatment with dsRNA coding for AS factor combinations. ΔPSI values for each event and experiment are calculated respect to the average PSIs in three wild type samples. (D) Percent of neoblast-differential exons with sufficient read coverage that change their inclusion levels (ΔPSI ≥ 15) in whole worms towards the X1 pattern (as expected for a negative regulator of neoblast-differential AS) upon knockdown of each AS factor.
-
Figure 4—source data 1
Annotation of RBPs in planarians.
- https://doi.org/10.7554/eLife.16797.015
-
Figure 4—source data 2
Annotation of spliceosomal components in planarians.
- https://doi.org/10.7554/eLife.16797.016
-
Figure 4—source data 3
Single and multiple splicing factor knockdown RNAi groups.
- https://doi.org/10.7554/eLife.16797.017
Figure 4—figure supplement 1
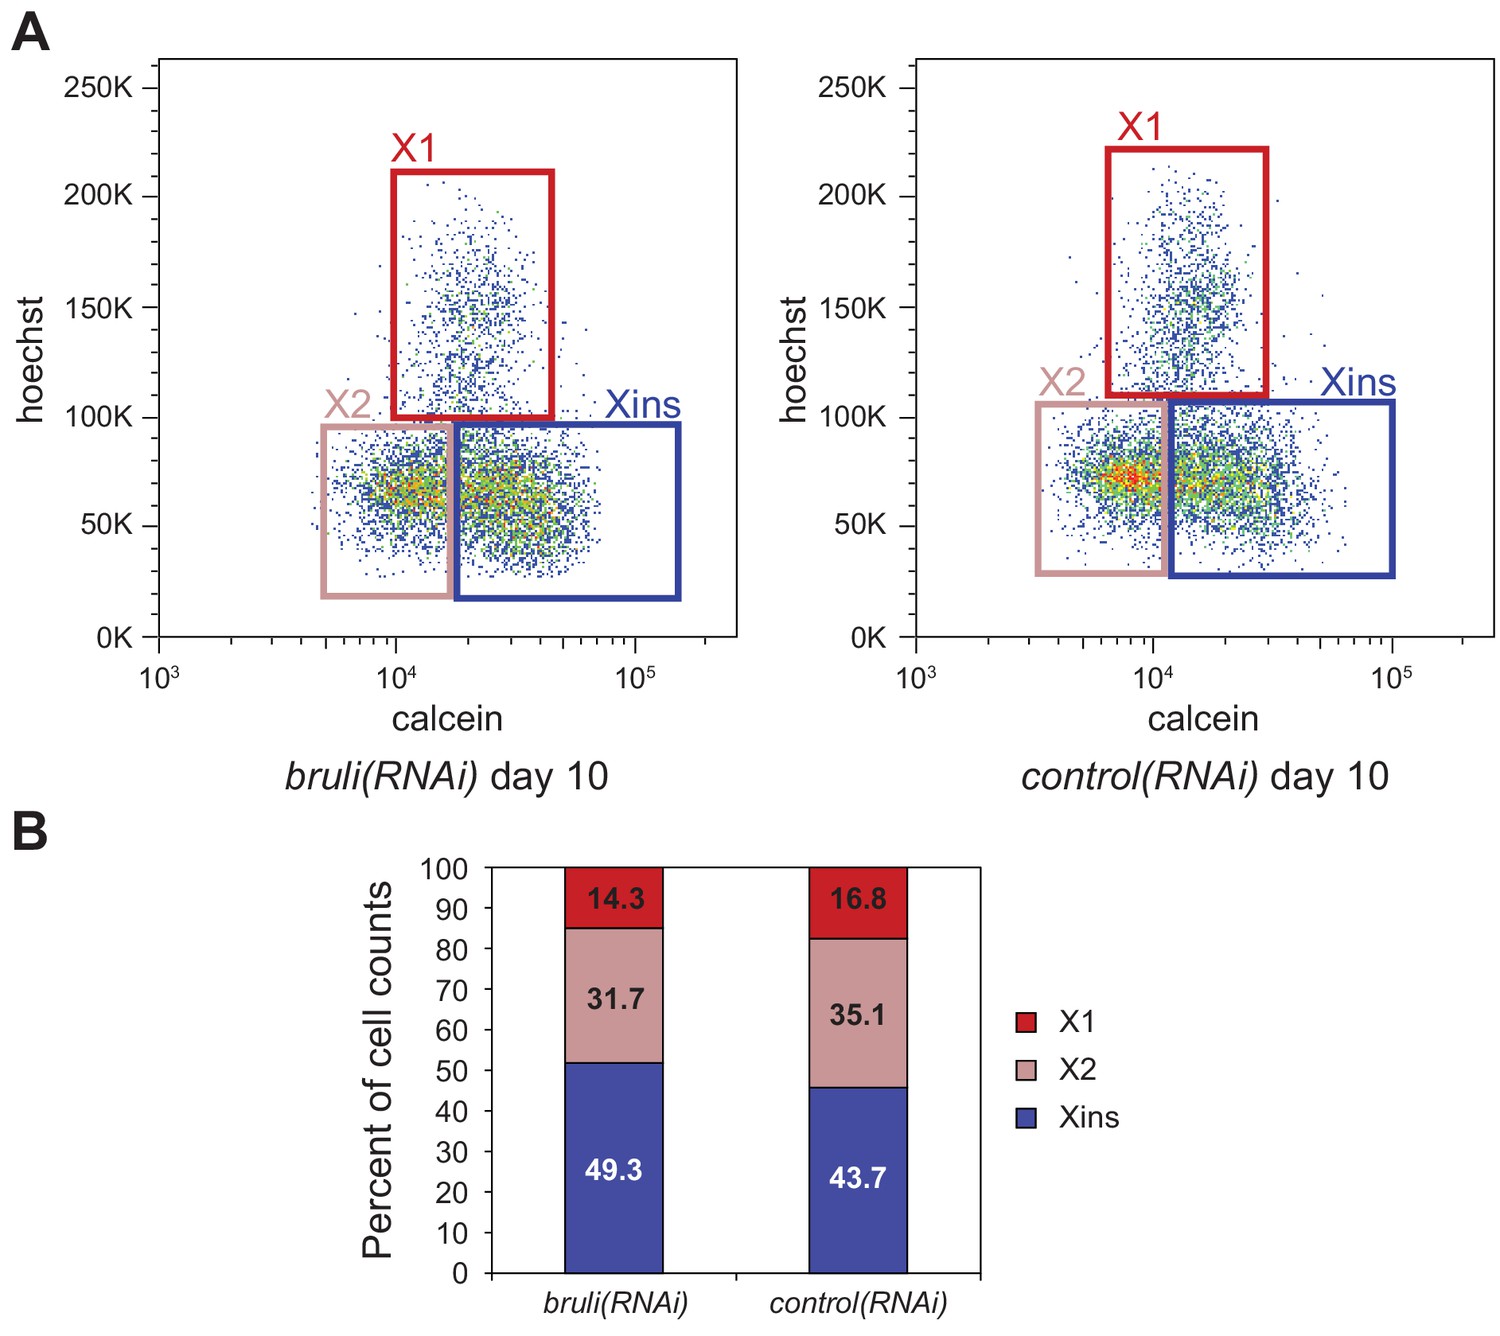
Identification of bruli and mbnl as major regulators of neoblast-specific AS.
(A) FACS scatter plots for bruli and control RNAi treated animals 10 days after RNAi inyection. (B) Proportion of cells in X1, X2 and Xins fractions 10 days after bruli and control RNAi treatment.
Figure 4—figure supplement 2
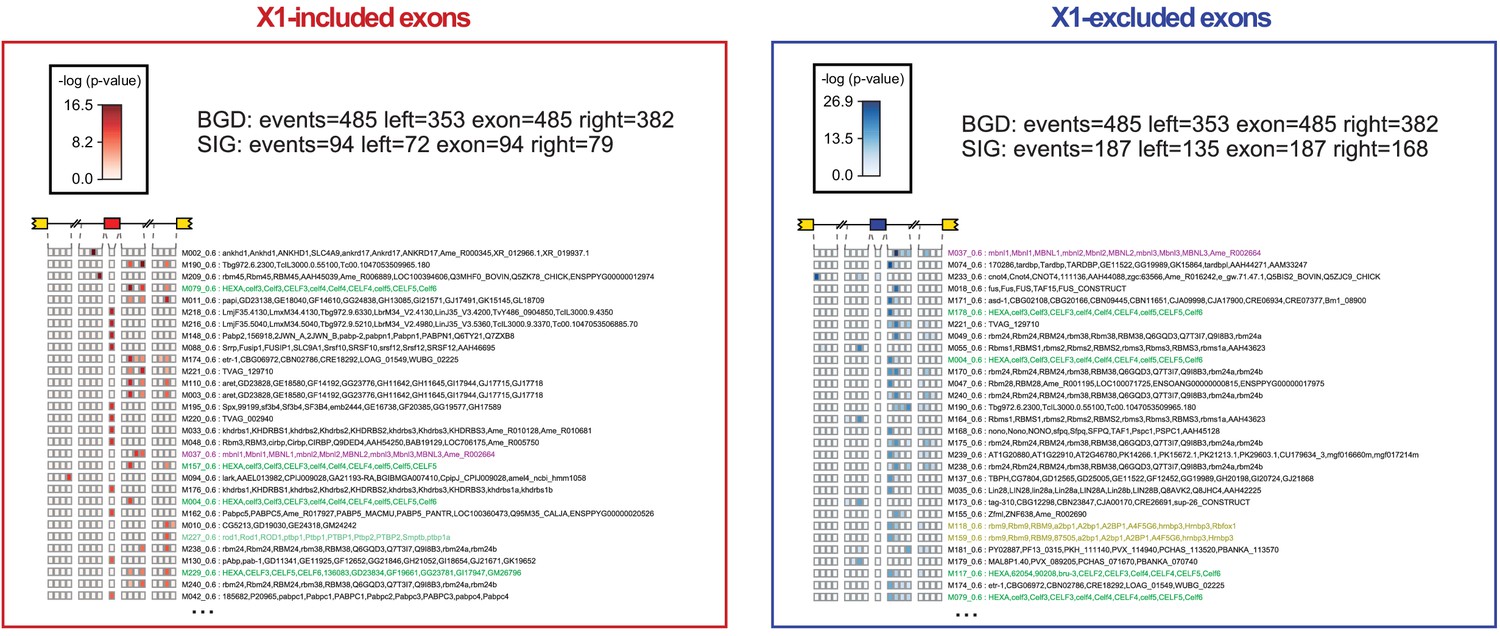
Enrichment of RBP binding motifs associated with neoblast-differential exons.
Motif enrichment analyses for all RNAcompete-derived motifs (Ray et al., 2013) for neoblast-differential alternatively spliced exons with increased or decreased inclusion in X1 fraction. Each intronic box corresponds to a 20-nucleotide bin at the indicated location with respect to the AS exon. The whole exonic sequence was evaluated as a single bin. In each box, counts of the top 10% most strongly bound 7-mers were compared between the AS set of interest and a non-regulated background set. Colors encode significance of enrichment: log10 P-value Fisher's exact test.
Figure 5 with 2 supplements
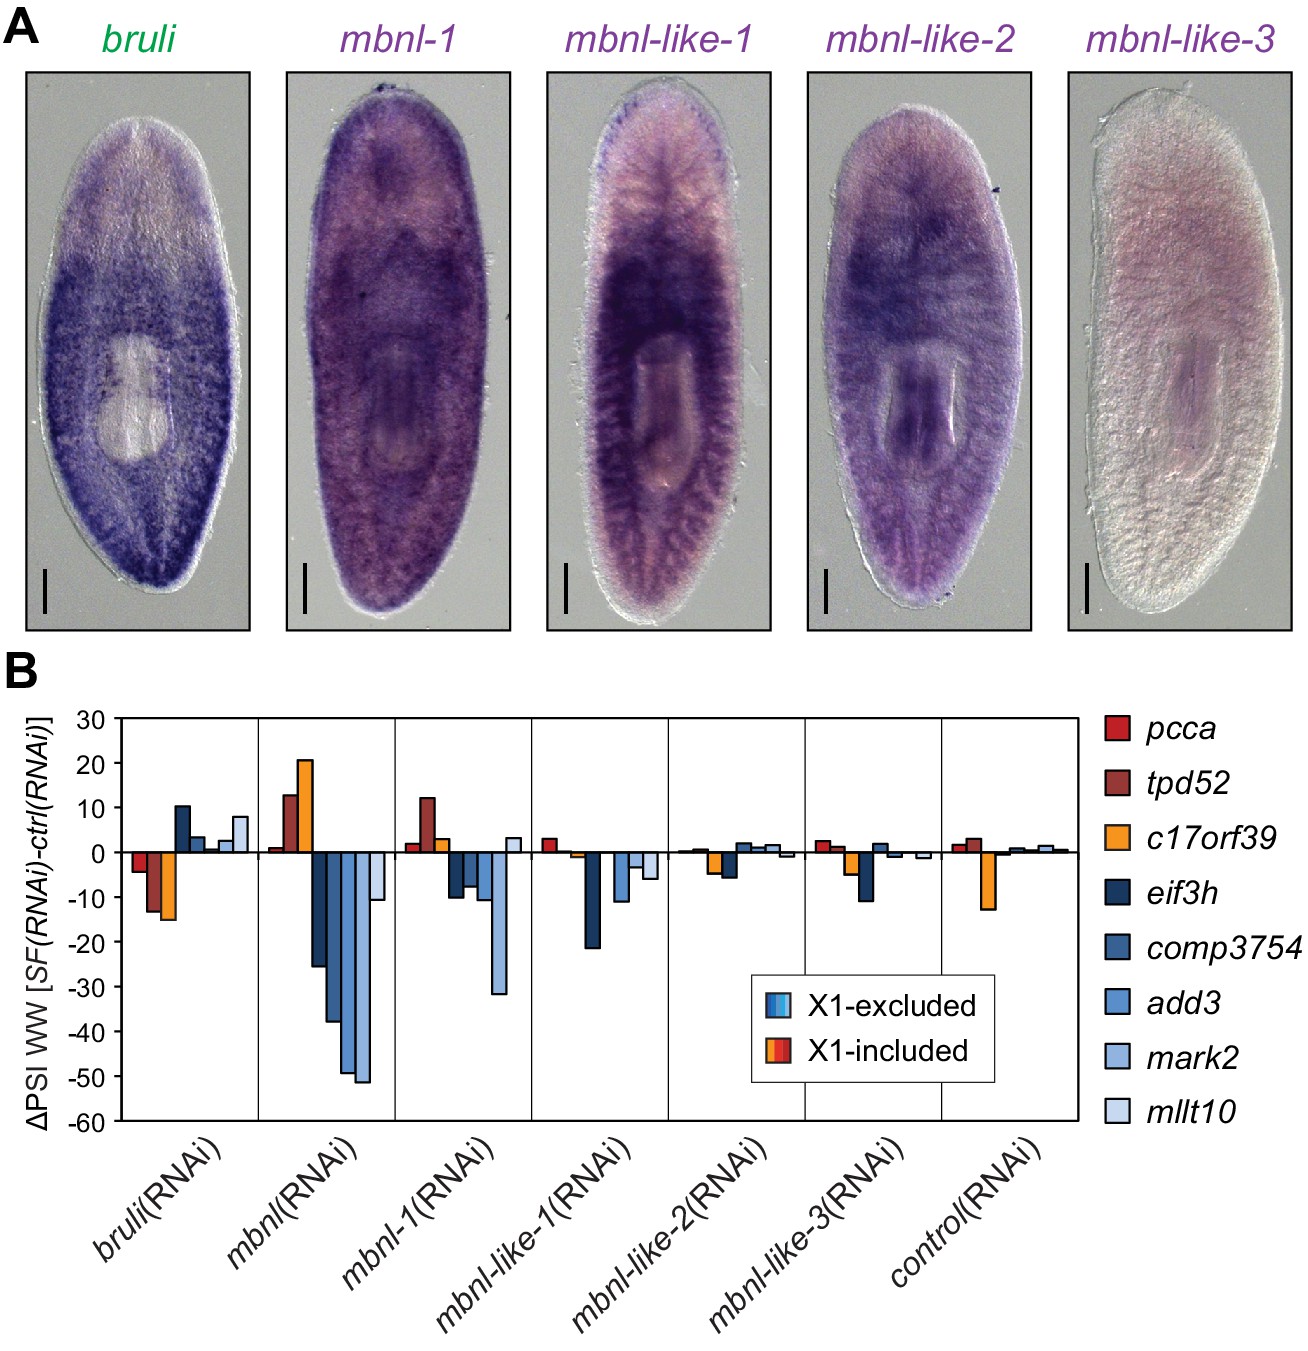
Combined mbnl knockdown has stronger effects than individual knockdown.
(A) Whole worm in situ hybridization for bruli, mbnl-1 and mbnl-like1, 2 and 3. Scale bar is 0.5 mm. (B) ΔPSI in whole worm estimates by RT-PCR for two X1-inc exons (red), one X1-inc retained intron (c17orf39, orange) and five X1-exc exons (blue) 10 days after RNAi treatment with dsRNA coding for bruli, mix of dsRNAs against the four mbnl genes [mbnl(RNAi)], mbnl-1, mbnl-like-1, mbnl-like-2, and mbnl-like-3. Two independent controls samples were included; ΔPSI values are relative to the first control sample.
Figure 5—figure supplement 1

BRULI and MBNL factors domain architecture and effects on regeneration and alternative splicing.
(A-B) Amino acid sequence (A) and schematization of protein domains (B) of BRULI, MBNL-1, MBNL-LIKE-1, MBNL-LIKE-2 and MBNL-LIKE-3. RRM1 domains are depicted in green and Zinc-finger domains in magenta, and their CCCH aminoacids indicated in red. The X1-inc alternative exon of mbnl-1 is depicted in cyan. (C) Sequence identity matrix between planarian and human CELF RRM1 (top) and MBNL ZnF (bottom) domains.
Figure 5—figure supplement 2

bruli and mbnl factors effects on regeneration and alternative splicing.
(A) The effects of bruli and mbnl knockdown and mbnl-1 single knock down are reproducible and dependent on the level of cut. Top: Workflow of the experiment: 10 animals per experimental group and time point were injected with dsRNA coding for bruli, gfp as a control and a mix of dsRNAs against the four mbnl genes and cut 22 days after RNAi; trunk and tail pieces were monitored independently. Two independent dsRNAs coding for different regions of mbnl-1 were used (mbnl-1 and mbnl-1*). The experiment was replicated twice independently. Bottom: Results of the scoring for trunk and tail regeneration experiments; color key is indicated below. (B) The effects of bruli and mbnl knockdown on AS events are detectable 5 days after RNAi and are permanent for at least 30 days: quantifications for two X1-inc exons (red), one X1-inc retained intron (c17orf39, orange) and five X1-exc exons (blue) 5, 10, 15, 20, 25 and 30 days after RNAi treatment with dsRNA coding for bruli, gfp as a control and a mix of dsRNAs against the four mbnl genes.
Figure 6 with 2 supplements
bruli and mbnl antagonistically regulate neoblast-specific AS.
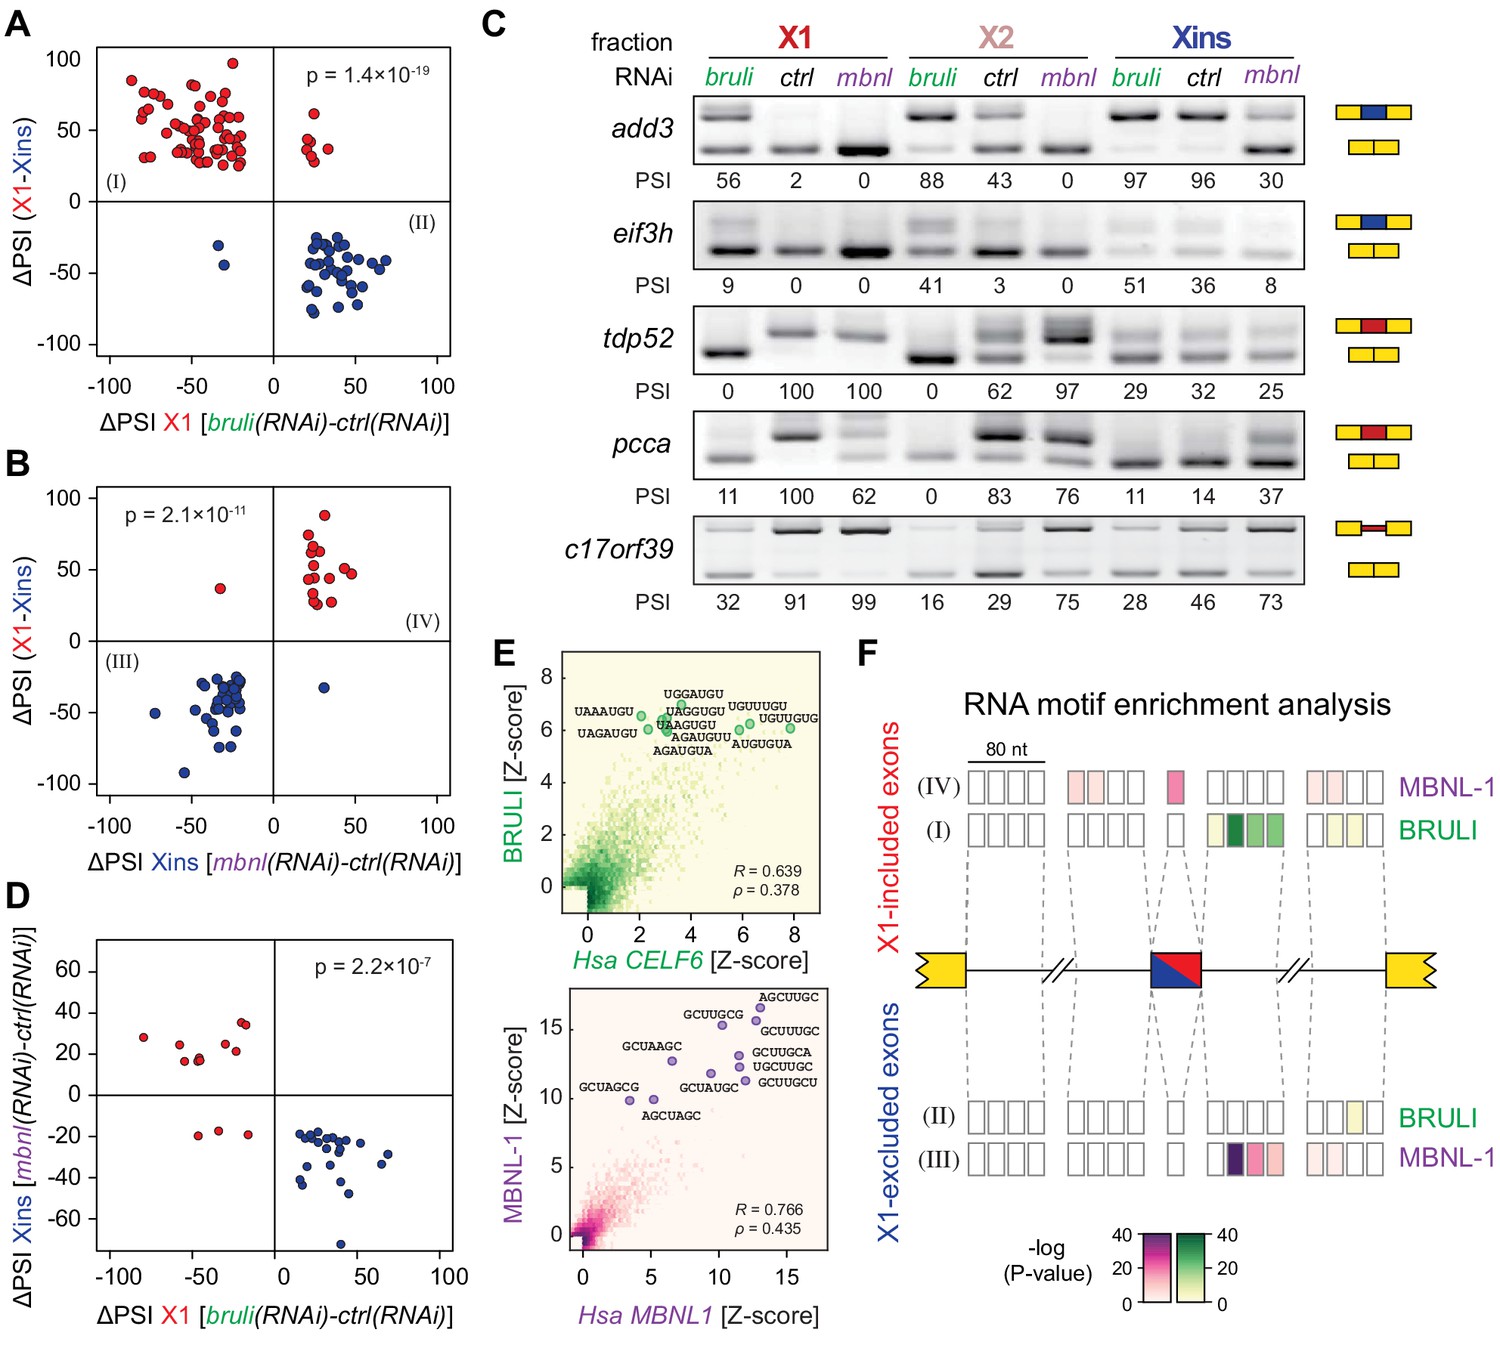
(A) High negative association (p<1.4 × 10⁻¹⁹, one-sided binomial test) between differences in inclusion levels (ΔPSI) of X1-differential AS events in X1 versus Xins fractions, and differences in bruli and control RNAi treated X1 fractions. Red/Blue dots correspond to X1-included/excluded AS events. (B) High positive association (p<2.1 × 10⁻¹¹, one-sided binomial test) between differences in inclusion levels (ΔPSI) of X1-differential AS events in X1 versus Xins fractions, and differences in mbnl and control RNAi treated Xins fractions. Only AS events with sufficient read coverage in the control and KD samples and an absolute ΔPSI>15 are plotted. (C) RT-PCR assays monitoring AS patterns for 5 representative X1-differential AS events in FACS isolated cell fractions treated with bruli, control or mbnl RNAi. (D) Most X1-differential AS events that are affected by both bruli and mbnl knockdown are regulated in an antagonistic manner (p<2.2 × 10⁻⁷, one-sided binomial test). (E) 2-dimensional histogram of RNA-compete 7-mer Z-scores, comparing the sequence-specific binding of planarian and human proteins. Unspecific 7-mers with Z-score <0 for both RBPs were excluded. ρ, Spearman rank correlation; R, Pearson correlation. Top 10 planarian motifs are highlighted. (F) Motif-enrichment analysis. Each intronic box corresponds to a 20-nucleotide bin at the indicated location relative to the AS exon (middle box). Color encodes the significance of enrichment (Fisher's exact test, Bonferroni corrected for the number of tested bins) of high affinity 7-mers for BRULI or MBNL, comparing each differentially spliced exon set with an unaffected background set. Exon sets (I-IV) correspond to those in quadrants indicated in panels B and C.
Figure 6—figure supplement 1
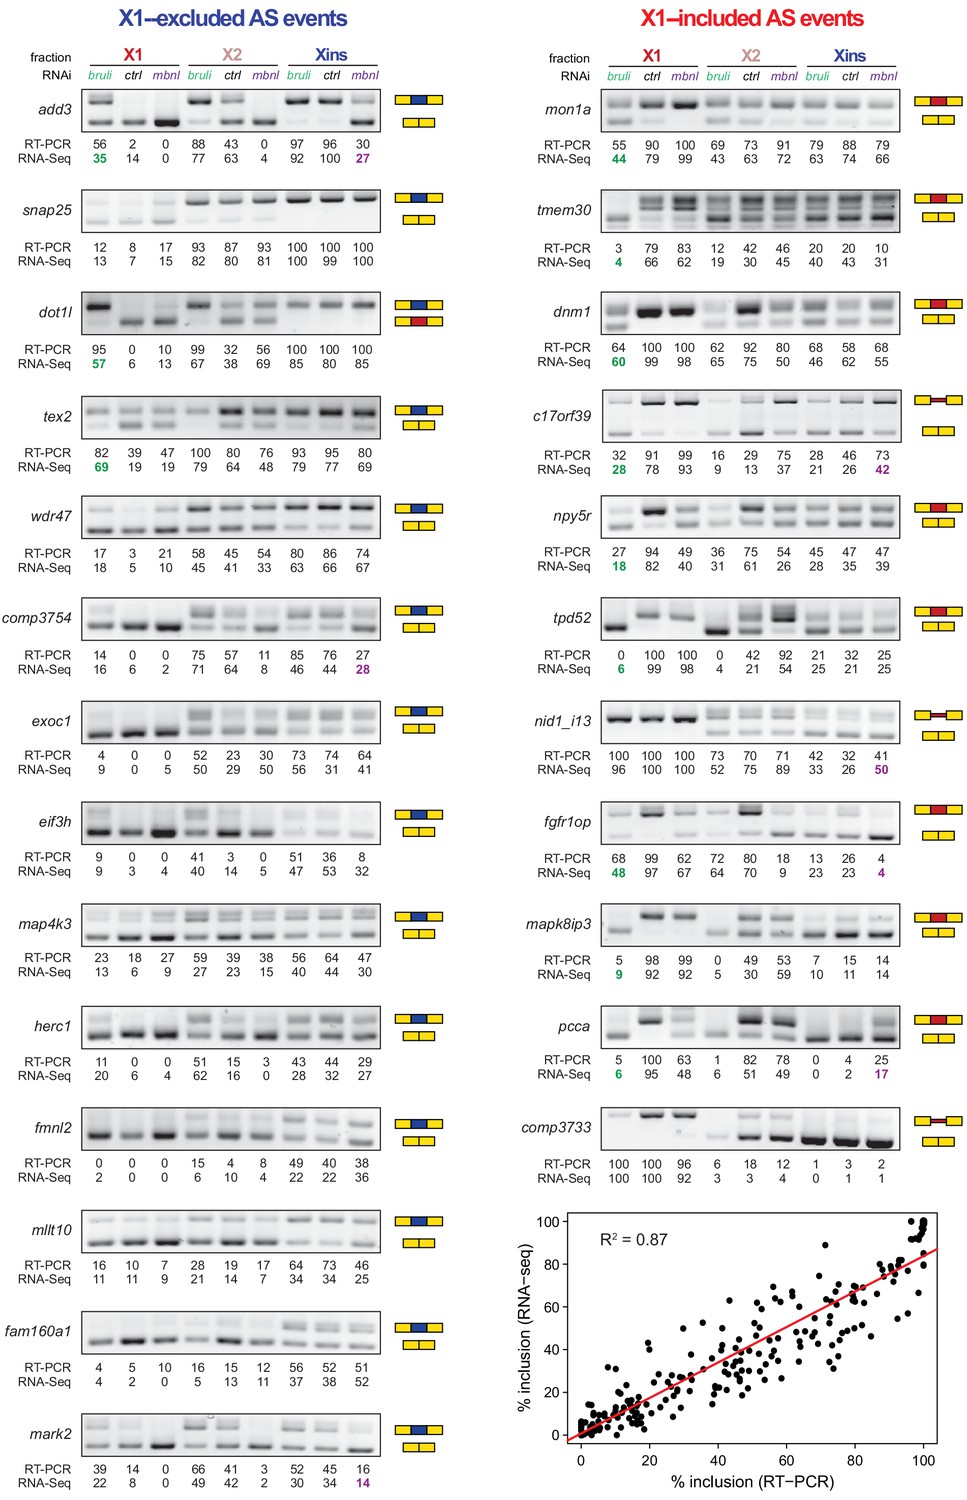
Examples of neoblast-differential AS events regulated by bruli and/or mbnl.
RT-PCR assays for 25 representative neoblast-differential exons and retained introns in X1, X2 and Xins fractions of worms treated with bruli, control or mbnl RNAi. Red and blue exons/introns indicate those exons/introns with higher and lower inclusion in X1 compared to Xins fractions, respectively. Scatter plot shows correspondence between inclusion level estimates by RNA-Seq and RT-PCR (R2 = 0.87, n = 225).
Figure 6—figure supplement 2
bruli and mbnl antagonistically regulate neoblast-specific AS.
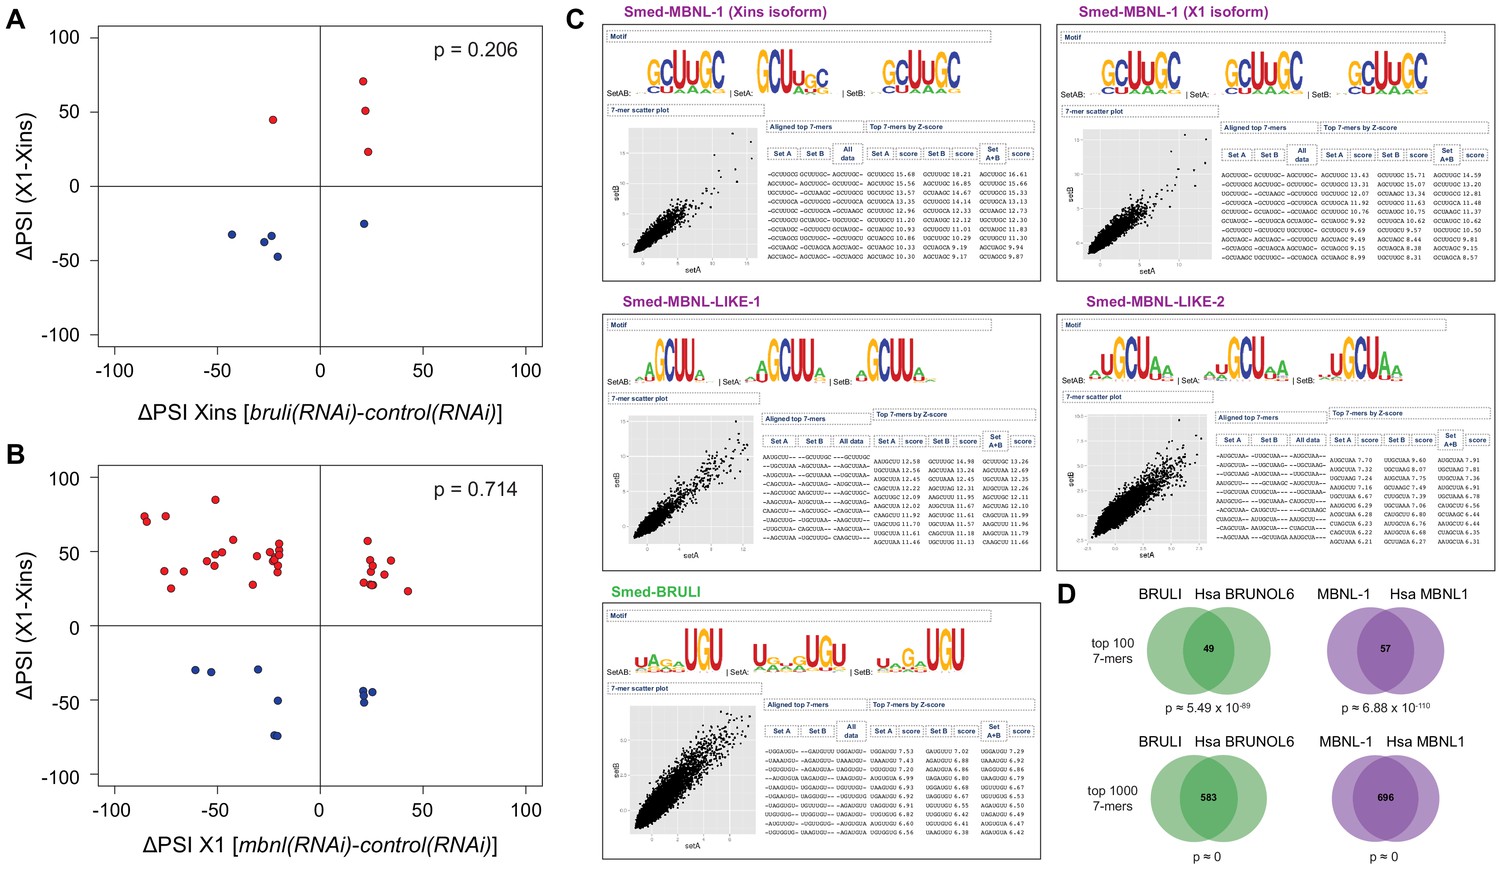
(A-B) bruli and mbnl have a minor impact on neoblast-differential AS events in Xins and X1, respectively: (A) Lack of association (p = 0.206, one-sided binomial test) between differences in inclusion levels (ΔPSI) of neoblast-differential AS events in X1 versus Xins fractions, and differences in bruli and control RNAi treated Xins fractions. (B) Lack of association (p = 0.714, one-sided binomial test) between differences in inclusion levels (ΔPSI) of neoblast-differential AS events in X1 versus Xins fractions, and differences in mbnl and control RNAi treated X1 fractions. (C) RNAcompete-derived motifs for BRULI and MBNL proteins. Top-scoring RNA-binding 7mers and corresponding logos identified by RNAcompete analysis are shown for MBNL-1 (excluding a neoblast-differential exon; Xins isoform), MBNL-1 (including a neoblast-differential exon; X1 isoform), MBNL-LIKE-1, MBNL-LIKE-2, and BRULI. Scatterplots show the correlation between 7-mers Z-scores derived from microarray data splits, SetA and SetB. Logos are created after aligning the top 10 highest scoring 7-mers. Both isoforms of MBNL-1 display similar binding preferences. RNAcompete retrieved simpler 4-mer or 3-mer containing GCU motifs for MBNL-LIKE-1 and MBNL-LIKE-2, which contain only one pair of zinc fingers. (D) Conserved binding specificities for planarian and human CELF and MBNL splicing factors: Venn diagrams showing the overlap of RNA-compete 7-mers, comparing the top 100 (top) and the top 1000 (bottom) 7-mers of planarian and human proteins. P-values correspond to hypergeometric tests.
Figure 7 with 2 supplements
bruli and mbnl antagonistically regulate neoblast biology.
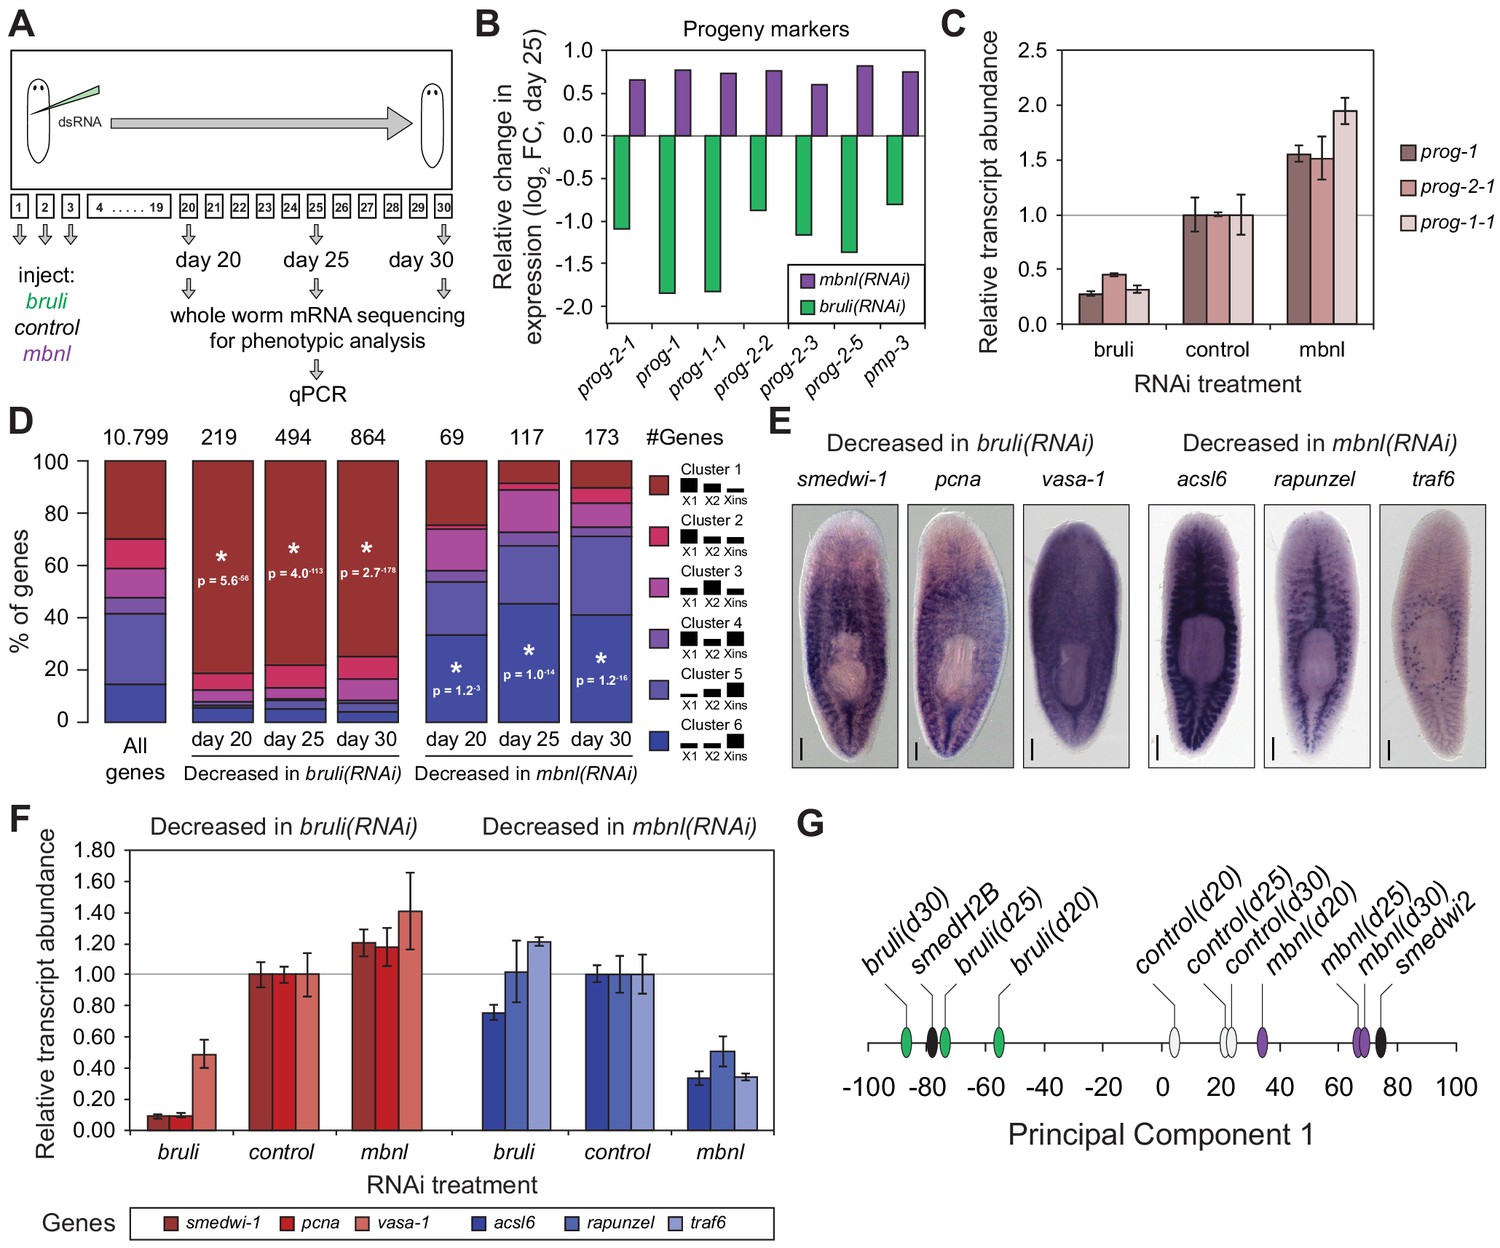
(A) Schematic representation of phenotypic analysis experiments. (B) Gene expression changes estimated by RNA-Seq of several progeny markers 25 days after bruli (green) or mbnl (purple) RNAi treatment compared to controls. (C) Quantification of gene expression levels by qPCR of prog-1, prog-2-1, and prog-1-1 in whole worms 25 days after treatment with bruli, control or mbnl RNAi. (D) Proportion of genes belonging to each of the 6 clusters defined in (Onal et al., 2012) based on their X1vs Xins enrichment that are decreased 20, 25 and 30 days after bruli and mbnl RNAi treatment. P-values correspond to hypergeometric tests for Clusters 1 (P = 5.6 × 10−56, P = 4.0 × 10−113, P = 2.7 × 10−178, for bruli(RNAi) days 20, 25 and 30, respectively) and 6 (P = 1.2 × 10⁻³, P = 1.0 × 10⁻¹⁴, P = 1.2 × 10⁻¹⁶, for mbnl(RNAi) days 20, 25 and 30, respectively). All other tests were not significant. Black histograms on the right side indicate schematically, for each cluster, the relative gene expression levels in each cell fraction. (E) In situ hybridization of three representative Cluster 1 (red bars) and Cluster 6 (blue bars) genes in whole worms. (F) qPCR-based gene expression estimates of three representative Cluster 1 (red bars) and Cluster 6 (blue bars) genes in whole worms 25 days after bruli, control or mbnl RNAi. (G) Principal Component 1 separates transcriptomes from bruli RNAi treated samples together with Smed-H2B(RNAi)(which affects neoblast self-maintenance) from mbnl RNAi treated samples together with Smedwi-2(RNAi)(which impairs neoblast differentiation).
Figure 7—figure supplement 1
bruli and mbnl knockdown have contrasting effect of specific gene markers.
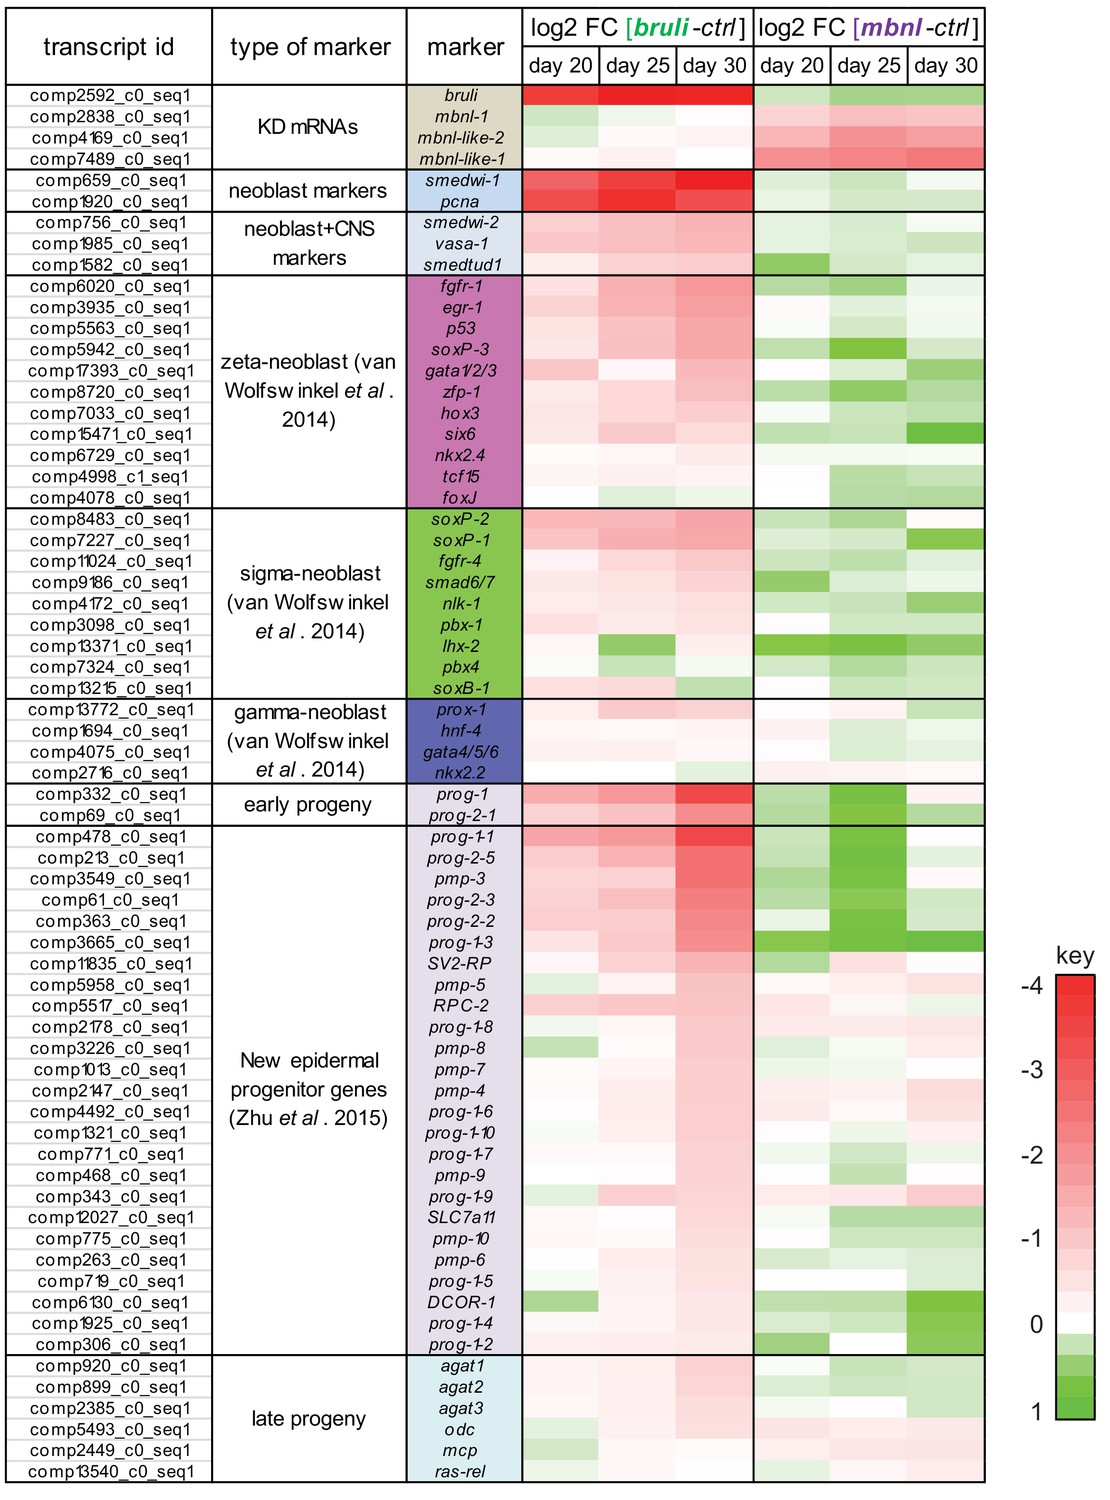
Log2 fold change in gene expression of key markers 20, 25 and 30 days after bruli (left) or mbnl (right) treatment, measured from RNA-Seq. Red/Green intensities indicate different levels of down/up regulation. bruli and mbnl knockdown have distinct effects on different types of markers. In particular, they show antagonistic effects of 'Early progeny' markers.
Figure 7—figure supplement 2
Gene Ontology analysis of genes downregulated upon bruli and mbnl knockdown.
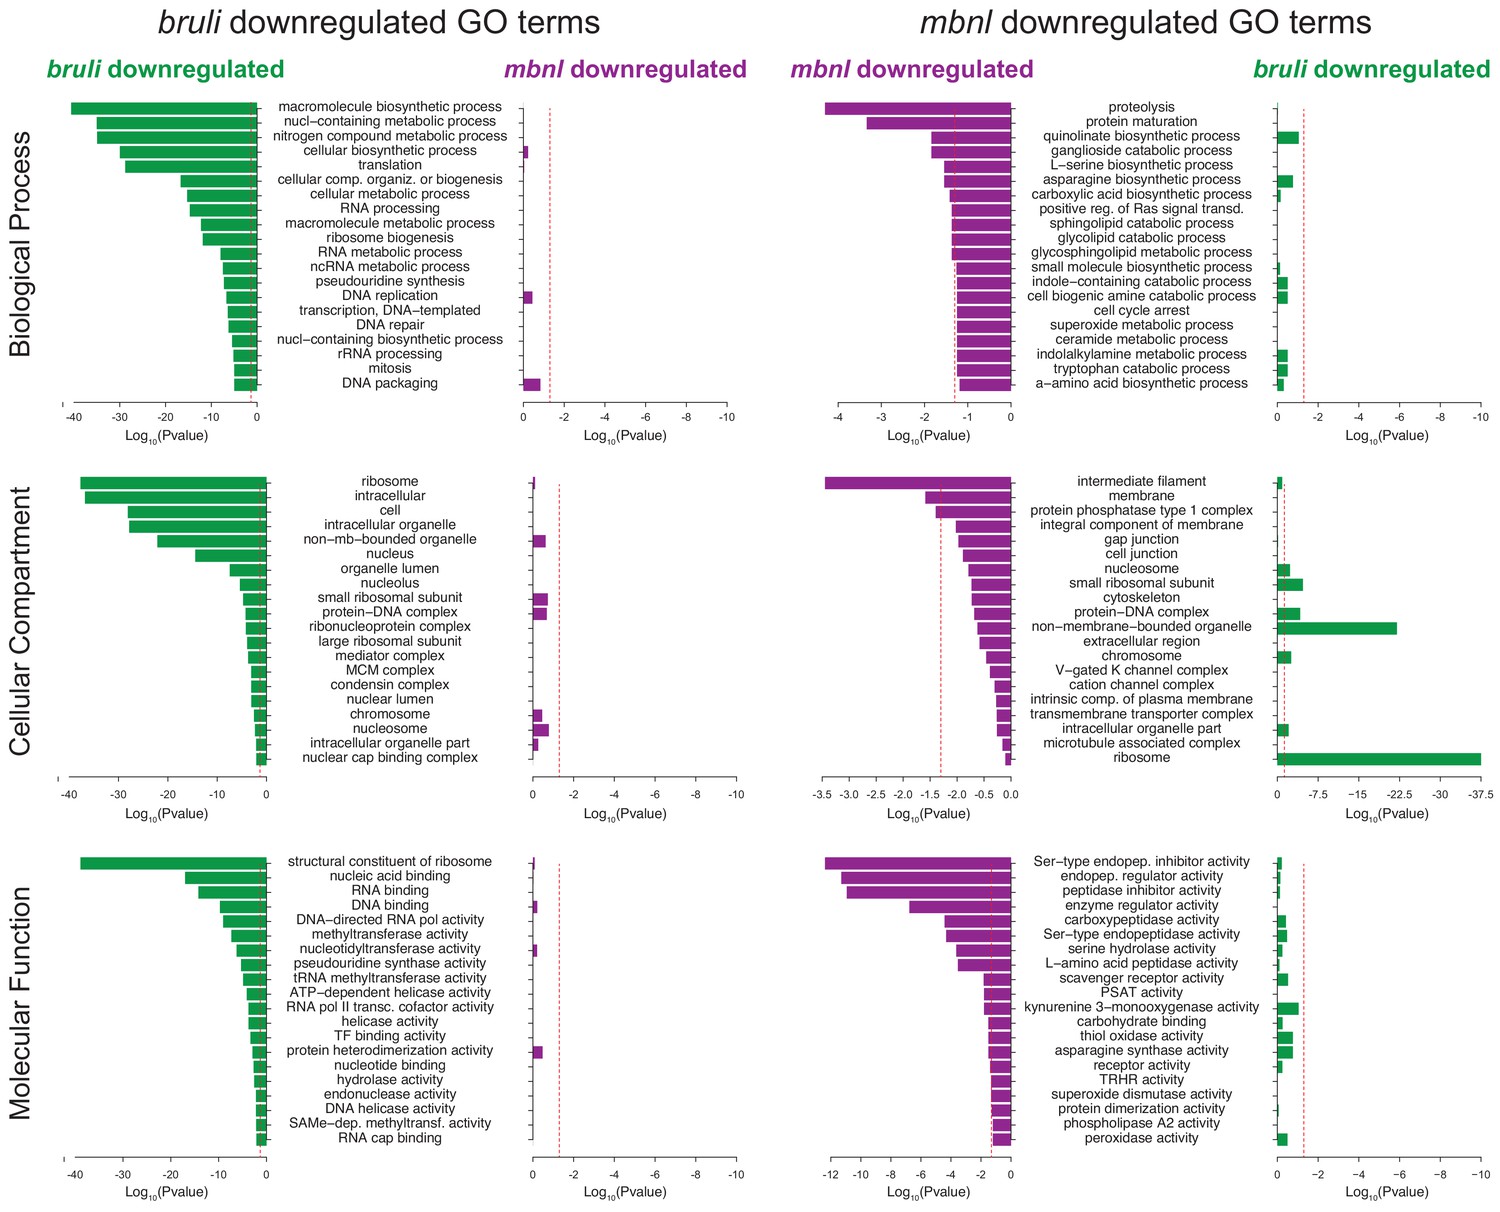
Gene ontology enrichment analysis for 'Biological Process', 'Molecular Function' and 'Cellular Component' terms of genes downregulated upon bruli and mbnl knockdown was performed for genes that were significantly downregulated after treatment with bruli (green) or mbnl (red) RNAi.
Figure 8
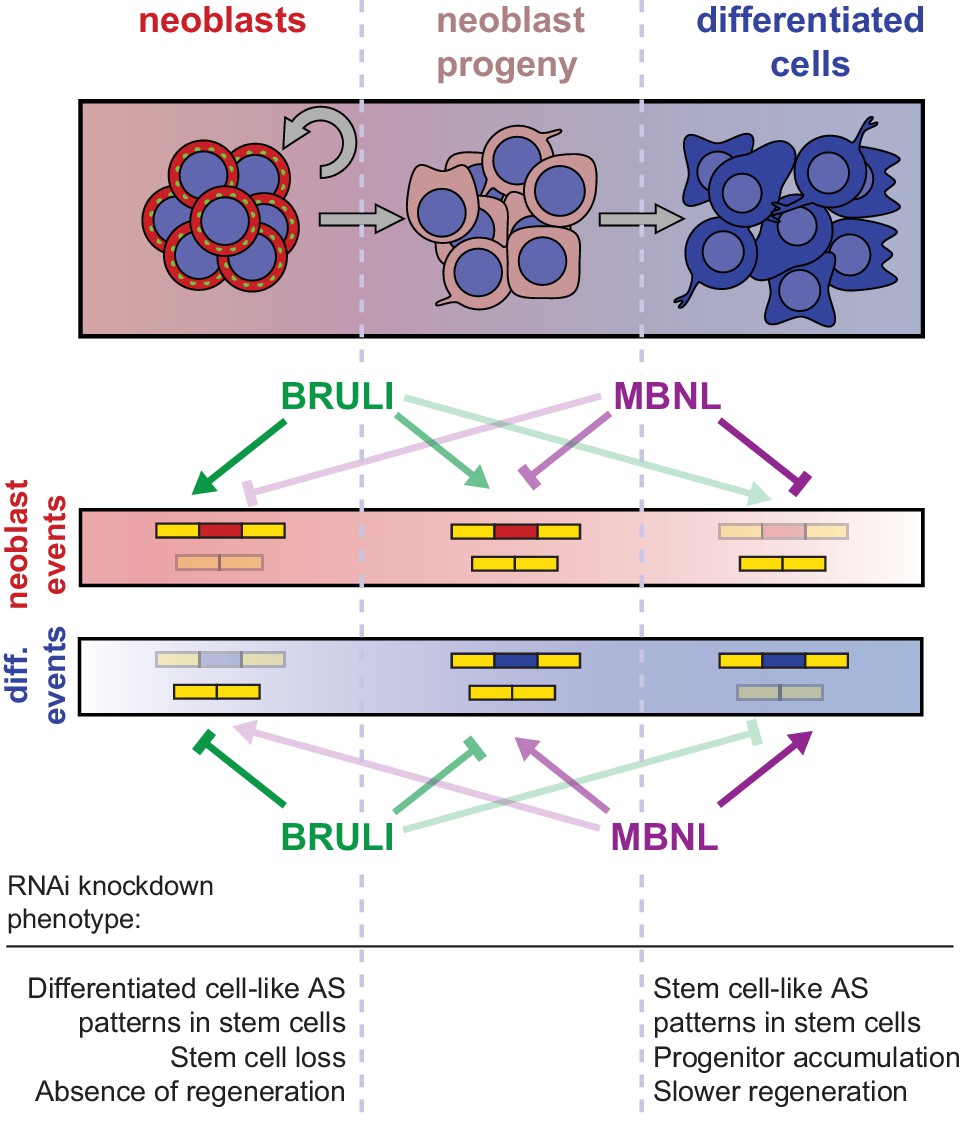
Model for BRULI and MBNL regulation of neoblast-specific AS.
Schematic representation of BRULI and MBNL regulation of AS in different planarian cell fractions and respective RNAi mediated knockdown phenotypes.
Additional files
-
Supplementary file 1
List of primers for RT-PCR AS events, RNA compete, dsRNA and probes and qPCRs.
- https://doi.org/10.7554/eLife.16797.030
Download links
A two-part list of links to download the article, or parts of the article, in various formats.
Downloads (link to download the article as PDF)
Open citations (links to open the citations from this article in various online reference manager services)
Cite this article (links to download the citations from this article in formats compatible with various reference manager tools)
Conserved functional antagonism of CELF and MBNL proteins controls stem cell-specific alternative splicing in planarians
eLife 5:e16797.
https://doi.org/10.7554/eLife.16797


