Insulin signaling controls neurotransmission via the 4eBP-dependent modification of the exocytotic machinery
- University of Texas Health Sciences Center at San Antonio, United States
Figures
Figure 1
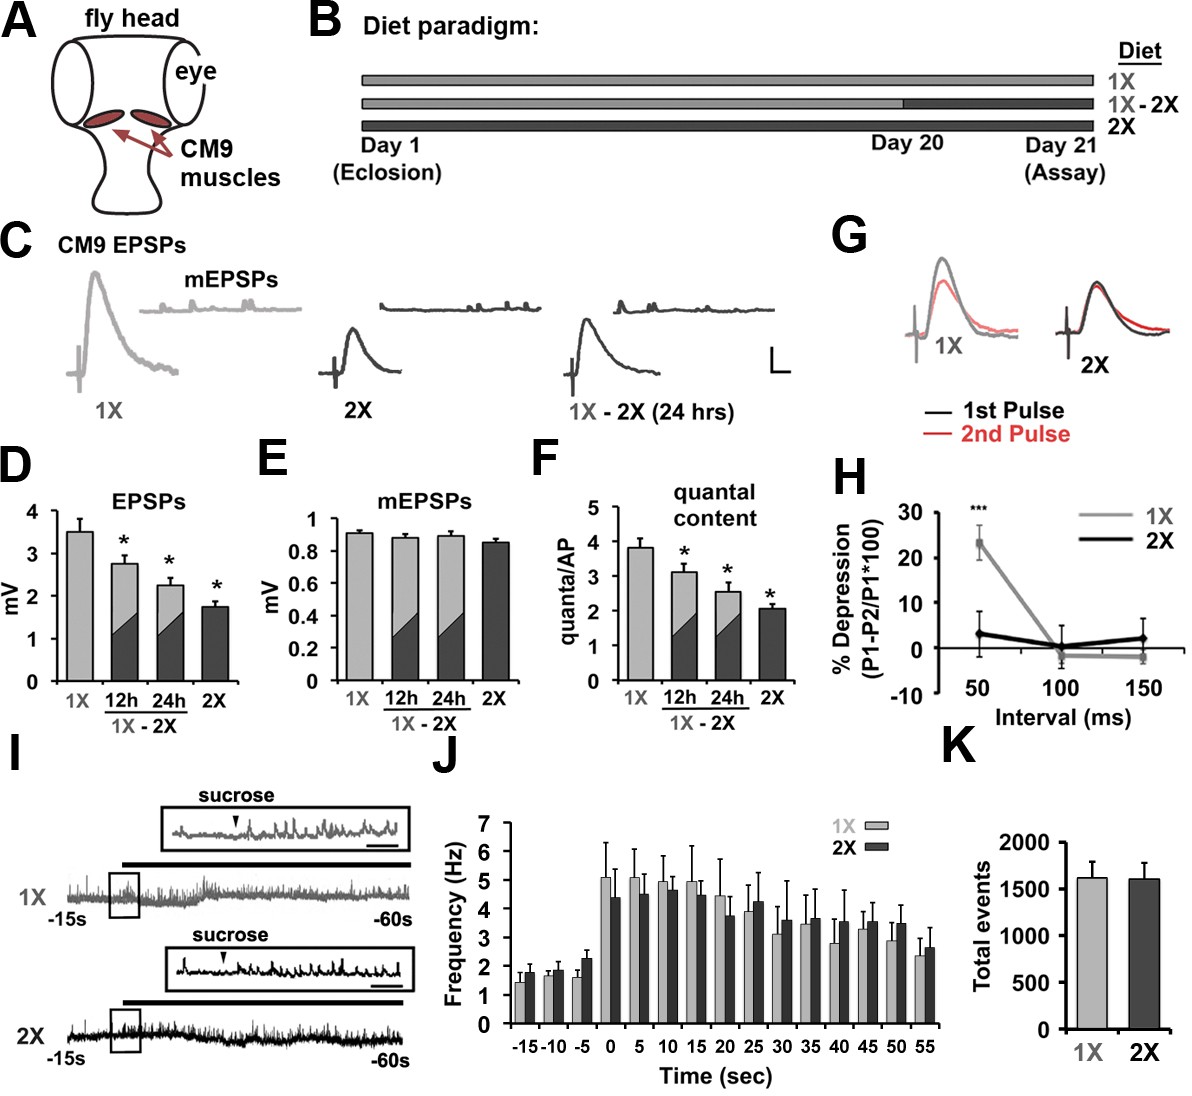
Effects of dietary protein concentrations on neurotransmission at the CM9 NMJ.
(A) Diagram of Drosophila head indicating the location of the Cibarial Muscle 9 (CM9). (B) 21-day feeding paradigm used for the analysis of dietary effects on neurotransmission. Animals were raised for 21 days on a low-protein diet (1X = light gray), a high-protein diet (2X = dark gray), or subjected to a shift from a low-protein diet (1X) to a high-protein diet (2X) on day 20 (1X-2X). (C) Representative traces of evoked CM9 EPSPs and spontaneous miniature EPSPs (CM9 mEPSPs) from electrophysiological recordings of CM9 muscle fibers from flies subjected to the indicated dietary conditions. Scale = 1 mv, 10 ms. (D–F) Graphs represents the mean values for evoked EPSPs (D), mEPSPs (E), and quantal content (F) determined from recordings of CM9 muscle fibers from flies subjected to the indicated dietary condition or subjected to a diet shift (1X-2X) for 12 or 24 hr. Error bars = s.e.m. *p<0.05 determined using ANOVA. (G) Example traces of evoked EPSPs from paired-pulse experiments utilizing an inter-pulse interval (IPI) of 50 ms. (H) Graph represent the mean percent depression at indicated IPI. Error bars = s.e.m. **p<0.01, Student’s t-test. (I) Representative traces of electrophysiological recordings of hyperosmotic-induced spontaneous release events from CM9 NMJs in animals raised for 21 days on indicated diet conditions incubated in hyperosmotic recording saline. Inserts represent broader timescale of boxed regions from traces. Scale = 1 s. (J) Histogram representing the spontaneous event frequency and K, the average number of total spontaneous release events observed during 1 min of hyperosmotic recordings.
-
Figure 1—source data 1
File contains the values represent the average value for the spontaneous release events per second determined in 5 s increments during the hypertonic stimulation of synaptic vesicle fusion at CM9 NMJs in animals raised on a 1X or 2X diet presented in Figure 1J.
Values for each animal (n = 7) are shown with time bins indicating time relative to the application of hypertonic recording solution. The results of Student’s t-tests for each 5-s time bin and the Kolmogorov-Smirnov test of the distributions are presented with data set.
- https://doi.org/10.7554/eLife.16807.004
Figure 2 with 2 supplements

Insulin/DILP signaling negatively regulates presynaptic release at the CM9 NMJ.
(A) Images from a proboscis extension reflex (PER) in response to tarsal stimulation with 0.5 M sucrose. Circle indicates location of sensory bristles tracked during the extension event resulting in an extension path (red line in panel iv) that is used for analysis of velocity. (B and C) Graphs represent the mean values for (B) average velocity and (C) max velocity for indicated genotypes and dietary conditions. All RNAi knock-downs utilize the Gal4:UAS binary expression system by combining the transgenic UAS construct (i.e. UAS-4eBPRNAi) with the CM9 motor neuron-specific E49-Gal4 driver. *p<0.05 versus 1X controls determined using ANOVA. Error bars = s.e.m. (D) Pathway represents the putative effects of insulin signaling on SV exocytosis. (E, F) CM9 EPSP traces of indicated genotype and dietary condition demonstrating the requirement for 4eBP on neurotransmission in animals raised on the 1X and 2X diets. Scale bar = 1 mV, 10 ms. (G–I) Graphs represent the average values for CM9 EPSPs (G), mEPSPs (H), and quantal content (I) determined from CM9 recordings from 21-day-old flies of indicated genotypes raised on indicated dietary conditions. Error bars = s.e.m. * indicates values significantly different from all other values determined using ANOVA (p<0.01). (J) CM9 EPSP traces of indicated genotype and dietary condition demonstrating the requirement for chico on neurotransmission in animals raised on the 1X and 2X diets. The effect of chico knock-down (chicoRNAi) on neurotransmission in animals raised on a 2X diet is suppressed by knockdown of 4eBP consistent with 4eBP functioning downstream of Chico. Scale bar = 1 mV, 10 ms. (K and L) Graphs represent the average values of EPSPs (K) and quantal content (L) determined from CM9 recordings from 21-day old flies of indicated genotypes raised on indicated dietary conditions. Error bars = s.e.m. *p<0.05 versus 2X controls determined using ANOVA.
Figure 2—figure supplement 1

Effects of diet and neuronal insulin signaling on SV exocytosis at larval NMJ.
(A) Representative evoked EPSP and spontaneous mEPSP traces from larval muscle 6 in larval of indicated genotype and diet conditions. In these experiments, larvae were on indicated diets for the entire larval stage of development (~3 days). Genotypes: ctrl = OK6-Gal4/+; 4eBP RNAi = OK6-Gal4/+; UAS-4eBPRNAi/+; chico RNAi = OK6-Gal4/+; UAS-chicoRNAi/+. Scale bar = 10 mV, 250 ms (EPSPs); 2 mV, 50 ms (mEPSPs). (B and C) Graphs represent the mean values for EPSPs (B) and quantal content (C) recorded from the NMJs on muscle 6 in control and 4eBP knockdown larvae raised on 1X diet. Error bars = s.e.m. (D and E) Graphs represent the mean values for EPSPs (D) and quantal content (E) determined at the NMJs on muscle 6 in control and chico knockdown larvae raised on 2X diet. N = 8 animals (1 recording per animal) for each average. Error bars = s.e.m.
Figure 2—figure supplement 2
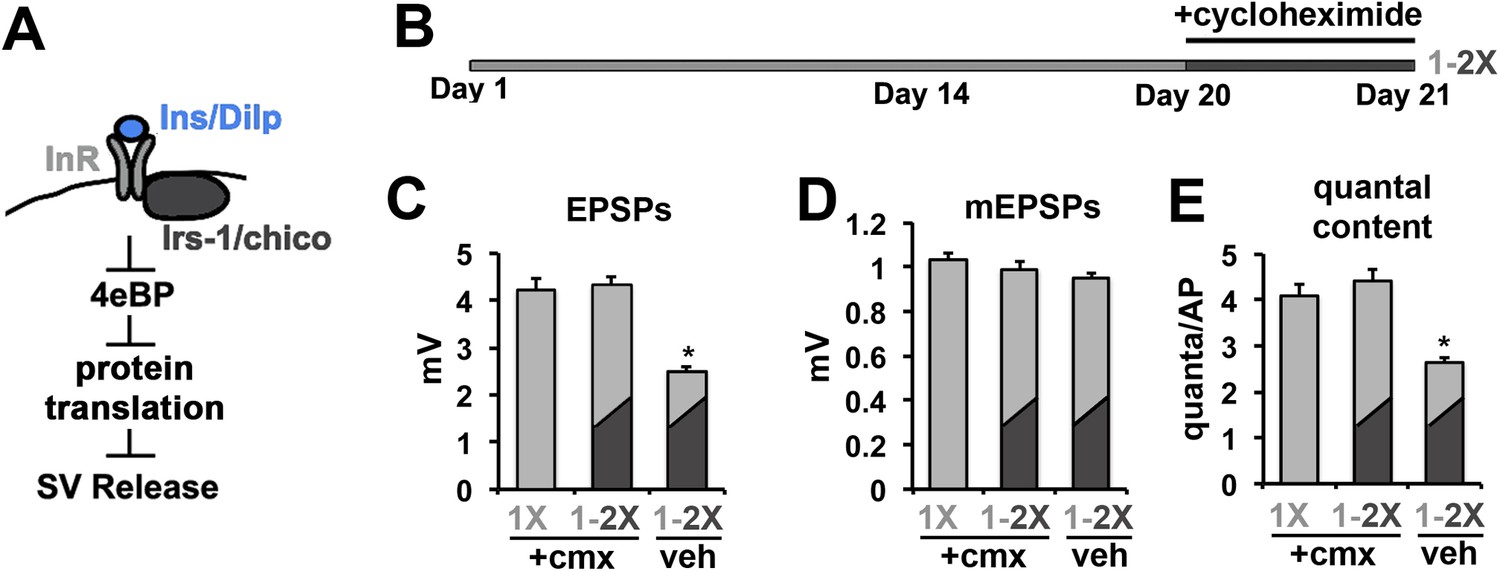
Cycloheximide blocks the effects of diet switch on SV exocytosis.
(A) Model of the translational regulation of SV exocytosis by insulin signaling via 4eBP. (B) 21-day diet shift paradigm for testing the effects of cycloheximide on neurotransmission. Flies were exposed to cycloheximide for 2 hr on 1X diet prior to switching to the 2X diet condition for 24 hr. Control flies consisted of cylcoheximide treated flies that are not subjected to diet switch or treated with vehicle. (C–D) Graphs represent the mean values for EPSPs (C), mEPSPs (D), and quantal content (E) recorded from CM9 NMJs in flies from indicated treatment groups. Error bars = s.e.m. *p<0.05 versus 1X +cmx condition determined using ANOVA.
Figure 3
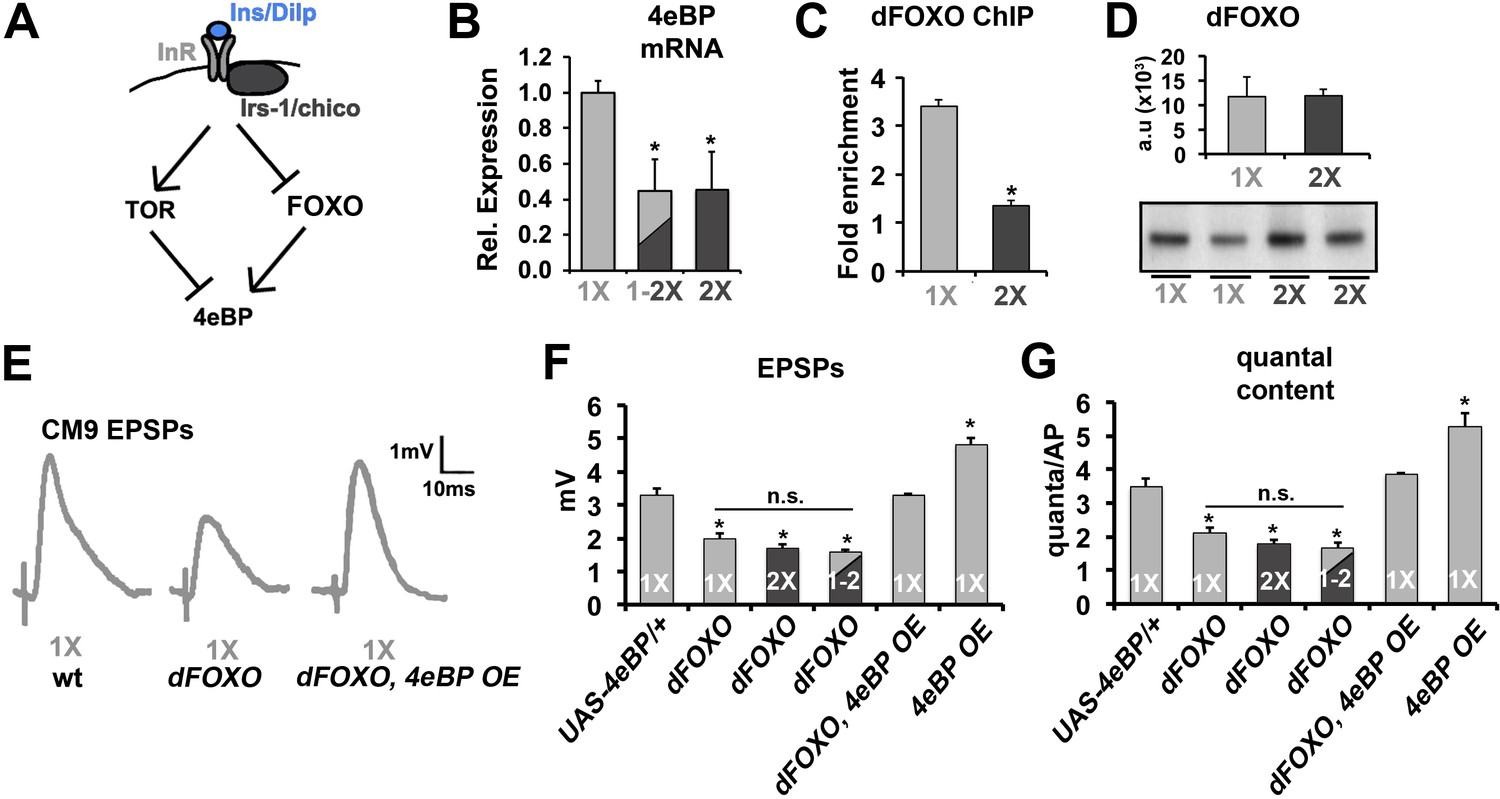
Effects of diet on the release of neurotransmitter requires FOXO.
(A) Diagram depicts the regulation of 4eBP by either FOXO-dependent transcription or dTOR-dependent phosphorylation. (B) Relative mRNA expression levels of 4eBP in purified motor neurons from 21-day-old animals raised on the indicated diet conditions. (C) Graphs represent the average relative fold enrichment of 4eBP DNA in anti-dFOXO chromatin immunoprecipitations (ChIPs) from thoracic ganglions isolated from animals raised on 1X or 2X diets. (D) Graphs represent average dFOXO protein levels estimated from flies used for ChIP. Values were normalized to actin. Error bars = s.e.m. Immunoblot of dFOXO is shown below. (E) Representative CM9 EPSP traces from 14-day-old flies raised on 1X diet of the indicated genotypes. In these genotypes, the overexpression of 4eBP is restricted to the CM9 MN using the E49-Gal4 driver. (F and G) Graphs represent the mean value for EPSPs (F) and quantal content (G) for indicated genotypes raised for 14 days on indicated diets. Error bars = s.e.m. *p<0.05 versus 1X wild-type controls determined using ANOVA.
Figure 4
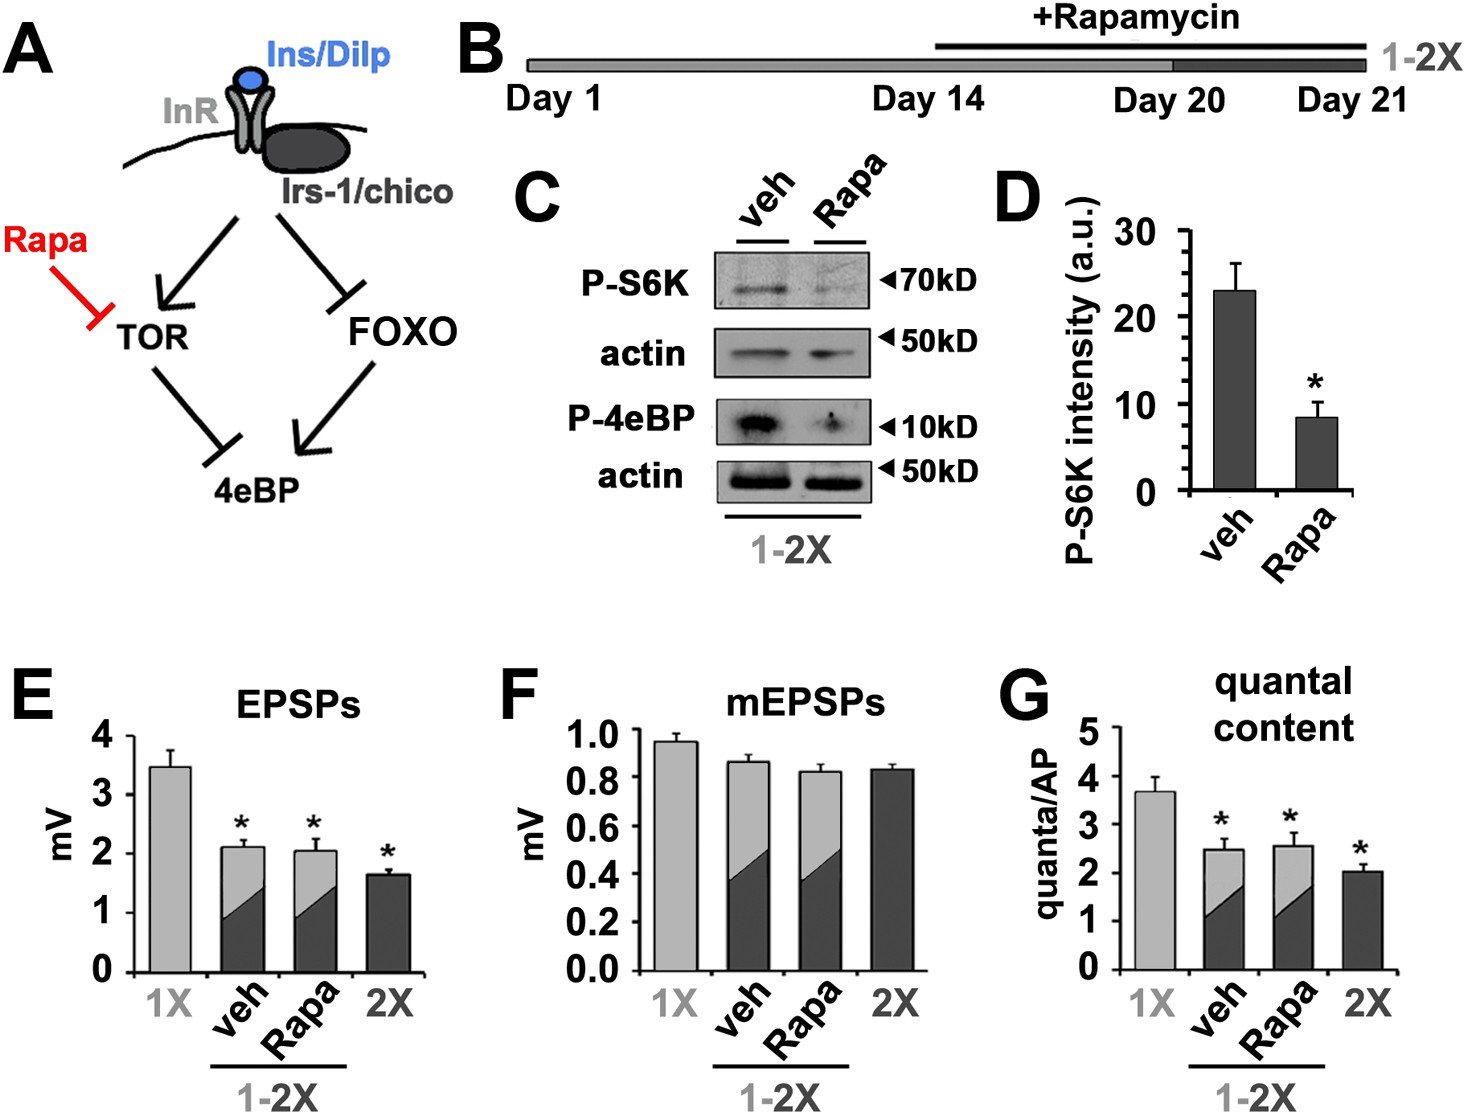
Effects of diet on the release of neurotransmitter is independent of dTOR.
(A) Diagram depicts the regulation of 4eBP by either FOXO-dependent transcription or dTOR-dependent phosphorylation indicating the effects of rapamycin. (B) To investigate the effect of rapamycin (Rapa) on diet-regulated SV exocytosis, animals were fed for 14 days on 1X food and then switched to a 1X food supplemented with either 200 µM rapamycin or vehicle for 6 more days. On day 20, animals were switched from a 1X to a 2X diet supplemented with rapamycin or vehicle for 24 hr prior to electrophysiological analyses. (C) Immunoblots of phosphorylated S6 kinase (P-S6K) or 4eBP (P-4eBP) from animals subjected to above rapamycin treatment demonstrating effective inhibition of dTOR kinase activity under these dietary conditions. Actin signals serves as protein loading control. (D) Quantification of intensity of P-S6K determined from immunoblots and normalized for loading. *p<0.05 determined using Student’s T-test. (E–G) Graphs represent the mean values for EPSPs (E), mEPSP (F) and quantal content (G) recorded from CM9 NMJs of 21-day-old wild-type flies of indicated dietary condition. Error bars = s.e.m. *p<0.05 versus 1X controls determined using ANOVA.
Figure 5
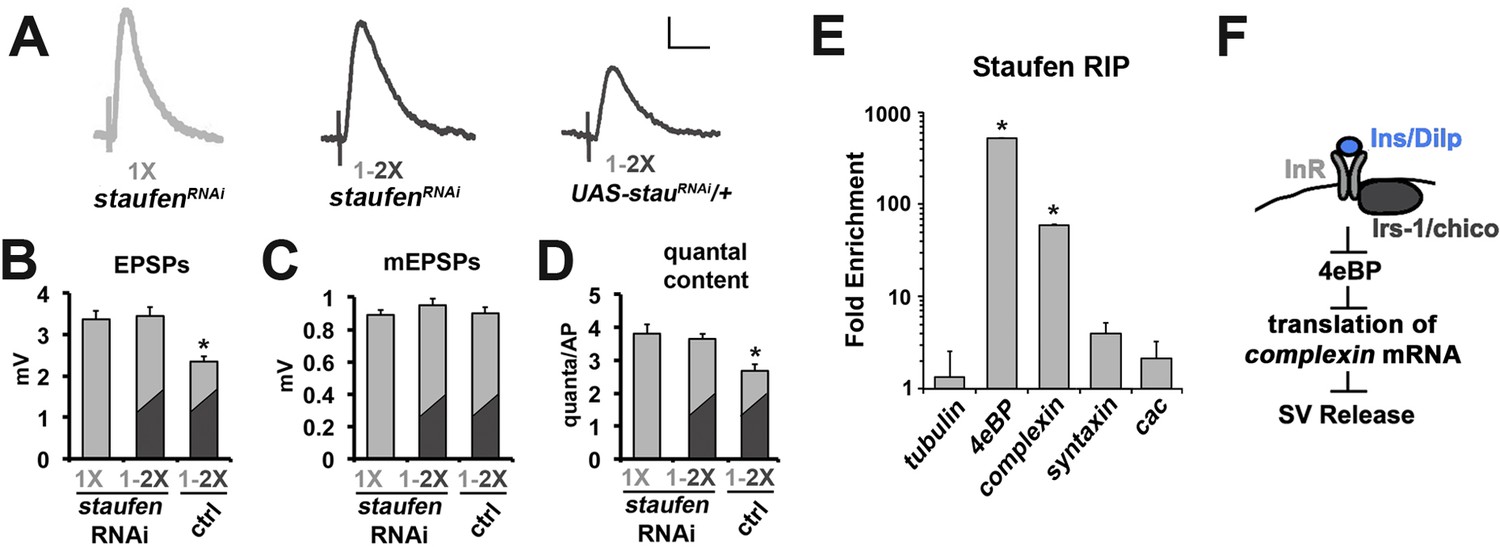
The role of Staufen during the regulation of neurotransmission by diet.
(A) Representative traces of EPSPs from CM9 NMJs from 21 day old staufenRNAi raised on a 1X diet or staufenRNAi and control flies subjected to a diet switch from 1X to 2X diet on day 20 and recorded on day 21. Scale bar = 1 mv, 10 ms. (B–D) Graphs represent the mean values for EPSPs (B), mEPSPs (C), and quantal content (D) recorded from indicated genotypes. *p<0.05 determined using ANOVA. (E) Graphs represent the fold enrichment of Staufen-bound mRNAs immunoprecipitated from FACS sorted motor neurons. *p<0.01 versus tubulin control determined using ANOVA. (F) Diagram depicts the putative regulation of complexin mRNA translation in response to insulin signaling in the CM9 motor neuron.
Figure 6 with 1 supplement
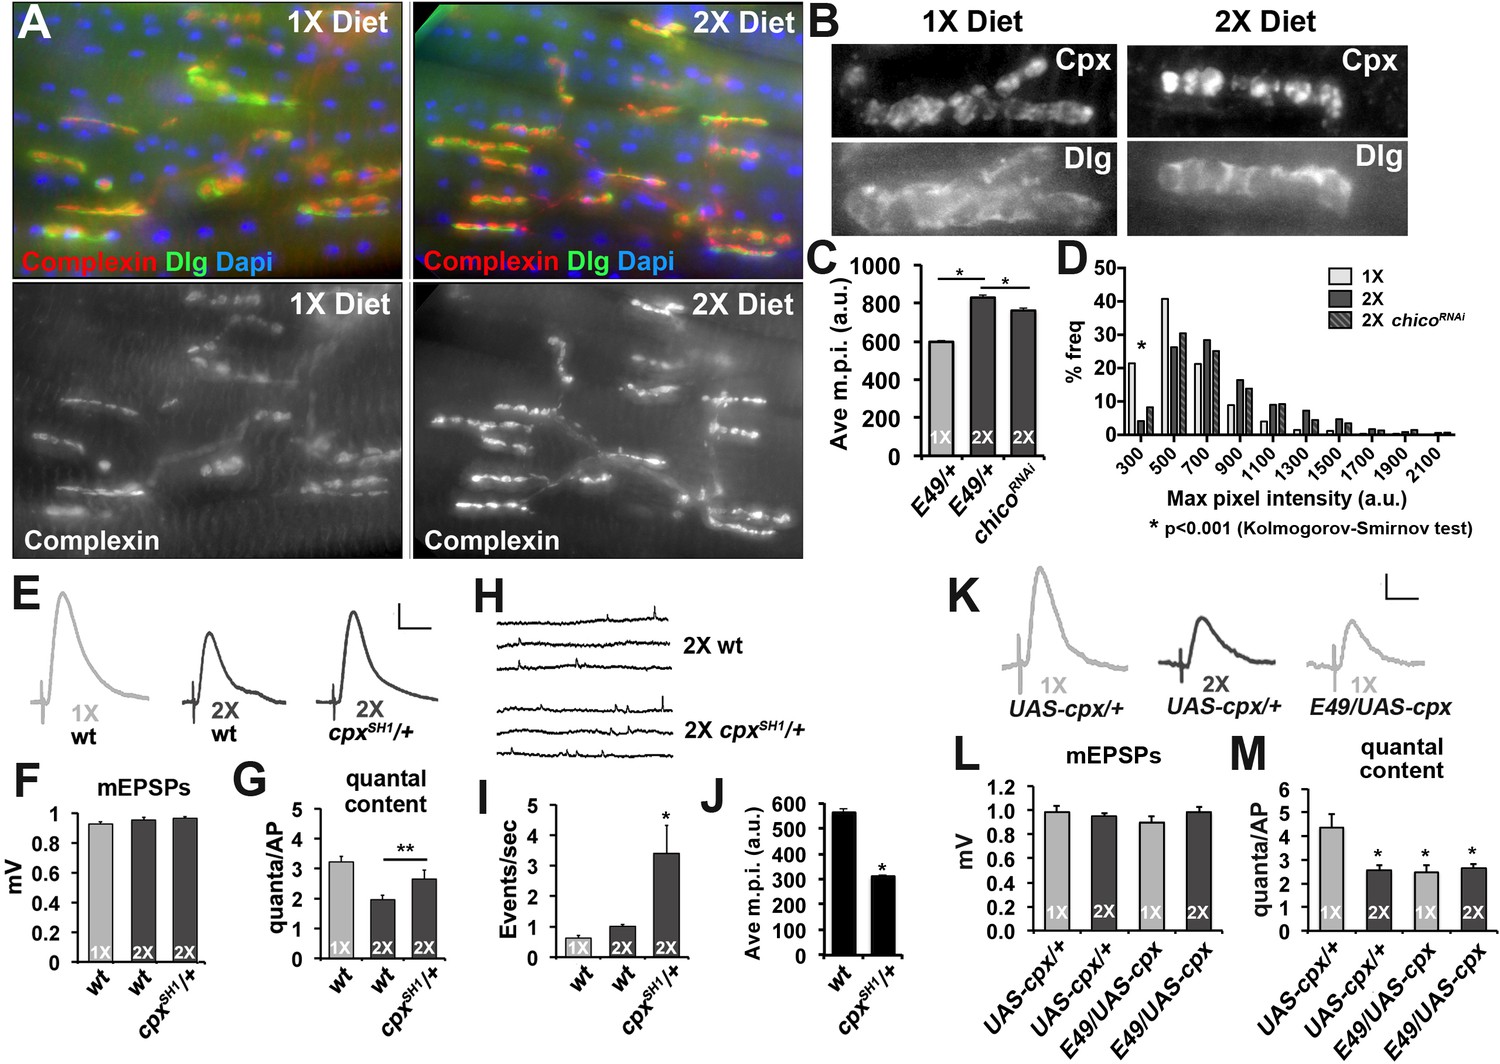
Complexin levels regulate SV release in response to diet.
(A) Immunofluorescent images of CM9 NMJs from animals raised on a 1X (left panels) or 2X (right panels) diet co-stained for Complexin (red-upper panels and lower panels), Discs-large (Dlg, green upper panels) and Dapi (blue-upper panels). (B) High magnification of Complexin (Cpx-upper panels) and Discs-large (Dlg-lower panels) from CM9 NMJ boutons in animals raised on a 1X (left panels) or 2X (right panels) diet conditions. Images for Cpx have been deconvolved. (C and D) Graphs represent the average value (C) and frequency histogram (D) for the maximum pixel intensity (m.p.i.) of synaptic Complexin from indicated diet conditions and genotype. *p<0.05 determined using ANOVA comparison of mean values (C) or using a Kolmogorov-Smirmov test (D). (E) Representative traces of EPSPs from CM9 NMJs from wild type (wt) or complexin heterozygotes (cpxSH1/+) raised for 21 days on the indicated diets. Scale bar = 1 mV, 10 ms. (F and G) Graphs represent the mean values for mEPSPs (F) and quantal content (G) from CM9 NMJs from 21-day-old animals of indicated genotypes raised on the indicated diet. *p<0.05 versus 1X condition determined using ANOVA. (H) Representative traces from wt and cpxSH1/+ animals raised on 2X diet for 21 days. Graphs below traces represent the quantification of the events per second from CM9 NMJs of the indicated genotypes raised on the indicated diets. *p<0.05 versus 1X control determined using ANOVA. (I) Representative traces of EPSPs from CM9 NMJs in 21-day-old animals on the indicated genotypes raised on the indicated diet. Scale bar = 1 mV, 10 ms. (J and K) Graphs represent the mean values for mEPSPs (J) and quantal content (K) from CM9 NMJs from 21-day-old animals of indicated genotypes raised on the indicated diets. *p<0.05 versus 1X control determined using ANOVA.
-
Figure 6—source data 1
File contains background-corrected values of max pixel intensity from complexin (Cpx) staining at the CM9 NMJ from indicated genotypes and diet conditions.
Included are data for quantification max pixel intensities for the Cpx staining presented in Figure 6C,D,J, and Figure 6—figure supplement 1. Data are presented in separate sheets as labeled. The results of statistical analyses (Student’s t-test, Kolmogorov-Smirnov test) are presented with each data set.
- https://doi.org/10.7554/eLife.16807.013
Figure 6—figure supplement 1

Diet effects on synaptic complexin levels at the lateral abdominal muscle NMJs.
(A) Diagram represents the area of the abdomen that is being analyzed (grey box). Image shows the NMJs on the lateral abdominal muscles (LAMs) used in these analyses. Staining for Dlg is shown and dashed line indicates the ventral mid line. (B) Non-deconvolved immunofluorescent images of LAM NMJs from animals raised on a 1X (left panels) or 2X (right panels) diet co-stained for Complexin (Cpx; upper panels), Discs-large (Dlg, middle panels). A merged image is shown in the bottom panels (Cpx = green channel; Dlg = red channel). Scale bar = 10 µm. (C and D) Graphs represent the average value (C) and frequency histogram (D) for the maximum pixel intensity (m.p.i.) of synaptic Complexin from indicated diet conditions. *p<0.05 determined using ANOVA comparison of mean values (C) or using a Kolmogorov-Smirmov test (D).
Tables
Table 1
Quantal analysis of neurotransmission at the CM9 NMJ.
| Genotype (condition) | Diet | N | mEPSP (mV) | EPSP (mV) | QC | RMP (mV) | IR (MΩ) |
|---|---|---|---|---|---|---|---|
| w1118 | 1X | 8 | 0.94 ± 0.04 | 3.46 ± 0.30 | 3.66 ± 0.28 | −40.89 ± 1.37 | 7.56 ± 0.80 |
| w1118 | 2X | 8 | 0.83 ± 0.04 | 1.65 ± 0.08 | 2.01 ± 0.12 | −39.67 ± 0.57 | 7.00 ± 0.80 |
| w1118 (12 hr shift) | 1-2X | 8 | 0.88 ± 0.02 | 2.74 ± 0.21 | 3.12 ± 0.24 | −38.40 ± 2.17 | 8.13 ± 1.01 |
| w1118 (24-hr shift) | 1-2X | 8 | 0.89 ± 0.03 | 2.25 ± 0.27 | 2.58 ± 0.27 | −35.65 ± 1.53 | 8.75 ± 0.62 |
| E49-Gal4/+ | 1X | 8 | 0.96 ± 0.03 | 3.40 ± 0.16 | 3.55 ± 0.16 | −35.53 ± 3.24 | 7.48 ± 0.55 |
| E49-Gal4/+ | 2X | 8 | 0.92 ± 0.02 | 2.06 ± 0.09 | 2.23 ± 0.07 | −32.24 ± 0.83 | 7.12 ± 0.58 |
| UAS-4eBPRNAi/+ | 1X | 8 | 0.94 ± 0.04 | 3.31 ± 0.33 | 3.50 ± 0.30 | −41.02 ± 1.40 | 7.88 ± 0.79 |
| UAS-4eBPRNAi/+ | 2X | 8 | 0.83 ± 0.02 | 1.62 ± 0.12 | 1.98 ± 0.17 | −39.67 ± 0.57 | 8.25 ± 0.82 |
| UAS-4eBPRNAi/+ | 1-2X | 8 | 0.93 ± 0.01 | 1.90 ± 0.05 | 2.05 ± 0.07 | −37.96 ± 0.54 | 8.25 ± 0.62 |
| E49-Gal4/+; UAS-4eBPRNAi/+ | 1X | 7 | 0.92 ± 0.02 | 1.50 ± 0.06 | 1.64 ± 0.07 | −38.88 ± 0.68 | 9.14 ± 0.77 |
| E49-Gal4/+; UAS-4eBPRNAi/+ | 2X | 8 | 0.91 ± 0.03 | 1.67 ± 0.13 | 1.86 ± 0.19 | −38.13 ± 0.50 | 8.00 ± 1.00 |
| E49-Gal4/+; UAS-4eBPRNAi/+ | 1-2X | 8 | 0.94 ± 0.02 | 1.79 ± 0.10 | 1.90 ± 0.11 | −38.68 ± 0.67 | 8.75 ± 0.62 |
| UAS-chicoRNAi/+ | 1X | 8 | 0.90 ± 0.04 | 3.56 ± 0.33 | 3.96 ± 0.30 | −37.31 ± 1.49 | 8.63 ± 0.30 |
| UAS-chicoRNAi/+ | 2X | 8 | 0.83 ± 0.02 | 1.74 ± 0.10 | 2.10 ± 0.15 | −39.45 ± 0.47 | 8.25 ± 0.73 |
| E49-Gal4/UAS-chicoRNAi | 1X | 8 | 0.92 ± 0.03 | 4.60 ± 0.30 | 5.09 ± 0.43 | −34.75 ± 1.07 | 8.31 ± 0.47 |
| E49-Gal4/UAS-chicoRNAi | 2X | 8 | 0.95 ± 0.05 | 4.09 ± 0.28 | 4.34 ± 0.24 | −38.52 ± 4.49 | 8.40 ± 0.77 |
| E49-Gal4/UAS-chicoRNAi | 1-2X | 8 | 0.91 ± 0.04 | 4.02 ± 0.23 | 4.48 ± 0.28 | −35.47 ± 2.82 | 8.75 ± 0.68 |
| E49-Gal4/UAS-chicoRNAi; UAS-4eBPRNAi/+ | 2X | 8 | 0.84 ± 0.05 | 2.18 ± 0.12 | 2.60 ± 0.13 | −39.51 ± 1.96 | 7.75 ± 0.85 |
| UAS-InRDN/+ | 2X | 8 | 0.86 ± 0.01 | 2.07 ± 0.17 | 2.42 ± 0.21 | −32.19 ± 1.55 | 8.06 ± 0.79 |
| E49-Gal4/UAS-InRDN | 2X | 8 | 0.85 ± 0.03 | 2.87 ± 0.15 | 3.43 ± 0.24 | −35.92 ± 2.20 | 8.69 ± 0.54 |
| w1118 | 1X | 8 | 0.92 ± 0.02 | 3.25 ± 0.25 | 3.53 ± 0.26 | −34.61 ± 1.77 | 7.88 ± 0.69 |
| w1118 | 2X | 8 | 0.84 ± 0.03 | 1.82 ± 0.10 | 2.18 ± 0.14 | −36.62 ± 1.14 | 8.50 ± 0.80 |
| w1118 (+CXM) | 1-2X | 8 | 0.99 ± 0.04 | 4.31 ± 0.20 | 4.39 ± 0.26 | −40.58 ± 1.84 | 7.88 ± 0.69 |
| w1118 (+Veh (CMX)) | 1-2X | 8 | 0.95 ± 0.02 | 2.50 ± 0.11 | 2.63 ± 0.11 | −40.01 ± 2.56 | 8.00 ± 0.68 |
| w1118 (+CXM) | 1X | 8 | 1.04 ± 0.03 | 4.23 ± 0.23 | 4.09 ± 0.25 | −39.09 ± 0.89 | 9.00 ± 0.82 |
| w1118 (+rapamycin) | 1-2X | 8 | 0.86 ± 0.03 | 2.11 ± 0.13 | 2.48 ± 0.22 | −41.29 ± 1.19 | 7.63 ± 0.78 |
| w1118 (+Veh (rapa)) | 1-2X | 8 | 0.82 ± 0.03 | 2.05 ± 0.20 | 2.54 ± 0.29 | −39.87 ± 1.84 | 6.88 ± 0.61 |
| w1118 | 1X | 8 | 0.89 ± 0.03 | 3.37 ± 0.20 | 3.81 ± 0.27 | −31.25 ± 1.47 | 8.25 ± 0.75 |
| w1118 | 2X | 5 | 0.95 ± 0.03 | 1.91 ± 0.16 | 2.00 ± 0.13 | −34.05 ± 1.48 | 7.80 ± 0.97 |
| dFOXOdel94/dFOXO21 | 1X | 8 | 0.94 ± 0.02 | 1.98 ± 0.13 | 2.10 ± 0.13 | −34.60 ± 1.35 | 8.44 ± 0.48 |
| dFOXOdel94/dFOXO21 | 2X | 8 | 0.96 ± 0.03 | 1.69 ± 0.09 | 1.77 ± 0.13 | −38.21 ± 1.52 | 7.75 ± 0.75 |
| dFOXOdel94/dFOXO21 | 1-2X | 8 | 0.94 ± 0.01 | 1.58 ± 0.04 | 1.68 ± 0.03 | −34.54 ± 2.06 | 8.69 ± 0.74 |
| dFOXOdel94 / dFOXO21 , UAS-4eBP | 1X | 8 | 0.94 ± 0.04 | 1.95 ± 0.23 | 2.06 ± 0.19 | −31.36 ± 2.83 | 7.38 ± 0.74 |
| E49-Gal4/+; dFOXOdel94 / dFOXO21 , UAS-4eBP | 1X | 8 | 0.88 ± 0.04 | 3.28 ± 0.22 | 3.85 ± 0.43 | −31.83 ± 2.65 | 6.88 ± 0.75 |
| UAS-4eBP/+ | 1X | 8 | 0.96 ± 0.04 | 3.30 ± 0.16 | 3.47 ± 0.16 | −33.08 ± 1.03 | 7.79 ± 0.38 |
| E49-Gal4/+;UAS-4eBP/+ | 1X | 8 | 0.92 ± 0.03 | 4.79 ± 0.38 | 5.25 ± 0.46 | −34.77 ± 2.12 | 8.08 ± 0.58 |
| E49-Gal4/UAS-stauenRNAi | 1X | 8 | 0.89 ± 0.03 | 3.37 ± 0.20 | 3.81 ± 0.27 | −36.32 ± 1.22 | 8.32 ± 0.66 |
| E49-Gal4/UAS-staufenRNAi | 1-2X | 8 | 0.95 ± 0.04 | 3.45 ± 0.21 | 3.65 ± 0.16 | −39.64 ± 2.42 | 7.55 ± 0.32 |
| +/UAS-staufenRNAi | 1-2X | 9 | 0.90 ± 0.04 | 2.35 ± 0.13 | 2.68 ± 0.20 | −35.51 ± 1.21 | 8.02 ± 0.73 |
| W1118 | 1X | 8 | 0.93 ± 0.02 | 3.21 ± 0.19 | 3.47 ± 0.22 | −30.56 ± 1.49 | 8.31 ± 0.09 |
| W1118 | 2X | 8 | 0.95 ± 0.02 | 1.96 ± 0.15 | 2.07 ± 0.17 | −30.43 ± 1.20 | 8.06 ± 0.67 |
| +/+,cpxSH1/+ | 1X | 8 | 0.91 ± 0.01 | 4.23 ± 0.48 | 4.66 ± 0.51 | −32.32 ± 1.40 | 7.88 ± 0.74 |
| +/+,cpxSH1/+ | 2X | 8 | 0.96 ± 0.01 | 2.65 ± 0.30 | 2.75 ± 0.32 | −31.26 ± 2.87 | 7.94 ± 0.83 |
| UAS-Complexin/+ | 1X | 9 | 0.99 ± 0.05 | 4.15 ± 0.46 | 4.37 ± 0.56 | −36.12 ± 1.65 | 6.67 ± 0.67 |
| UAS-Complexin/+ | 2X | 9 | 0.95 ± 0.02 | 2.39 ± 0.19 | 2.54 ± 0.24 | −31.27 ± 1.99 | 7.22 ± 0.80 |
| E49-Gal4/UAS-Complexin | 1X | 9 | 0.90 ± 0.05 | 2.22 ± 0.28 | 2.48 ± 0.28 | −30.59 ± 1.97 | 6.79 ± 0.73 |
| E49-Gal4/UAS-Complexin | 2X | 9 | 0.98 ± 0.05 | 2.58 ± 0.21 | 2.63 ± 0.18 | −34.86 ± 2.42 | 7.72 ± 0.52 |
-
Table contents ordered by order of appearance in body of text. All values represent the average value ± sem (N = animals, 1 recording per animal). For each recording, the EPSP value represents the average of 60 evoked responses and the value for mEPSP represents the average of 30 events. All stocks were backcrossed five generations and re-established in the w1118 background. Quantal content (QC) is determined for each NMJ by dividing the amplitude of the EPSP by the amplitude of the mEPSP for each recording. RMP = resting membrane potential of CM9 muscle fiber. IR = depolarizing input resistance of CM9 muscle fiber.
Download links
A two-part list of links to download the article, or parts of the article, in various formats.
Downloads (link to download the article as PDF)
Open citations (links to open the citations from this article in various online reference manager services)
Cite this article (links to download the citations from this article in formats compatible with various reference manager tools)
Insulin signaling controls neurotransmission via the 4eBP-dependent modification of the exocytotic machinery
eLife 5:e16807.
https://doi.org/10.7554/eLife.16807


