Enhanced exercise and regenerative capacity in a mouse model that violates size constraints of oxidative muscle fibres
- University of Reading, United Kingdom
- Hull York Medical School, United Kingdom
- Manchester Metropolitan University, United Kingdom
- Lithuanian Sports University, Lithuania
- University Medical Center Freiburg, Germany
- University of Freiburg, Germany
- University of Oslo, Norway
- Kristiania University College, Norway
- University of Padua, Italy
- Haartman Institute, University of Helsinki, Finland
- University of Health Science Center, Texas
- Albert-Ludwigs-University Freiburg, Texas
- FRIAS, Freiburg Institute for Advanced Studies and Center for Biological System Analysis ZBSA, Germany
Figures
Figure 1 with 1 supplement
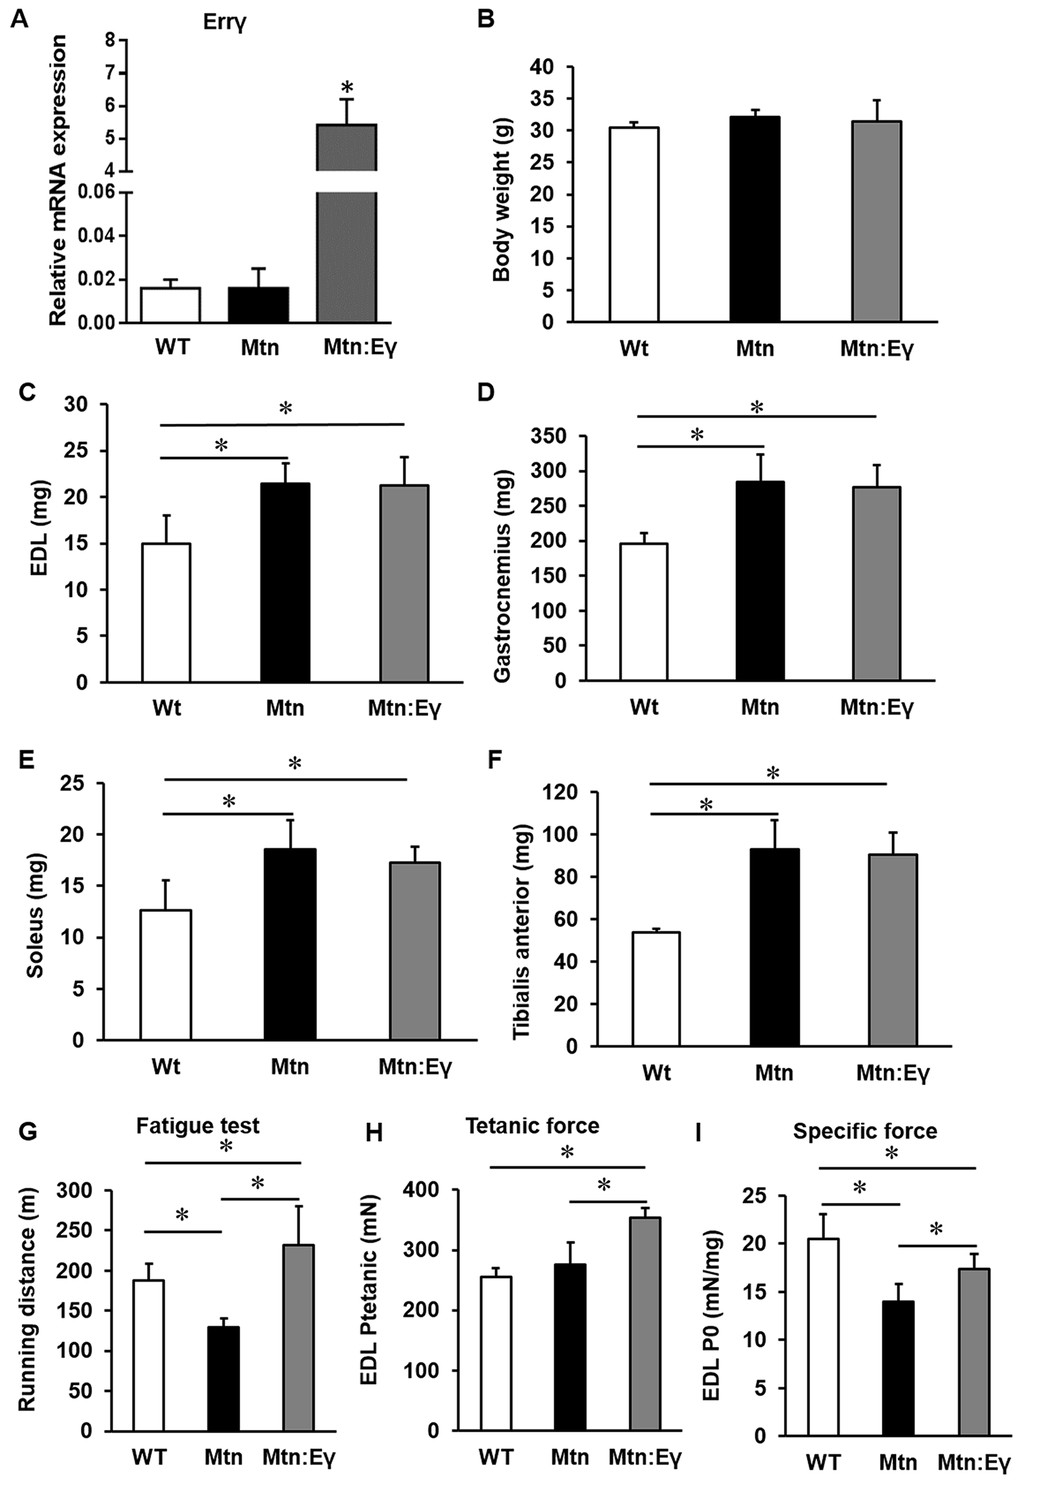
Concomitant skeletal muscle hypertrophy and tissue specific expression of ERRγ and resultant fatigue resistant characteristics.
(A) ERRγ mRNA levels. (B) Body and (C–F) skeletal muscle mass in wild type (Wt), myostatin null (Mtn) and ERRγ transgenic mice on the myostatin null background (Mtn:Eγ). (G) Exercise tolerance test on a mouse treadmill. (H–I) Contractile properties of the EDL muscle. Specific force denotes tetanic force normalized to wet muscle mass. N = 5 male twelve-week old mice per group; One-way ANOVA followed by Bonferroni's multiple comparison tests, *p<0.05.
Figure 1—figure supplement 1
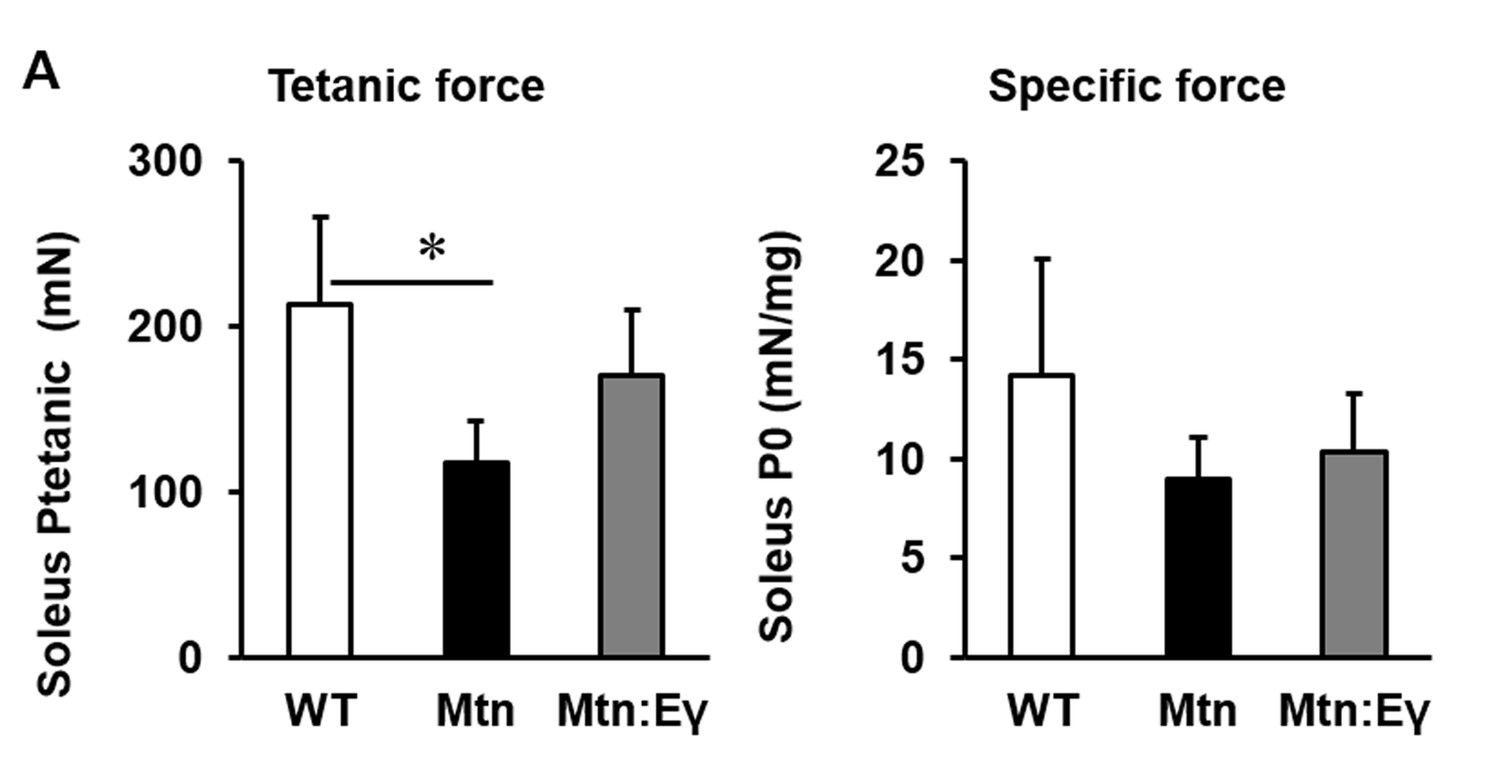
Contractile properties of the soleus.
(A) Contractile properties of the Soleus. N = 3 male twelve-week old mice per group; One-way ANOVA followed by Bonferroni's multiple comparison tests, *p<0.05
Figure 2 with 1 supplement
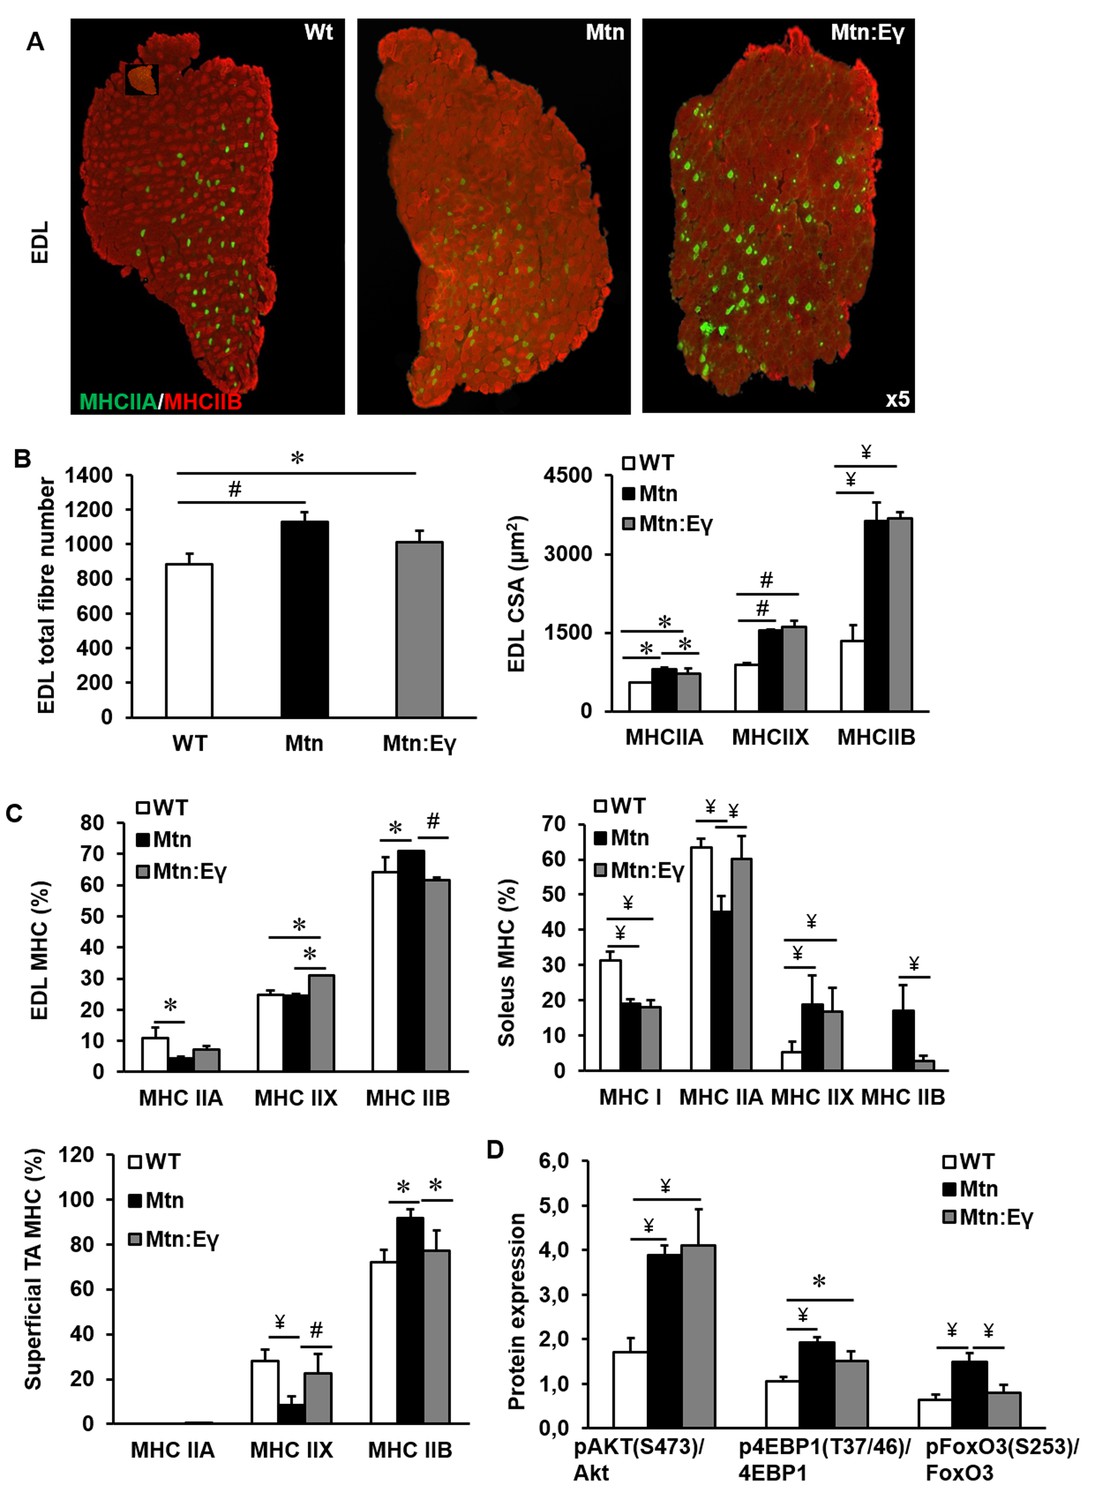
Musclespecific expression of ERRγ maintain the hyperplasia in the myostatin null background and normalizes myosin type II phenotype.
(A) Representative immunohistochemical images for MHC IIA and IIB staining in the EDL muscle. (B) EDL total fibre number and myofibre cross sectional area (CSA, μm2). (C) EDL, soleus and superficial TA muscle fibre type composition (D) Protein expression of key regulators that control anabolism (pAKT, p4EBP1) and catabolism (pFoxO3) in the gastrocnemius muscle. N = 5 male twelve-week old mice per group; One-way ANOVA followed by Bonferroni's multiple comparison tests, *p<0.05, #p<0.01, ¥p<0.001.
Figure 2—figure supplement 1
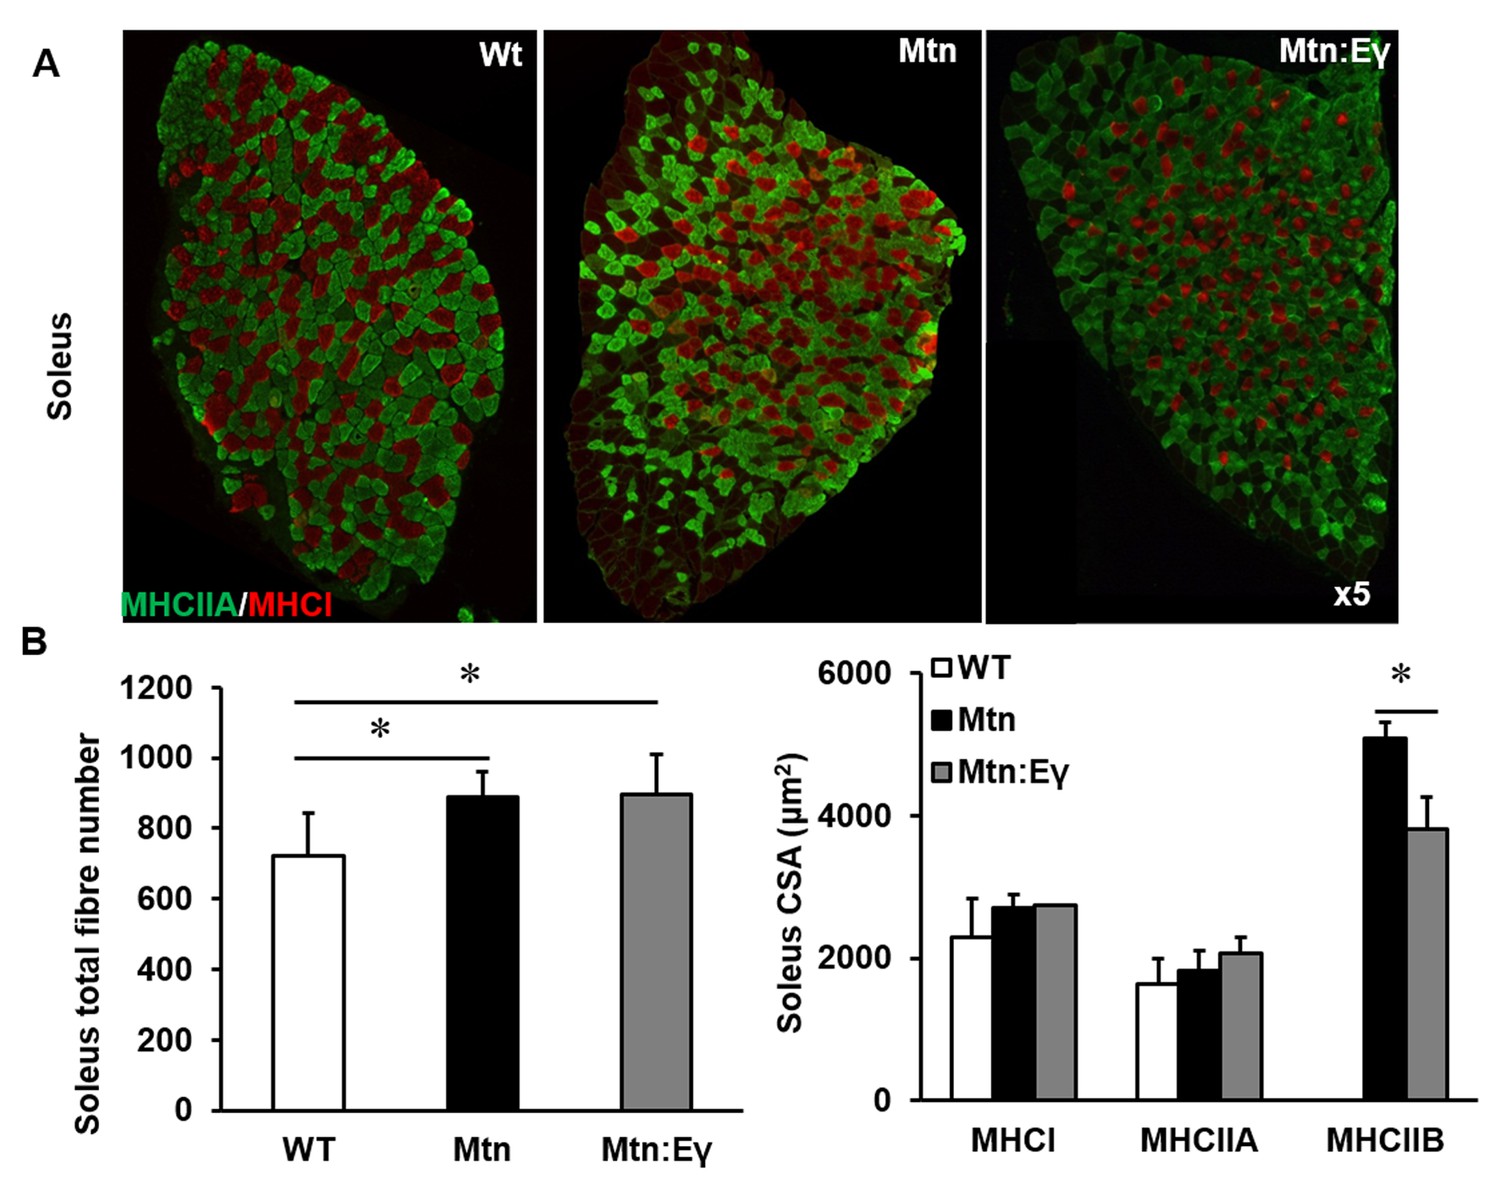
Reprogramming of the soleus myostatin null muscle by ERRγ.
(A) Representative immunohistochemical images for MHC I (red) and IIA (green) staining in the soleus muscle. (B) Soleus total fibre number and MHC myofibre cross sectional area (CSA, μm2). N = 5 male twelve-week old mice per group; One-way ANOVA followed by Bonferroni's multiple comparison tests, *p<0.05.
Figure 3 with 1 supplement

Musclespecific expression of ERRγ normalizes the metabolic and capillary profile of myostatin null mice.
(A) SDH staining and quantification of EDL and soleus muscles of Wt, Mtn and Mtn:Eγ mice. N = 5 male twelve-week old mice per group; One-way ANOVA followed by Bonferroni's multiple comparison tests, *p<0.05, #p<0.01, ¥p<0.001. (B) Muscle capillary density as determined by CD31 staining. (C) Pair-wise comparisons of the metabolic profiles obtained from the gastrocnemius muscle from WT, Mtn and Mtn:Eγ mice. Principal components analysis (PCA) scores plots comparing WT, Mtn and Mtn:Eγ; WT and Mtn:Eγ; as well as Mtn and Mtn:Eγ); (% variance in the parenthesis). Colour loadings plots shown for PC1 of the model comparing Mtn and Mtn:Eγ. Product of PC loadings with standard deviation of the entire data set coloured by the square of the PC loading.
Figure 3—figure supplement 1

Reprogramming of the tibialis anterior muscle of myostatin null mice by ERRγ.
(A) Representative immunohistochemical images for MHC IIB (red) and IIA (green) staining in deep and superficial regions of the TA muscle. (B) SDH staining of the deep TA muscle. (C) MHC myofibre and SDH profiling of the deep TA muscle. (D) PAS staining and quantification of the deep TA muscle. N = 4/5 male twelve-week old mice per group; One-way ANOVA followed by Bonferroni's multiple comparison tests, *p<0.05.
Figure 4
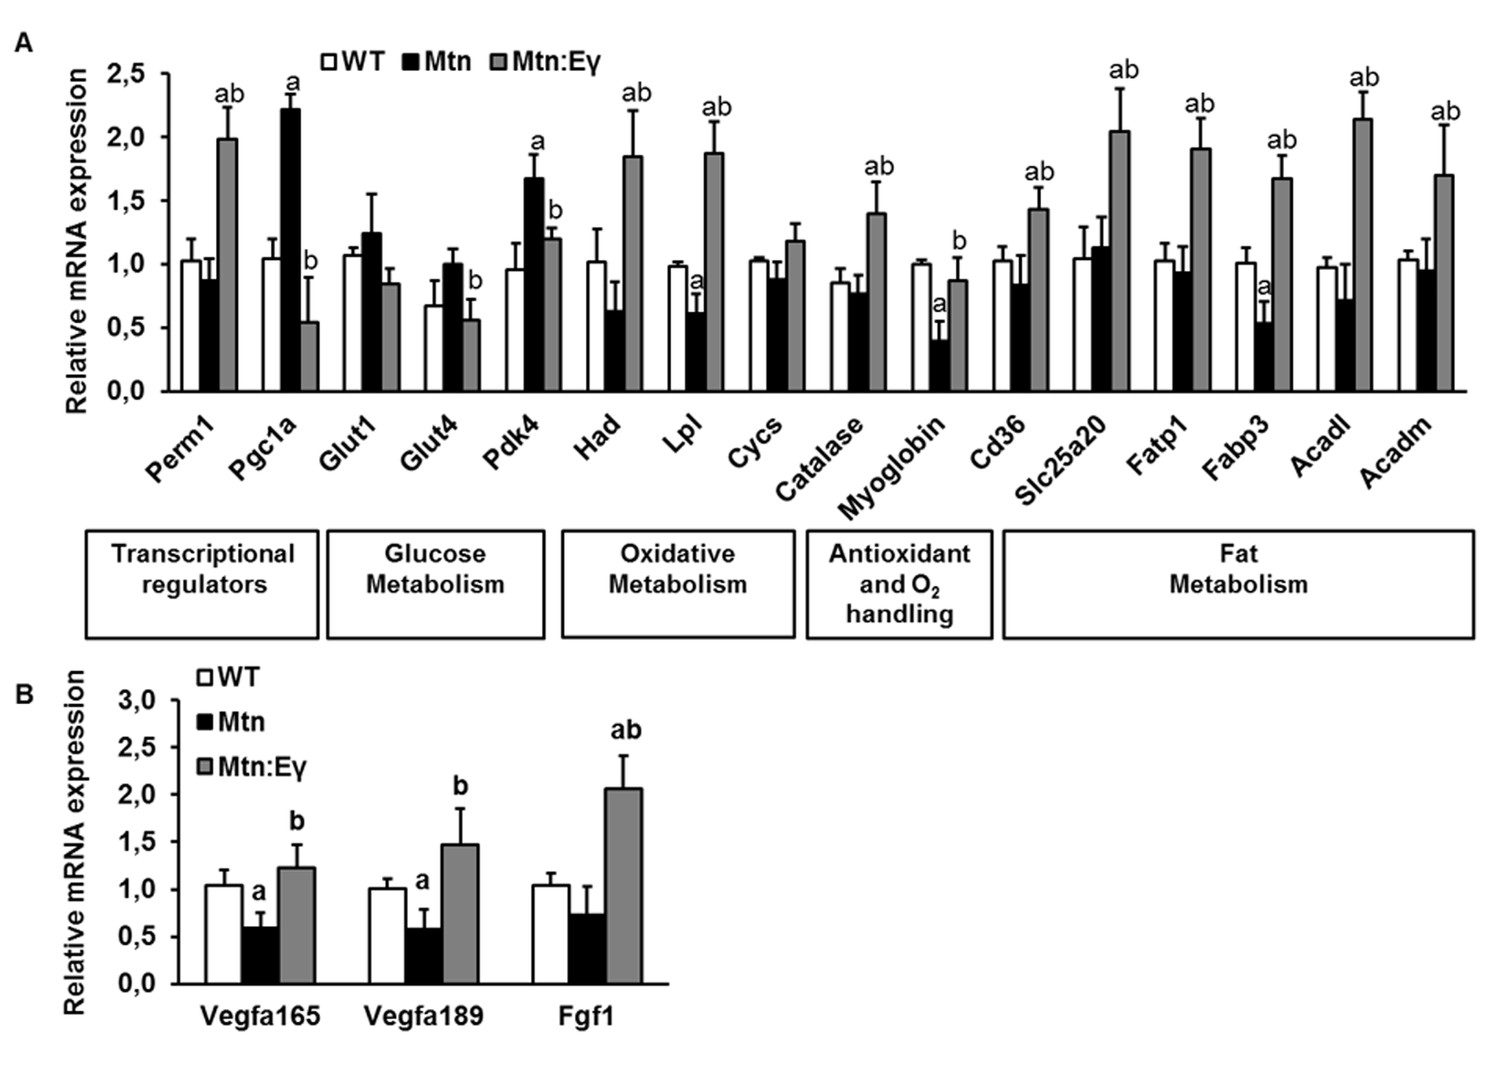
Molecular reprogramming of myostatin null muscle by ERRγ and its ability to promote capillary formation by the expression of angiogenic factors.
(A) Gene expression levels of transcriptional regulators, glucose metabolism regulators, oxidative metabolism genes, antioxidant and oxygen handling genes and fat metabolism genes. (B) Angiogenic gene expression. ‘a’ denotes changed significantly from WT and ‘b’ denotes changes significantly from Mtn. N = 5 male twelve-week old mice per group; One-way ANOVA followed by Bonferroni's multiple comparison tests, p<0.05.
Figure 5

Musclespecific expression of ERRγ normalizes ultra-structural abnormalities myostatin null mice.
(A) Transmission electron microscopy images in longitudinal and transverse sections of WT, Mtn and Mtn:Eγ muscle, scale 0.5 μm. Note the large spaces (red arrow) disrupted Z-lines (red arrowhead) and non-uniform sarcomere width (yellow arrows). (B) Quantification of submembrane mitochondrial density. (C) Quantification of Intrafusal mitochondrial density. (D) Quantification of submembrane mitochondrial size. (E) Quantification of intrafusal mitochondrial size. N = 3 male twelve-week old mice per group; One-way ANOVA followed by Bonferroni's multiple comparison tests, *p<0.05.
Figure 6
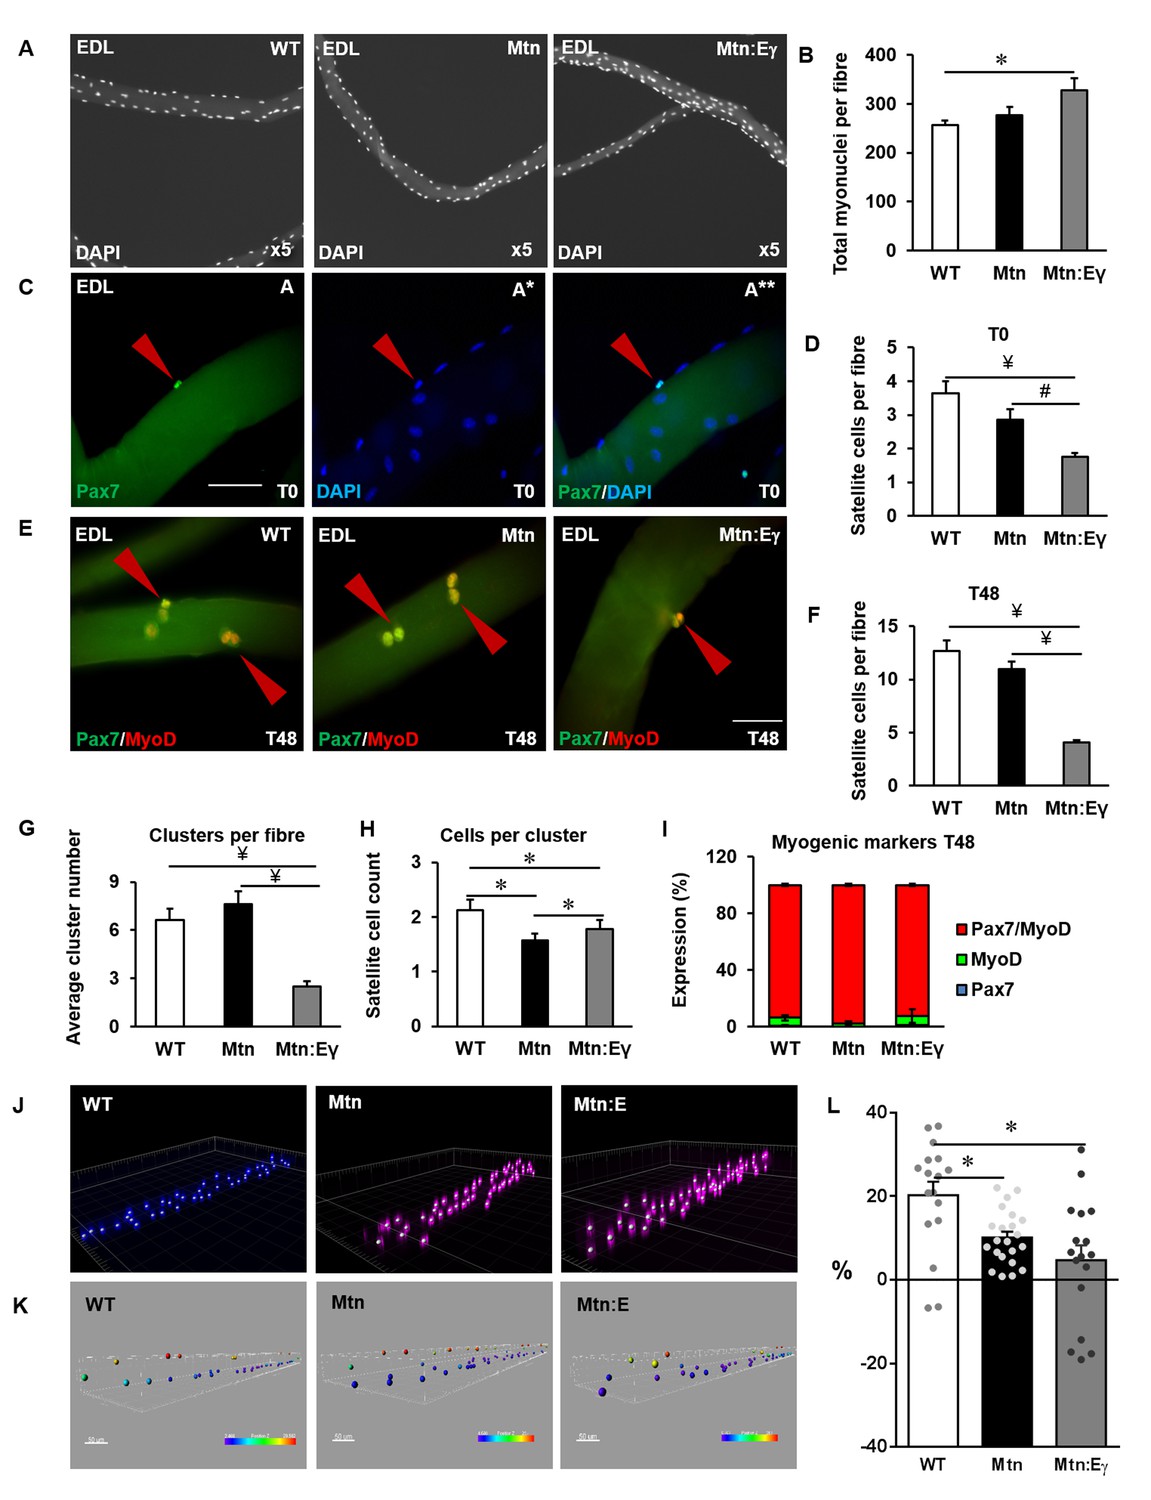
Oxidative muscle developed through ERRγ in the muscle of myostatin null mice shows depletion of satellite cells and increased myonuclie content.
(A) Single EDL muscle fibres stained with DAPI to visualize myonuclei. (B) Quantification of myonuclear number in EDL fibres. (C) Quiescent satellite cells stained for Pax7 on freshly isolated (T = 0 hr) muscle fibres from the EDL (arrowhead). (D) Quantification of satellite cell number on freshly isolated EDL fibres. (E) Single muscle fibres after 48 hr in cell culture stained for DAPI, Pax7 and MyoD (arrowhead). (F) Quantification of total number of cells on muscle fibre at 48 hr. (G) Quantification of satellite cell clusters at 48 hr. (H) Cluster size at 48 hr on muscle fibres. (I) Profiling of differentiation at 48 hr. (J) Confocal stacks of single fibres labelled with DAPI to study myonuclear organization. (K) Virtual reconstruction of single muscle fibres, colour encondes distance in the z-plane. (L) Improvement in myonuclear organization, where 0% denote a random distribution. Fibres were from 4 male twelve-week old mice per group; One-way ANOVA followed by Bonferroni's multiple comparison tests, *p<0.05, #p<0.01, ¥p<0.001.
Figure 7 with 1 supplement
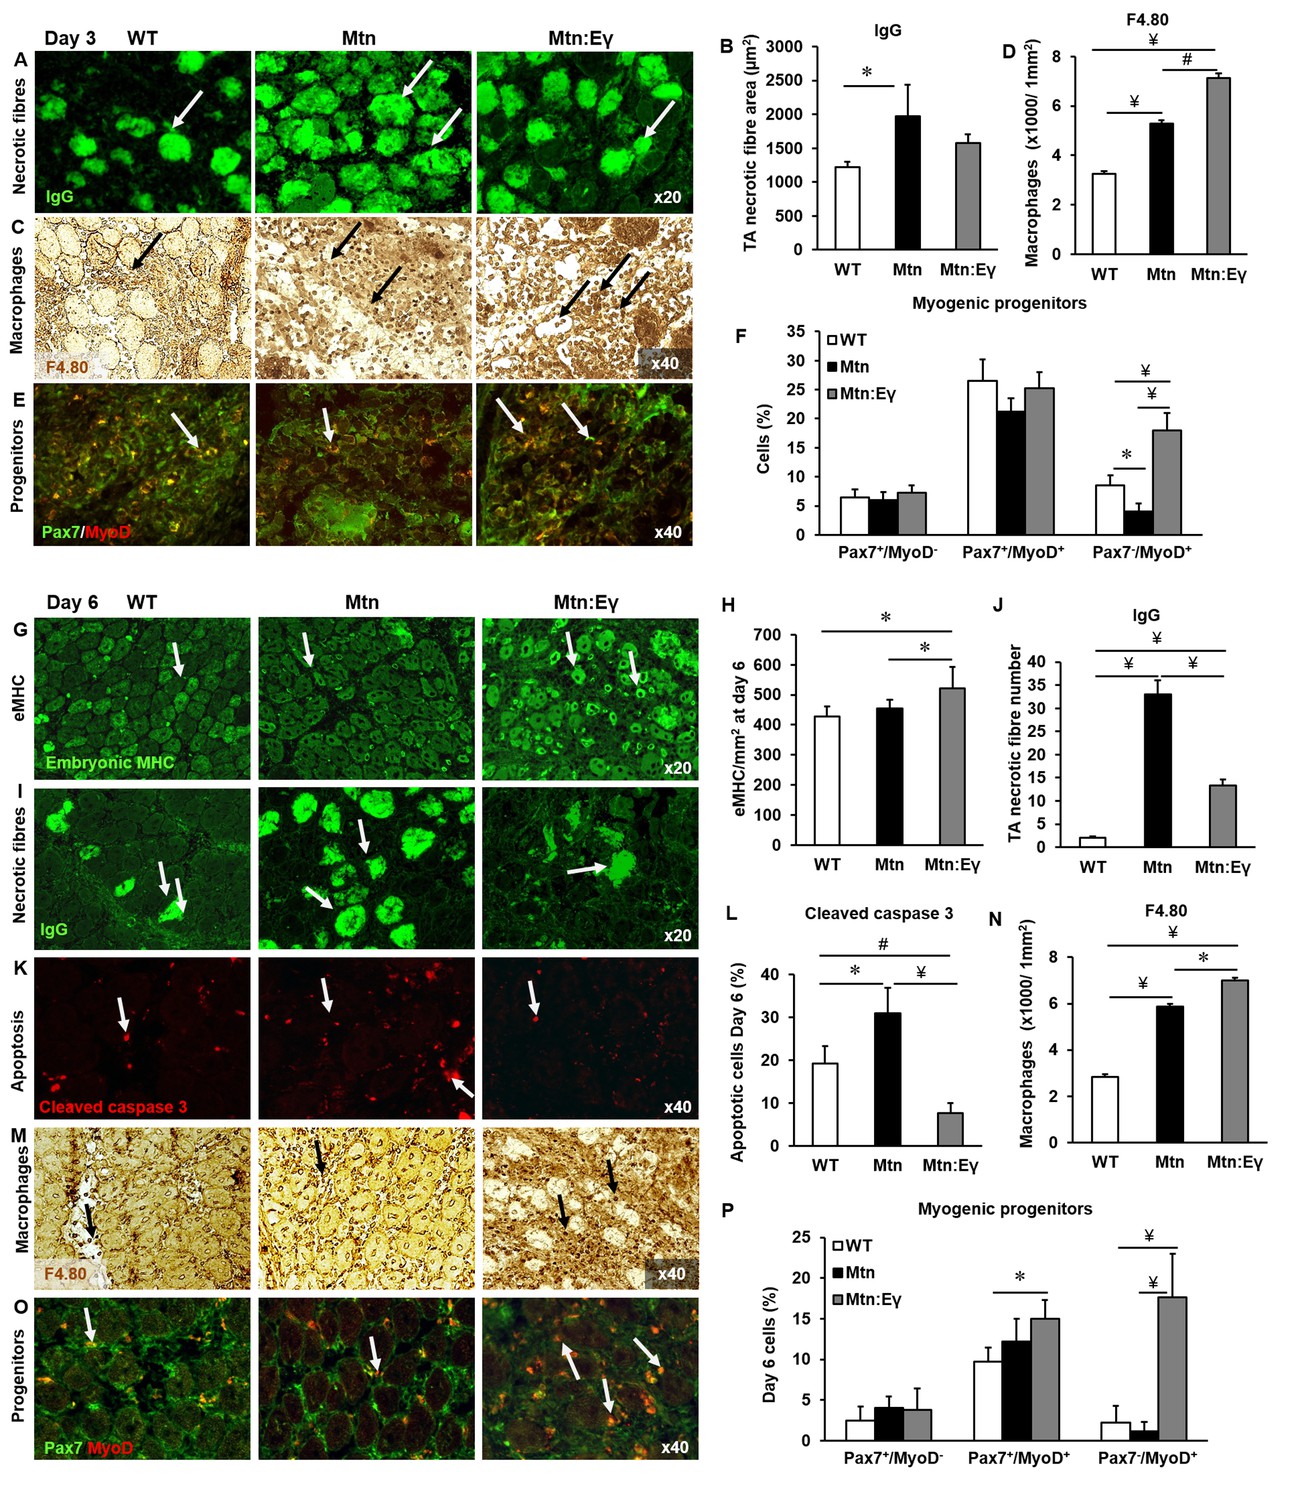
Skeletal muscle regeneration is accelerated by the expression of Errγ in myostatin null mice through enhanced macrophage and satellite cell activity.
Skeletal muscle regeneration in response to cardiotoxin injury. (A) Muscle necrotic fibres visualized by IgG staining at Day 3 (arrows). (B) Quantification of dying fibre size at Day 3. (C) Macrophage infiltration in the TA muscle using an F4.80 antibody at Day 3 (arrows). (D) Quantification of macrophage density in damaged muscle. (E) Myogenic progenitors at Day 3. Pax-7 detection in green, MyoD expressing cells in red (arrows). (F) Quantification of uncommitted muscle cells (Pax-7+/MyoD-), precursor (Pax-7+/MyoD+) and committed (Pax-7-/MyoD+) muscle cells at Day 3. (G) Expression of embryonic myosin heavy chain on Day 6 (arrows). (H) Quantification of regenerating muscle fibres at Day 6. (I) Necrotic fibres at Day 6 detected via infiltrated fibre IgG profiling (arrows). (J) Quantification of dying muscle fibres at Day 6. (K) Cleaved caspase 3 staining at Day 6 as a marker of apoptosis (arrows). (L) Quantification of apoptotic density at Day 6. (M) Macrophage infiltration in the TA on Day 6 (arrows). (N) Quantification of macrophage infiltration at Day 6. (O) Myogenic progenitors on Day 6. Pax-7 detection in green, MyoD expressing cells in red (arrows). (P) Quantification of uncommitted muscle cells (Pax-7+/MyoD-), precursor (Pax-7+/MyoD+) and committed (Pax-7-/MyoD+) muscle cells at Day 6. N = 4/5 male twelve-week old mice per group; One-way ANOVA followed by Bonferroni's multiple comparison tests, *p<0.05, #p<0.01, ¥p<0.001.
Figure 7—figure supplement 1
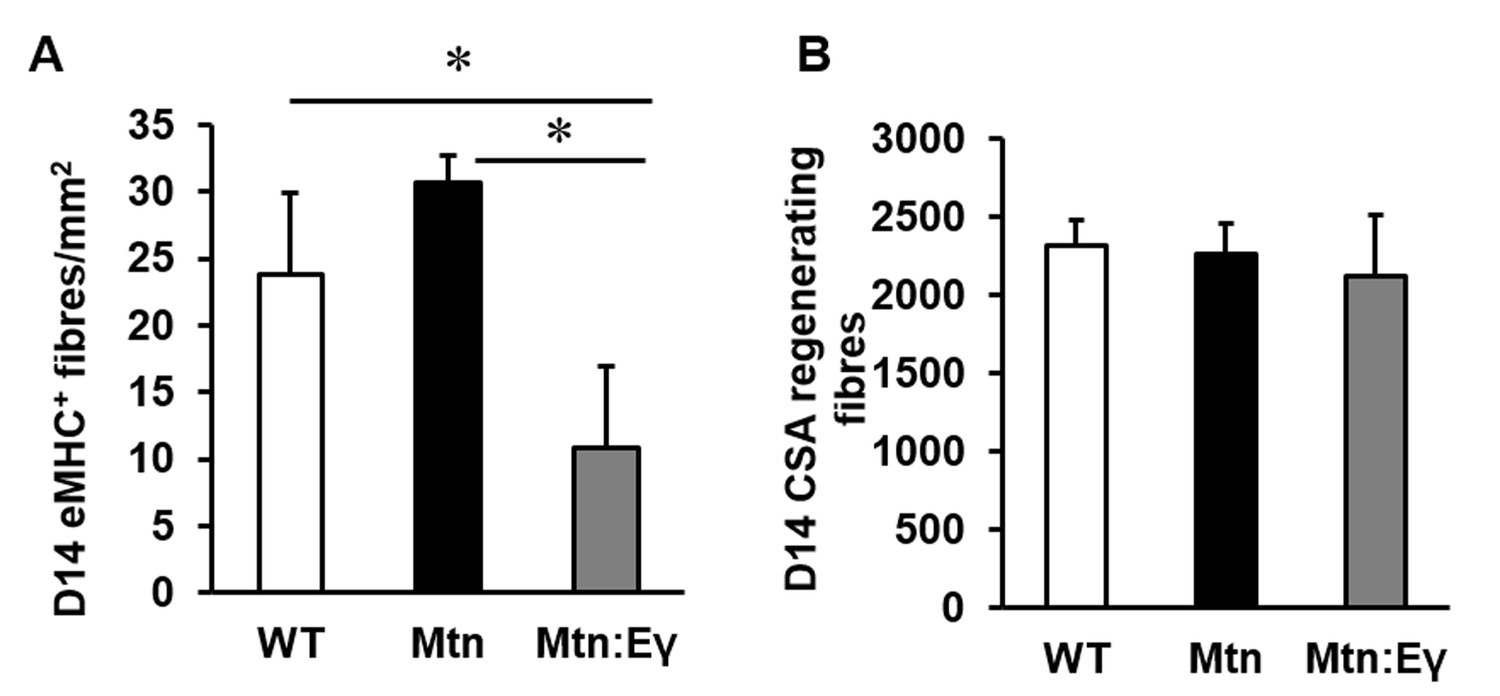
Characterisation of regenerating tibialis anterior muscle at day 14.
(A) Abundance of eMHC fibres in CTX damaged TA after 14 days. (B) Cross sectional area of regenerating centrally locating nuclei containing fibres in damaged TA after 14 days. N = 3 male twelve-week old mice per group; One-way ANOVA followed by Bonferroni's multiple comparison tests, *p<0.05.
Figure 8 with 1 supplement
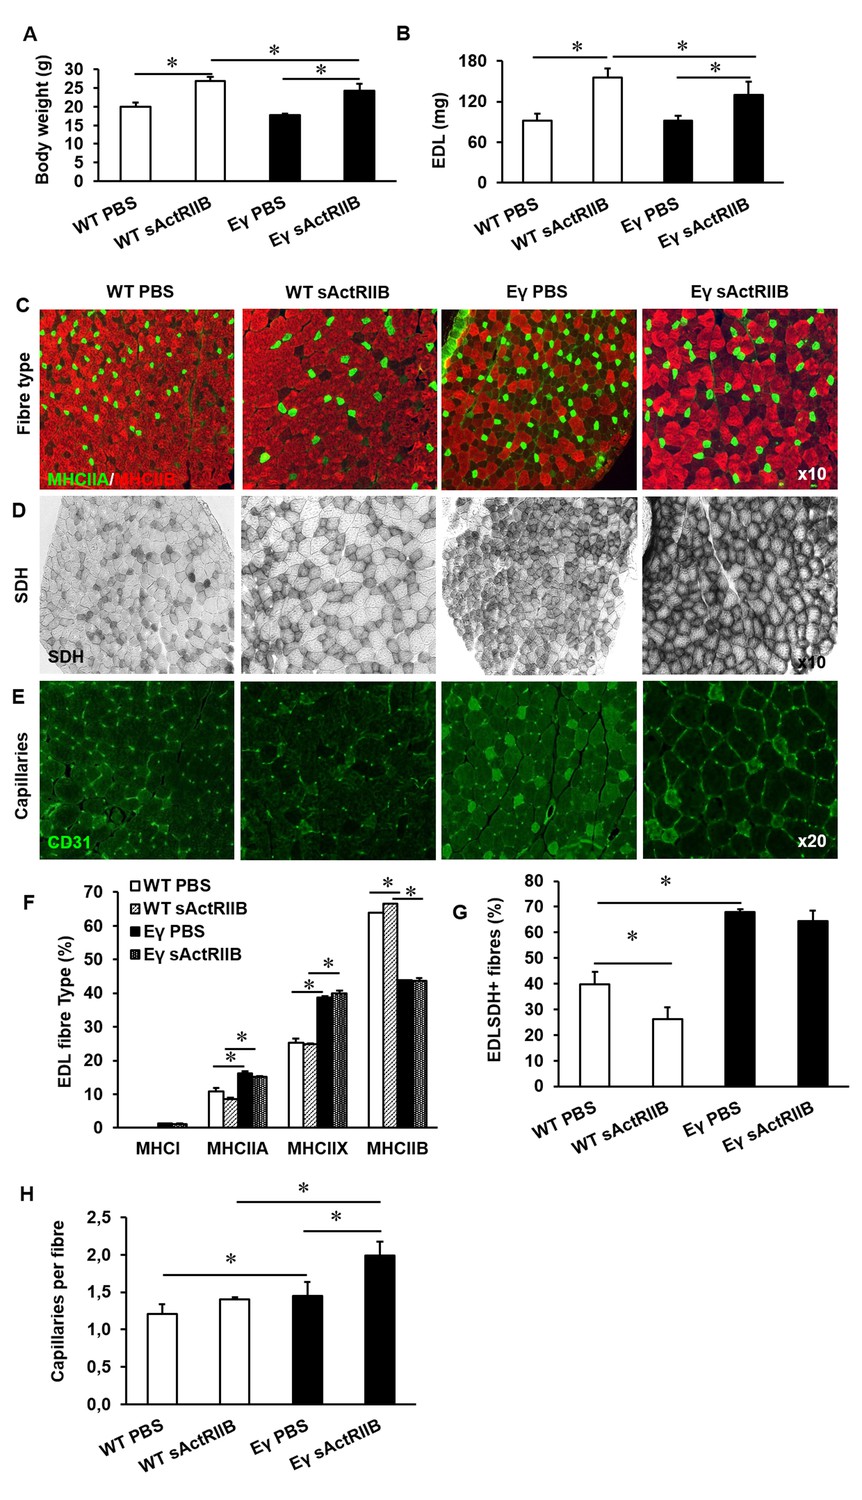
Post-natal inhibition of myostatin in the muscle-specific ERRγ mice leads to hypertrophic muscle with enhanced oxidative and vascular features.
(A) Body mass in 12-week-old mice after an 8 week treatment regime. (B) EDL muscle mass after sACtRIIB treatment. (C) Muscle fibre type profiling with MHCIIA (green) and MHCIIB (red) antibodies. (D) Oxidative enzyme profiling using SDH histochemistry. (E) Muscle capillary density profiling with CD31 antibody. Quantification of (F) MHC EDL fibre type, (G) SDH positive fibres, (H) capillary density. Intrafibre staining in the Errγ muscle in (D) is artefact and was ignored in all quantification procedures; One-way ANOVA followed by Bonferroni's multiple comparison tests, *p<0.05.
Figure 8—figure supplement 1
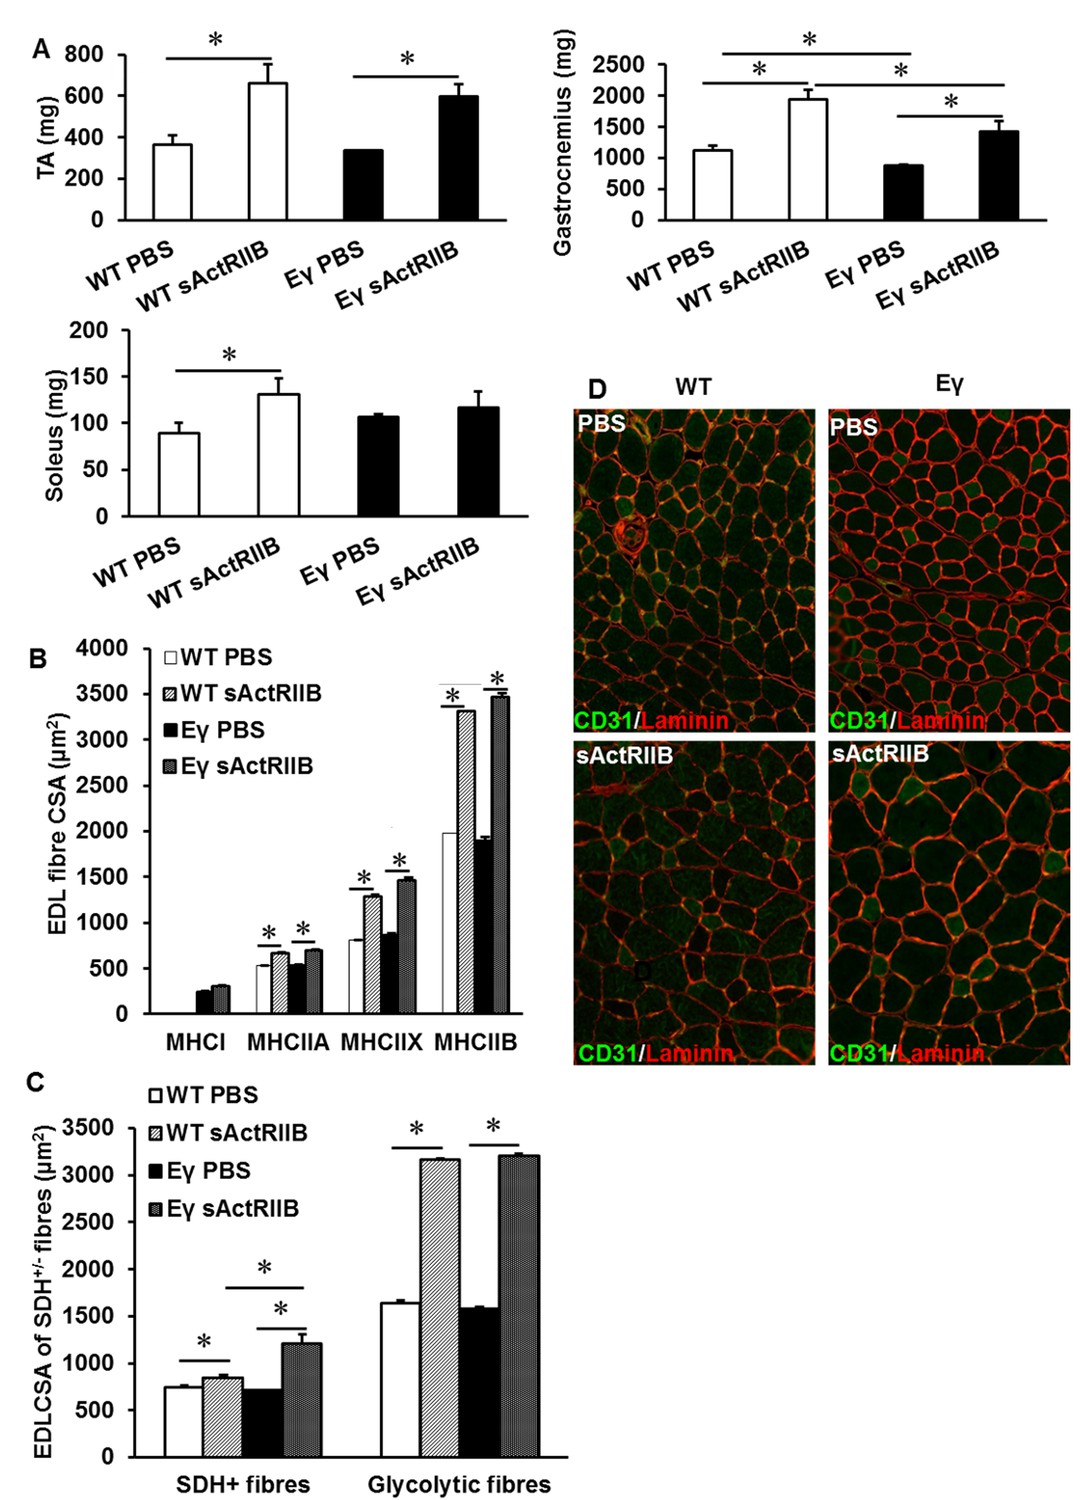
Muscle characterisation after post-natal inhibition of myostatin in the muscle specific ERRγ mice.
(A) Quantification of muscle mass in the Tibialis anterior (TA), gastrocnemius and soleus muscle. (B) Profiling of EDL CSA based on MHC isoforms in WT and Errγ after sActRIIB treatment. Note the hypertrophy in all fibres. (C) Profiling of EDL CSA based on SDH levels in WT and Errγ after sActRIIB treatment. (D) Capillary profile in the EDL muscle after sActRIIB treatment CD31 in green, laminin in red. N = 4/5 male twelve-week old mice per group; One-way ANOVA followed by Bonferroni's multiple comparison tests, *p<0.05.
Additional files
-
Supplementary file 1
List of primary and secondary antibodies and qPCR primer sequences.
- https://doi.org/10.7554/eLife.16940.015
Download links
A two-part list of links to download the article, or parts of the article, in various formats.
Downloads (link to download the article as PDF)
Open citations (links to open the citations from this article in various online reference manager services)
Cite this article (links to download the citations from this article in formats compatible with various reference manager tools)
Enhanced exercise and regenerative capacity in a mouse model that violates size constraints of oxidative muscle fibres
eLife 5:e16940.
https://doi.org/10.7554/eLife.16940


